
Developing 1,4-Diethyl-1,2,3,4-tetrahydroquinoxalin-substituted Fluorogens Based on GFP Chromophore for Endoplasmic Reticulum and Lysosome Staining

 , , , and
Abstract
1. Introduction
2. Results and Discussion
3. Materials and Methods
3.1. Synthesis
3.1.1. 1,4-Diethyl-1,2,3,4-tetrahydroquinoxaline
3.1.2. 1,4-Diethyl-1,2,3,4-tetrahydroquinoxaline-6-carbaldehyde 1
3.1.3. (Z)-5-((1,4-Diethyl-1,2,3,4-tetrahydroquinoxalin-6-yl)methylene)-2,3-dimethyl-3,5-dihydro-4H-imidazol-4-one 2
3.1.4. Compounds 5a and 5b
3.1.5. Compounds 3, 4, and 9
3.1.6. Compounds 6a, 6c and 7a, 7b, 7c
3.1.7. (Z)-2-((1,4-Diethyl-1,2,3,4-tetrahydroquinoxalin-6-yl)methylene)imidazo[1,2-a]pyridin-3(2H)-One 8
3.2. UV-VIS Absorption and Emission Spectra
3.3. DNA Cloning
3.4. Cell Culture
3.5. Live Cell Widefield Imaging
3.6. Compound 2 Co-Localization Analysis
3.7. Compound 2 Photostability Study
3.8. Compounds 7a, 7b, and 7c Co-Localization Analysis
3.9. Compounds 7a, 7b, and 7c Photostability Study
3.10. Fluorescence Lifetime Measurements In Vitro
4. Conclusions
Supplementary Materials
Author Contributions
Funding
Institutional Review Board Statement
Informed Consent Statement
Data Availability Statement
Conflicts of Interest
References
- Sahoo, H. Fluorescent Labeling Techniques in Biomolecules: A Flashback. RSC Adv. 2012, 2, 7017–7029. [Google Scholar] [CrossRef]
- Gonçalves, M.S.T. Fluorescent Labeling of Biomolecules with Organic Probes. Chem. Rev. 2009, 109, 190–212. [Google Scholar] [CrossRef] [PubMed]
- Toseland, C.P. Fluorescent Labeling and Modification of Proteins. J. Chem. Biol. 2013, 6, 85–95. [Google Scholar] [CrossRef] [PubMed]
- Renz, M. Fluorescence Microscopy-a Historical and Technical Perspective. Cytom. Part A 2013, 83, 767–779. [Google Scholar] [CrossRef]
- Klymchenko, A.S. Solvatochromic and Fluorogenic Dyes as Environment-Sensitive Probes: Design and Biological Applications. Acc. Chem. Res. 2017, 50, 366–375. [Google Scholar] [CrossRef]
- Bouhedda, F.; Autour, A.; Ryckelynck, M. Light-Up RNA Aptamers and Their Cognate Fluorogens: From Their Development to Their Applications. Int. J. Mol. Sci. 2017, 19, 44. [Google Scholar] [CrossRef]
- Zhou, H.; Zhang, S. Recent Development of Fluorescent Light-Up RNA Aptamers. Crit. Rev. Anal. Chem. 2022, 52, 1644–1661. [Google Scholar] [CrossRef]
- Paige, J.S.; Wu, K.Y.; Jaffrey, S.R. RNA Mimics of Green Fluorescent Protein. Science 2011, 333, 642–646. [Google Scholar] [CrossRef]
- Peng, Y.; Ai, X.; Yuan, Y.; Dong, J.; Cui, X.; Du, F.; Huang, X.; Tang, Z. Organelle-Targeted Imaging Based on Fluorogen-Activating RNA Aptamers in Living Cells. Anal. Chim. Acta 2022, 1209, 339816. [Google Scholar] [CrossRef]
- Gallo, E. Fluorogen-Activating Proteins: Next-Generation Fluorescence Probes for Biological Research. Bioconjug. Chem. 2020, 31, 16–27. [Google Scholar] [CrossRef]
- Plamont, M.-A.; Billon-Denis, E.; Maurin, S.; Gauron, C.; Pimenta, F.M.; Specht, C.G.; Shi, J.; Quérard, J.; Pan, B.; Rossignol, J.; et al. Small Fluorescence-Activating and Absorption-Shifting Tag for Tunable Protein Imaging in Vivo. Proc. Natl. Acad. Sci. USA 2016, 113, 497–502. [Google Scholar] [CrossRef] [PubMed]
- Péresse, T.; Gautier, A. Next-Generation Fluorogen-Based Reporters and Biosensors for Advanced Bioimaging. Int. J. Mol. Sci. 2019, 20, 6142. [Google Scholar] [CrossRef] [PubMed]
- Perfilov, M.M.; Zaitseva, E.R.; Baleeva, N.S.; Kublitski, V.S.; Smirnov, A.Y.; Bogdanova, Y.A.; Krasnova, S.A.; Myasnyanko, I.N.; Mishin, A.S.; Baranov, M.S. Meta-CF3-Substituted Analogues of the GFP Chromophore with Remarkable Solvatochromism. Int. J. Mol. Sci. 2023, 24, 9923. [Google Scholar] [CrossRef]
- Perfilov, M.M.; Zaitseva, E.R.; Smirnov, A.Y.; Mikhaylov, A.A.; Baleeva, N.S.; Myasnyanko, I.N.; Mishin, A.S.; Baranov, M.S. Environment-Sensitive Fluorogens Based on a GFP Chromophore Structural Motif. Dye. Pigment. 2022, 198, 110033. [Google Scholar] [CrossRef]
- Ermakova, Y.G.; Bogdanova, Y.A.; Baleeva, N.S.; Zaitseva, S.O.; Guglya, E.B.; Smirnov, A.Y.; Zagudaylova, M.B.; Baranov, M.S. Pyridine Analogue of Fluorescent Protein Chromophore: Fluorogenic Dye Suitable for Mitochondria Staining. Dye. Pigment. 2019, 170, 107550. [Google Scholar] [CrossRef]
- Hu, F.; Liu, B. Organelle-Specific Bioprobes Based on Fluorogens with Aggregation-Induced Emission (AIE) Characteristics. Org. Biomol. Chem. 2016, 14, 9931–9944. [Google Scholar] [CrossRef]
- Choi, N.-E.; Lee, J.-Y.; Park, E.-C.; Lee, J.-H.; Lee, J. Recent Advances in Organelle-Targeted Fluorescent Probes. Molecules 2021, 26, 217. [Google Scholar] [CrossRef]
- Liu, X.; Xiang, M.-H.; Zhou, W.-J.; Wang, F.; Chu, X.; Jiang, J.-H. Clicking of Organelle-Enriched Probes for Fluorogenic Imaging of Autophagic and Endocytic Fluxes. Chem. Sci. 2021, 12, 5834–5842. [Google Scholar] [CrossRef]
- Smirnov, A.Y.; Perfilov, M.M.; Zaitseva, E.R.; Zagudaylova, M.B.; Zaitseva, S.O.; Mishin, A.S.; Baranov, M.S. Design of Red-Shifted and Environment-Sensitive Fluorogens Based on GFP Chromophore Core. Dye. Pigment. 2020, 177, 108258. [Google Scholar] [CrossRef]
- Baleeva, N.S.; Baranov, M.S. Synthesis and Properties of 5-Methylidene-3,5-Dihydro-4H-Imidazol-4-Ones (microreview). Chem. Heterocycl. Compd. 2016, 52, 444–446. [Google Scholar] [CrossRef]
- Filonov, G.S.; Moon, J.D.; Svensen, N.; Jaffrey, S.R. Broccoli: Rapid Selection of an RNA Mimic of Green Fluorescent Protein by Fluorescence-Based Selection and Directed Evolution. J. Am. Chem. Soc. 2014, 136, 16299–16308. [Google Scholar] [CrossRef] [PubMed]
- Baranov, M.S.; Lukyanov, K.A.; Borissova, A.O.; Shamir, J.; Kosenkov, D.; Slipchenko, L.V.; Tolbert, L.M.; Yampolsky, I.V.; Solntsev, K.M. Conformationally Locked Chromophores as Models of Excited-State Proton Transfer in Fluorescent Proteins. J. Am. Chem. Soc. 2012, 134, 6025–6032. [Google Scholar] [CrossRef]
- Chen, C.; Boulanger, S.A.; Sokolov, A.I.; Baranov, M.S.; Fang, C. A Novel Dialkylamino GFP Chromophore as an Environment-Polarity Sensor Reveals the Role of Twisted Intramolecular Charge Transfer. Chemosensors 2021, 9, 234. [Google Scholar] [CrossRef]
- Boulanger, S.A.; Chen, C.; Myasnyanko, I.N.; Sokolov, A.I.; Baranov, M.S.; Fang, C. Excited-State Dynamics of a Meta-Dimethylamino Locked GFP Chromophore as a Fluorescence Turn-on Water Sensor. Photochem. Photobiol. 2022, 98, 311–324. [Google Scholar] [CrossRef] [PubMed]
- Schwarz, D.S.; Blower, M.D. The Endoplasmic Reticulum: Structure, Function and Response to Cellular Signaling. Cell. Mol. Life Sci. 2016, 73, 79–94. [Google Scholar] [CrossRef] [PubMed]
- Fagone, P.; Jackowski, S. Membrane Phospholipid Synthesis and Endoplasmic Reticulum Function. J. Lipid Res. 2009, 50, S311–S316. [Google Scholar] [CrossRef]
- Reid, D.W.; Nicchitta, C.V. Diversity and Selectivity in mRNA Translation on the Endoplasmic Reticulum. Nat. Rev. Mol. Cell Biol. 2015, 16, 221–231. [Google Scholar] [CrossRef]
- Braakman, I.; Bulleid, N.J. Protein Folding and Modification in the Mammalian Endoplasmic Reticulum. Annu. Rev. Biochem. 2011, 80, 71–99. [Google Scholar] [CrossRef]
- Clapham, D.E. Calcium Signaling. Cell 2007, 131, 1047–1058. [Google Scholar] [CrossRef]
- Westrate, L.M.; Lee, J.E.; Prinz, W.A.; Voeltz, G.K. Form Follows Function: The Importance of Endoplasmic Reticulum Shape. Annu. Rev. Biochem. 2015, 84, 791–811. [Google Scholar] [CrossRef]
- McDonald, L.; Liu, B.; Taraboletti, A.; Whiddon, K.; Shriver, L.P.; Konopka, M.; Liu, Q.; Pang, Y. Fluorescent Flavonoids for Endoplasmic Reticulum Cell Imaging. J. Mater. Chem. B Mater. Biol. Med. 2016, 4, 7902–7908. [Google Scholar] [CrossRef] [PubMed]
- Hambrock, A.; Löffler-Walz, C.; Quast, U. Glibenclamide Binding to Sulphonylurea Receptor Subtypes: Dependence on Adenine Nucleotides. Br. J. Pharmacol. 2002, 136, 995–1004. [Google Scholar] [CrossRef] [PubMed]
- de Duve, C. The Lysosome Turns Fifty. Nat. Cell Biol. 2005, 7, 847–849. [Google Scholar] [CrossRef] [PubMed]
- Bohley, P.; Seglen, P.O. Proteases and Proteolysis in the Lysosome. Experientia 1992, 48, 151–157. [Google Scholar] [CrossRef]
- Conner, S.D.; Schmid, S.L. Regulated Portals of Entry into the Cell. Nature 2003, 422, 37–44. [Google Scholar] [CrossRef]
- Perera, R.M.; Zoncu, R. The Lysosome as a Regulatory Hub. Annu. Rev. Cell Dev. Biol. 2016, 32, 223–253. [Google Scholar] [CrossRef]
- Sancak, Y.; Bar-Peled, L.; Zoncu, R.; Markhard, A.L.; Nada, S.; Sabatini, D.M. Ragulator-Rag Complex Targets mTORC1 to the Lysosomal Surface and Is Necessary for Its Activation by Amino Acids. Cell 2010, 141, 290–303. [Google Scholar] [CrossRef]
- Zoncu, R.; Efeyan, A.; Sabatini, D.M. mTOR: From Growth Signal Integration to Cancer, Diabetes and Ageing. Nat. Rev. Mol. Cell Biol. 2011, 12, 21–35. [Google Scholar] [CrossRef]
- Settembre, C.; Fraldi, A.; Medina, D.L.; Ballabio, A. Signals from the Lysosome: A Control Centre for Cellular Clearance and Energy Metabolism. Nat. Rev. Mol. Cell Biol. 2013, 14, 283–296. [Google Scholar] [CrossRef]
- Appelqvist, H.; Wäster, P.; Kågedal, K.; Öllinger, K. The Lysosome: From Waste Bag to Potential Therapeutic Target. J. Mol. Cell Biol. 2013, 5, 214–226. [Google Scholar] [CrossRef]
- Cox, T.M.; Cachón-González, M.B. The Cellular Pathology of Lysosomal Diseases. J. Pathol. 2012, 226, 241–254. [Google Scholar] [CrossRef] [PubMed]
- Bright, N.A.; Gratian, M.J.; Luzio, J.P. Endocytic Delivery to Lysosomes Mediated by Concurrent Fusion and Kissing Events in Living Cells. Curr. Biol. 2005, 15, 360–365. [Google Scholar] [CrossRef] [PubMed]
- Provenzano, P.P.; Eliceiri, K.W.; Keely, P.J. Multiphoton microscopy and fluorescence lifetime imaging microscopy (FLIM) to monitor metastasis and the tumor microenvironment. Clin. Exp. Metastasis 2009, 26, 357–370. [Google Scholar] [CrossRef] [PubMed]
- Ma, Y.; Lee, Y.; Best-Popescu, C.; Gao, L. High-speed compressed-sensing fluorescence lifetime imaging microscopy of live cells. Proc. Natl. Acad. Sci. USA 2021, 118, e2004176118. [Google Scholar] [CrossRef] [PubMed]
- Bower, A.J.; Li, J.; Chaney, E.J.; Marjanovic, M.; Spillman, D.R., Jr.; Boppart, S.A. High-speed imaging of transient metabolic dynamics using two-photon fluorescence lifetime imaging microscopy. Optica 2018, 5, 1290–1296. [Google Scholar] [CrossRef]
- Koda, K.; Keller, S.; Kojima, R.; Kamiya, M.; Urano, Y. Measuring the pH of Acidic Vesicles in Live Cells with an Optimized Fluorescence Lifetime Imaging Probe. Anal. Chem. 2022, 94, 11264–11271. [Google Scholar] [CrossRef]
- Lin, H.J.; Herman, P.; Lakowicz, J.R. Fluorescence lifetime-resolved pH imaging of living cells. Cytom. Part A 2003, 52, 77–89. [Google Scholar] [CrossRef]
- Zhang, Y.; Liu, Q.; Tian, T.; Xu, C.; Yang, P.; Ma, L.; Hou, Y.; Zhou, H.; Gan, Y. A buffering fluorogenic probe for real-time lysosomal pH monitoring. Sens. Actuators B Chem. 2024, 399, 134809. [Google Scholar] [CrossRef]
- Li, Z.; Wu, S.; Han, J.; Han, S. Imaging of intracellular acidic compartments with a sensitive rhodamine based fluorogenic pH sensor. Analyst 2011, 136, 3698–3706. [Google Scholar] [CrossRef]
- Zhou, Y.; Wang, Q.; Chanmungkalakul, S.; Wu, X.; Xiao, H.; Miao, R.; Liu, X.; Fang, Y. Fluorogenic Rhodamine Probes with Pyrrole Substitution Enables STED and Lifetime Imaging of Lysosomes in Live Cells. Chem. Eur. J. 2024, 30, e202303707. [Google Scholar] [CrossRef]
- Baranov, M.S.; Solntsev, K.M.; Baleeva, N.S.; Mishin, A.S.; Lukyanov, S.A.; Lukyanov, K.A.; Yampolsky, I.V. Red-Shifted Fluorescent Aminated Derivatives of a Conformationally Locked GFP Chromophore. Chem. Eur. J. 2014, 20, 13234–13241. [Google Scholar] [CrossRef] [PubMed]
- Ando, R.; Hama, H.; Yamamoto-Hino, M.; Mizuno, H.; Miyawaki, A. An Optical Marker Based on the UV-Induced Green-to-Red Photoconversion of a Fluorescent Protein. Proc. Natl. Acad. Sci. USA 2002, 99, 12651–12656. [Google Scholar] [CrossRef] [PubMed]
- Chuang, W.-T.; Chen, B.-S.; Chen, K.-Y.; Hsieh, C.-C.; Chou, P.-T. Fluorescent Protein Red Kaede Chromophore; One-Step, High-Yield Synthesis and Potential Application for Solar Cells. Chem. Commun. 2009, 45, 6982–6984. [Google Scholar] [CrossRef] [PubMed]
- Baleeva, N.S.; Myannik, K.A.; Yampolsky, I.V.; Baranov, M.S. Bioinspired Fluorescent Dyes Based on a Conformationally Locked Chromophore of the Fluorescent Protein Kaede. European J. Org. Chem. 2015, 2015, 5716–5721. [Google Scholar] [CrossRef]
- Sinenko, G.D.; Farkhutdinova, D.A.; Myasnyanko, I.N.; Baleeva, N.S.; Baranov, M.S.; Bochenkova, A.V. Designing Red-Shifted Molecular Emitters Based on the Annulated Locked GFP Chromophore Derivatives. Int. J. Mol. Sci. 2021, 22, 13645. [Google Scholar] [CrossRef] [PubMed]
- Olsen, S.; Baranov, M.S.; Baleeva, N.S.; Antonova, M.M.; Johnson, K.A.; Solntsev, K.M. pH-Sensitive Fluorophores from Locked GFP Chromophores by a Non-Alternant Analogue of the Photochemical Meta Effect. Phys. Chem. Chem. Phys. 2016, 18, 26703–26711. [Google Scholar] [CrossRef]
- Shellaiah, M.; Sun, K.-W. Pyrene-Based AIE Active Materials for Bioimaging and Theranostics Applications. Biosensors 2022, 12, 550. [Google Scholar] [CrossRef]
- Shen, X.; Huang, G.; Li, K.; Zhang, G.; Zhang, D. Tuning the Solid-State Emission of the Analogous GFP Chromophore by Varying Alkyl Chains in the Imidazolinone Ring. Sci. China Chem. 2013, 56, 1197–1203. [Google Scholar] [CrossRef]
- Baldridge, A.; Amador, A.; Tolbert, L.M. Fluorescence Turn on by Cholate Aggregates. Langmuir 2011, 27, 3271–3274. [Google Scholar] [CrossRef]
- Ma, J.; Gu, Y.; Ma, D.; Lu, W.; Qiu, J. Insights into AIE Materials: A Focus on Biomedical Applications of Fluorescence. Front. Chem. 2022, 10, 985578. [Google Scholar] [CrossRef]
- Krasnova, S.A.; Bogdanova, Y.A.; Sokolov, A.I.; Myasnyanko, I.N.; Smirnov, A.Y.; Baranov, M.S. 2,5-Dimethoxy-Benzylidene-Rhodanine and Its Acyclic Analogues as Selective Fluorogenic Dyes for Lipid Droplets of Living Cells. Russ. J. Bioorg. Chem. 2024, 50, 251–259. [Google Scholar] [CrossRef]
- Chen, J.W.; Murphy, T.L.; Willingham, M.C.; Pastan, I.; August, J.T. Identification of two lysosomal membrane glycoproteins. J. Cell Biol. 1985, 101, 85–95. [Google Scholar] [CrossRef] [PubMed]
- Würth, C.; Grabolle, M.; Pauli, J.; Spieles, M.; Resch-Genger, U. Relative and Absolute Determination of Fluorescence Quantum Yields of Transparent Samples. Nat. Protoc. 2013, 8, 1535–1550. [Google Scholar] [CrossRef] [PubMed]
- Werner, S.; Engler, C.; Weber, E.; Gruetzner, R.; Marillonnet, S. Fast Track Assembly of Multigene Constructs Using Golden Gate Cloning and the MoClo System. Bioeng. Bugs 2012, 3, 38–43. [Google Scholar] [CrossRef]
- Weber, E.; Engler, C.; Gruetzner, R.; Werner, S.; Marillonnet, S. A Modular Cloning System for Standardized Assembly of Multigene Constructs. PLoS ONE 2011, 6, e16765. [Google Scholar] [CrossRef]
- Schindelin, J.; Arganda-Carreras, I.; Frise, E.; Kaynig, V.; Longair, M.; Pietzsch, T.; Preibisch, S.; Rueden, C.; Saalfeld, S.; Schmid, B.; et al. Fiji: An Open-Source Platform for Biological-Image Analysis. Nat. Methods 2012, 9, 676–682. [Google Scholar] [CrossRef]
- Laine, R.F.; Tosheva, K.L.; Gustafsson, N.; Gray, R.D.M.; Almada, P.; Albrecht, D.; Risa, G.T.; Hurtig, F.; Lindås, A.-C.; Baum, B.; et al. NanoJ: A High-Performance Open-Source Super-Resolution Microscopy Toolbox. J. Phys. D Appl. Phys. 2019, 52, 163001. [Google Scholar] [CrossRef]

| Compound | H2O (Neutral, pH ≈ 6) | H2O (Acidic, pH ≈ 3) | EtOH | CH3CN | EtOAc | Dioxane | |
|---|---|---|---|---|---|---|---|
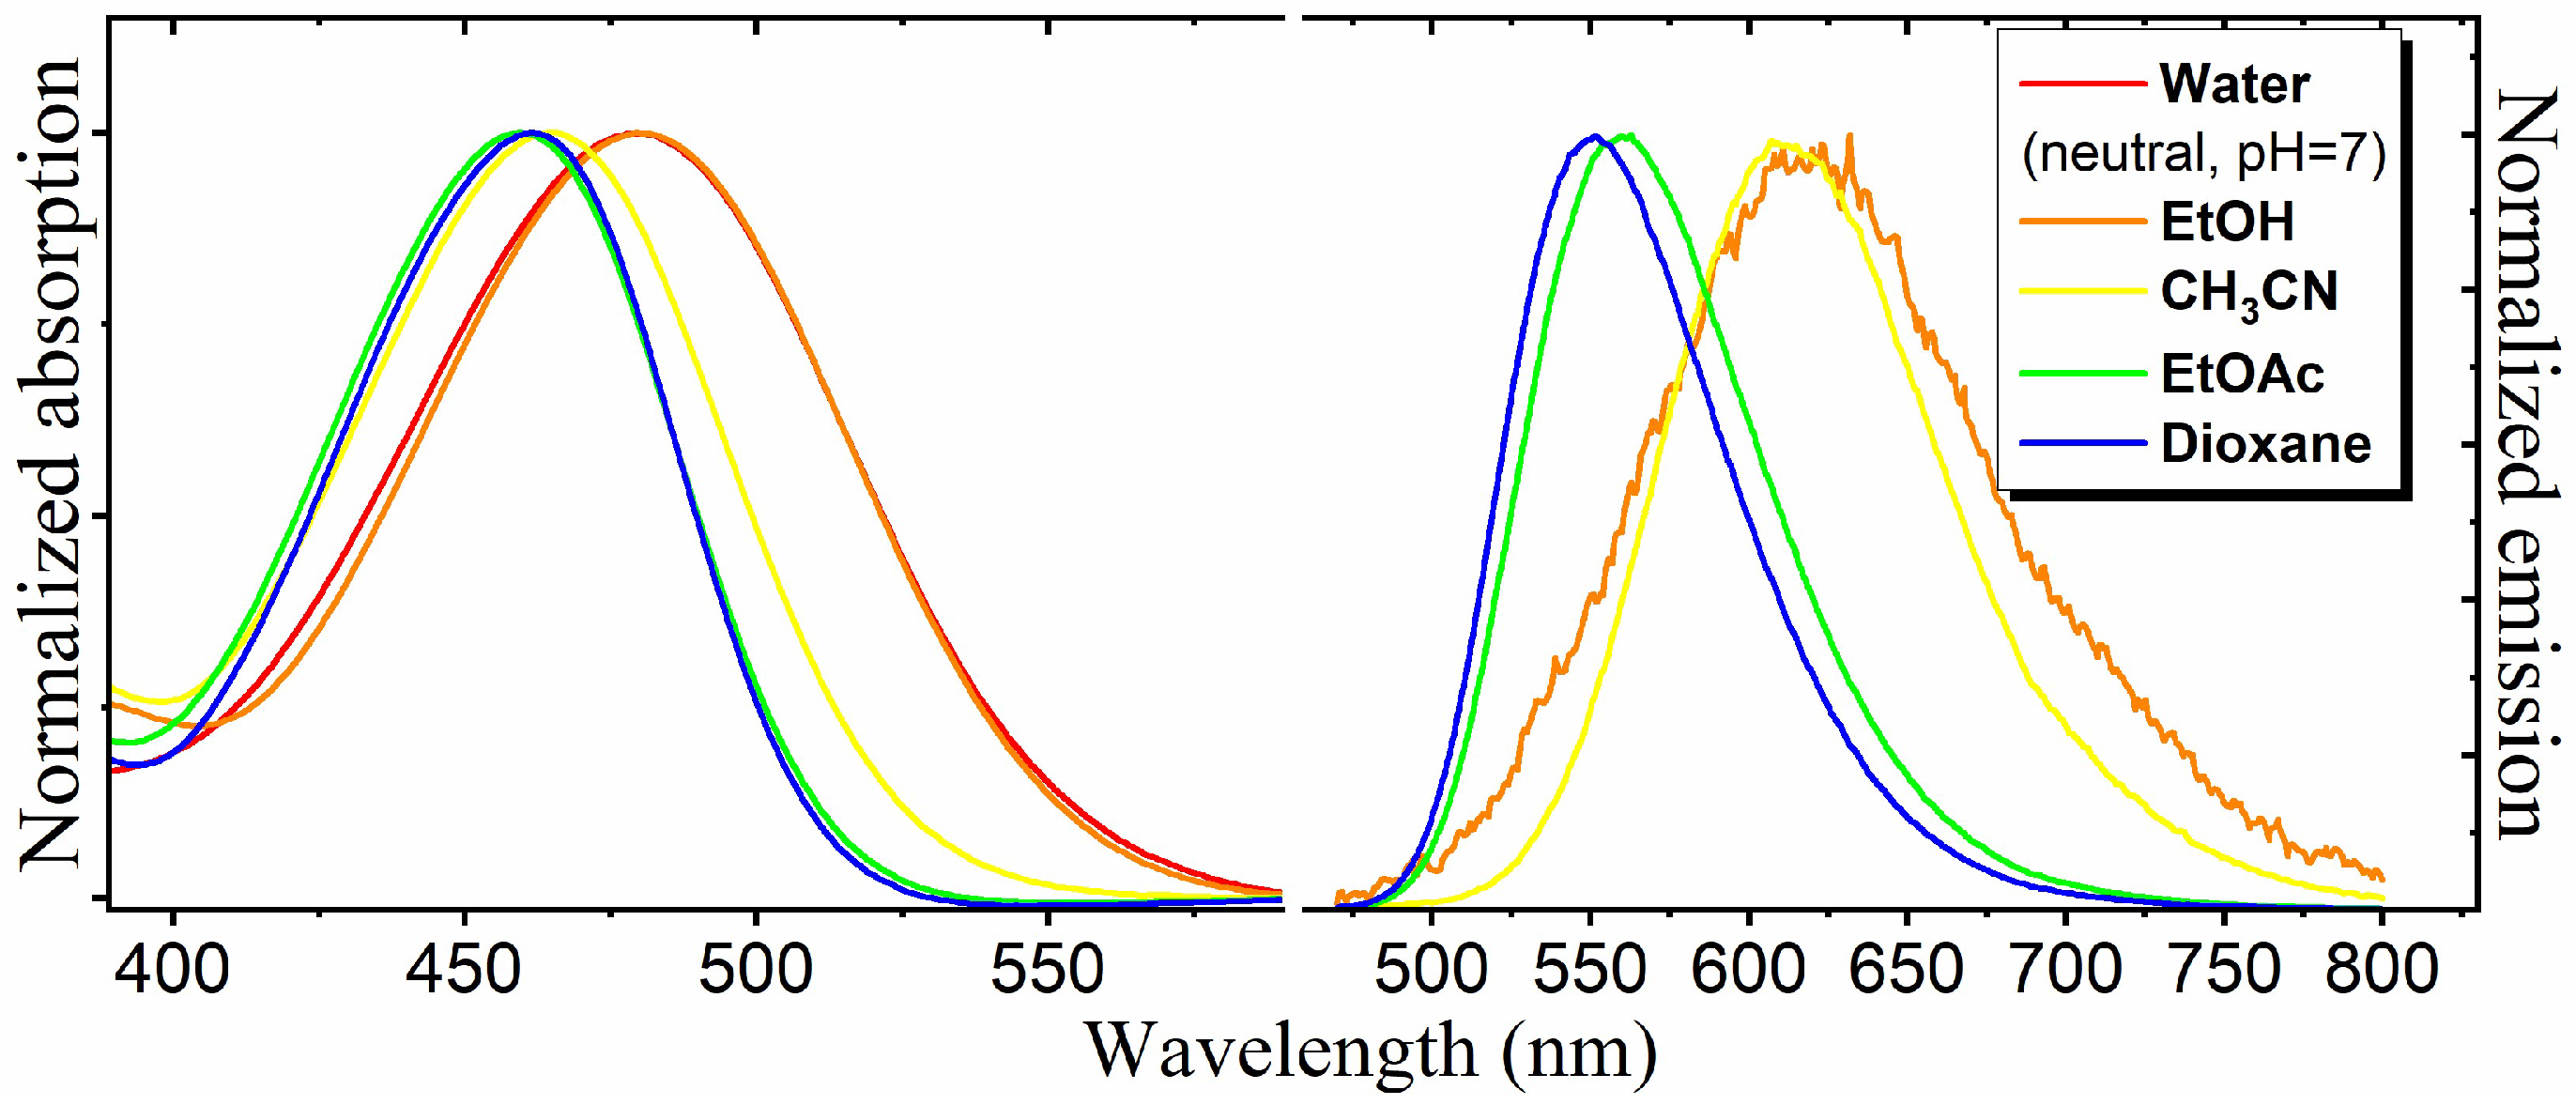
| 2 | Absorption max., nm | 480 | - a | 480 | 464 | 460 | 462 |
| ε, (M cm)−1 | 23,500 | 24,500 | 25,500 | 26,000 | 25,000 | ||
| Emission max., nm | - b | ≈620 | ≈610 | 560 | 552 | ||
| FQY e, % | <1 | 1.5 | 12 | 11 | |||
| 3 | Absorption max., nm | 552 | 475 | 568 | 555 | 550 | 552 |
| ε, (M cm)−1 | 16,500 | 27,000 | 23,000 | 22,500 | 24,500 | 25,500 | |
| Emission max., nm | - b | 539 | ≈590 | ≈580 | ≈570 | ≈570 | |
| FQY e, % | 14 | <1 | <1 | <1 | <1 | ||
| 4 | Absorption max., nm | 522 | 480 | 516 | 505 | 502 | 505 |
| ε, (M cm)−1 | 46,000 | 39,500 | 16,500 | 17,000 | 16,500 | 17,000 | |
| Emission max., nm | - b | 547 | ≈540 | ≈540 | ≈550 | ≈550 | |
| FQY e, % | 92 | <1 | <1 | <1 | <1 | ||
| 5a | Absorption max., nm | 593 | - a | 554 | 542 | 536 | 536 |
| ε, (M cm)−1 | 15,500 | 30,000 | 28,000 | 29,500 | 28,000 | ||
| Emission max., nm | - b | 670 | 660 | ||||
| FQY e, % | <1 | 1.8 | |||||
| 5b | Absorption max., nm | 579 | - a | 580 | 562 | 558 | 559 |
| ε, (M cm)−1 | 14,500 | 25,000 | 23,500 | 22,500 | 23,000 | ||
| Emission max., nm | - b | ≈715 | |||||
| FQY e, % | <1 | ||||||
| 6a | Absorption max., nm | - c | 658 | 648 | 643 | 645 | |
| ε, (M cm)−1 | 5500 | 19,500 | 22,500 | 22,500 | |||
| Emission max., nm | - b | ||||||
| FQY e, % | |||||||
| 6c | Absorption max., nm | - c | 654 | 642 | 639 | 640 | - c |
| ε, (M cm)−1 | 31,500 | 31,000 | 33,500 | 35,000 | |||
| Emission max., nm | - b | ||||||
| FQY e, % | |||||||
| 7a | Absorption max., nm | 591 | 539 | 592 | 584 | 583 | 585 |
| ε, (M cm)−1 | 20,000 | 17,000 | 35,500 | 34,000 | 32,000 | 32,500 | |
| Emission max., nm | - b | 639 | - b | ||||
| FQY e, % | 2.0 | ||||||
| 7b | Absorption max., nm | 601 | 558/578 d | 609 | 599 | 596 | 599 |
| ε, (M cm)−1 | 28,000 | 22,500/23,000 d | 26,000 | 25,000 | 23,500 | 24,500 | |
| Emission max., nm | - b | 662/- b,d | - b | ||||
| FQY e, % | 1.0/- b,d | ||||||
| 7c | Absorption max., nm | 596 | 546 | 594 | 583 | 580 | 583 |
| ε, (M cm)−1 | 25,000 | 17,000 | 36,000 | 34,000 | 32,500 | 34,000 | |
| Emission max., nm | -b | 634 | - b | ||||
| FQY e, % | 2.8 | ||||||
| 8 | Absorption max., nm | 586 | - a | 588 | 576 | 575 | 578 |
| ε, (M cm)−1 | 41,000 | 48,000 | 45,000 | 45,000 | 47,500 | ||
| Emission max., nm | - b | 662 | 643 | ||||
| FQY e, % | <1 | 2.0 | |||||
| 9 | Absorption max., nm | 608 | 553 | 607 | 596 | 598 | 601 |
| ε, (M cm)−1 | 58,000 | 50,500 | 94,500 | 83,000 | 80,000 | 84,500 | |
| Emission max., nm | - b | 608 | - b | ||||
| FQY e, % | 27 | ||||||
| Compound | Absorption Max., nm of Neutral Form | Absorption Max., nm of Protonated Form | FQY, % in Acidic Media | pKa Based on Absorbance Titration Data a | pKa Based on Emission Titration Data a |
|---|---|---|---|---|---|
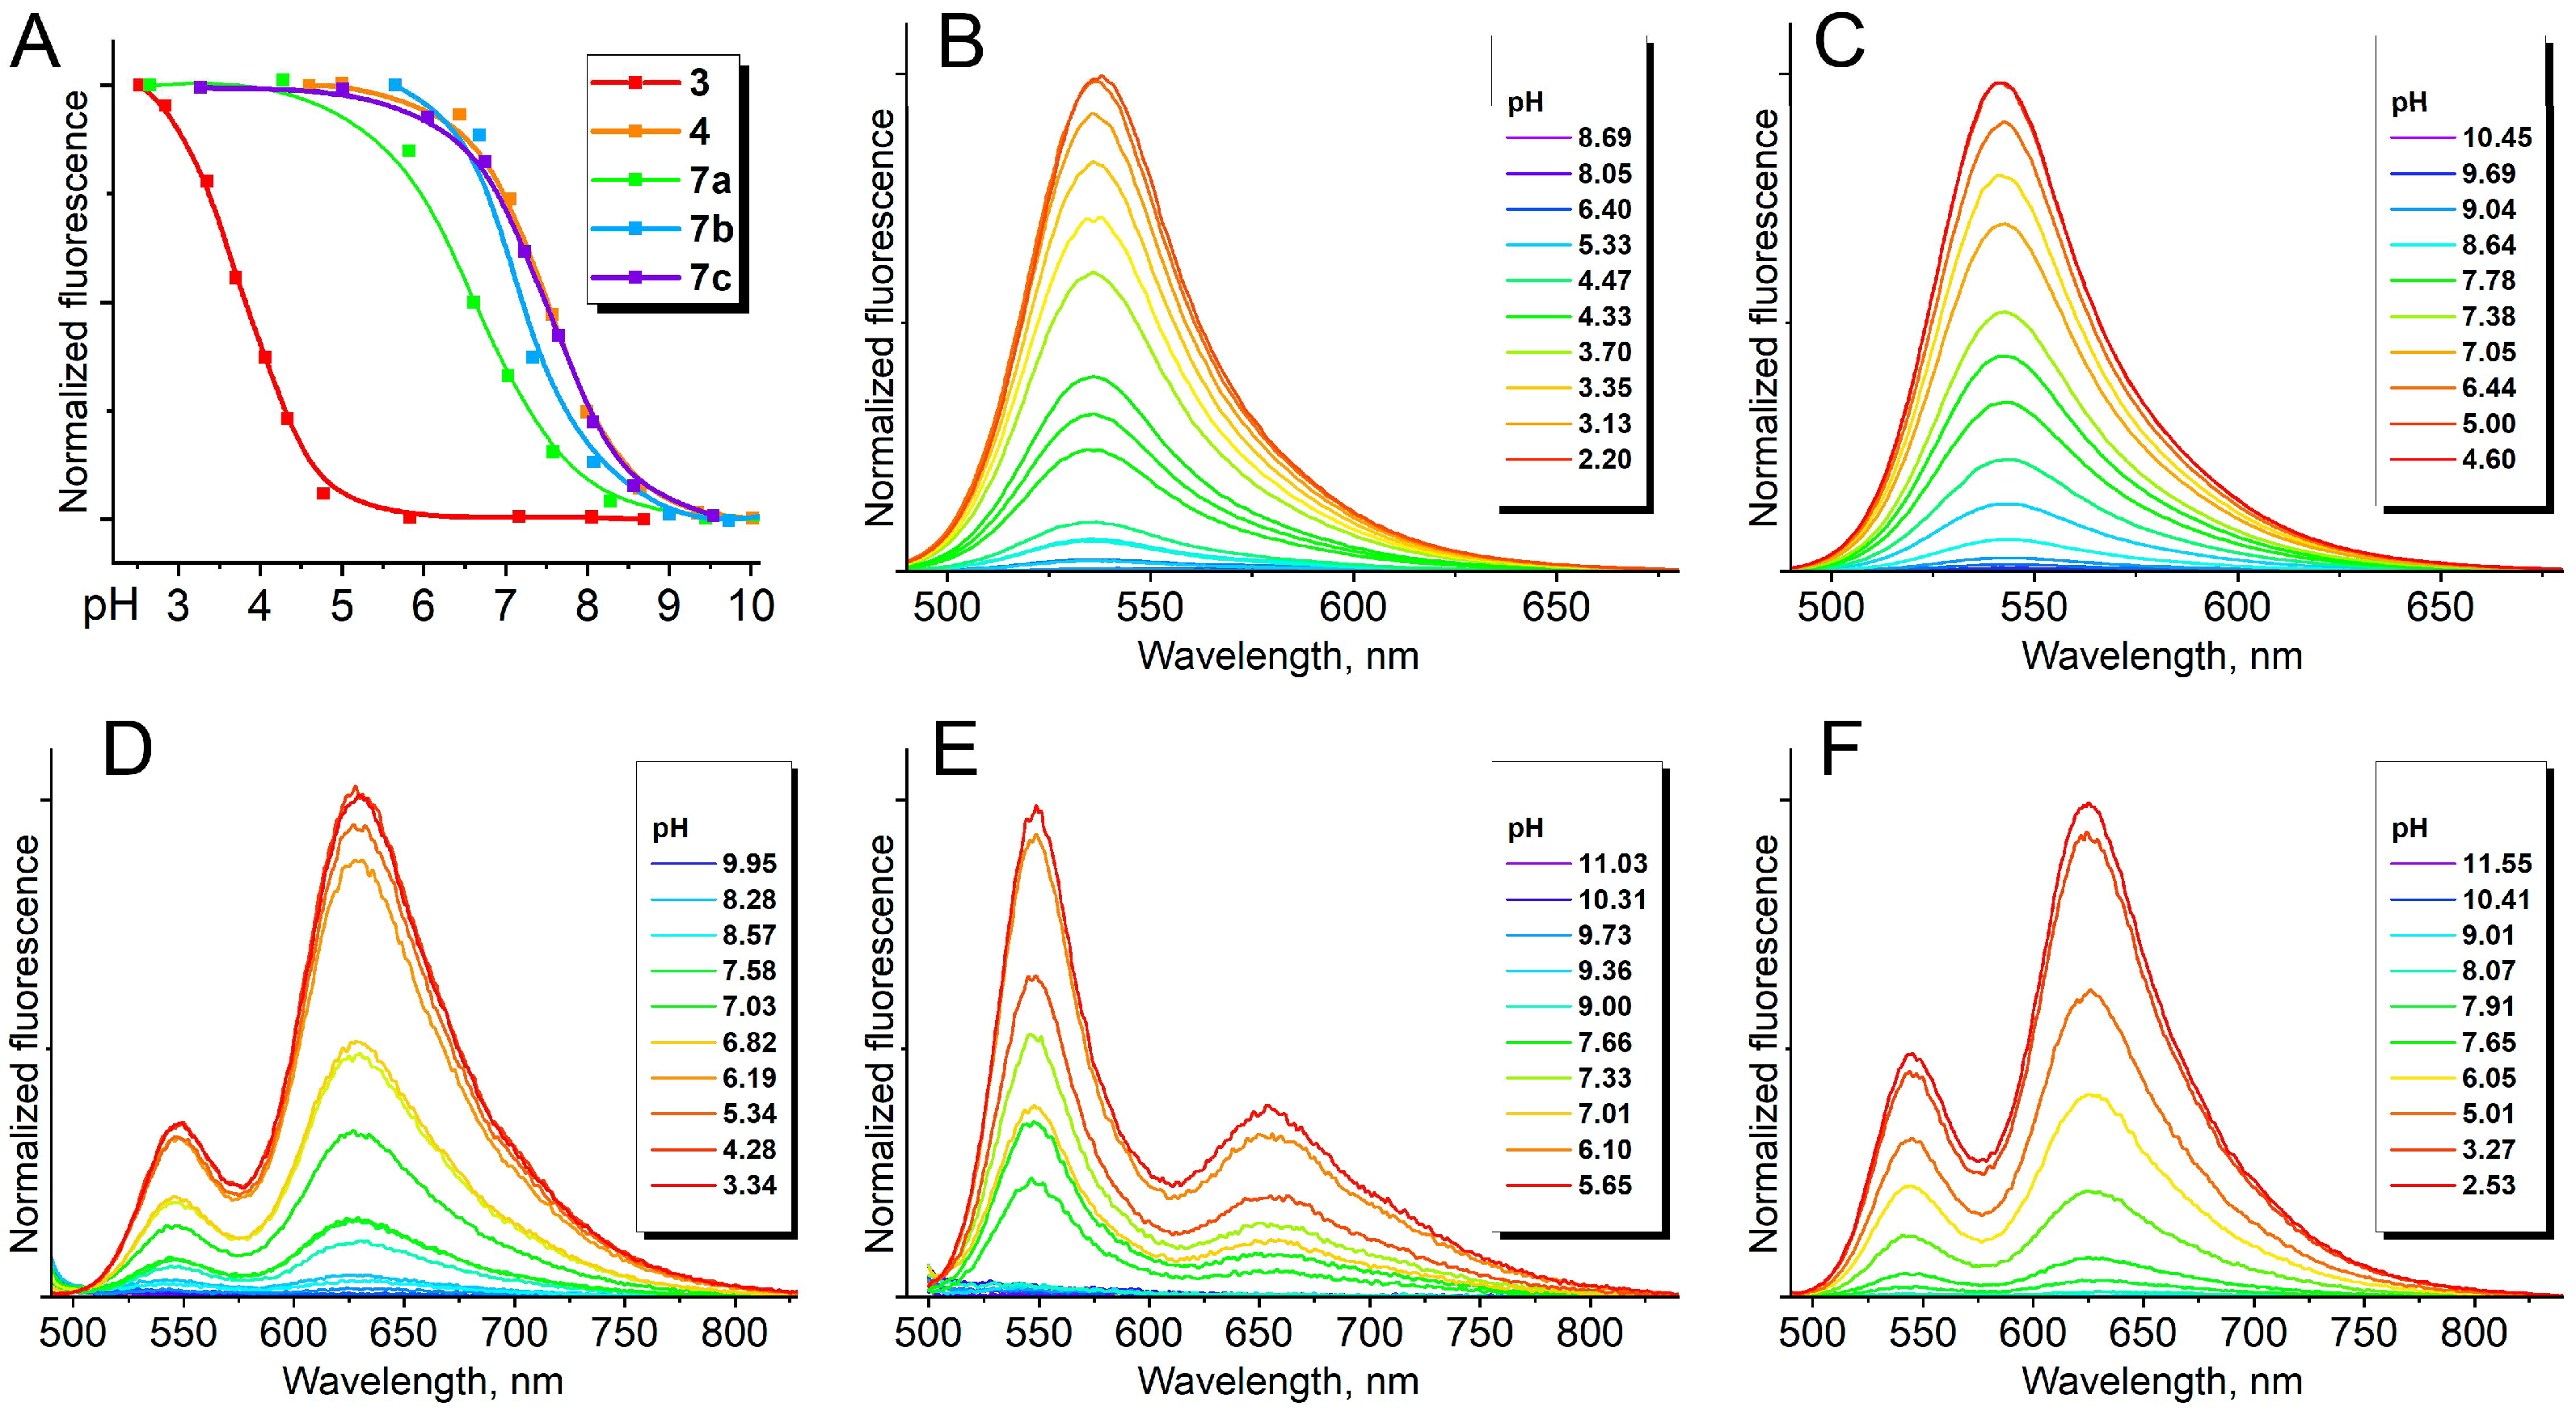
| 3 | 552 | 475 | 14 | 4.0 | 3.9 |
| 4 | 522 | 480 | 92 | 7.7 | 7.5 |
| 7a | 591 | 539 | 2.0 | 6.8 | 7.0 |
| 7b | 601 | 558/578 b | 1.0 | 7.4/4.2 b | 7.0/4.4 b |
| 7c | 596 | 546 | 2.8 | 7.5 | 7.5 |
| 9 | 608 | 553 | 27 | 7.5 | 7.1 |
Disclaimer/Publisher’s Note: The statements, opinions and data contained in all publications are solely those of the individual author(s) and contributor(s) and not of MDPI and/or the editor(s). MDPI and/or the editor(s) disclaim responsibility for any injury to people or property resulting from any ideas, methods, instructions or products referred to in the content. |
© 2024 by the authors. Licensee MDPI, Basel, Switzerland. This article is an open access article distributed under the terms and conditions of the Creative Commons Attribution (CC BY) license (https://creativecommons.org/licenses/by/4.0/).
Share and Cite
Rudik, D.I.; Perfilov, M.M.; Sokolov, A.I.; Chen, C.; Baleeva, N.S.; Myasnyanko, I.N.; Mishin, A.S.; Fang, C.; Bogdanova, Y.A.; Baranov, M.S. Developing 1,4-Diethyl-1,2,3,4-tetrahydroquinoxalin-substituted Fluorogens Based on GFP Chromophore for Endoplasmic Reticulum and Lysosome Staining. Int. J. Mol. Sci. 2024, 25, 10448. https://doi.org/10.3390/ijms251910448
Rudik DI, Perfilov MM, Sokolov AI, Chen C, Baleeva NS, Myasnyanko IN, Mishin AS, Fang C, Bogdanova YA, Baranov MS. Developing 1,4-Diethyl-1,2,3,4-tetrahydroquinoxalin-substituted Fluorogens Based on GFP Chromophore for Endoplasmic Reticulum and Lysosome Staining. International Journal of Molecular Sciences. 2024; 25(19):10448. https://doi.org/10.3390/ijms251910448
Chicago/Turabian StyleRudik, Daniil I., Maxim M. Perfilov, Anatolii I. Sokolov, Cheng Chen, Nadezhda S. Baleeva, Ivan N. Myasnyanko, Alexander S. Mishin, Chong Fang, Yulia A. Bogdanova, and Mikhail S. Baranov. 2024. "Developing 1,4-Diethyl-1,2,3,4-tetrahydroquinoxalin-substituted Fluorogens Based on GFP Chromophore for Endoplasmic Reticulum and Lysosome Staining" International Journal of Molecular Sciences 25, no. 19: 10448. https://doi.org/10.3390/ijms251910448
APA StyleRudik, D. I., Perfilov, M. M., Sokolov, A. I., Chen, C., Baleeva, N. S., Myasnyanko, I. N., Mishin, A. S., Fang, C., Bogdanova, Y. A., & Baranov, M. S. (2024). Developing 1,4-Diethyl-1,2,3,4-tetrahydroquinoxalin-substituted Fluorogens Based on GFP Chromophore for Endoplasmic Reticulum and Lysosome Staining. International Journal of Molecular Sciences, 25(19), 10448. https://doi.org/10.3390/ijms251910448