Abstract
Different developmental genes shape frequent dynamic inter-chromosomal contacts with rDNA units in human and Drosophila cells. In the course of differentiation, changes in these contacts occur, coupled with changes in the expression of hundreds of rDNA-contacting genes. The data suggest a possible role of nucleoli in the global regulation of gene expression. However, the mechanism behind the specificity of these inter-chromosomal contacts, which are rebuilt in every cell cycle, is not yet known. Here, we describe the strong association of rDNA-contacting genes with numerous long intergenic non-coding RNAs (lincRNAs) in HEK293T cells and in initial and differentiated K562 cells. We observed that up to 600 different lincRNAs were preferentially co-expressed with multiple overlapping sets of rDNA-contacting developmental genes, and there was a strong correlation between the genomic positions of rDNA-contacting genes and lincRNA mappings. These two findings suggest that lincRNAs might guide the corresponding developmental genes toward rDNA clusters. We conclude that the inter-chromosomal interactions of rDNA-contacting genes with nucleoli might be guided by lincRNAs, which might physically link particular genomic regions with rDNA clusters.
Keywords:
rDNA clusters; lincRNAs; differentiation; inter-chromosomal contacts; 4C; gene expression; K562; HEK293T; co-expression 1. Introduction
Growing evidence suggests that the 3D organization of chromosomes is the basis for different mechanisms of gene expression regulation. Chromosomal 3D structures are associated with both local and distant intra- and inter-chromosomal interactions. Inter-chromosomal interactions are much rarer than intra-chromosomal interactions and are formed by chromosomal regions that possess highly expressed genes [1,2].
Multiple genes controlling development in human and Drosophila cells have been reported to form dynamic inter-chromosomal contacts with rDNA clusters [3,4,5]. It was found that changes occurring in these long-range rDNA–genomic interactions are associated with changes in gene expression patterns during tumorigenesis [6]. Recently, it was reported that during differentiation, changes in rDNA–genomic contacts are coupled with changes in the 3D nets of chromosomal structures around developmental genes [6]. These alterations in the inter-chromosomal contacts of rDNA clusters and 3D structures in particular chromosomal regions lead to changes in the expression of genes located in the corresponding chromosomal domains [7]. About half of the rDNA-contacting genes are co-expressed in human cells [7]. Taken together, these data suggest that 3D structures shaped by rDNA clusters are involved in the global regulation of gene expression [7].
The rDNA-contacting regions in the human genome very often correspond to broad (up to 50 kb) regions decorated by H3K27ac marks that correspond to super-enhancers [8,9,10,11]. It has been speculated that nucleoli might form numerous condensates around themselves, possessing different sets of transcription factors, and that many chromatin loops from different chromosomes possessing developmental genes are merged in these condensates. As a result, different sets of developmental genes are co-expressed [7]. However, it remains unknown as to how these inter-chromosomal rDNA contacts are shaped, how the corresponding genomic regions are targeted to nucleoli surrounded by condensates, how these contacts are rebuilt in every cell cycle, and how they are changed in the course of differentiation.
RNA molecules can originate from any genomic region, and there is evidence in favor of so-called pervasive transcription [12]. These RNA copies can potentially recognize any genomic region and provide the precise navigation mechanism for the regulation of gene expression. LincRNAs are non-coding RNAs longer than 200 nucleotide molecules that can be 5′ capped, spliced, and polyadenylated, and they are characterized by higher developmental stage specificity [13,14]. It was suggested that lincRNAs could act in trans via base-pairing interactions and have the potential to regulate the expression of target genes at the transcriptional or translational level with remarkable tissue specificity [15,16].
Here, we present evidence suggesting that lincRNAs have a role in guiding different genomic regions to nucleoli. We found that hundreds of lincRNAs are highly associated and co-expressed with multiple sets of rDNA-contacting genes in HEK293T and K562 cells, and their genomic sites exhibit a strong correlation with the genomic positions of mapped rDNA contacts. We reveal that different sets of lincRNAs could be associated with silent and active genes and that differentiating cells are associated with a great amount of new lincRNAs, as compared with the initial proliferating cells. Our study highlights a novel role of lincRNAs as putative navigator molecules guiding the specific set of developmental genes toward nucleoli. These results could open new lines of investigation into lincRNAs’ functions and 3D chromosomal structures.
2. Results
2.1. Numerous Overlapping Sets of rDNA-Contacting Genes Are Co-Expressed with Hundreds of LincRNAs in HEK293T Cells
To uncover the associations of rDNA-contacting genes with lincRNAs, we searched for lncHUB lncRNA co-expression in Enrichr (https://maayanlab.cloud/Enrichr/, accessed on 5 June 2024). Adjusted p-values (padj) were calculated by Enrichr. Table 1 shows the top 10 non-coding RNAs that are co-expressed with rDNA-contacting genes in HEK293T (padj up to 2.62 × 10⁻⁷). The whole list of associated lincRNAs is shown in Table S1. The database indicates that particular lincRNAs overlap with the essential part of co-expressed genes in human cells. The data also indicate that the majority of these co-expressed genes (more than half) correspond to rDNA-contacting genes. In total, in HEK293T cells, we detected 124 lincRNAs that are co-expressed with overlapping sets of rDNA-contacting genes (Table S1). The sets of overlapping genes include a total of 562 genes. Searches of random sets of human genes did not reveal statistically significant associations with lincRNAs. The data shown in Table S1 indicate that a particular gene can be associated with a number of different lincRNAs. For example, the protocadherin gamma gene cluster, which may be involved in the establishment of specific neuronal connections in the brain, is co-expressed with about 180 lincRNAs; at the same time, the KCNA6 gene, which is involved in the regulation of neurotransmitter release, is co-expressed with only 4 lincRNAs.

Table 1.
Overlapping groups of rDNA-contacting genes in HEK293T cells are co-expressed with different long non-coding RNAs. The top 10 lincRNAs are shown. The complete list of 124 lincRNAs is shown in Table S1.
2.2. Numerous Overlapping Sets of rDNA-Contacting Genes Are Co-Expressed with about 200 LincRNAs in K562 Cells
The data prompted us to determine whether rDNA-contacting genes in another cell type would also be associated with lincRNAs. It was previously shown that 40% of rDNA-contacting genes are common between HEK293T and K562 cells [7]. These cell types are of different origins: HEK293 cells originate from human embryonic kidney neurons, while K562 cells, which are more differentiated, are obtained from bone marrow and are of the erythroleukemia type. Both cell types have about half of the common rDNA-contacting genes, and we expected that we would also detect a strong association of these genes in K562 cells. This supposition was confirmed, and Table 2 shows that the top 10 lincRNAs are highly associated with rDNA-contacting genes in K562 cells (padj up to 7.26 × 10⁻¹⁰). The whole list of associated lincRNAs in K562 cells is shown in Table S2. We detected 198 different lincRNAs that are co-expressed with overlapping sets of rDNA-contacting genes. In total, 1276 rDNA-contacting genes are present in these overlapping sets.
Table 2.
Overlapping groups of rDNA-contacting genes in K562 cells are co-expressed with different long non-coding RNAs. The top 10 lincRNAs are shown. The complete list of 198 lincRNAs is shown in Table S2.
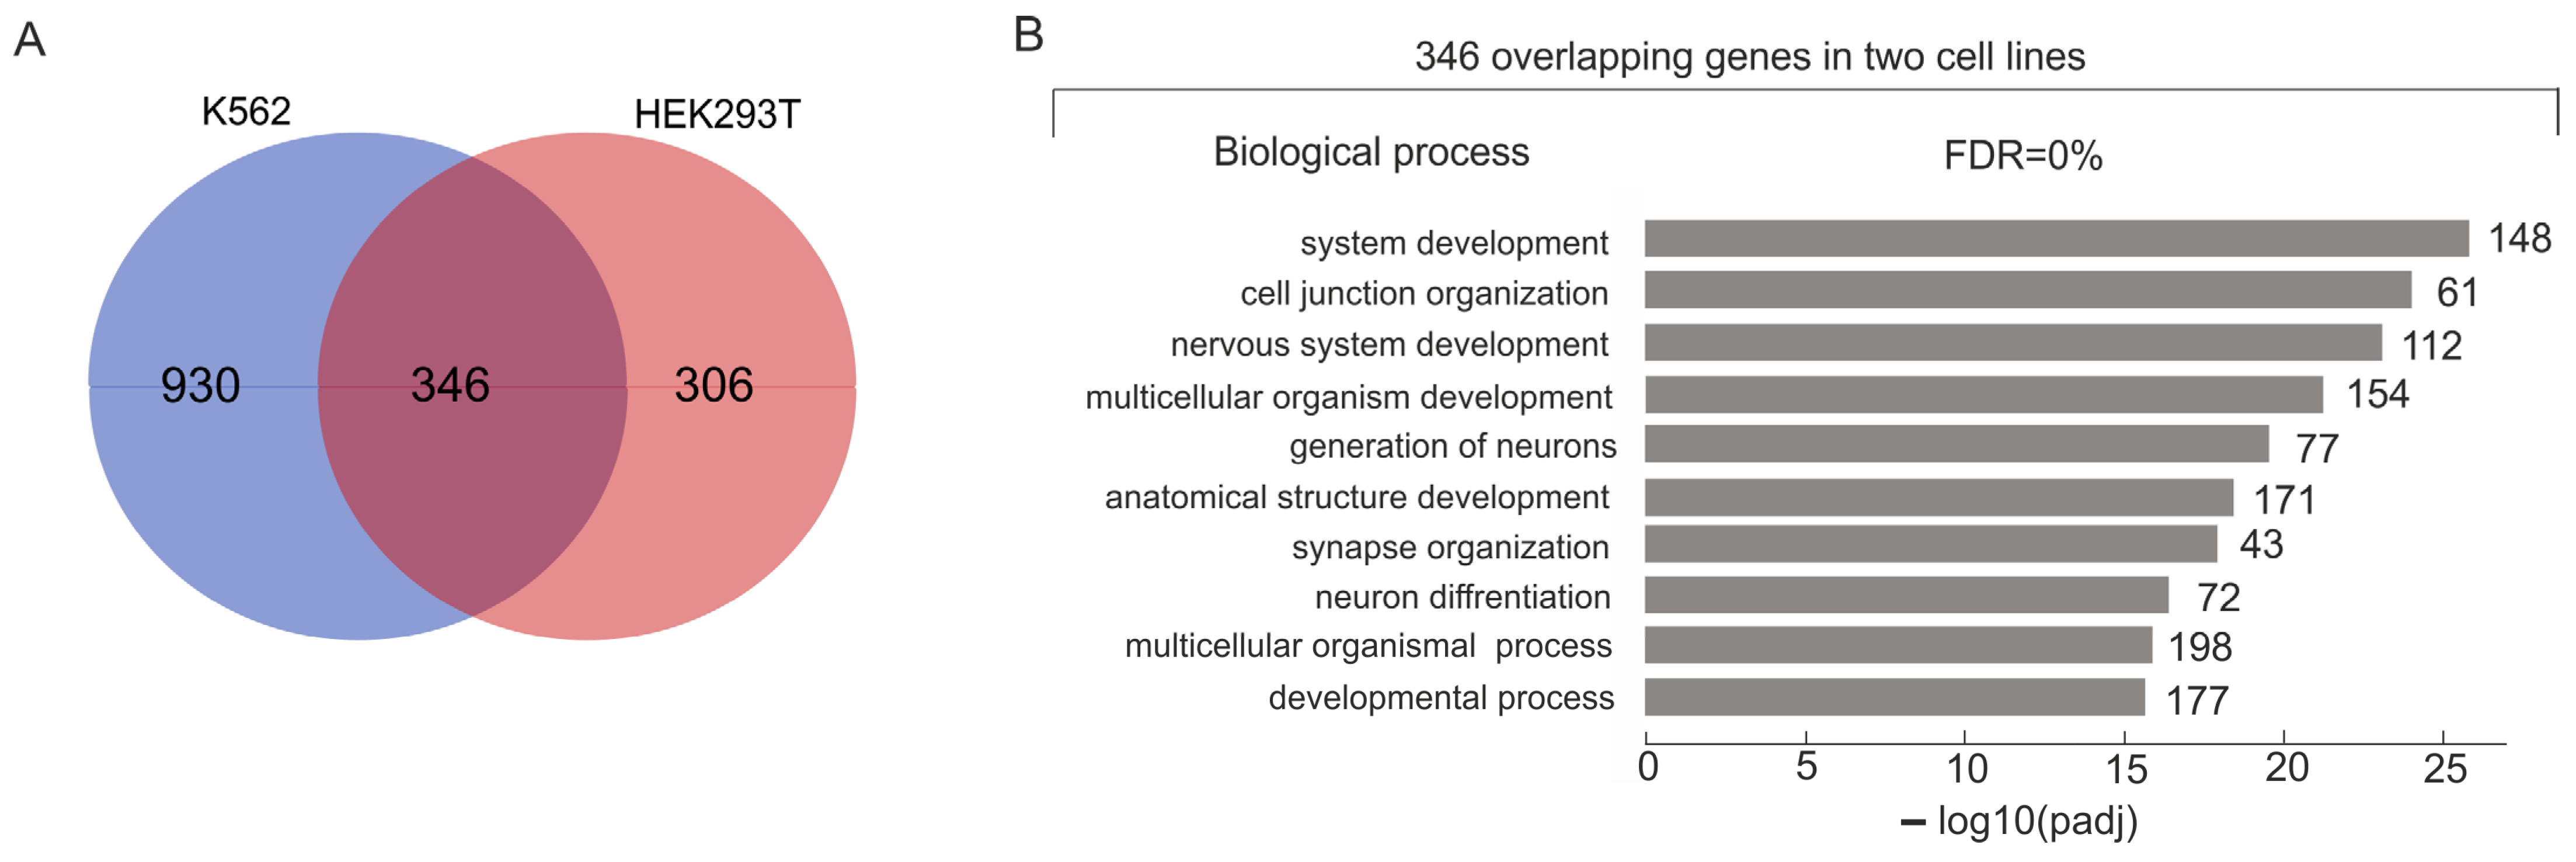
Figure 1A shows the intersection between the sets of rDNA-contacting genes associated with different lincRNAs in K562 and HEK293T cells. We detected that 346 overlapping rDNA-contacting genes are highly associated with development in both cell lines (Figure 1B).

Figure 1.
Intersection between the sets of rDNA-contacting genes associated with different lincRNAs in K562 and HEK293T cells. (A) Venn diagram showing the intersection between the sets of rDNA-contacting genes associated with different lincRNAs in K562 and HEK293T cells (the list of corresponding genes is shown in Table S3). (B) The top 10 detected terms of biological processes associated with overlapping rDNA-contacting genes associated with lincRNAs in both cell lines. Values to the right of the bars show the number of rDNA-contacting genes associated with each term. A full list of corresponding genes and terms is shown in Table S4. The search was performed using g:Profiler (https://biit.cs.ut.ee/gprofiler/gost, accessed 5 June 2024).
2.3. Induced Differentiation of K562 Cells Leads to Changes in Both Sets of rDNA-Contacting Genes and Co-Expressed LincRNAs
Next, we attempted to determine how the hemin-induced erythroid differentiation of K562 cells would affect the lincRNA species associated with rDNA-contacting genes. Hemin-induced K562 cell differentiation is known to lead to changes in the inter-chromosomal contacts of rDNA clusters [7]. Here, we observed strong associations of lincRNAs with particular rDNA-contacting genes, which we expected, as well as alterations in the co-expressing lincRNA species upon induced differentiation. The data shown in Table 3 confirm our supposition. The table presents the top 10 lincRNAs highly associated with rDNA-contacting genes in differentiating K562 cells (padj up to 3.09 × 10⁻⁸). The whole list of associated lincRNAs in these cells is shown in Table S5. We detected 312 different lincRNAs that are co-expressed with overlapping sets of rDNA-contacting genes. In total, 1060 rDNA-contacting genes are present in these overlapping sets.
Table 3.
Overlapping groups of rDNA-contacting genes in differentiating K562 cells are co-expressed with different long non-coding RNAs. The top 10 lincRNAs are shown. The complete list of 312 lincRNAs is shown in Table S5.
Mostly, the genes associated with lincRNAs are common in the initial K562 cells and in the differentiating cells (902 genes; Figure 2A). Large groups of these genes are extremely strongly associated with development, up to 2.8 × 10−36 (Figure 2B, Table S7). These common genes exhibited about the same expression levels in K562 cells in both states (Figure 2E).
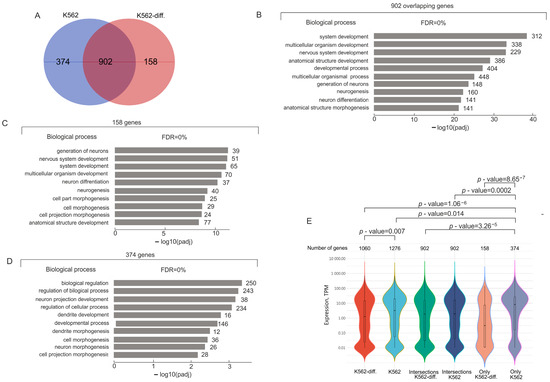
Figure 2.
Analysis of rDNA-contacting genes associated with different lincRNAs in K562 cells before and after induced differentiation. (A) Venn diagram showing the intersection between sets of rDNA-contacting genes associated with different lincRNAs in K562 before and after induced differentiation (K562 and K562-diff., respectively). The list of corresponding genes is shown in Table S6. (B) Top 10 detected terms of biological processes associated with 902 rDNA-contacting genes commonly associated with lincRNAs in initial and differentiated K562 cells. Values to the right of bars show the number of rDNA-contacting genes associated with each term. The full list of corresponding genes and terms is shown in Table S7. The search was performed using g:Profiler (https://biit.cs.ut.ee/gprofiler/gost, accessed 5 June 2024). (C) Top 10 detected terms of biological processes associated with 158 rDNA-contacting genes associated with lincRNAs characteristic of only differentiated K562 cells. Values to the right of bars show the number of rDNA-contacting genes associated with each term. The full list of corresponding genes and terms is shown in Table S8. The search was performed using g:Profiler (https://biit.cs.ut.ee/gprofiler/gost, accessed 5 June 2024). (D) Top 10 detected terms of biological processes associated with 374 rDNA-contacting genes associated with lincRNAs and characteristic only of initial K562 cells. Values to the right of bars show the number of rDNA-contacting genes associated with each term. The full list of corresponding genes and terms is shown in Table S9. The search was performed using g:Profiler (https://biit.cs.ut.ee/gprofiler/gost, accessed 5 June 2024). (E) Violin plots show the distribution of expression of rDNA-contacting genes that are co-expressed with lincRNAs in initial K562 cells or in differentiated K562 cells (K562-diff.). The numbers of corresponding rDNA-contacting genes are shown at the top. p-values were assessed as described in Methods.
There are also genes that were co-expressed with particular lincRNAs, either in initial K562 cells or in differentiating cells (374 and 158 genes, respectively). The first group of 374 genes is associated with biological regulation and morphogenesis. Mostly, these genes are actively expressed (Figure 2E). Interestingly, the 158 genes that are characteristic of differentiating cells are involved mainly in the same biological processes as the main group of 902 genes (Figure 2B,C). Although the groups of 902 and 158 genes are mainly associated with the same biological processes (Figure 2B,D), part of the latter group was repressed upon hemin-induced differentiation (Figure 2E).
Interestingly, the 374 mostly actively expressed genes in the initial cells and the 158 genes including repressed genes have only one common lincRNA (Figure S1). This result strongly suggests that specific groups of developmental genes that are either activated or repressed may be associated with different sets of lincRNAs.
2.4. Expression of LincRNAs Co-Expressing with rDNA-Contacting Genes Detected in HEK293T and K562 Cells
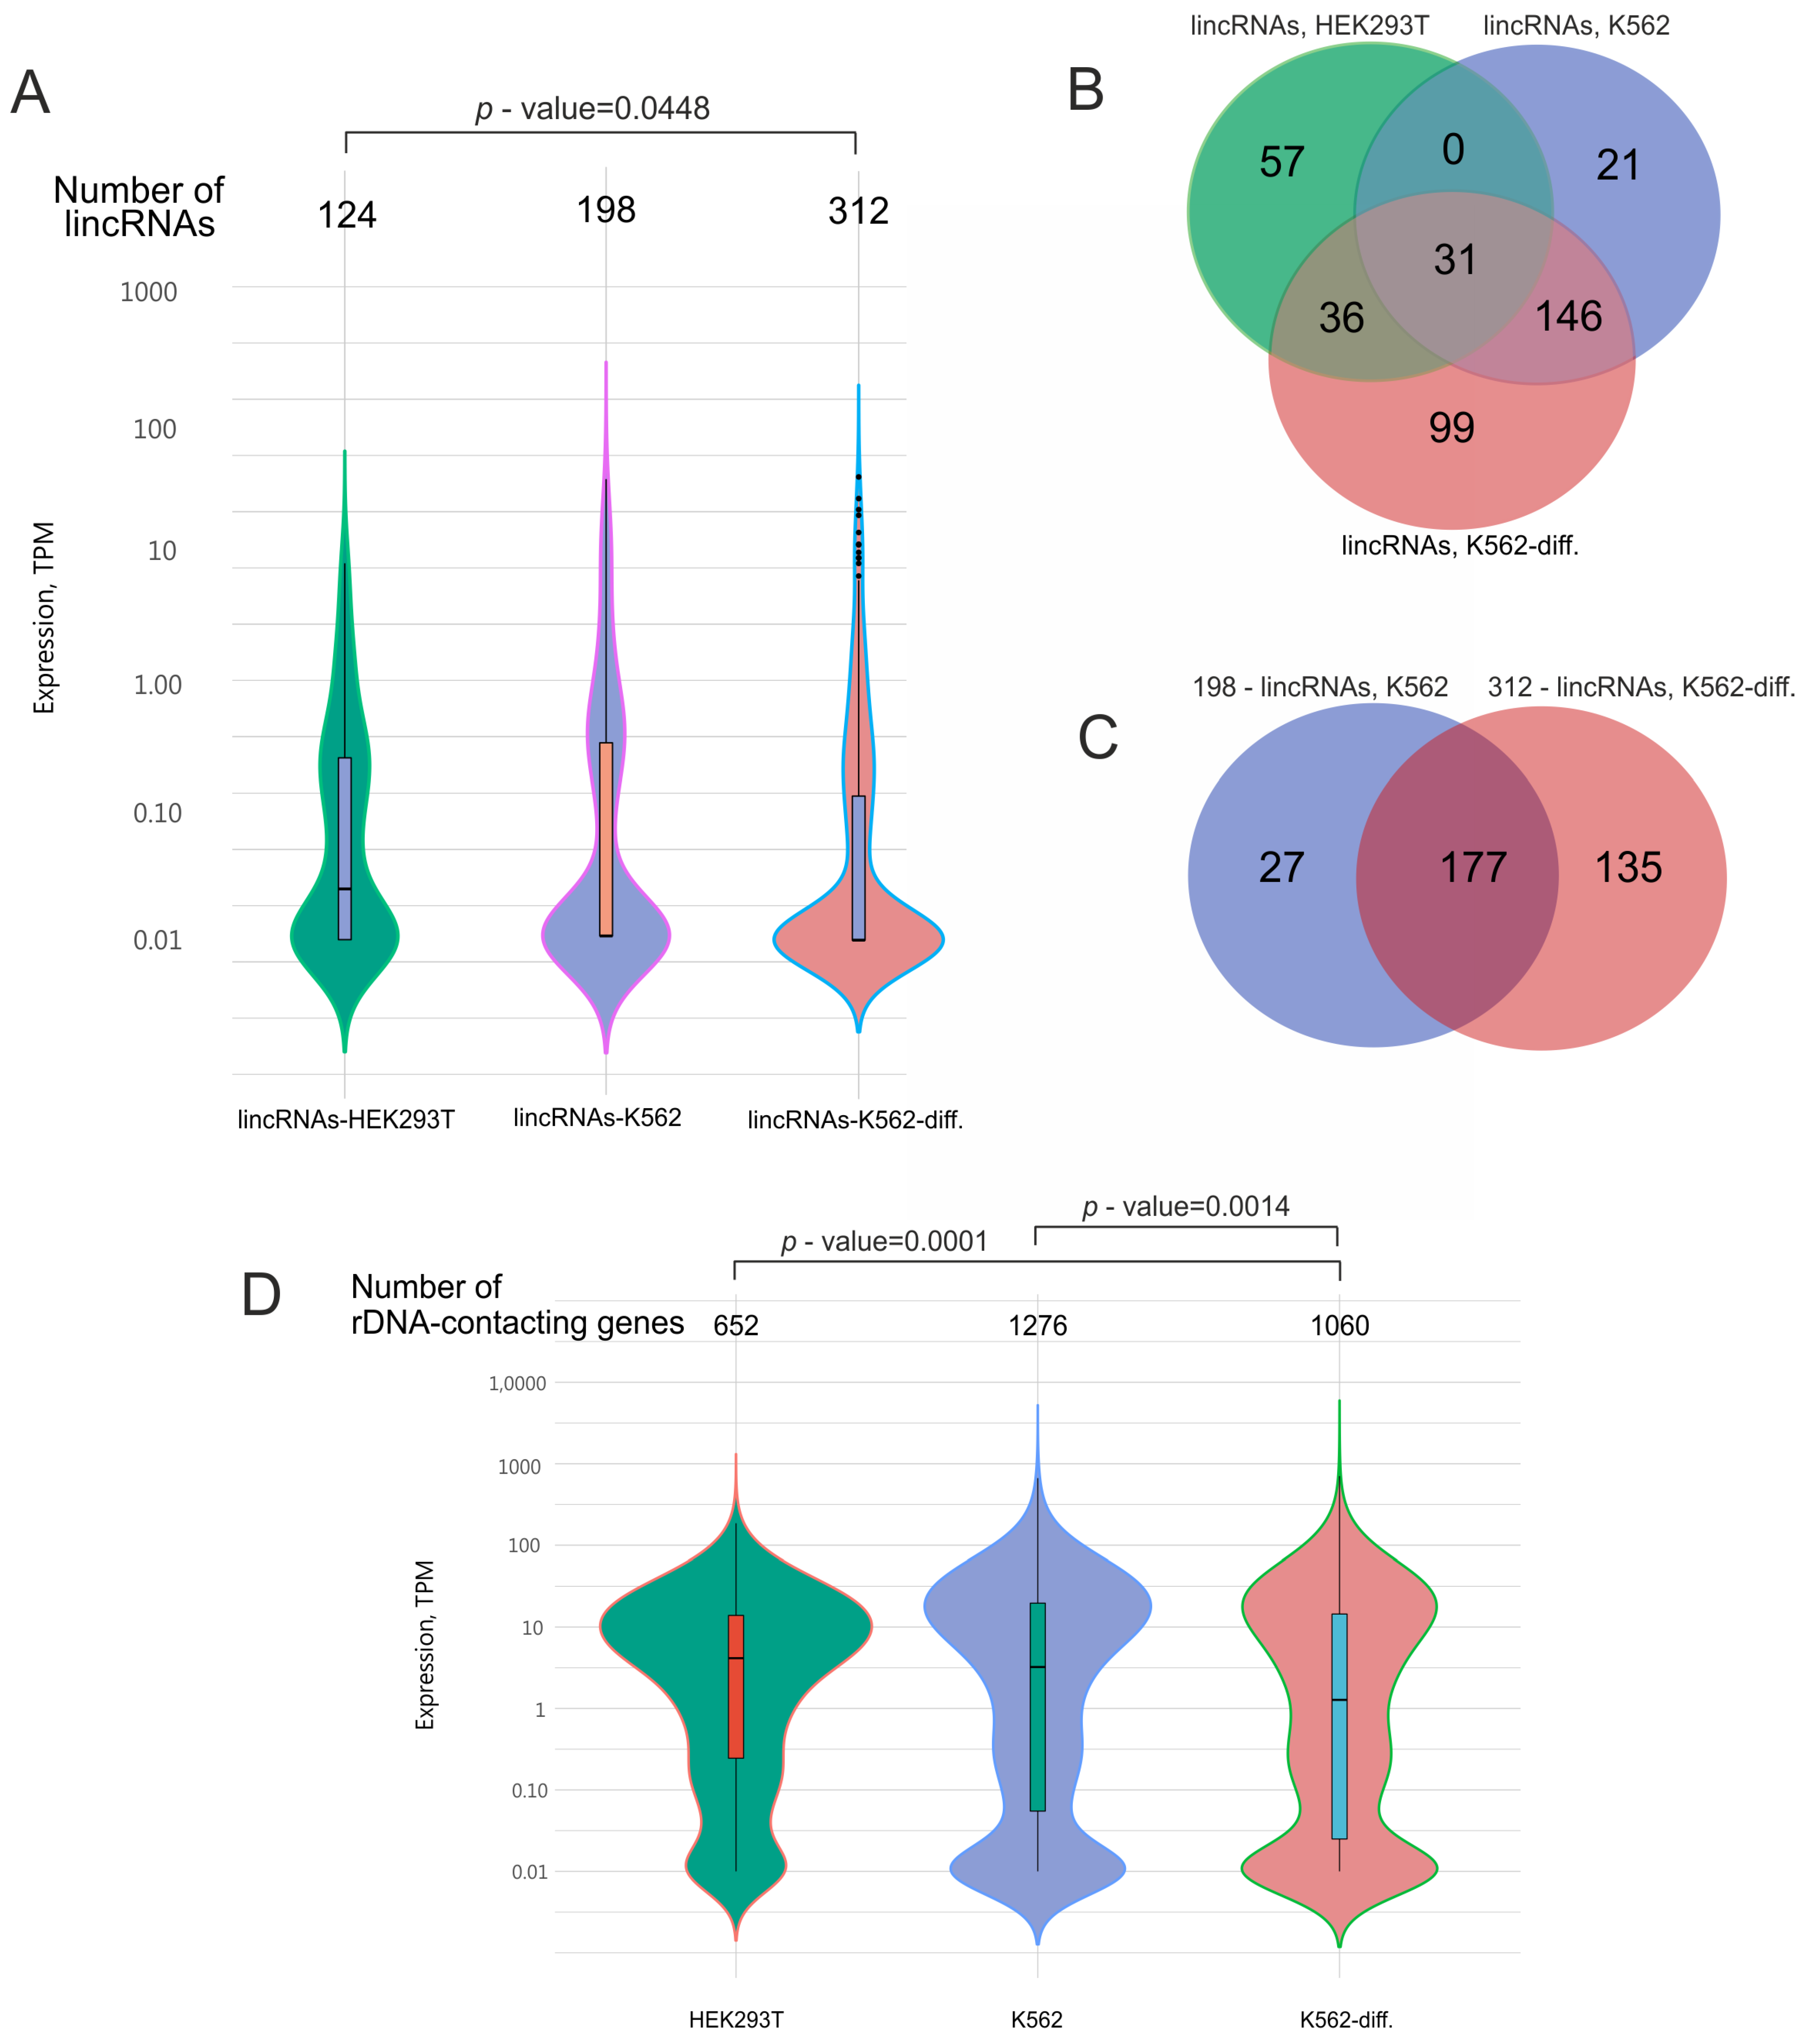
In our study, we detected 634 lincRNAs (Figure 3A, Table S10) that were co-expressed with rDNA-contacting genes in HEK293T cells and in initial or differentiated K562 cells. Our data indicate that about half of the genes detected in HEK293T cells were also present in K562 cells (Figure 1B). Hence, we expected that these cells would also share many lincRNA species.

Figure 3.
Analysis of lincRNAs that are co-expressed in HEK293T cells and K562 cells before and after induced differentiation (K562-diff.). (A) Expression levels of the lincRNAs. The width in each violin curve corresponds to the number of corresponding genes in a region. (B) Overlapping lincRNA species that are co-expressed with rDNA-contacting genes in HEK293T cells (124 lincRNA species, corresponding to 652 rDNA-contacting genes), initial K562 cells (198 lincRNA species, corresponding to 1276 rDNA-contacting genes), and differentiating K562 cells (312 lincRNA species, corresponding to 1060 rDNA-contacting genes). The list of corresponding genes is shown in Table S10. (C) Overlapping lincRNA species that are co-expressed with rDNA-contacting genes in initial K562 cells (198 lincRNA species, corresponding to 1276 rDNA-contacting genes) and differentiating K562 cells (312 lincRNA species, corresponding to 1060 rDNA-contacting genes). (D) Expression levels of rDNA-contacting genes that are co-expressed with the corresponding lincRNAs indicated in (A). p-values were assessed as described in Methods.
Figure 3B shows that HEK293T cells had 31 common lincRNAs with initial K562 cells and 67 common lincRNAs with differentiated K562 cells. As expected, K562 cells, in their initial or differentiated state, shared 177 lincRNA species, comprising about 90% of the lincRNAs detected in initial cells and about 57% of those observed in differentiated cells (Figure 3C).
The violin plots in Figure 3 show that these lincRNAs had extremely low expression compared with the expression levels of the corresponding rDNA-contacting genes. For example, the median expression of lincRNAs was more than 10 times lower than that of rDNA-contacting genes. This may reflect the different roles of non-coding and coding RNA and suggests that regulatory RNA is not required in large amounts.
2.5. Co-Localization of rDNA-Contacting Genes and Co-Expressing LincRNAs
The initial aim of this study was to determine whether the reproducible inter-chromosomal contacts of particular sets of developmental genes with nucleoli in every cell cycle could be RNA-mediated. One conceivable way for such an RNA guiding mechanism to function involves the close chromosomal neighborhood of genes for both rDNA-contacting genes and co-expressing lincRNAs. In this case, lincRNAs could directly (by way of complementary short regions—seeds—with RNAs located around nucleoli) or indirectly (via a phase separation mechanism) shape contacts with nucleoli and tether the corresponding developmental genes to rDNA clusters. Therefore, we searched for supposed correlations between residing sites of rDNA-contacting genes and corresponding lincRNAs. Recently, a tool for the genome-wide study of colocalization between genomic stretches was described: the Genome Track Colocalization Analyzer (GTCA) [17].
We assessed the colocalization of lincRNAs from the LNCIpedia v.5.2 high-confidence database (see Methods) and the co-expressing rDNA-contacting genes detected in HEK293T cells, initial K562 cells, and differentiated K562 cells. Our analysis revealed statistically significant colocalization of lincRNAs with co-expressing rDNA-contacting genes for all three cell lines (IO < −0.5, p < 3.5 × 10⁻⁵; Table 4). This colocalization is represented by the lncRNAs’ centers residing within co-expressing genes at a distance of approximately one quarter of the gene length from the gene boundary (IO = −1 if the centers of colocalizing stretches coincide, IO = 0 if the centers of the first set of stretches are at the boundaries of the second set, and IO = 1 if the centers of stretches are located at the maximum possible distance from each other; see Methods). The analysis was performed using the GTCA [17], as described in Methods.
Table 4.
Colocalization of rDNA-contacting genes and co-expressing lincRNAs from the LNCIpedia high-confidence database, assessed using the Genome Track Colocalization Analyzer (Section 4.6).
This colocalization means that lincRNAs are encoded within the introns of the co-expressing rDNA-contacting genes or opposite to a gene DNA strand. We observed that about 82% of the co-expressing rDNA-contacting genes were involved in such relations with the corresponding lincRNA genes. Furthermore, using bedtools (see Methods), we identified a substantial direct overlap between the co-expressing genes and lincRNAs from the LNCIpedia database: 87.8% for HEK293T cells, 85.0% for initial K562 cells, and 86.5% for differentiated K562 cells. These results suggest that lincRNA genes and rDNA-contacting genes are physically linked and that this coupling may reflect their functional connection. This organization supports our view that lincRNAs have a targeting role in inter-chromosomal interactions of developmental genes with nucleoli.
3. Discussion
3.1. Co-Expression of rDNA-Contacting Genes and Numerous LincRNAs Suggests Their Functional Interaction
We accidentally revealed the statistically significant (p-value up to 10−7) co-expression of the sets of rDNA-contacting genes from HEK293T and K562 cells with multiple lincRNAs during our analysis of the expression of rDNA-contacting genes (Tables S1–S3). Our interest in this finding increased when we observed that the random groups of human genes of the same size did not exhibit such a correlation. The mere occurrence of active coding and non-coding genes at the same time and in the same cells (co-expression) strongly suggests the possibility of RNA-mediated interactions between them. This co-expression was very intriguing to us, as we recently searched for possible mechanisms behind specific inter-chromosomal interactions of developmental genes with nucleoli.
There are overlapping groups of rDNA-contacting genes corresponding to different lincRNAs. Each gene has more than one corresponding lincRNA. Nevertheless, 158 repressed genes and 374 activated genes (Figure 2) had only one common lincRNA (Figure S1). This means that different lincRNAs could be associated with silent and active genes. Moreover, differentiated K562 cells are associated with a large number of new lincRNAs, as compared with the initial cells (Figure 3). Taken together, these data strongly suggest that there is a functional link between rDNA-contacting developmental genes and this class of non-coding RNAs.
3.2. Putative LincRNA-Mediated Mechanisms Guiding Particular rDNA-Contacting Genes toward Nucleoli
Different classes of non-coding RNAs serving as navigator molecules have been studied for decades. Small siRNAs, piRNAs, and miRNAs are guides that attack cognate RNAs in complexes with proteins (RISC) [18,19]. Enhancer RNAs (eRNAs) are longer molecules, up to 1000 nt long, that often act locally in the proximity of corresponding genes, may even originate from foreign DNA located close to enhancer sequences, and work efficiently with target promoters [20]. Unlike eRNAs, lincRNAs are transcribed from special non-coding genes, which are often located in intergenic regions.
Our findings of both preferred co-expression and colocalization of rDNA-contacting genes and lincRNA genes in human cells suggest that lincRNAs might serve as guide molecules to drive genomic regions possessing developmental genes toward nucleoli. We suppose that the short complementary sequences in lincRNAs, resembling seeds in miRNAs, could be complementary to short stretches in nascent rRNA molecules and, in this way, could recognize nucleoli. A preliminary search revealed complementary sequences between different lincRNAs associated with rDNA-contacting genes and different sense and antisense rRNAs, including pRNA, PAPAS, ETS, and others (a detailed analysis will be published separately). Both the co-expression and colocalization of rDNA-contacting genes and particular lincRNAs suggest their physical interaction, while the presence of short sequences that are complementary to rDNA or its transcripts in these lincRNAs additionally suggests the guidance of corresponding genomic regions toward nucleoli. The important property of these sets of genes of shaping frequent contacts with nucleoli is also strong evidence in favor of such guidance.
It was proposed that nucleoli might form liquid–liquid phase separation condensates containing activators or repressors of transcription, which could be involved in the regulation of developmental genes [9,21]. It is known that different chromosomal regions in contact with nucleoli are decorated by broad H3K27ac marks [4,9]. These marks correspond to liquid–liquid phase separation condensates [10,11]. Our finding that different lincRNA species are connected with either silent or active genes (Figure 2A and Figure S1) might indicate that different sets of lincRNAs could guide developmental genes toward different condensates containing activators or repressors of transcription. We suppose that nucleoli shape numerous condensates around them. Thereafter, the navigation of particular chromosomal regions by specific lincRNAs toward nucleoli and, hence, to these condensates provides the mechanism for the concerted co-expression of numerous developmental genes [7,22].
Currently, we are addressing several questions raised in this study by analyzing individual rDNA-contacting genes and corresponding lincRNAs, including detailed research on whether sequences in lincRNAs complementary to rDNA transcripts are capable of navigating genetic reporter constructs toward nucleoli (these data will be published separately).
4. Materials and Methods
4.1. Cell Culture Growth and Induction of Differentiation with Hemin
Human leukemia K562 cells were obtained from the American Type Culture Collection (ATCC, Manassas, VA, USA). The cells were grown in RPMI 1640 media (PanEco, Moscow, Russia) supplemented with heat-inactivated fetal calf serum (HyClone, Logan, UT, USA), 2 mM glutamine, 250 u/mL penicillin, and 250 μg/mL streptomycin (PanEco, Russia) at a temperature of 37 °C in a humidified atmosphere containing 5% CO2. Hemin (50 μM, neoFroxx, Einhausen, Germany) was added to the medium to induce erythroid differentiation, as previously described [23], and cells were incubated further for 108 h. At this concentration, the drug did not affect cell proliferation.
HEK293T cells were grown in DMEM with 10% FBS in a humidified incubator at 37 C and 5% CO2 to 80% confluency.
4.2. The 4C-rDNA Procedure
The DNA samples used for circular chromosome conformation capture (4C) experiments were isolated according to a previously described procedure [4]. The cells were then fixed in 1.5% formaldehyde, and the nuclei were isolated. Then, digestion with a 6-cutter EcoRI enzyme and the ligation of extensively diluted DNA to favor intramolecular ligations were performed. To shorten the ligated DNA fragments, digestion with a 4-cutter FaeI endonuclease was performed, followed by the ligation of diluted DNA samples to favor circularization and minimize dimerization. The primers 5′ TCTTTGAAAAAAATCCCAGAAGTGGT 3′ and 5′ AAGTCCAGAAATCAACTCGCCAGT 3′ for 4C-rDNA were selected inside the intergenic spacer (IGS) in rDNA genes, as previously described [9]. The final DNA samples were used for the preparation of DNA libraries, which were subjected to deep sequencing: for the K562 cell line, using Illumina HiSeq 2500 Rapid v2 (Illumina, San Diego, CA, USA) with 150 nt long paired-end reads, and for the HEK293T cell line, using Illumina HiSeq 1500 (Illumina, San Diego, CA, USA) with 250 nt long reads. The 4C-rDNA raw data corresponding to two pairs of biological replicates, initial and differentiated K562 cells, were deposited under accession number GSE232392. The 4C-rDNA raw data corresponding to HEK293T cell replicates were deposited under accession number GSE121413.
4.3. Mapping and Processing of 4C-rDNA 4C Data
The raw reads and processed mappings of K562 cells were uploaded to the GEO database under accession no. GSE232392. We obtained the following read numbers: K562 white/untreated cells (17,831,199 for replicate 1 and 18,964,663 for replicate 2) and K562-diff./hemin-treated cells (11,110,278 for replicate 1 and 11,603,232 for replicate 2). The raw reads and processed mappings of HEK293T cells were uploaded to the GEO database under accession no. GSE121413. We obtained 11,944,107 reads for replicate 1 and 11,642,775 for replicate 2.
K562 4C-rDNA-contacting region-specific adapters were removed separately from direct (R1) and reverse (R2) reads using cutadapt 3.5 [24], employing a multi-step procedure as previously described [7]. Only reads trimmed from 4C-specific adapters were retained for subsequent analysis, and their association with 4C was ensured. Direct and reverse reads were then re-paired using the BBTools 38.62 repair.sh script [25] with the “repair” option. Only paired-end reads were preserved for additional analysis: K562/untreated (16,848,786 for replicate 1 and 17,951,920 for replicate 2) and K562-diff./hemin-treated (10,259,396 for replicate 1 and 10,762,480 for replicate 2); all singleton reads were omitted.
For HEK293T, 4C-rDNA-contacting associated region-specific adapters were removed using cutadapt 3.5 [24], employing a two-step procedure as previously described [4]. Only reads trimmed from 4C-specific adapters were retained for further analysis: 11,722,390 for replicate 1 and 11,432,611 for replicate 2.
The alignment of all filtered reads to the genome was performed uniformly for all datasets using the bwa 0.7.17-r1188 MEM method [26]; samtools 1.14 [27] was utilized to exclude unaligned reads from the resulting BAM files (-F4 option) and subsequently re-sort them by their coordinates (samtools sort). Final mappings with genome coordinates, read counts, coverage, and sequences per mapping were obtained using ad hoc in-house Bash and Perl scripts. Replicate quality control was conducted using deepTools2 [28], as previously described [4,7]. The Pearson and Spearman correlation coefficients between all replicates were calculated, resulting in r = 0.99 for both the untreated and hemin-treated 4C-rDNA K562 datasets. The Spearman correlation coefficient values were ρ = 0.74 for the untreated and ρ = 0.83 for the hemin-treated 4C-rDNA K562 datasets. For the HEK293 datasets, the Pearson and Spearman correlation coefficients between the replicates were r = 0.99 and ρ = 0.92, respectively. The calculated correlation coefficients indicate that the replicates obtained during the 4C-rDNA experiments for all three datasets (untreated K562, hemin-treated K562, and HEK293T) were in good mutual agreement. Therefore, we can conclude that the results for 4C-rDNA-associated reads for all three cell lines are reliable.
An intersection of 4C-rDNA-mapped replicates was generated using an ad hoc in-house Bash script employing the intersect and merge methods from bedtools v.2.29.1 [29], as well as the partition, bedmap, and map-id-uniq methods from bedops v.2.4.40 [30]. All reads that were entirely mapped within low-complexity DFAM database regions [31] were excluded from further processing. These specific intersections were identified using the bedtools [29] intersect method with option -f 1.0.
The final output for each cell line comprised a dataset obtained by calculating the intersections between replicates, then excluding reads that were entirely mapped within DFAM regions.
The scripts and data files that were used to perform the described procedures are deposited in a public GitHub repository (https://github.com/lokapal/K562.hemin/tree/main/4C, accessed 15 March 2024).
4.4. Quantification of 4C-rDNA-Associated Genes
As described in Section 4.2, we used the 6-cutter EcoRI enzyme in the 4C-rDNA experiments. This means that 4C-rDNA contacts were cut at a resolution of ±2.5 kb; therefore, each dataset was projected onto hg19/hg38 gene coordinates, with each 4C contact size/length extended to 5 kb using in-house Bash and Perl scripts employing bedtools [9]. The genomic coordinates were obtained in the form of GTF annotations from Ensembl [32]. Each 4C-rDNA-associated gene was characterized by the corresponding count of associated 4C contact reads, allowing for a ranking of the resulting gene set based on these counts. We specifically identified the most significant 4C-rDNA-associated genes, considering counts of corresponding reads exceeding 100. Consequently, we obtained final lists of 3699 and 2566 4C-rDNA-contacting genes for untreated and hemin-treated K562 cells, respectively [6], and 4920 4C-rDNA-contacting genes for HEK293T cells [4].
4.5. RNA-Seq Analysis
All three cell lines (untreated K562, hemin-treated K562, and HEK293T) were processed uniformly to obtain consistent and comparable RNA-Seq datasets. The total RNA was extracted from cells that were lysed with Trizol using a PureLink RNA Micro Kit (Invitrogen, Waltham, MA, USA) in accordance with the manufacturer’s instructions. The RNA quality was checked using a Bioanalyzer and an RNA 6000 Nano Kit (Agilent, Santa Clara, CA, USA). Poly(A)+ RNA was purified using a Dynabeads® mRNA Purification Kit (Ambion, CT, USA). The Illumina library was prepared from poly(A)+ RNA with a NEBNext® Ultra™II RNA Library Prep Kit for Illumina® (NEB, Ipswich, MA, USA), according to the manual. Sequencing was performed with a 50 bp read length. At least 10 million reads were generated for each sample.
Both the raw RNA-Seq reads and the processed gene expression values for untreated and hemin-treated K562 cells were deposited in the GEO repository under accession no. GSE232390. We obtained the following read numbers: K562/untreated cells (10,899,858 for replicate 1 and 10,110,489 for replicate 2) and K562-diff./hemin-treated cells (10,376,685 for replicate 1 and 11,214,611 for replicate 2). The RNA-Seq reads and the processed gene expression values for HEK293T cells were deposited in the GEO repository under accession no. GSE130262. The number of reads for HEK293T cells was 29,342,326 for replicate 1 and 31,029,489 for replicate 2.
The processing of RNA-Seq expression data for all three cell lines was performed uniformly as follows: Trimmomatic 0.39 [33] was applied to remove low-quality reads (Q < 22), excessively short reads (length < 20 bp), and the remaining Illumina TruSeq 3′ SE adapters with the following options: LEADING:18, TRAILING:18, SLIDINGWINDOW:4:22, MINLEN:20, and ILLUMINACLIP:TruSeq3-SE:2:30:10. The trimmed reads were accurately quantified using RSEM 1.3.1 [34] for H. sapiens Ensembl v.106 genome annotation with the following options for both replicates separately: --fragment-length-mean 255 --star --calc-ci --ci-memory 30720. The obtained expression values (TPM per gene) were averaged between replicates using an in-house R script.
The scripts and data files used to perform the described procedures were deposited in a public GitHub repository (https://github.com/lokapal/K562.hemin/tree/main/RNASeq, accessed 15 March 2024).
4.6. Assessment of Colocalization of rDNA-Contacting LincRNA Co-Expressing Genes and LincRNAs
The colocalization of 4C-rDNA-associated lincRNA co-expressing genes and lincRNAs was assessed using a recently developed tool for the genome-wide study of colocalization between genomic stretches: the Genome Track Colocalization Analyzer (GTCA) [17]. First, the nearest neighbors were determined from the positions of the stretch centers. Then, the colocalization of neighboring stretches of two datasets (A and B in the notation below) was quantitatively characterized using the index of overlapping (IO), defined as
where k refers to the k-th pair of nearest neighbors, is the distance between the centers of neighboring stretches, and ak and bk denote the lengths of these stretches. IO varies within the interval (−1, +1), where the extreme boundaries correspond to complete overlapping of stretches with coincident centers (−1) or complete non-overlapping of remote stretches (+1). The mean index of overlapping for K-many pairs in total is
and can be obtained by averaging over a particular genomic configuration, then compared against the counterpart index obtained by averaging over the simultaneous permutation of stretches A and B:
We applied the complete permutation test to avoid uncertainty in sampling. The significance of deviation between the corresponding mean values is
and can be assessed using the following normalization, since the resulting statistics proved to be close to Gaussian [17]:
where
Statistical simulations [17] revealed that ζ can be transformed to a standard Gaussian statistic, with a mean value equal to 0 and a standard deviation equal to 1, via the relevant parametrization; thus, the resulting significance of IO can be conveniently estimated using widely applied thresholds (, etc.).
The described method was implemented in GTCA, a free multi-platform command-line utility available for download at https://ancorr.eimb.ru, accessed 5 June 2024. The colocalization assessment was performed using GTCA with the LNCIpedia v.5.2 [35] high-confidence database and the parameters -pl -ps 100,000 (limiting the correlation pair size to a maximum size of 100 kb).
4.7. Analysis of Gene Distribution and Expression Levels
Given that gene expression datasets do not conform to a normal distribution [36], a non-parametric statistical test should be used to compare the distributions of two expression datasets. We previously validated the suitability of the non-parametric, independent, two-group Mann–Whitney U-test for this purpose [17]. Consequently, we applied the Mann–Whitney U-test to assess whether different gene expression subsets could originate from the same distribution. The test revealed that some expression datasets did not originate from the same distribution and were statistically independent. Multiple tests were computed with Holm’s (FWER) correction [37] for multiple comparisons using an R script employing the standard built-in pairwise.wilcox.test() function.
All violin plots were generated using ad hoc in-house R scripts and the following libraries: readr, dplyr [38], powerjoin, ggplot2 [39], hrbrthemes, scales, ggsci, plyranges [40], tidyr, and stringr.
Supplementary Materials
The supporting information can be downloaded at: https://www.mdpi.com/article/10.3390/ijms25126333/s1.
Author Contributions
N.A.T. conceived and designed the experiments; N.A.T., I.R.A., E.S.K., A.N.K. and V.N.L. performed the experiments; N.A.T., Y.V.K., G.I.K. and V.R.C. analyzed the data; Y.V.K. designed the software used in the analysis; N.A.T. contributed with the reagents/materials/analysis tools; N.A.T., Y.V.K. and V.R.C. wrote the paper. All authors have read and agreed to the published version of the manuscript.
Funding
This work was supported by a grant from the Ministry of Science and Higher Education of the Russian Federation (grant no. 124032100001-4).
Institutional Review Board Statement
Not applicable.
Informed Consent Statement
Not applicable.
Data Availability Statement
4C-rDNA experimental datasets are available in GEO database for K562 cells and HEK293T cells under Accession Numbers GSE232392 and GSE121413, respectively. RNA-Seq experimental datasets are available in GEO database for K562 cells and HEK293T cells under Accession Numbers GSE232390 and GSE130262, respectively.
Acknowledgments
We thank Y.N. Toropchina for the technical assistance. We are thankful to the Center for Precision Genome Editing and Genetic Technologies for Biomedicine for access to the computer resources facilitating the conduct of this study.
Conflicts of Interest
The authors declare no conflicts of interest.
References
- Rao, S.S.P.; Huntley, M.H.; Durand, N.C.; Stamenova, E.K.; Bochkov, I.D.; Robinson, J.T.; Adrian, L.; Sanborn, A.L.; Machol, I.; Omer, A.D.; et al. A 3D map of the human genome at kilobase resolution reveals principles of chromatin looping. Cell 2014, 159, 1665–1680. [Google Scholar] [CrossRef]
- Sarnataro, S.; Chiariello, A.M.; Esposito, A.; Prisco, A.A.; Nicodemi, M. Structure of the human chromosome interaction network. PLoS ONE 2017, 12, e0188201. [Google Scholar] [CrossRef]
- Ananiev, E.V.; Barsky, V.E.; Ilyin, Y.V.; Churikov, N.A. Localization of nucleoli in Drosophila melanogaster polytene chromosomes. Chromosoma 1981, 81, 619–628. [Google Scholar] [CrossRef]
- Tchurikov, N.A.; Fedoseeva, D.M.; Klushevskaya, E.S.; Slovohotov, I.Y.; Chechetkin, V.R.; Kravatsky, Y.V.; Kretova, O.V. rDNA Clusters Make Contact with Genes that Are Involved in Differentiation and Cancer and Change Contacts after Heat Shock Treatment. Cells 2019, 8, 1393. [Google Scholar] [CrossRef]
- Tchurikov, N.A.; Klushevskaya, E.S.; Fedoseeva, D.M.; Alembekov, I.R.; Kravatskaya, G.I.; Chechetkin, V.R.; Kravatsky, Y.V.; Kretova, O.V. Dynamics of Whole-Genome Contacts of Nucleoli in Drosophila Cells Suggests a Role for rDNA Genes in Global Epigenetic Regulation. Cells 2020, 9, 2587. [Google Scholar] [CrossRef]
- Diesch, J.; Bywater, M.J.; Sanij, E.; Cameron, D.P.; Schierding, W.; Brajanovski, N.; Poortinga, G. Changes in long-range rDNA genomic interactions associate with altered RNA polymerase II gene programs during malignant transformation. Commun. Biol. 2019, 2, 39. [Google Scholar] [CrossRef]
- Tchurikov, N.A.; Klushevskaya, E.S.; Alembekov, I.R.; Kretova, A.N.; Chechetkin, V.R.; Kravatskaya, G.I.; Kravatsky, Y.V. Induction of the Erythroid Differentiation of K562 Cells Is Coupled with Changes in the Inter-Chromosomal Contacts of rDNA Clusters. Int. J. Mol. Sci. 2023, 24, 9842. [Google Scholar] [CrossRef]
- Khan, A.; Mathelier, A.; Zhang, X. Super-enhancers are transcriptionally more active and cell type-specific than stretch enhancers. Epigenetics 2018, 13, 910–922. [Google Scholar] [CrossRef]
- Tchurikov, N.A.; Fedoseeva, D.M.; Sosin, D.V.; Snezhkina, A.V.; Melnikova, N.V.; Kudryavtseva, A.V.; Kravatsky, Y.V.; Kretova, O.V. Hot spots of DNA double-strand breaks and genomic contacts of human rDNA units are involved in epigenetic regulation. J. Mol. Cell Biol. 2015, 7, 366–382. [Google Scholar] [CrossRef]
- 1Hnisz, D.; Abraham, B.J.; Lee, T.I.; Lau, A.; Saint-André, V.; Sigova, A.A.; Hoke, H.A.; Young, R.A. Super-enhancers in the control of cell identity and disease. Cell 2013, 155, 934–947. [Google Scholar] [CrossRef]
- Sabari, B.R.; Dall’Agnese, A.; Boija, A.; Klein, I.A.; Coffey, E.L.; Shrinivas, K.; Abraham, B.J.; Hannett, N.M.; Zamudio, A.V.; Manteiga, J.C.; et al. Coactivator Condensation at Super-Enhancers Links Phase Separation and Gene Control. Science 2018, 361, eaar3958. [Google Scholar] [CrossRef]
- Kapranov, P.; Cheng, J.; Dike, S.; Nix, D.A.; Duttagupta, R.; Willingham, A.T.; Stadler, P.F.; Hertel, J.; Hackermüller, J.; Hofacker, I.L.; et al. RNA maps reveal new RNA classes and a possible function for pervasive transcription. Science 2007, 316, 1484–1488. [Google Scholar] [CrossRef]
- Carninci, P.; Kasukawa, T.; Katayama, S.; Gough, J.; Frith, M.C.; Maeda, N.; Oyama, R.; Ravasi, T.; Lenhard, B.; Wells, C.; et al. The transcriptional landscape of the mammalian genome. Science 2015, 309, 1559–1563. [Google Scholar] [CrossRef]
- Yan, L.; Yang, M.; Guo, H.; Yang, L.; Wu, J.; Li, R.; Liu, P.; Lian, Y.; Zheng, X.; Yan, J.; et al. Single-cell RNA-Seq profiling of human preimplantation embryos and embryonic stem cells. Nat. Struct. Mol. Biol. 2013, 20, 1131–1139. [Google Scholar] [CrossRef]
- Ransohoff, J.; Wei, Y.; Khavari, P. The functions and unique features of long intergenic non-coding RNA. Nat. Rev. Mol. Cell Biol. 2018, 19, 143–157. [Google Scholar] [CrossRef]
- Deforges, J.; Reis, R.S.; Jacquet, P.; Vuarambon, D.J.; Poirier, Y. Prediction of regulatory long intergenic non-coding RNAs acting in trans through base-pairing interactions. BMC Genom. 2019, 20, 601. [Google Scholar] [CrossRef]
- Kravatsky, Y.V.; Chechetkin, V.R.; Tchurikov, N.A.; Kravatskaya, G.I. Genome-Wide Study of Colocalization between Genomic Stretches: A Method and Applications to the Regulation of Gene Expression. Biology 2022, 11, 1422. [Google Scholar] [CrossRef]
- Chen, Y.A.; Aravin, A.A. Non-Coding RNAs in Transcriptional Regulation. Curr. Mol. Biol. Rep. 2015, 1, 10–18. [Google Scholar] [CrossRef]
- Bartel, D.P. Metazoan MicroRNAs. Cell 2018, 173, 20–51. [Google Scholar] [CrossRef]
- Fedoseeva, D.M.; Kretova, O.V.; Gorbacheva, M.A.; Tchurikov, N.A. Individual effects of the copia and gypsy enhancer and insulator on chromatin marks, eRNA synthesis, and binding of insulator proteins in transfected genetic constructs. Gene 2018, 641, 151–160. [Google Scholar] [CrossRef]
- Lafontaine, D.L.J.; Riback, J.A.; Bascetin, R.; Brangwynne, C.P. The nucleolus as a multiphase liquid condensate. Nat. Rev. Mol. Cell Biol. 2021, 22, 165–182. [Google Scholar] [CrossRef]
- Lachmann, A.; Torre, D.; Keenan, A.B.; Jagodnik, K.M.; Lee, H.J.; Wang, L.; Silverstein, M.C.; Ma’ayan, A. Massive mining of publicly available RNA-seq data from human and mouse. Nat. Commun. 2018, 9, 1366. [Google Scholar] [CrossRef]
- Wang, D.; Si, S.; Wang, Q.; Luo, G.; Du, Q.; Liang, Q.; Guo, X.; Zhang, G.; Feng, J.; Leng, Z. MiR-27a Promotes Hemin-Induced Erythroid Differentiation of K562 Cells by Targeting CDC25B. Cell Physiol. Biochem. 2018, 46, 365–374. [Google Scholar] [CrossRef]
- Martin, M. Cutadapt removes adapter sequences from high-throughput sequencing reads. EMBnet J. 2011, 17, 10–12. [Google Scholar] [CrossRef]
- Bushnell, B. Bbtools: A Suite of Fast, Multithreaded Bioinformatics Tools Designed for Analysis of DNA and RNA Sequence Data. 2018. Available online: https://sourceforge.net/projects/bbmap/ (accessed on 5 June 2024).
- Li, H.; Durbin, R. Fast and accurate long-read alignment with burrows-wheeler transform. Bioinformatics 2010, 26, 589–595. [Google Scholar] [CrossRef]
- Li, H.; Handsaker, B.; Wysoker, A.; Fennell, T.; Ruan, J.; Homer, N.; Marth, G.; Abecasis, G.; Durbin, R.; Genome Project Data Processing, S. The sequence alignment/map format and samtools. Bioinformatics 2009, 25, 2078–2079. [Google Scholar] [CrossRef]
- Ramirez, F.; Ryan, D.P.; Gruning, B.; Bhardwaj, V.; Kilpert, F.; Richter, A.S.; Heyne, S.; Dundar, F.; Manke, T. DeepTools2: A next generation web server for deep-sequencing data analysis. Nucleic Acids Res. 2016, 44, W160–W165. [Google Scholar] [CrossRef]
- Quinlan, A.R.; Hall, I.M. Bedtools: A flexible suite of utilities for comparing genomic features. Bioinformatics 2010, 26, 841–842. [Google Scholar] [CrossRef]
- Neph, S.; Kuehn, M.S.; Reynolds, A.P.; Haugen, E.; Thurman, R.E.; Johnson, A.K.; Rynes, E.; Maurano, M.T.; Vierstra, J.; Thomas, S.; et al. Bedops: High-performance genomic feature operations. Bioinformatics 2012, 28, 1919–1920. [Google Scholar] [CrossRef]
- Storer, J.; Hubley, R.; Rosen, J.; Wheeler, T.J.; Smit, A.F. The DFAM community resource of transposable element families, sequence models, and genome annotations. Mob. DNA 2021, 12, 2. [Google Scholar] [CrossRef]
- Martin, F.J.; Amode, M.R.; Aneja, A.; Austine-Orimoloye, O.; Azov, A.G.; Barnes, I.; Becker, A.; Bennett, R.; Berry, A.; Bhai, J.; et al. Ensembl 2023. Nucleic Acids Res. 2023, 51, D933–D941. [Google Scholar] [CrossRef]
- Bolger, A.M.; Lohse, M.; Usadel, B. Trimmomatic: A flexible trimmer for Illumina sequence data. Bioinformatics 2014, 30, 2114–2120. [Google Scholar] [CrossRef]
- Li, B.; Dewey, C.N. RSEM: Accurate transcript quantification from RNA-seq data with or without a reference genome. BMC Bioinform. 2011, 12, 323. [Google Scholar] [CrossRef]
- Volders, P.J.; Anckaert, J.; Verheggen, K.; Nuytens, J.; Martens, L.; Mestdagh, P.; Vandesompele, J. LNCIpedia 5: Towards a reference set of human long non-coding RNAs. Nucleic Acids Res. 2019, 47, D135–D139. [Google Scholar] [CrossRef]
- Liu, H.M.; Yang, D.; Liu, Z.F.; Hu, S.Z.; Yan, S.H.; He, X.W. Density distribution of gene expression profiles and evaluation of using maximal information coefficient to identify differentially expressed genes. PLoS ONE 2019, 14, e0219551. [Google Scholar] [CrossRef]
- Holm, S. A simple sequentially rejective multiple test procedure. Scand. J. Stat. 1979, 6, 65–70. [Google Scholar]
- Wickham, H.; François, R.; Henry, L.; Müller, K.; Vaughan, D. dplyr: A Grammar of Data Manipulation. R Package Version 1.1.4. 2023. Available online: https://dplyr.tidyverse.org (accessed on 5 June 2024).
- Wickham, H. ggplot2: Elegant Graphics for Data Analysis; Springer: New York, NY, USA, 2016; ISBN 978-3-319-24277-4. [Google Scholar]
- Lee, S.; Cook, D.; Lawrence, M. plyranges: A grammar of genomic data transformation. Genome Biol. 2019, 20, 4. [Google Scholar] [CrossRef]

Disclaimer/Publisher’s Note: The statements, opinions and data contained in all publications are solely those of the individual author(s) and contributor(s) and not of MDPI and/or the editor(s). MDPI and/or the editor(s) disclaim responsibility for any injury to people or property resulting from any ideas, methods, instructions or products referred to in the content. |
© 2024 by the authors. Licensee MDPI, Basel, Switzerland. This article is an open access article distributed under the terms and conditions of the Creative Commons Attribution (CC BY) license (https://creativecommons.org/licenses/by/4.0/).