
Generation and Characterization of CYP2E1-Overexpressing HepG2 Cells to Study the Role of CYP2E1 in Hepatic Hypoxia-Reoxygenation Injury

 ,
,  , and
, and 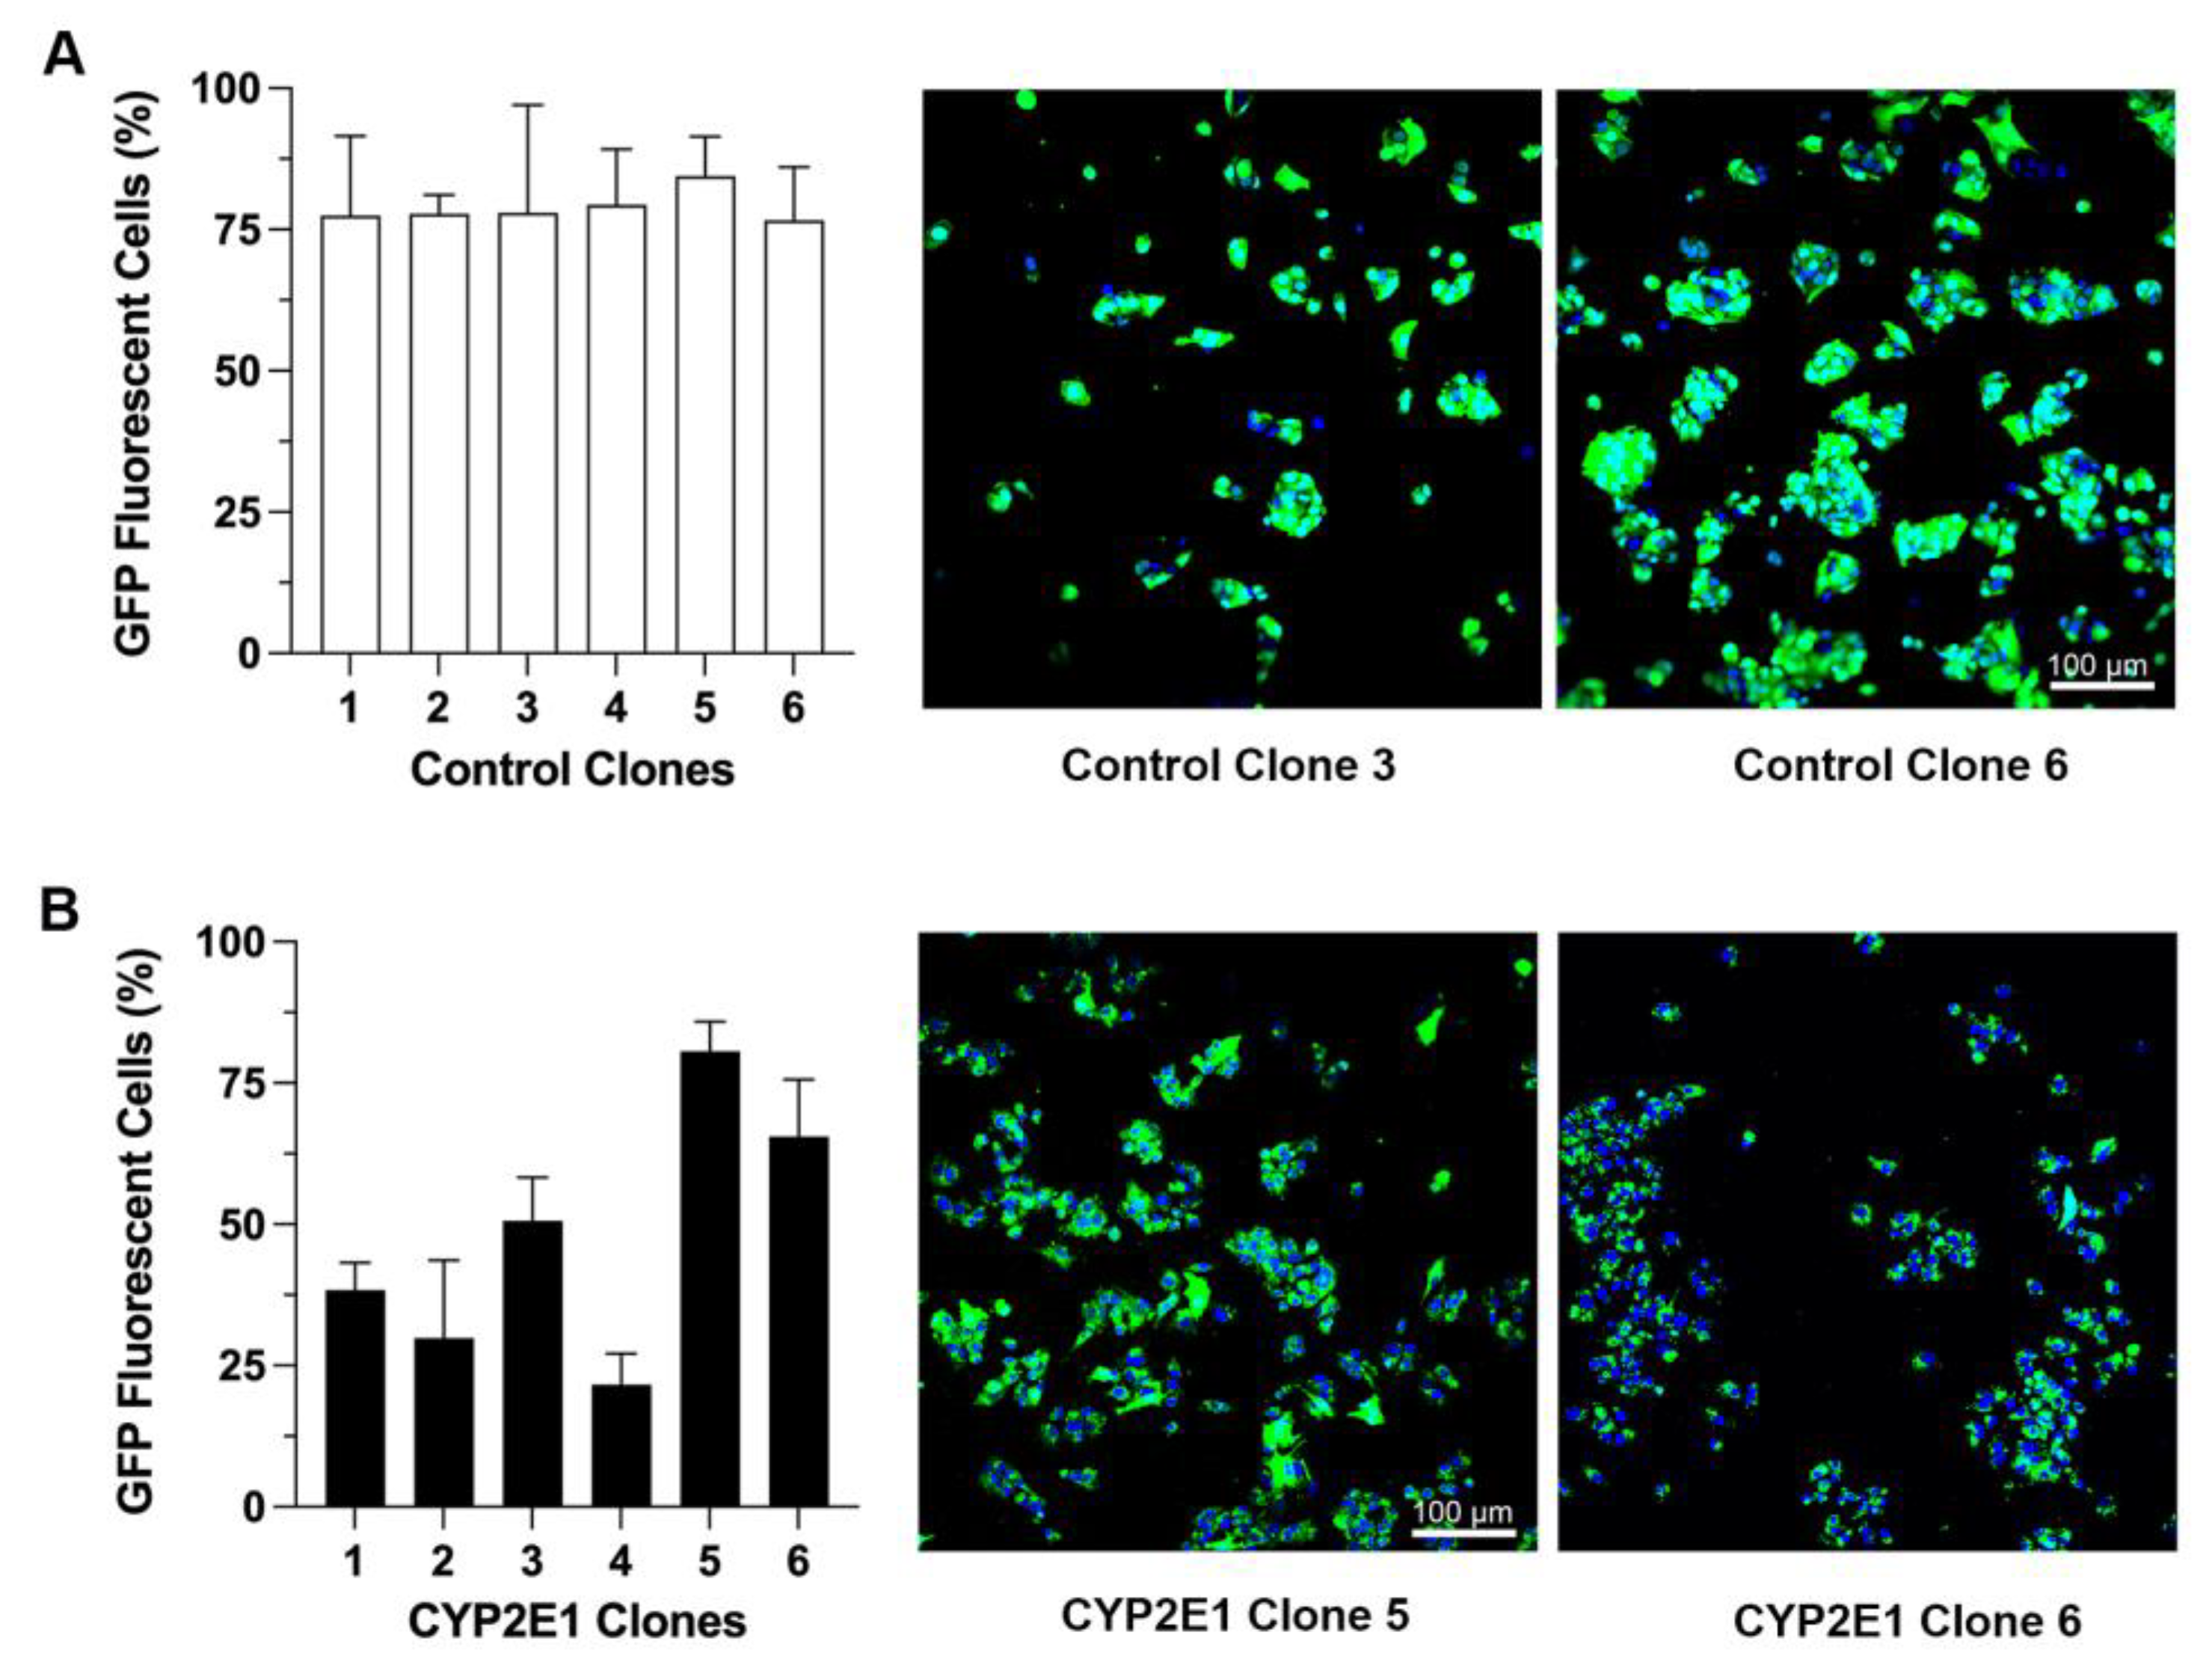
Abstract
1. Introduction
2. Results
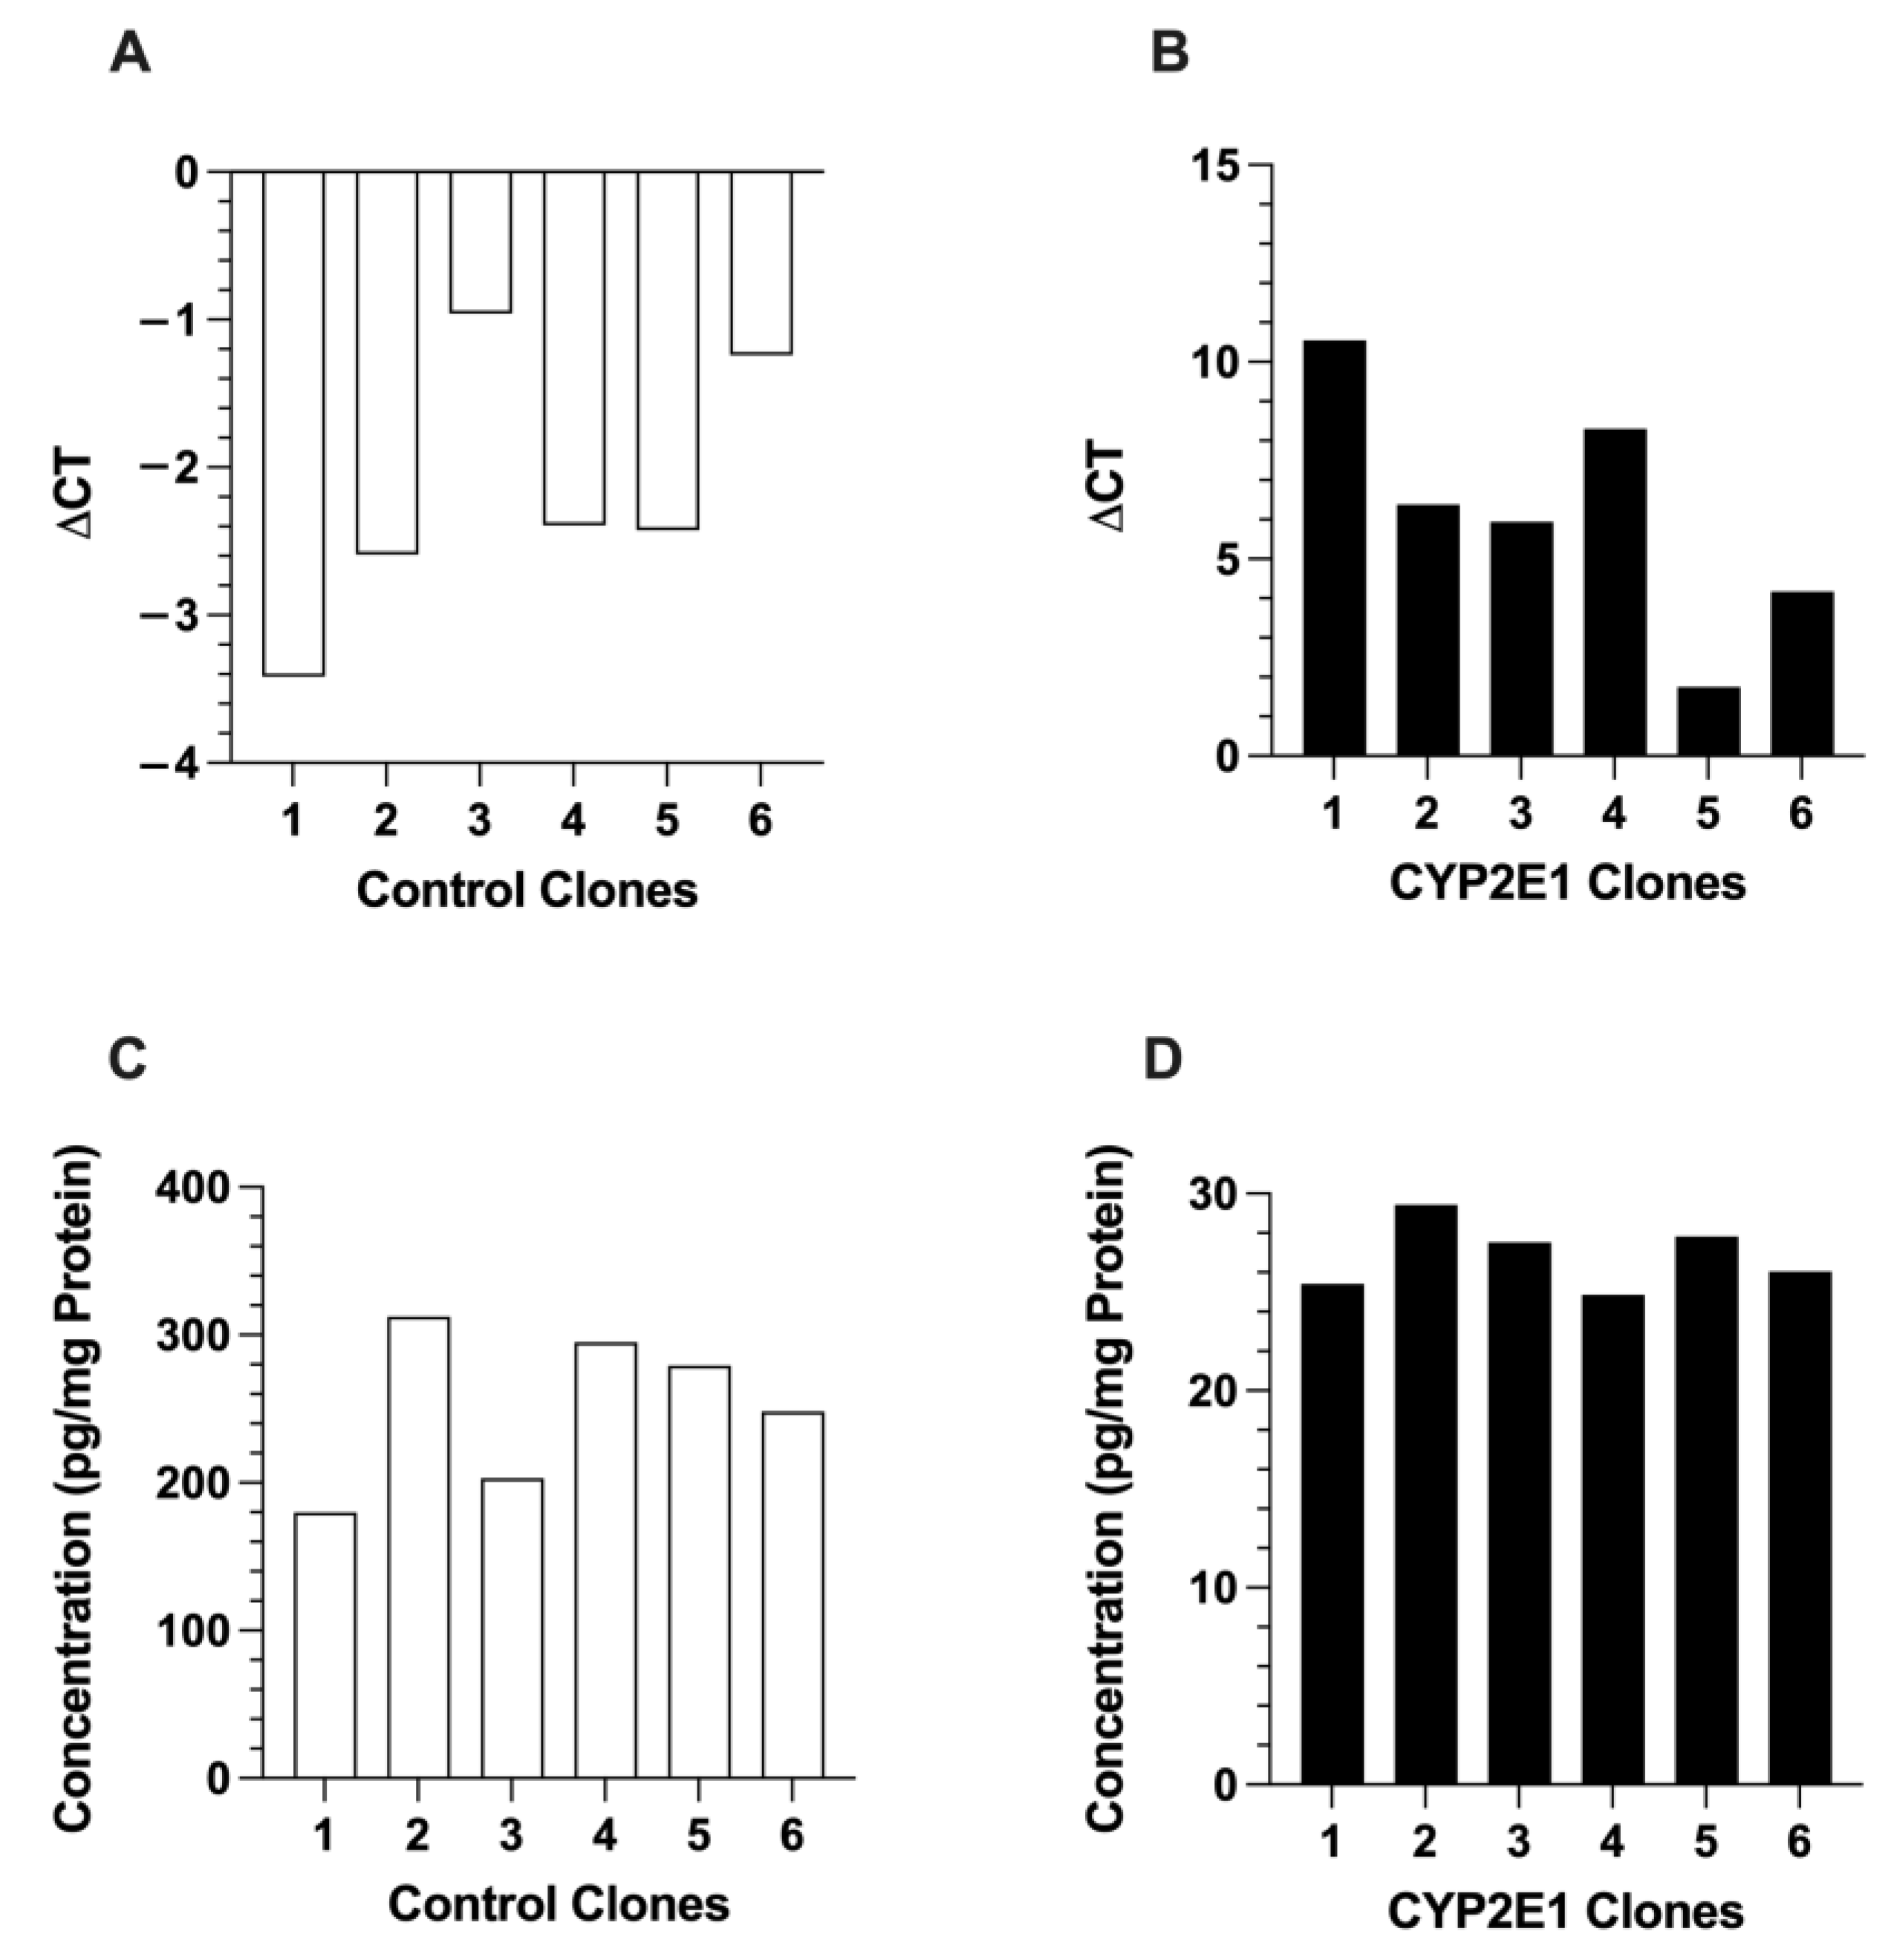
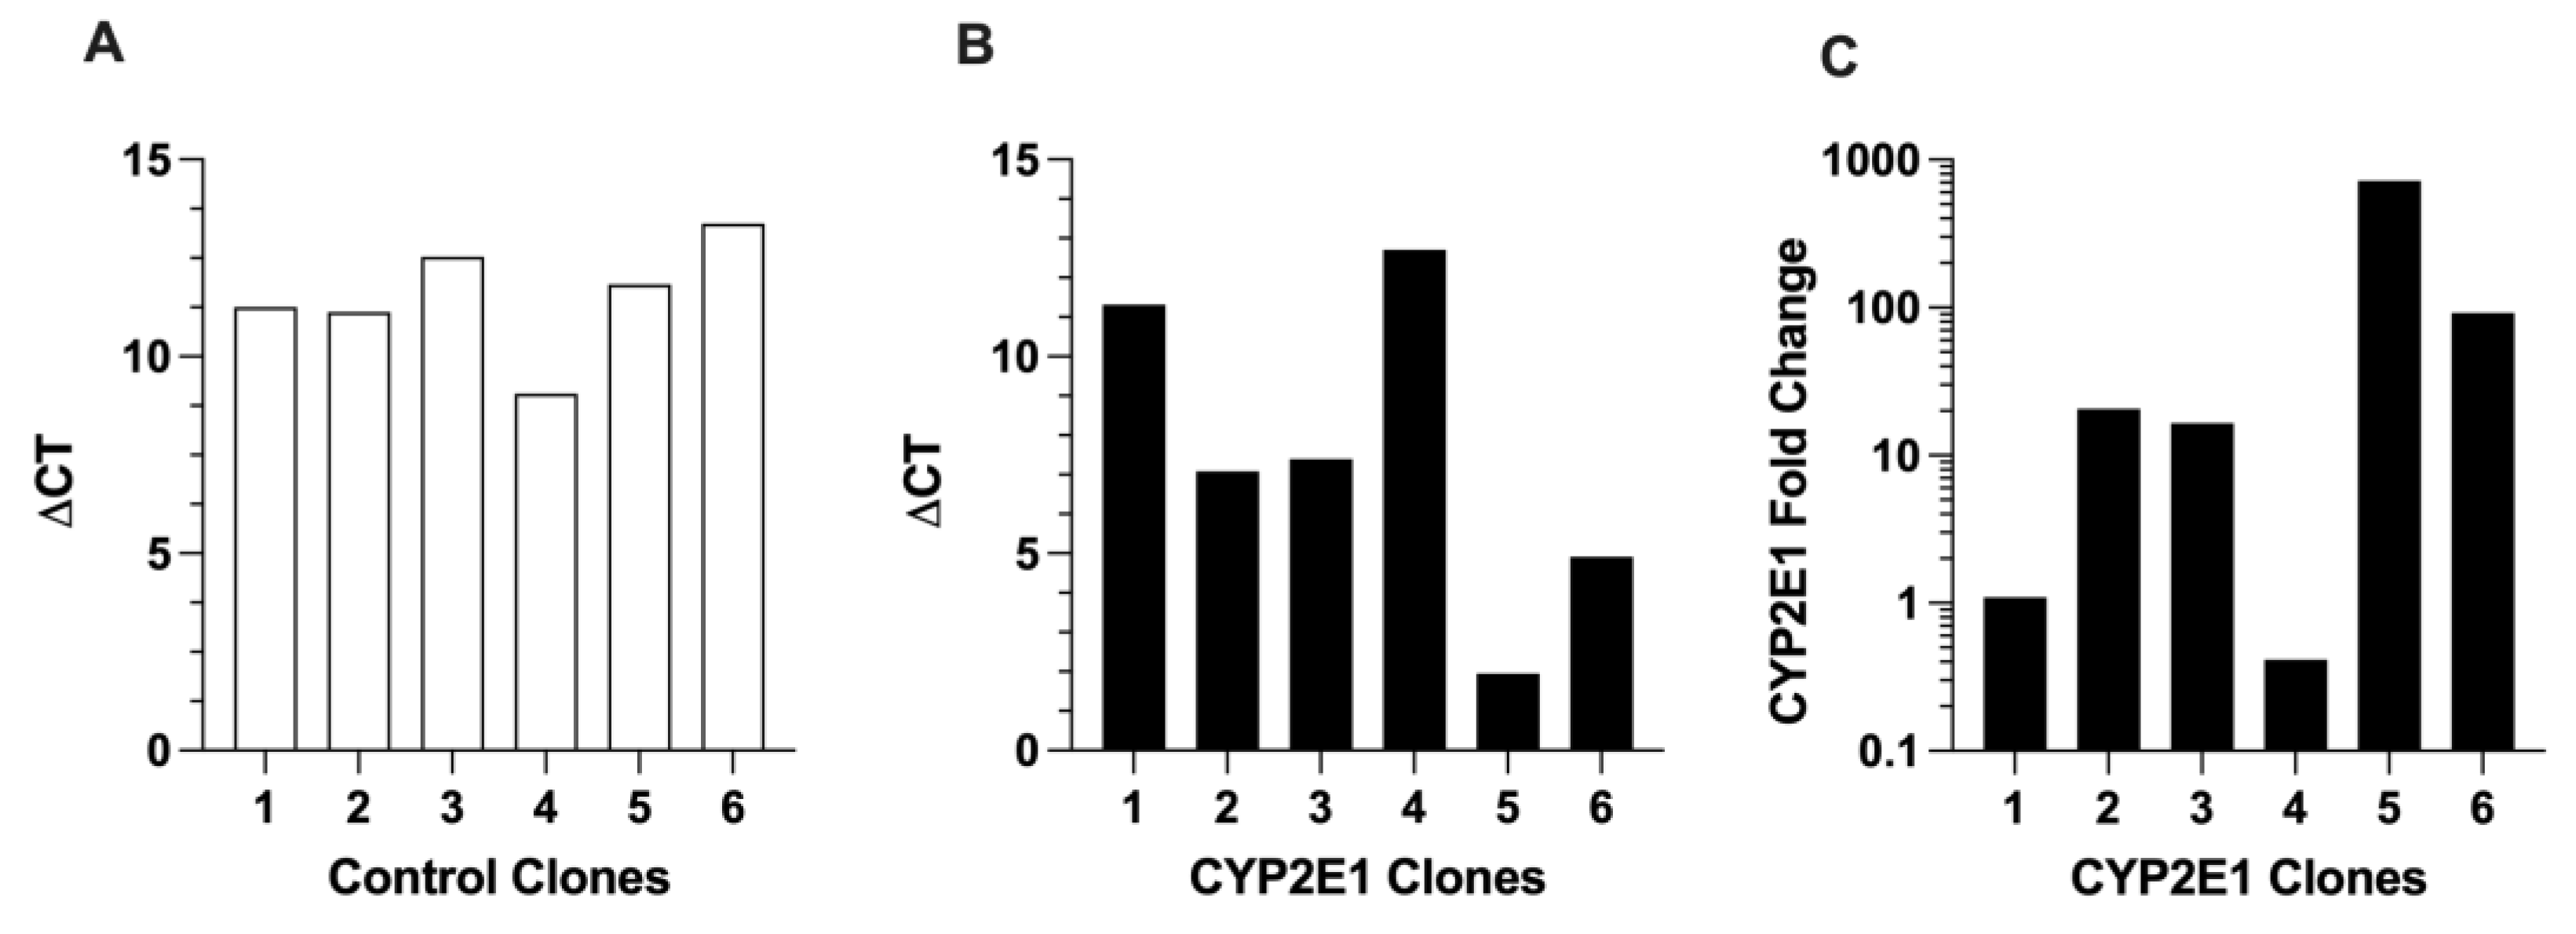
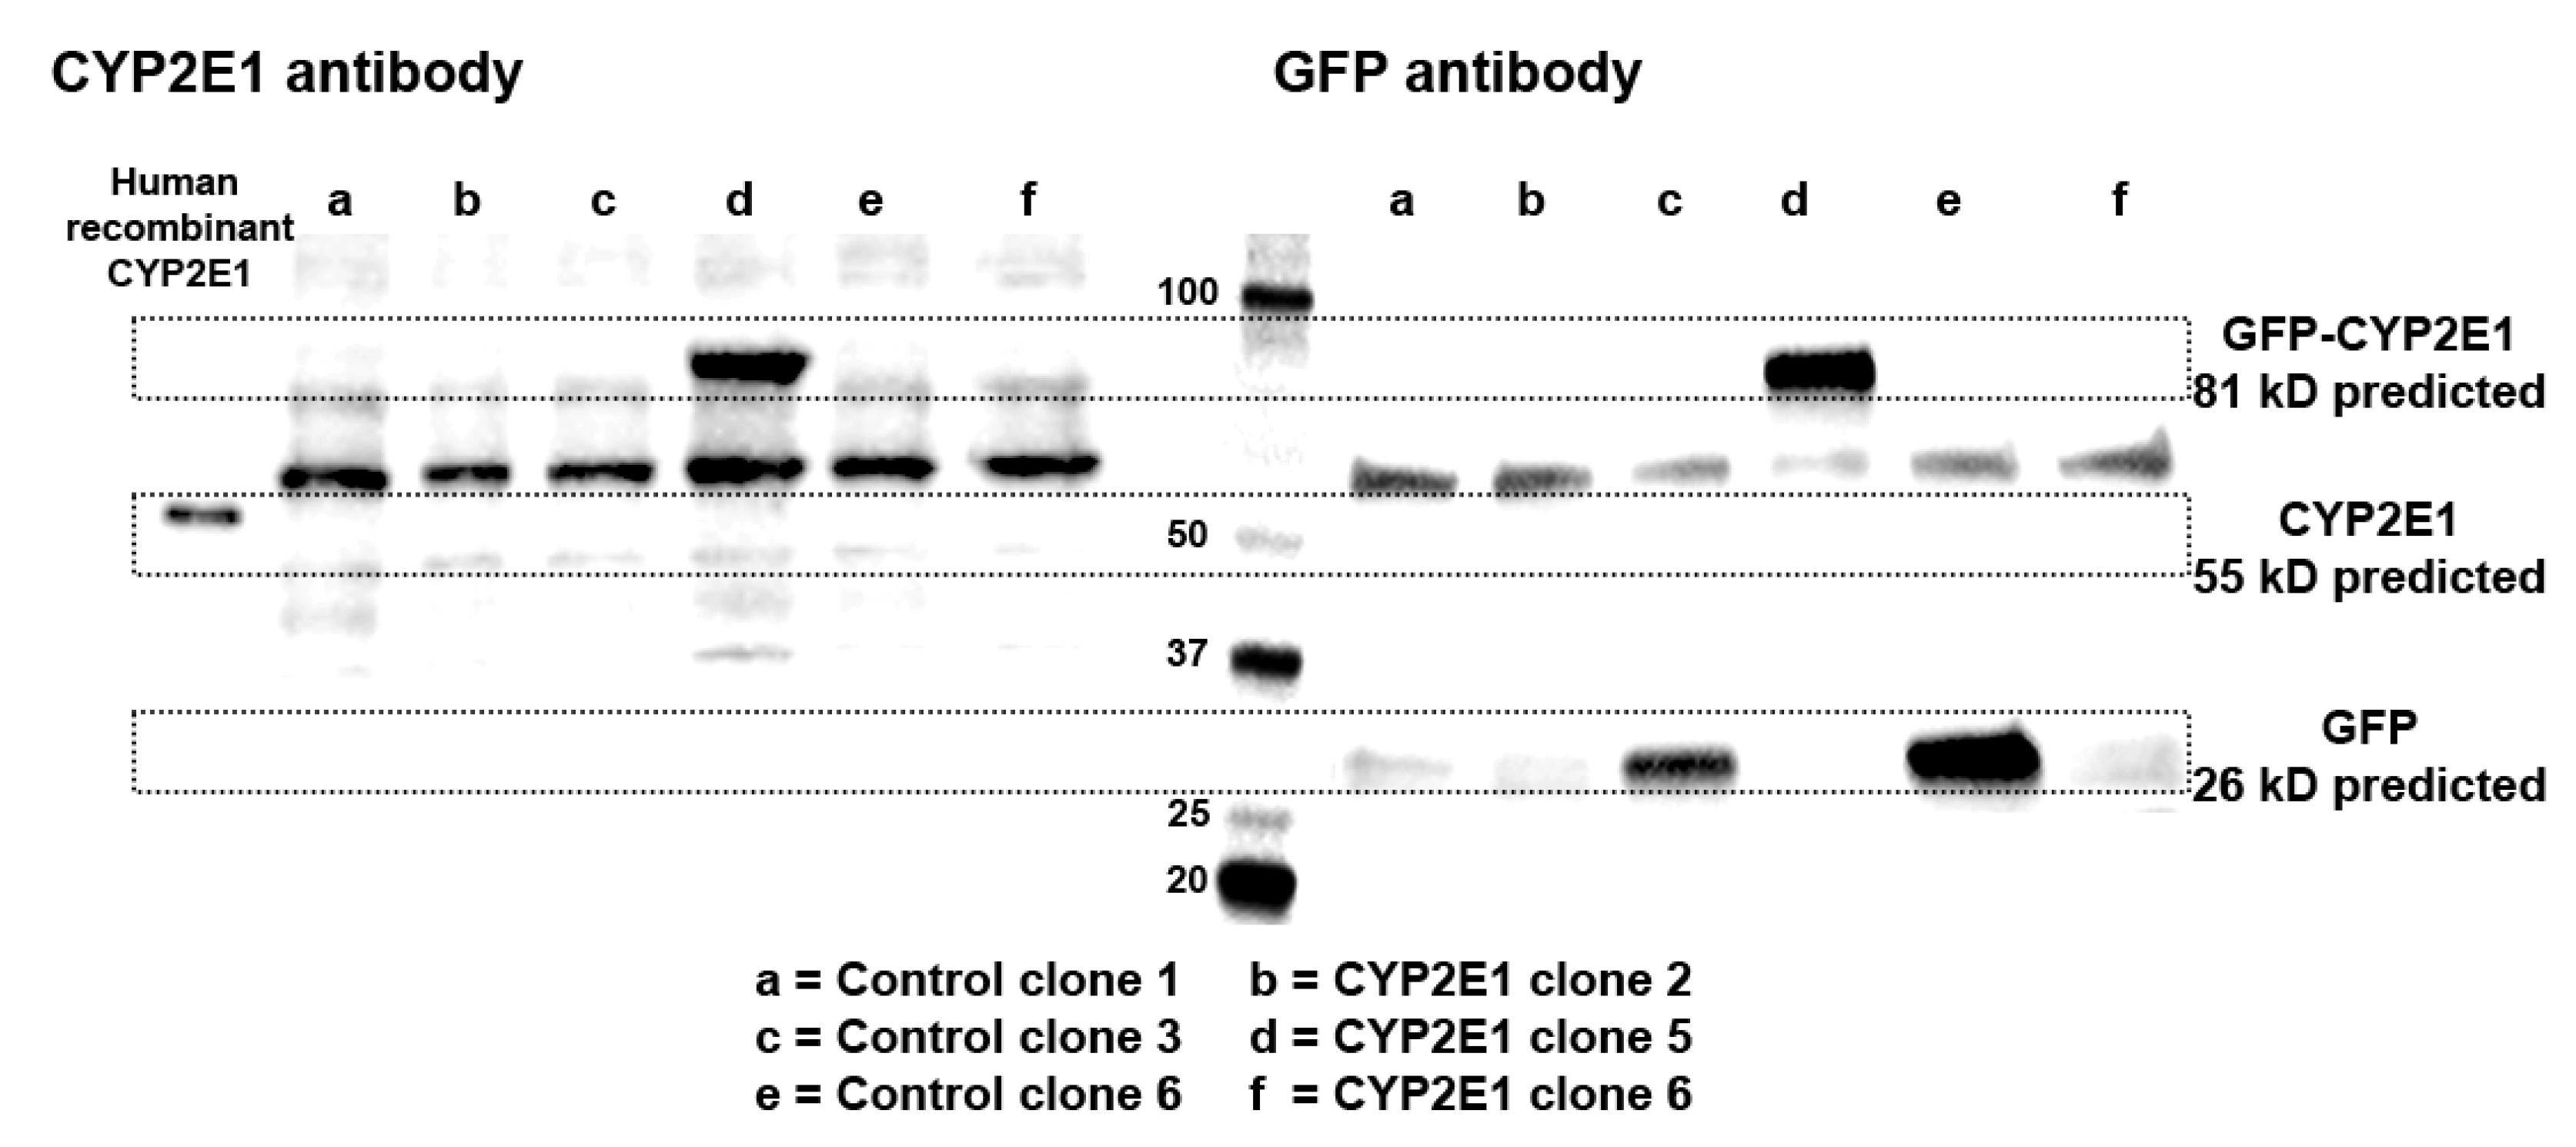
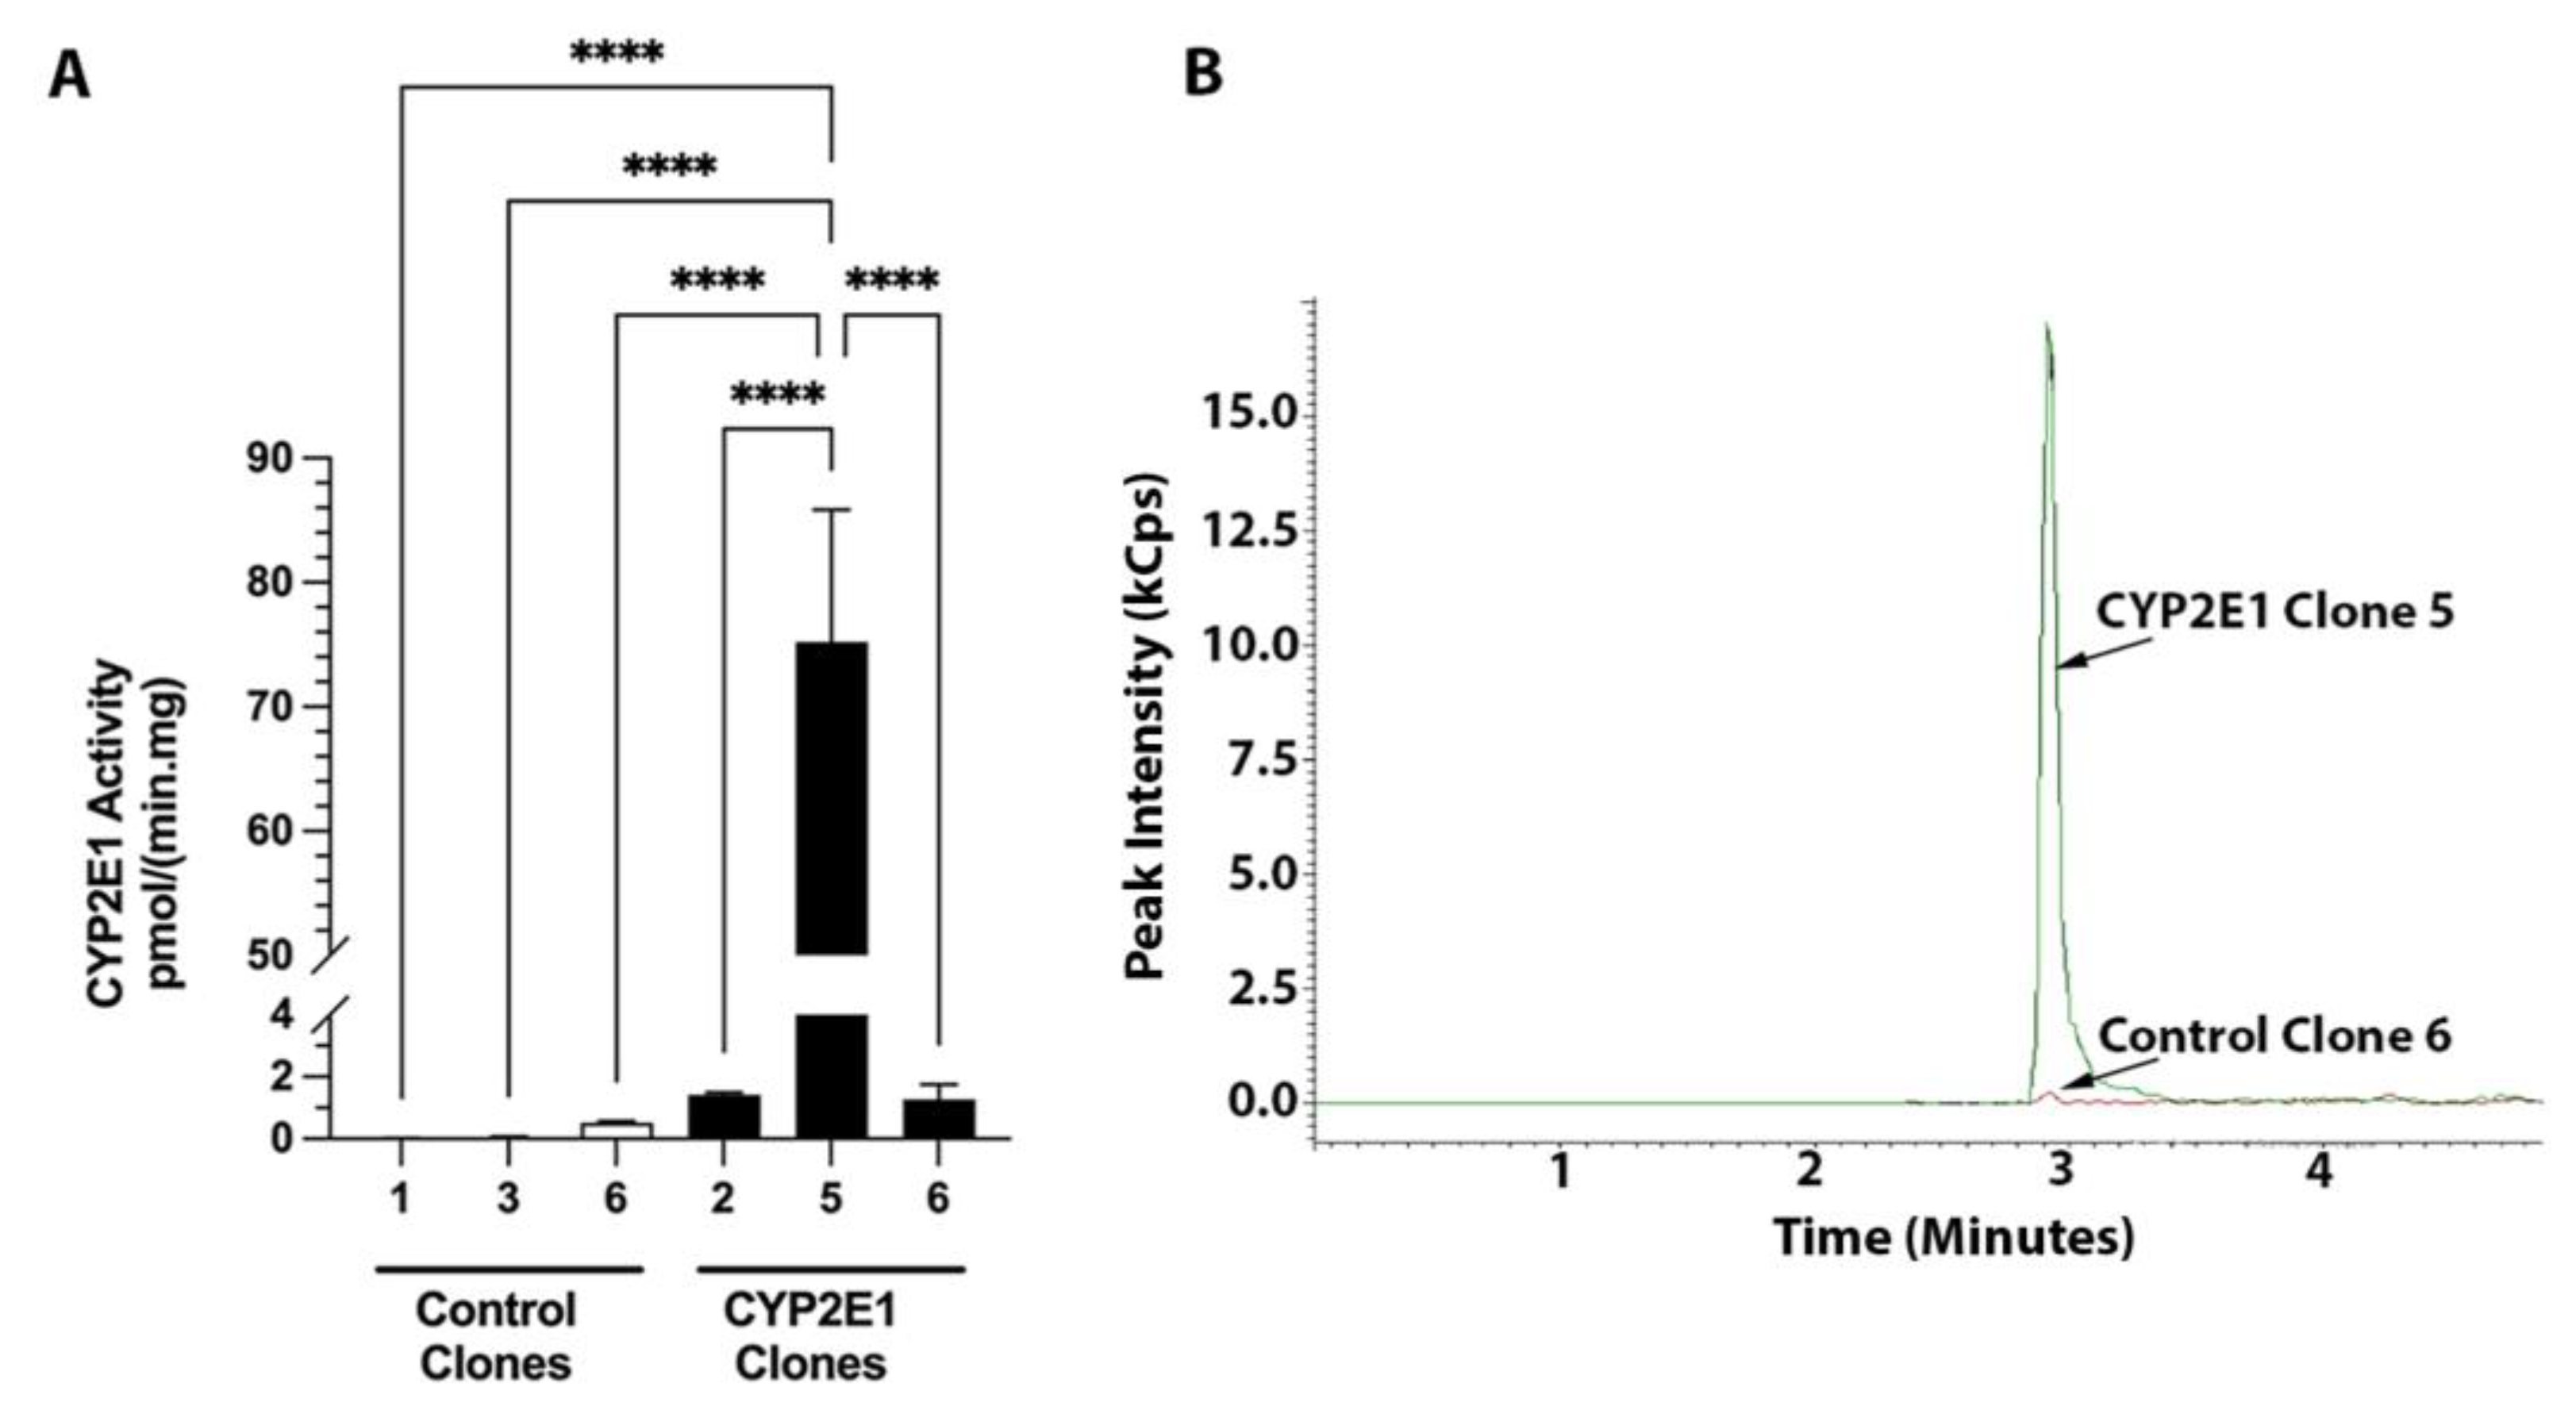
2.1. Characterization of CYP2E1-Overexpressing HepG2 Cells
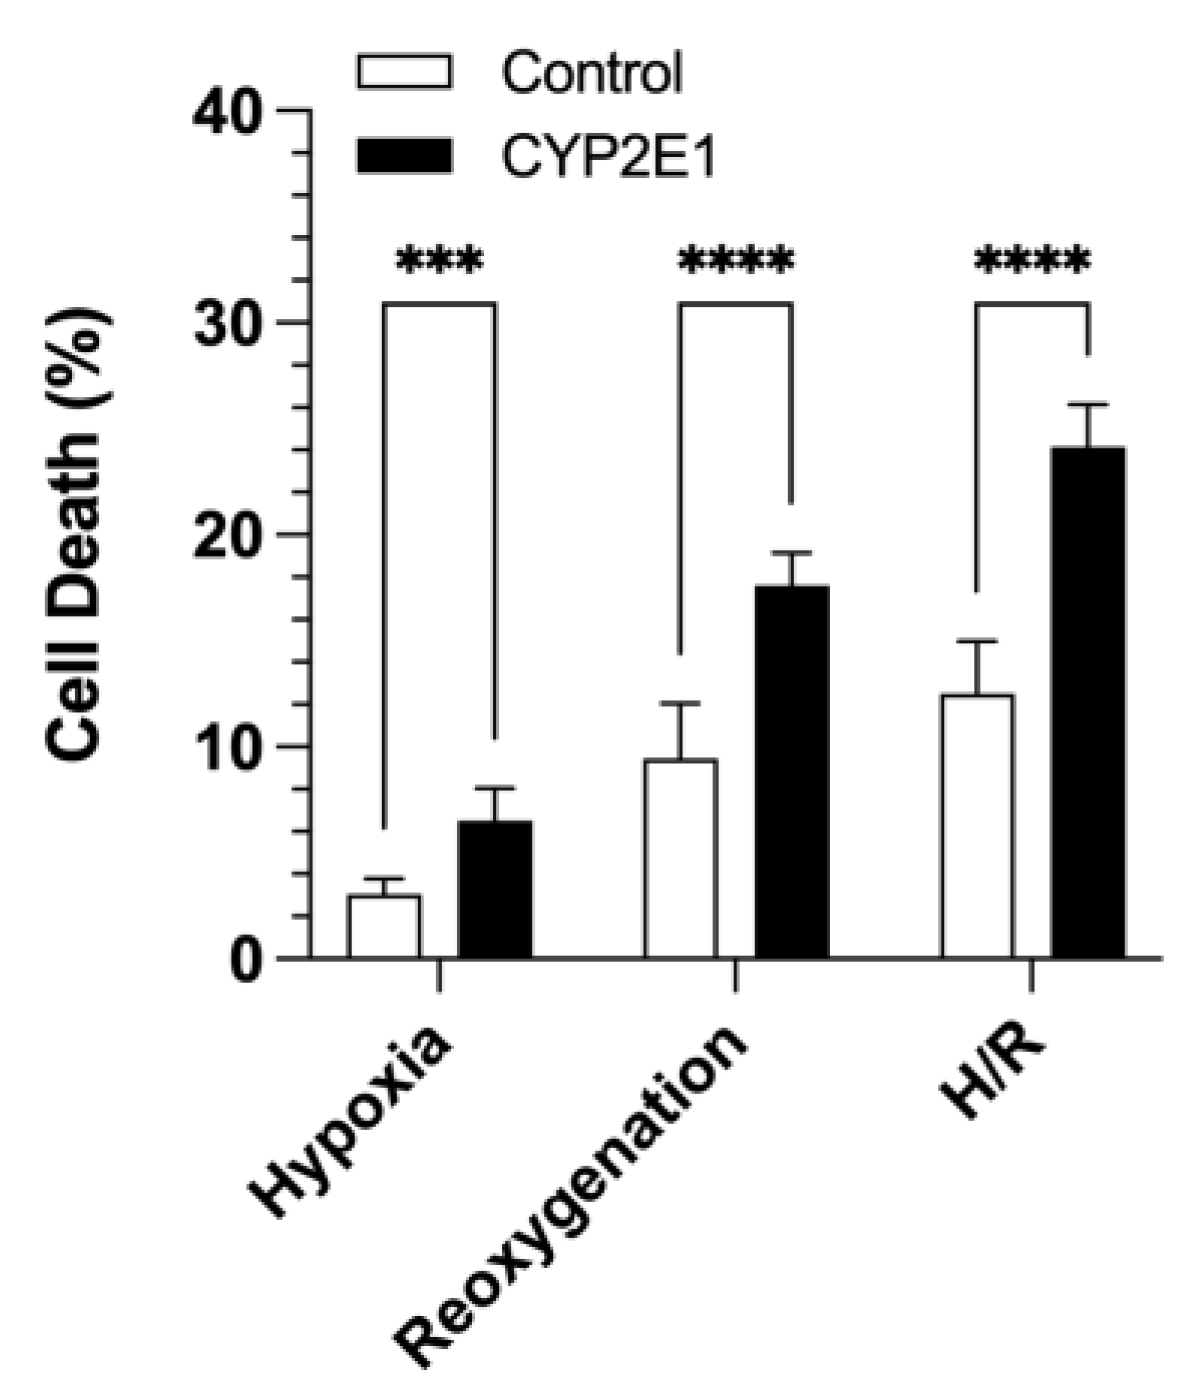
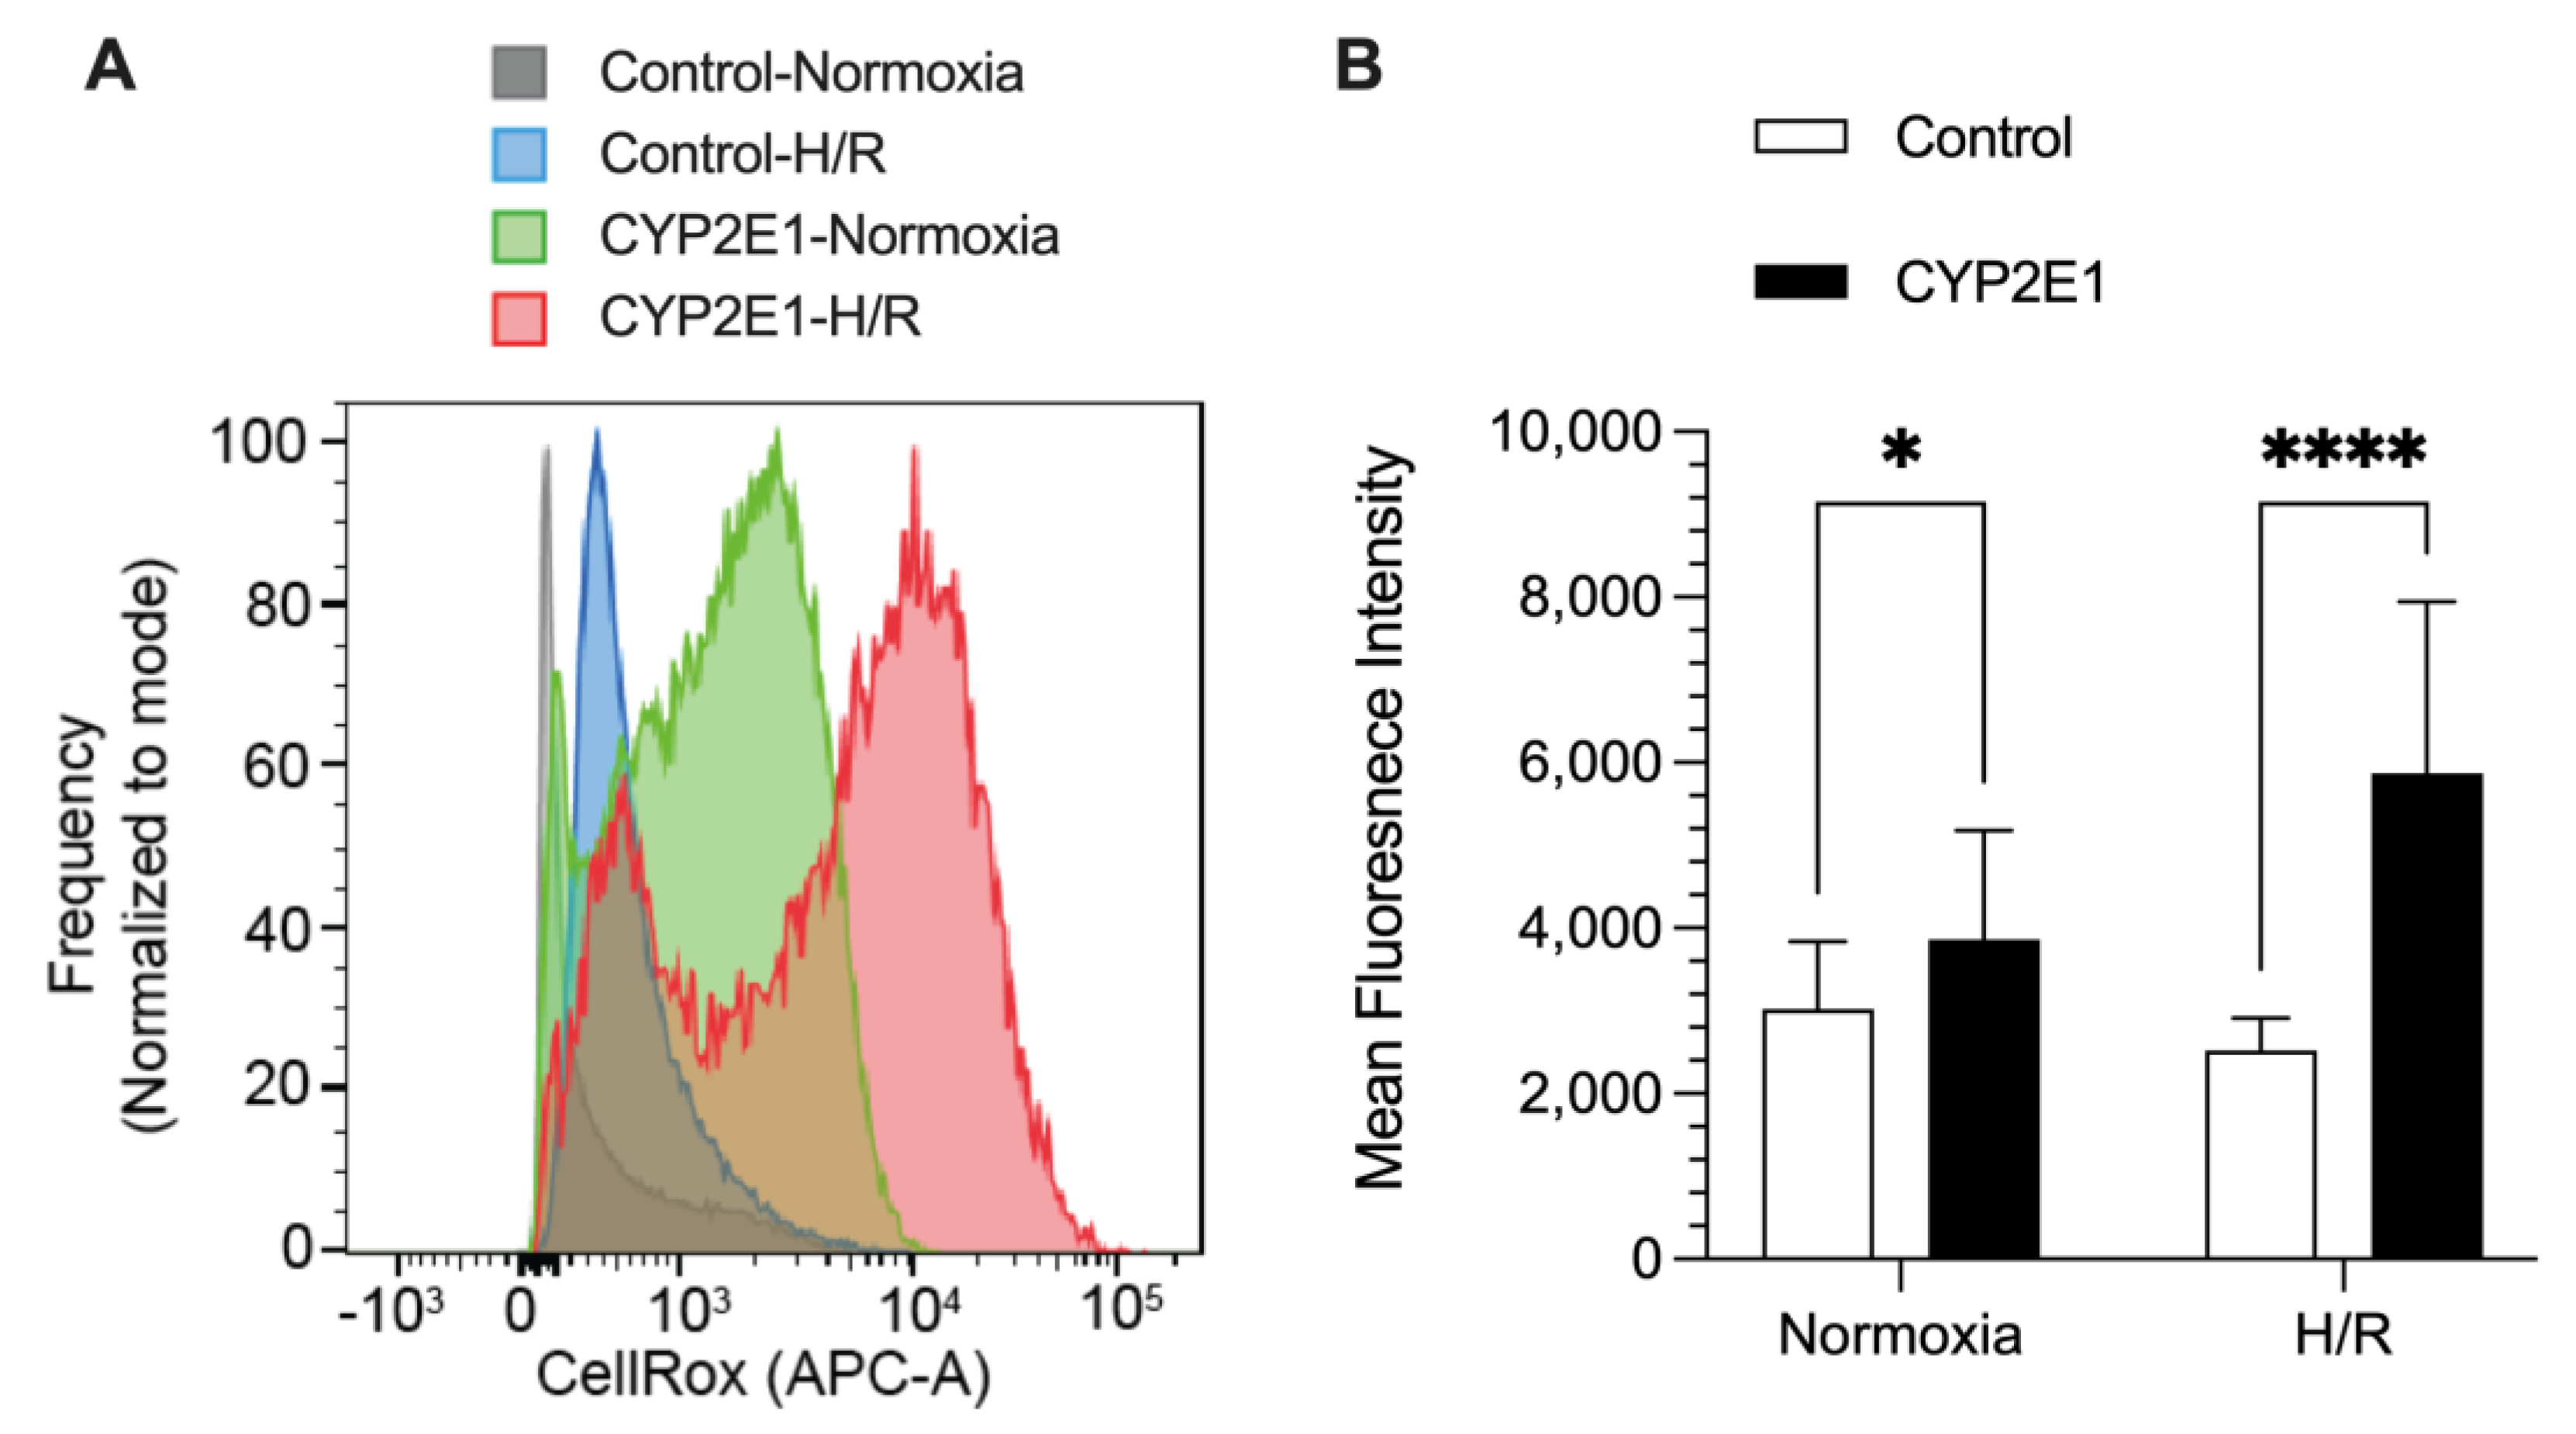
2.2. Effects of CYP2E1 Overexpression on H/R-Induced Injury in HepG2 Cells
3. Discussion
4. Materials and Methods
4.1. Chemicals and Reagents
4.2. Cell Line and Culture Conditions
4.3. Generation of HepG2 Cells with Stable Overexpression of CYP2E1
4.4. Quantification of CYP2E1 and GFP Gene Expression
4.5. ELISA Quantification of GFP
4.6. Microsomal Preparation
4.7. Western Blot Analysis
4.8. CYP2E1 Activity
4.9. In Vitro Hypoxia/Reperfusion Model
4.10. Quantitation of Cell Viability Using LDH Assay
4.11. ROS Generation
4.12. Statistical Analysis
5. Conclusions
Author Contributions
Funding
Institutional Review Board Statement
Informed Consent Statement
Data Availability Statement
Conflicts of Interest
References
- Dar, W.A.; Sullivan, E.; Bynon, J.S.; Eltzschig, H.; Ju, C. Ischemia reperfusion injury in liver transplantation: Cellular and molecular mechanisms. Liver Int. 2019, 39, 788–801. [Google Scholar] [CrossRef] [PubMed]
- Jaeschke, H.; Lemasters, J.J. Apoptosis versus oncotic necrosis in hepatic ischemia/reperfusion injury. Gastroenterology 2003, 125, 1246–1257. [Google Scholar] [CrossRef] [PubMed]
- Jaeschke, H.; Farhood, A. Neutrophil and Kupffer cell-induced oxidant stress and ischemia-reperfusion injury in rat liver. Am. J. Physiol. 1991, 260 Pt 1, G355–G362. [Google Scholar] [CrossRef] [PubMed]
- Zhang, W.; Wang, M.; Xie, H.Y.; Zhou, L.; Meng, X.Q.; Shi, J.; Zheng, S. Role of reactive oxygen species in mediating hepatic ischemia-reperfusion injury and its therapeutic applications in liver transplantation. Transpl. Proc. 2007, 39, 1332–1337. [Google Scholar] [CrossRef]
- Granger, D.N.; Kubes, P. The microcirculation and inflammation: Modulation of leukocyte-endothelial cell adhesion. J. Leukoc. Biol. 1994, 55, 662–675. [Google Scholar] [CrossRef]
- Zhai, Y.; Busuttil, R.W.; Kupiec-Weglinski, J.W. Liver ischemia and reperfusion injury: New insights into mechanisms of innate-adaptive immune-mediated tissue inflammation. Am. J. Transpl. 2011, 11, 1563–1569. [Google Scholar] [CrossRef]
- Abu-Amara, M.; Yang, S.Y.; Seifalian, A.; Davidson, B.; Fuller, B. The nitric oxide pathway—Evidence and mechanisms for protection against liver ischaemia reperfusion injury. Liver Int. 2012, 32, 531–543. [Google Scholar] [CrossRef]
- Jaeschke, H. Molecular mechanisms of hepatic ischemia-reperfusion injury and preconditioning. Am. J. Physiol. Gastrointest. Liver Physiol. 2003, 284, G15–G26. [Google Scholar] [CrossRef]
- Lentsch, A.B.; Kato, A.; Yoshidome, H.; McMasters, K.M.; Edwards, M.J. Inflammatory mechanisms and therapeutic strategies for warm hepatic ischemia/reperfusion injury. Hepatology 2000, 32, 169–173. [Google Scholar] [CrossRef]
- Yang, W.; Chen, J.; Meng, Y.; Chen, Z.; Yang, J. Novel Targets for Treating Ischemia-Reperfusion Injury in the Liver. Int. J. Mol. Sci. 2018, 19, 1302. [Google Scholar] [CrossRef]
- Jaeschke, H.; Woolbright, B.L. Current strategies to minimize hepatic ischemia-reperfusion injury by targeting reactive oxygen species. Transpl. Rev. 2012, 26, 103–114. [Google Scholar] [CrossRef] [PubMed]
- Zangar, R.C.; Davydov, D.R.; Verma, S. Mechanisms that regulate production of reactive oxygen species by cytochrome P450. Toxicol. Appl. Pharmacol. 2004, 199, 316–331. [Google Scholar] [CrossRef] [PubMed]
- Puntarulo, S.; Cederbaum, A.I. Production of reactive oxygen species by microsomes enriched in specific human cytochrome P450 enzymes. Free Radic. Biol. Med. 1998, 24, 1324–1330. [Google Scholar] [CrossRef] [PubMed]
- Ishihara, Y.; Sekine, M.; Nakazawa, M.; Shimamoto, N. Suppression of myocardial ischemia-reperfusion injury by inhibitors of cytochrome P450 in rats. Eur. J. Pharm. 2009, 611, 61–71. [Google Scholar] [CrossRef]
- Paller, M.S.; Jacob, H.S. Cytochrome P-450 mediates tissue-damaging hydroxyl radical formation during reoxygenation of the kidney. Proc. Natl. Acad. Sci. USA 1994, 91, 7002–7006. [Google Scholar] [CrossRef]
- Yu, J.; Zhu, H.; Kindy, M.S.; Taheri, S. Cytochrome P450 CYP2E1 suppression ameliorates cerebral ischemia reperfusion injury. Antioxidant 2021, 10, 52. [Google Scholar] [CrossRef]
- Guengerich, F.P. Roles of cytochrome P450 enzymes in pharmacology and toxicology: Past, present, and future. Adv. Pharm. 2022, 95, 1–47. [Google Scholar]
- Cederbaum, A.I. Molecular mechanisms of the microsomal mixed function oxidases and biological and pathological implications. Redox Biol. 2014, 4, 60–73. [Google Scholar] [CrossRef]
- Zanger, U.M.; Schwab, M. Cytochrome P450 enzymes in drug metabolism: Regulation of gene expression, enzyme activities, and impact of genetic variation. Pharmacol. Ther. 2013, 138, 103–141. [Google Scholar] [CrossRef]
- Rashba-Step, J.; Cederbaum, A.I. Generation of reactive oxygen intermediates by human liver microsomes in the presence of NADPH or NADH. Mol. Pharm. 1994, 45, 150–157. [Google Scholar]
- Ekstrom, G.; Ingelman-Sundberg, M. Rat liver microsomal NADPH-supported oxidase activity and lipid peroxidation dependent on ethanol-inducible cytochrome P-450 (P-450IIE1). Biochem. Pharm. 1989, 38, 1313–1319. [Google Scholar] [CrossRef] [PubMed]
- Ogaki, S.; Taguchi, K.; Watanabe, H.; Ishima, Y.; Otagiri, M.; Maruyama, T. Carbon monoxide-bound red blood cell resuscitation ameliorates hepatic injury induced by massive hemorrhage and red blood cell resuscitation via hepatic cytochrome P450 protection in hemorrhagic shock rats. J. Pharm. Sci. 2014, 103, 2199–2206. [Google Scholar] [CrossRef] [PubMed]
- Meyer, U.A. Endo-xenobiotic crosstalk and the regulation of cytochromes P450. Drug Metab. Rev. 2007, 39, 639–646. [Google Scholar] [CrossRef] [PubMed]
- Lindstrom, T.D.; Hanssen, B.R.; Bendele, A.M. Effects of hepatic ischemia-reperfusion injury on the hepatic mixed function oxidase system in rats. Mol. Pharm. 1990, 38, 829–835. [Google Scholar]
- Pahan, K.; Smith, B.T.; Singh, A.K.; Singh, I. Cytochrome P-450 2E1 in rat liver peroxisomes: Downregulation by ischemia/reperfusion-induced oxidative stress. Free Radic. Biol. Med. 1997, 23, 963–971. [Google Scholar] [CrossRef] [PubMed]
- Caro, A.A.; Cederbaum, A.I. Oxidative stress, toxicology, and pharmacology of CYP2E1. Annu. Rev. Pharm. Toxicol. 2004, 44, 27–42. [Google Scholar] [CrossRef]
- Zhukov, A.; Ingelman-Sundberg, M. Relationship between cytochrome P450 catalytic cycling and stability: Fast degradation of ethanol-inducible cytochrome P450 2E1 (CYP2E1) in hepatoma cells is abolished by inactivation of its electron donor NADPH-cytochrome P450 reductase. Biochem. J. 1999, 340 Pt 2, 453–458. [Google Scholar] [CrossRef]
- Stanley, L.A.; Wolf, C.R. Through a glass, darkly? HepaRG and HepG2 cells as models of human phase I drug metabolism. Drug Metab. Rev. 2022, 54, 46–62. [Google Scholar] [CrossRef]
- Guo, L.; Dial, S.; Shi, L.; Branham, W.; Liu, J.; Fang, J.L.; Green, B.; Deng, H.; Kaput, J.; Ning, B. Similarities and differences in the expression of drug metabolizing enzymes between human hepatic cell lines and primary human hepatocytes. Drug Metab. Dispos. 2011, 39, 528–538. [Google Scholar] [CrossRef]
- Schulz, C.; Kammerer, S.; Kupper, J.H. NADPH-cytochrome P450 reductase expression and enzymatic activity in primary-like human hepatocytes and HepG2 cells for in vitro biotransformation studies. Clin. Hemorheol. Microcirc. 2019, 73, 249–260. [Google Scholar] [CrossRef]
- Waxman, D.J.; Lapenson, D.P.; Aoyama, T.; Gelboin, H.V.; Gonzalez, F.J.; Korzekwa, K. Steroid hormone hydroxylase specificities of eleven cDNA-expressed human cytochrome P450s. Arch. Biochem. Biophys. 1991, 290, 160–166. [Google Scholar] [CrossRef]
- Liu, H.; Lou, G.; Li, C.; Wang, X.; Cederbaum, A.I.; Gan, L.; Xie, B. HBx Inhibits CYP2E1 Gene Expression via Downregulating HNF4α in Human Hepatoma Cells. PLoS ONE 2014, 9, e107913. [Google Scholar] [CrossRef] [PubMed]
- Chen, Q.; Cederbaum, A.I. Cytotoxicity and apoptosis produced by cytochrome P450 2E1 in Hep G2 cells. Mol. Pharm. 1998, 53, 638–648. [Google Scholar] [CrossRef] [PubMed]
- Dai, Y.; Rashba-Step, J.; Cederbaum, A.I. Stable expression of human cytochrome P4502E1 in HepG2 cells: Characterization of catalytic activities and production of reactive oxygen intermediates. Biochemistry 1993, 32, 6928–6937. [Google Scholar] [CrossRef] [PubMed]
- Wu, D.; Cederbaum, A.I. Ethanol cytotoxicity to a transfected HepG2 cell line expressing human cytochrome P4502E1. J. Biol. Chem. 1996, 271, 23914–23919. [Google Scholar] [CrossRef]
- Shaik, I.H.; George, J.M.; Thekkumkara, T.J.; Mehvar, R. Protective effects of diallyl sulfide, a garlic constituent, on the warm hepatic ischemia-reperfusion injury in a rat model. Pharm. Res. 2008, 25, 2231–2242. [Google Scholar] [CrossRef]
- Shaik, I.H.; Mehvar, R. Effects of cytochrome P450 inhibition by cimetidine on the warm hepatic ischemia-reperfusion injury in rats. J. Surg. Res. 2010, 159, 680–688. [Google Scholar] [CrossRef]
- Shaik, I.H.; Mehvar, R. Cytochrome P450 induction by phenobarbital exacerbates warm hepatic ischemia-reperfusion injury in rat livers. Free Radic. Res. 2010, 44, 441–453. [Google Scholar] [CrossRef]
- Qian, T.; Nieminen, A.L.; Herman, B.; Lemasters, J.J. Mitochondrial permeability transition in pH-dependent reperfusion injury to rat hepatocytes. Am. J. Physiol. 1997, 273 Pt 1, C1783–C1792. [Google Scholar] [CrossRef]
- Gergel, D.; Misik, V.; Riesz, P.; Cederbaum, A.I. Inhibition of rat and human cytochrome P4502E1 catalytic activity and reactive oxygen radical formation by nitric oxide. Arch. Biochem. Biophys. 1997, 337, 239–250. [Google Scholar] [CrossRef]
- Harjumaki, R.; Pridgeon, C.S.; Ingelman-Sundberg, M. CYP2E1 in lcoholic and non-alcoholic liver injury. Roles of ROS, reactive intermediates and lipid overload. Int. J. Mol. Sci. 2021, 22, 8221. [Google Scholar] [CrossRef] [PubMed]
- Yamada, N.; Karasawa, T.; Wakiya, T.; Sadatomo, A.; Ito, H.; Kamata, R.; Watanabe, S.; Komada, T.; Kimura, H.; Sanada, Y.; et al. Iron overload as a risk factor for hepatic ischemia-reperfusion injury in liver transplantation: Potential role of ferroptosis. Am. J. Transpl. 2020, 20, 1606–1618. [Google Scholar] [CrossRef]
- Cederbaum, A.I. Methodology to assay CYP2E1 mixed function oxidase catalytic activity and its induction. Redox Biol. 2014, 2, 1048–1054. [Google Scholar] [CrossRef] [PubMed]
- Shaik, I.H.; Mehvar, R. Effects of normothermic hepatic ischemia-reperfusion injury on the in vivo, isolated perfused liver, and microsomal disposition of chlorzoxazone, a cytochrome P450 2E1 probe, in rats. J. Pharm. Sci. 2011, 100, 5281–5292. [Google Scholar] [CrossRef] [PubMed]
- Chandrashekar, D.V.; DuBois, B.N.; Rashid, M.; Mehvar, R. Effects of chronic cirrhosis induced by intraperitoneal thioacetamide injection on the protein content and Michaelis-Menten kinetics of cytochrome P450 enzymes in the rat liver microsomes. Basic Clin. Pharm. Toxicol. 2023, 132, 197–210. [Google Scholar] [CrossRef] [PubMed]
- Pillai, V.C.; Snyder, R.O.; Gumaste, U.; Thekkumkara, T.J.; Mehvar, R. Effects of transient overexpression or knockdown of cytochrome P450 reductase on reactive oxygen species generation and hypoxia-reoxygenation injury in liver cells. Clin. Exp. Pharm. Physiol. 2011, 38, 846–853. [Google Scholar] [CrossRef] [PubMed]
- Pillai, V.C.; Mehvar, R. Inhibition of NADPH-cytochrome P450 reductase by tannic acid in rat liver microsomes and primary hepatocytes: Methodological artifacts and application to ischemia-reperfusion injury. J. Pharm. Sci. 2011, 100, 3495–3505. [Google Scholar] [CrossRef]
- Kim, J.S.; Ohshima, S.; Pediaditakis, P.; Lemasters, J.J. Nitric oxide protects rat hepatocytes against reperfusion injury mediated by the mitochondrial permeability transition. Hepatology 2004, 39, 1533–1543. [Google Scholar] [CrossRef]


Disclaimer/Publisher’s Note: The statements, opinions and data contained in all publications are solely those of the individual author(s) and contributor(s) and not of MDPI and/or the editor(s). MDPI and/or the editor(s) disclaim responsibility for any injury to people or property resulting from any ideas, methods, instructions or products referred to in the content. |
© 2023 by the authors. Licensee MDPI, Basel, Switzerland. This article is an open access article distributed under the terms and conditions of the Creative Commons Attribution (CC BY) license (https://creativecommons.org/licenses/by/4.0/).
Share and Cite
Alwadei, N.; Rashid, M.; Chandrashekar, D.V.; Rahighi, S.; Totonchy, J.; Sharma, A.; Mehvar, R. Generation and Characterization of CYP2E1-Overexpressing HepG2 Cells to Study the Role of CYP2E1 in Hepatic Hypoxia-Reoxygenation Injury. Int. J. Mol. Sci. 2023, 24, 8121. https://doi.org/10.3390/ijms24098121
Alwadei N, Rashid M, Chandrashekar DV, Rahighi S, Totonchy J, Sharma A, Mehvar R. Generation and Characterization of CYP2E1-Overexpressing HepG2 Cells to Study the Role of CYP2E1 in Hepatic Hypoxia-Reoxygenation Injury. International Journal of Molecular Sciences. 2023; 24(9):8121. https://doi.org/10.3390/ijms24098121
Chicago/Turabian StyleAlwadei, Nouf, Mamunur Rashid, Devaraj Venkatapura Chandrashekar, Simin Rahighi, Jennifer Totonchy, Ajay Sharma, and Reza Mehvar. 2023. "Generation and Characterization of CYP2E1-Overexpressing HepG2 Cells to Study the Role of CYP2E1 in Hepatic Hypoxia-Reoxygenation Injury" International Journal of Molecular Sciences 24, no. 9: 8121. https://doi.org/10.3390/ijms24098121
APA StyleAlwadei, N., Rashid, M., Chandrashekar, D. V., Rahighi, S., Totonchy, J., Sharma, A., & Mehvar, R. (2023). Generation and Characterization of CYP2E1-Overexpressing HepG2 Cells to Study the Role of CYP2E1 in Hepatic Hypoxia-Reoxygenation Injury. International Journal of Molecular Sciences, 24(9), 8121. https://doi.org/10.3390/ijms24098121