Abstract
Metformin, an antidiabetic drug, and Glycyrrhiza uralensis Fischer (GU), an oriental medicinal herb, have been reported to exert anti-obesity effects. This study investigated the synergistic action of metformin and GU in improving diet-induced obesity. Mice were fed a normal diet, a high-fat diet (HFD), or HFD + 0.015% GU water extract for 8 weeks. The HFD and GU groups were then randomly divided into two groups and fed the following diets for the next 8 weeks: HFD with 50 mg/kg metformin (HFDM) and GU with 50 mg/kg metformin (GUM). GUM prevented hepatic steatosis and adiposity by suppressing expression of mRNAs and enzyme activities related to lipogenesis in the liver and upregulating the expression of adipocyte mRNAs associated with fatty acid oxidation and lipolysis, and as a result, improved dyslipidemia. Moreover, GUM improved glucose homeostasis by inducing glucose uptake in tissues and upregulating mRNA expressions associated with glycolysis in the liver and muscle through AMP-activated protein kinase activation. GUM also improved inflammation by increasing antioxidant activity in the liver and erythrocytes and decreasing inflammatory cytokine productions. Here, we demonstrate that GU and metformin exert synergistic action in the prevention of obesity and its complications.
1. Introduction
Metformin, an antidiabetic drug belonging to the biguanide family, has been in use for decades. Among the biguanides developed for diabetes treatment, metformin exhibits superior tolerability and safety and has the advantage of improving hyperglycemia without causing weight gain [1]. The glucose-lowering effect of metformin is primarily because of its ability to inhibit hepatic gluconeogenesis [2]. The most common mechanism of action of metformin is the activation of the signaling kinase AMP-activated protein kinase (AMPK), which inhibits gluconeogenic gene expression and increases glucose transporter 4 expression, thereby increasing glucose uptake in the muscle [3,4]. Recently, studies have demonstrated that metformin phosphorylates the cAMP response element-binding protein (CREB), resulting in reduced gluconeogenesis-related gene expression [5] and inhibiting CREB-regulated transcription coactivator 2 (CRTC2) activity of CREB coactivator [6,7]. Another manner in which metformin improves the lipid profile is by decreasing hepatic steatosis [8]. Metformin exerts beneficial effects by lowering plasma lipid levels and attenuating hepatic steatosis through the inhibition of lipogenesis and elevation of fatty acid oxidation via AMPK activation in the liver [1]. In addition, it induces moderate weight loss in patients with obesity who are at risk of diabetes, decreases the rate of aging-related cancer, improves antioxidant activity, and reduces oxidative stress and inflammatory response [9,10]. The recommended first-line treatment approaches for prediabetes currently include lifestyle modifications and metformin [11]. However, as the duration of type 2 diabetes increases and if metformin monotherapy fails to meet or maintain glycemic control, combination therapy with other agents is often required [12,13]. Combination therapy is generally administered with drugs, such as dipeptidyl peptidase-4 inhibitors, insulin, and sulfonylureas [13,14].
Glycyrrhiza uralensis Fischer (GU), commonly known as licorice, has been used as a traditional medicine and natural sweetener since ancient times [15,16]. The biologically active ingredients of GU include glycyrrhizin, liquiritin, liquiritigenin, and flavones [16]. It can modulate and complement the properties of other herbal medicines, serving as a guide for several herbal medicines [17]. It also contains species-specific flavonoids that demonstrate excellent therapeutic effects on liver injury [15,18]. It has numerous pharmacological effects, such as anti-obesity, antitumor, antioxidant, anti-inflammatory, and antihypertensive effects [16,17,19,20].
In general, metformin and other antidiabetic drugs are often used in combination therapies; however, no studies have investigated the combination therapy of metformin and natural products. Therefore, we conducted two animal studies: (1) to determine the effective dose of GU and (2) to explore the synergistic action of metformin and GU on metabolism in mice with diet-induced obesity (DIO).
2. Results
2.1. Low-Dose GU Supplementation Alleviated DIO
Low-dose GU (LGU) supplementation markedly suppresses body weight and body weight gain without any alteration in food and energy intake (Figure 1A–C). Moreover, LGU supplementation significantly decreased food efficiency ratio (FER). Thus, these results indicate that food intake did not affect weight loss in the LGU group. In terms of the adipose tissue weights, LGU supplementation significantly suppressed the weights of subcutaneous, visceral, and total white adipose tissue (WAT) as compared to those in the HFD group (Figure 1D). Interestingly, LGU supplementation significantly decreased the subcutaneous WAT weight when compared to the high-dose GU (HGU) group. Similarly, morphological observation of lipid formation in epididymal WAT showed that the HFD group had a larger area of lipid formation than that of the LGU group (Figure 1E). However, HGU supplementation showed no difference compared to the HFD group (Figure 1F). LGU supplementation significantly decreased fasting plasma glucose levels and homeostatic model assessment of IR (HOMA-IR) compared to those in the HFD and HGU groups. Therefore, the effective dose of GU extract was established to be 0.015% of the diet.
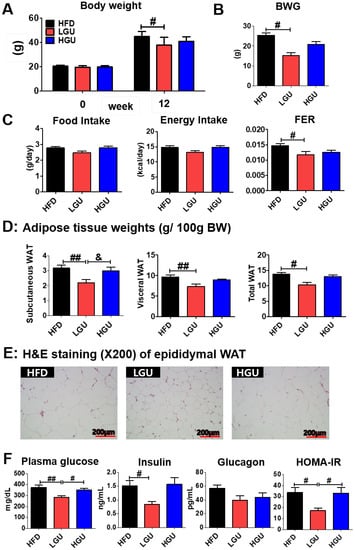
Figure 1.
Effects of low-dose G. uralensis Fischer extract supplementation on diet-induced obesity with respect to body weight (A); body weight gain (B); food intake, energy intake, and food efficiency ratio (C); adipose tissue weight (D); epididymal white adipose tissue morphology (200× magnification) (E); and levels of plasma glucose, insulin, glucagon, and HOMA-IR (F). Data are presented as the mean ± SEM. Significant differences among the high-fat diet groups are indicated: # p < 0.05, ## p < 0.01. Significant differences between LGU and HGU are indicated: & p < 0.05. HFD, high-fat diet (60 kcal% fat); LGU, HFD + 0.015% G. uralensis Fischer; HGU, HFD + 0.03% G. uralensis Fischer.
2.2. Metformin and G. uralensis Fischer Supplementation Alleviated DIO
Before metformin treatment, the body weight significantly decreased in the GU group. After metformin treatment, the GUM and GU groups showed markedly suppressed body weight, and the GUM group showed significantly decreased FER without altering food and energy intake (Figure 2A,B). The GUM group showed marked decreases in the weights of the perirenal, retroperitoneum, mesenteric, visceral, and total WAT compared to those of the HFD group (Table 1). Moreover, morphological observations revealed that epididymal adipocyte size in the GUM group was the smallest among the HFD-based groups (Figure 2C). In the adipose tissue, the expression of lipid metabolism-related genes was regulated by HFDM, GU, and GUM supplementation (Figure 2D). The HFDM group showed significant upregulation of Cpt1b and Cox8b expression, and the GU group showed significant upregulation of Lipe and Pnpla2 expression. The GUM group showed significantly upregulated Adrb3, Pparα, Cpt1b, Cpt2, Cox8b, Ucp1, Lipe, and Pnpla2 expression compared to the HFD group.
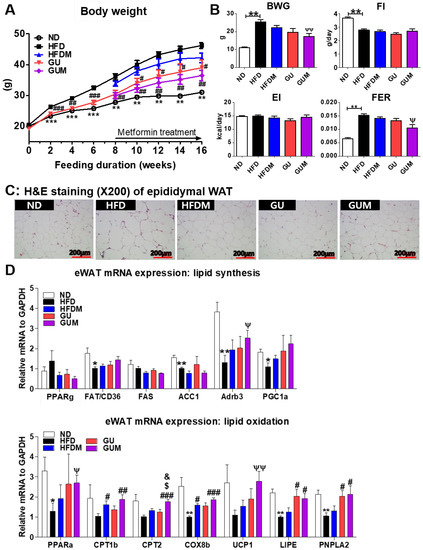
Figure 2.
Effect of metformin, G. uralensis Fischer, and their combination after 16 weeks on body weight (A); body weight gain, food intake, energy intake, and food efficiency ratio (B); adipose tissue morphology (magnification 200×) (C); and epididymal WAT (eWAT) lipid-regulating gene expression (D) in C57BL/6J mice fed a high-fat diet (HFD). Data are presented as the mean ± SEM. Significant differences between HFD and ND are indicated: * p < 0.5, ** p < 0.01, *** p < 0.01. Significant differences among the high-fat diet groups are indicated: # p < 0.05, ## p < 0.01, ### p < 0.001. Significant differences between GUM and HFDM are indicated: $ p < 0.05. Significant differences between GUM and GU are indicated: & p < 0.05. When compared one-to-one, there were significant differences between GUM and HFD groups (Ψ p < 0.05, ΨΨ p < 0.01). ND, normal diet (AIN-93G 16 kcal% fat); HFD, high-fat diet (60 kcal% fat); HFDM, HFD + 50 mg/kg metformin; GU, HFD + 0.015% G. uralensis Fischer 0.015%; GUM, HFD + 0.015% G. uralensis Fischer + 50 mg/kg metformin.

Table 1.
Effect of metformin, G. uralensis Fischer, and their combination after 16 weeks on adipose tissue weights in C57BL/6J mice fed a high-fat diet.
2.3. Metformin and G. uralensis Fischer Supplementation Improved the Plasma Lipid Profiles and Adipokine Levels in the Mice with DIO
The levels of plasma TG, TC, and non-HDL-C in HFDM, GU, and GUM groups were significantly lower than those in the HFD group (Figure 3A). No significant difference was observed in plasma adiponectin levels among the HFD groups, whereas plasma leptin and resistin levels and the L:A ratio significantly decreased in the GUM group compared to those in the HFD group (Figure 3B). In addition, a comparison between GUM and HFDM groups showed that GUM supplementation significantly decreased plasma leptin levels. The levels of pro-inflammatory cytokines were significantly suppressed by metformin treatment (Figure 3C). The HFDM group showed significantly decreased plasma tumor necrosis factor-α (TNF-α) levels, whereas the GUM group showed significantly decreased interleukin-6 (IL-6) and TNF-α levels.
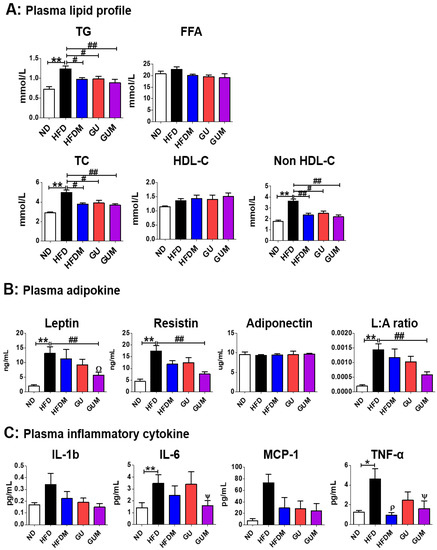
Figure 3.
Effect of metformin, G. uralensis Fischer, and their combination after 16 weeks on plasma lipid profile (A); adipokine concentrations (B); and inflammatory cytokine levels (C) in C57BL/6J mice fed a high-fat diet. Data are presented as the mean ± SEM. Significant differences between HFD and ND groups are indicated: * p < 0.5, ** p < 0.01. Significant differences among the high-fat diet groups are indicated: # p < 0.05, ## p < 0.01. When compared one-to-one, there were significant differences between the GUM and HFD groups: Ψ p < 0.05. When compared one-to-one, there were significant differences between GUM and HFDM: Ω p < 0.05. When compared one-to-one, there were significant differences between HFDM and HFD: ρ p < 0.05. ND, normal diet (AIN-93G 16 kcal% fat); HFD, high-fat diet (60 kcal% fat); HFDM, HFD + metformin 50 mg/kg; GU (G. uralensis Fischer), HFD + GU 0.015%; GUM, HFD + GU 0.015% + metformin 50 mg/kg.
2.4. Metformin and G. uralensis Fischer Supplementation Improved the Hepatosteatosis in Mice with DIO
The liver weights did not differ significantly among the HFD groups, whereas the HFDM, GU, and GUM groups showed significantly decreased hepatic TG levels as compared to those in the HFD group (Figure 4A). In addition, the activities of hepatic lipogenic enzymes, including malic enzyme (ME), fatty acid synthase (FAS), and phosphatidate phosphohydrolase (PAP), were significantly decreased by HFDM, GU, and GUM supplementation (Figure 4B). Hepatic morphological observations and oil red O staining revealed lesser lipid formation and accumulation in the HFDM, GU, and GUM groups than those in the HFD group (Figure 4C). In the liver, the expression of lipid metabolism-related genes was regulated by HFDM, GU, and GUM supplementation (Figure 4D). The HFDM and GU groups showed a significantly downregulated expression of ADRP compared to the HFD group. The GUM group, a synergistic action group, showed significantly downregulated expression of Fatp4, Srebp1c, Fas, Scd1, Acc2, and Adrp, but significantly upregulated expression of Pgc1α, compared to the HFD group. Moreover, comparison between the GUM and HFDM groups showed that GUM supplementation significantly downregulated the expression of Srebp1c, Fas, and Acc2 but significantly upregulated the expression of Pgc1α.
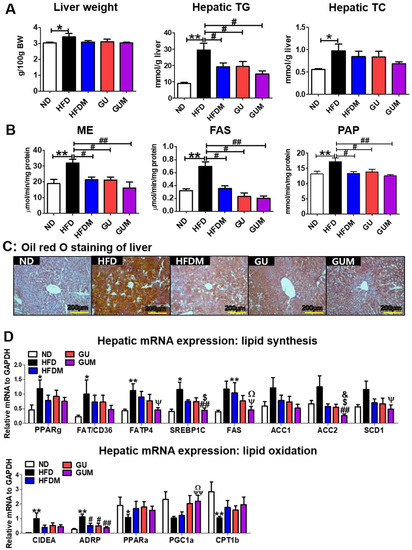
Figure 4.
Effect of metformin, G. uralensis Fischer, and their combination on liver weight and hepatic lipid profiles after 16 weeks (A), and hepatic lipid-regulating enzyme activities (B), hepatic oil red O staining (magnification 200×) (C), and hepatic lipid metabolism-regulating gene expression (D) in C57BL/6J mice fed a high-fat diet (HFD). Data are presented as the mean ± SEM. Significant differences between HFD and ND are indicated: * p < 0.5, ** p < 0.01. Significant differences among the high-fat diet groups are indicated: # p < 0.05, ## p < 0.01. Significant differences between GUM and HFDM are indicated: $ p < 0.05. Significant differences between GUM and GU are indicated: & p < 0.05. When compared one-to-one, there were significant differences between GUM and HFD: Ψ p < 0.05, ΨΨ p < 0.01. When compared one-to-one, there were significant differences between GUM and HFDM: Ω p < 0.05. ND, normal diet (AIN-93G 16 Kcal% fat); HFD, high-fat diet (60 Kcal% fat); HFDM, HFD + metformin 50 mg/kg; GU (G. uralensis Fischer), HFD + GU 0.015%; GUM, HFD + GU 0.015% + metformin 50 mg/kg. Ppar, peroxisome proliferator-activated receptor; Fat/cd36, fatty acid translocase; Fatp4, fatty acid transporter 4; Srebp1c, sterol regulatory element-binding protein-1C; Acc, acetyl-CoA carboxylase; Adrb3, adrenoceptor beta 3; Pgc1a, peroxisome proliferator-activated receptor gamma coactivator 1-alpha; Cpt, carnitine palmitoyltransferase; Cox8b, cytochrome c oxidase subunit 8b; Ucp1, uncoupling protein 1; Lipe, lipase E; Pnpla2, patatin-like phospholipase domain-containing protein 2.
2.5. Metformin and G. uralensis Fischer Supplementation Improved the Hypoglycemia in Mice with DIO
Fasting blood glucose levels were significantly decreased by HFDM, GU, and GUM supplementation (Figure 5A). Moreover, the intraperitoneal glucose tolerance tests (IPGTT) (60 min) and area under the curve (AUC) were significantly decreased in the metformin treatment groups (Figure 5B), and the GUM group showed markedly decreased HOMA-IR (Figure 5C). Furthermore, hepatic glycogen content and hepatic enzymatic activity of phosphoenolpyruvate carboxykinase (PEPCK) were significantly decreased in the GUM supplement groups compared to those in the HFD group (Figure 5D).
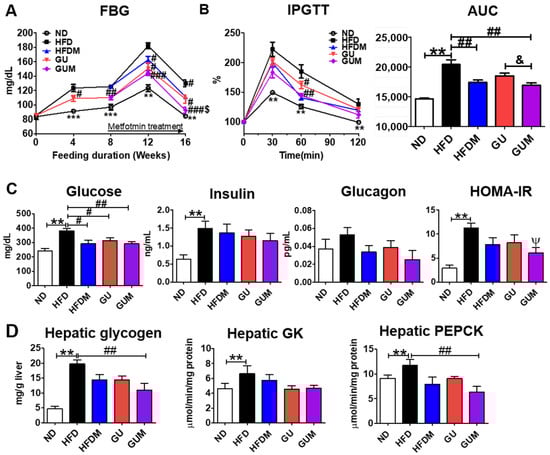
Figure 5.
Effect of metformin, G. uralensis Fischer, and their combination after 16 weeks on fasting blood glucose (A); IPGTT and AUC (B); plasma glucose, insulin, and glucagon levels and HOMA-IR (C); and hepatic glycogen content and glucose-regulating enzyme activities (D) in C57BL/6J mice fed a high-fat diet. Data are presented as the mean ± SEM. Significant differences between HFD and ND are indicated: ** p < 0.01, *** p < 0.001. When compared one-to-one, there were significant differences between GUM and HFD: Ψ p < 0.05. Significant differences among the high-fat diet-fed groups are indicated: # p < 0.05, ## p < 0.01, ### p < 0.001. Significant differences between GUM and GU are indicated: & p < 0.05. ND, normal diet (AIN-93G 16 kcal% fat); HFD, high-fat diet (60 kcal% fat); HFDM, HFD + metformin 50 mg/kg; GU (G. uralensis Fischer), HFD + GU 0.015%; GUM, HFD + GU 0.015% + metformin 50 mg/kg. HOMA-IR = (fasting glucose (mmol/L) × fasting insulin (µIU/mL))/22.5.
2.6. Metformin and G. uralensis Fischer Supplementation Increased AMPK-Related mRNA and Protein Expression in the Mice with DIO
In the liver, epididymal WAT (eWAT), and muscle, the expression levels of the glucose metabolism-related genes were regulated by HFDM, GU, and GUM supplementation (Figure 6A). The HFDM group showed significantly upregulated hepatic Prkaa2, Prkab1, Hk2, and Pdhb; eWAT Prkab1; and muscle Pprkab1 and Glut4 expression compared to the HFD group. However, the GU group showed significantly upregulated hepatic Pdhb; eWAT Prkab1 and Glut4; and muscle Glut4 and Gpi1 expression. The GUM group, the synergistic action group, showed significantly upregulated hepatic Prkaa2, Prkab1, Hk2, and Pdhb; eWAT Prkab1 and glut4; and muscle glut4, Hk2, Gpi1, Pkm2, and Aldoa expression compared to the HFD group, while it showed significantly downregulated hepatic G6pc, Pepck, and Crtc2 expression. Consistent with these results, the protein expression of phospho-AMPKa, which is the activated form of the AMPK, in HFDM and GU groups was higher than the HFD group in hepatic tissue (Figure 6B). Moreover, the GUM group had the highest protein expression of phosphor-AMPKa (Thr172).
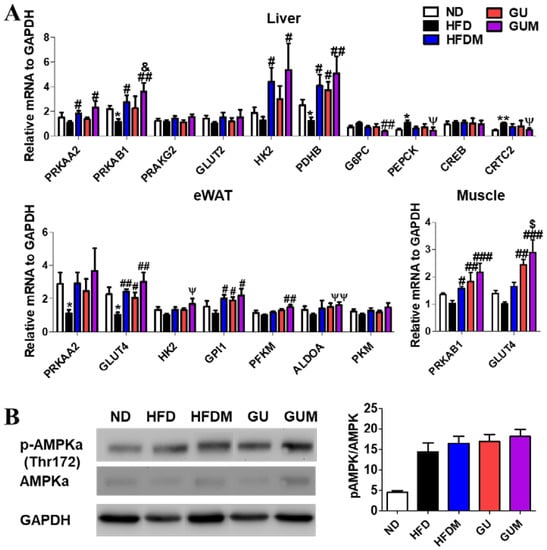
Figure 6.
Effect of metformin, G. uralensis Fischer, and their combination after 16 weeks on AMPK-mediated glucose metabolism-related gene (A); and protein (B); expression in C57BL/6J mice fed a high-fat diet (HFD). Data are presented as the mean ± SEM. Significant differences between HFD and ND are indicated: * p < 0.5, ** p < 0.01. Significant differences among the high-fat diet-fed groups are indicated: # p < 0.05, ## p < 0.01, ### p < 0.001. Significant differences between GUM and HFDM are indicated: $ p < 0.05. Significant differences between GUM and GU are indicated: & p < 0.05. When compared one-to-one, there were significant differences between GUM and HFD groups (Ψ p < 0.05, ΨΨ p < 0.01). ND, normal diet (AIN-93G 16 kcal% fat); HFD, high-fat diet (60 kcal% fat); HFDM, HFD + metformin 50 mg/kg; GU (G. uralensis Fischer), HFD + GU 0.015%; GUM, HFD + GU 0.015% + metformin 50 mg/kg.
2.7. Metformin and G. uralensis Fischer Supplementation Improved the Activities of Erythrocyte and Hepatic Antioxidant Enzymes and Inflammation in Mice with DIO
The activities of the erythrocyte antioxidant enzyme SOD were significantly increased in the metformin-treated groups compared to those in the HFD group, and the H2O2 lipotoxicity marker level was significantly decreased in the HFDM, GU, and GUM groups (Figure 7A). In addition, the HFDM, GU, and GUM groups showed significantly increased glutathione reductase (GR) activity compared to that in the HFD group. The HFDM and GU groups showed significantly increased glutathione peroxidase (GPx) activity, and the GU and GUM groups showed significantly increased paraoxonase (PON) activity (Figure 7B). Additionally, glutathione (GSH) levels were significantly higher in the GUM group than in the HFD group. The levels of aspartate aminotransferase (AST) and alanine aminotransferase (ALT), which are indicators of hepatotoxicity, and blood urea nitrogen (BUN), which is a renal function index, showed no significant differences among the HFD groups (Figure 7C).
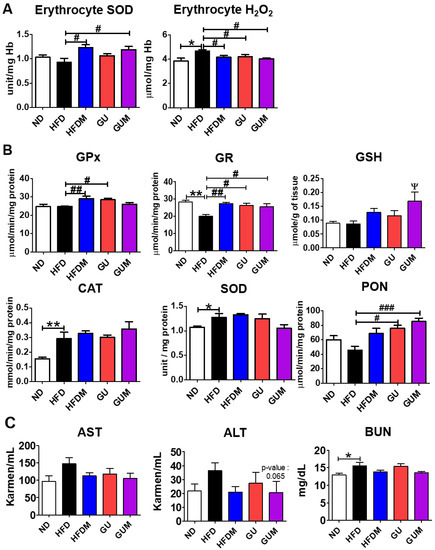
Figure 7.
Effect of metformin, G. uralensis Fischer, and their combination after 16 weeks on erythrocyte H₂O₂ production and SOD activity (A); hepatic antioxidant enzyme activities (CAT, SOD, GPx, GR, and PON) (B), and plasma AST, ALT, and BUN levels (C) in C57BL/6J mice fed a high-fat diet. Data are presented as the mean ± SEM. Significant differences between HFD and ND are indicated: * p < 0.5, ** p < 0.01. When compared one-to-one, there were significant differences between GUM and HFD: Ψ p < 0.05. Significant differences among the high-fat diet groups are indicated: # p < 0.05, ## p < 0.01, ### p < 0.001. When compared one-to-one, there were significant differences between the HFDM and HFD groups (p < 0.05). ND, normal diet (AIN-93G 16 kcal% fat); HFD, high-fat diet (60 kcal% fat); HFDM, HFD + metformin 50 mg/kg; GU (G. uralensis Fischer), HFD + GU 0.015%; GUM, HFD + GU 0.015% + metformin 50 mg/kg.
3. Discussion
Metformin is an orally administered drug that has been used for more than 60 years as a first-line antidiabetic drug either alone or in combination with other anti-hyperglycemic drugs, owing to its safety profile and favorable cardiovascular outcomes. In this study, we first re-verified the anti-obesity effect of G. uralensis Fischer, an oriental medicinal herb, with an antidiabetic effect, and confirmed whether the effect was observed in a dose-dependent manner. The synergistic effect of metformin and G. uralensis Fischer was observed. This is the first study to investigate the anti-obesity and synergistic effects of metformin and G. uralensis Fischer, in mice with DIO.
G. uralensis Fischer has been used in combination with other herbal medicines rather than as a monotherapy. Although G. uralensis Fischer has some anti-obesity and antioxidant properties, there have been no studies performed to evaluate its dose-dependent anti-obesity effect to define the appropriate dose of GU. In our study, LGU supplementation markedly decreased body weight and body fat. Interestingly, LGU supplementation significantly decreased subcutaneous fat mass, plasma glucose level, and HOMA-IR compared to those on HGU supplementation. In accordance with previous studies, at a high dose, bioactive compounds may lose their effectiveness and act as pro-oxidants. A high dose of epigallocatechin-3-gallate may induce its potential toxic effects, which shows that dose-dependent hepatotoxicity is correlated with increased hepatic lipid peroxidation [21]. Additionally, high doses of flavonoids generate superoxide anion radicals, and thus, the products of lipid peroxidation increase [22]. Our study is the first to suggest that LGU is more effective than HGU, similar to the observations described in previous studies.
AMPK is a central regulator of energy homeostasis that coordinates metabolic pathways and balances nutrient supply with energy demand. Metformin, a drug widely used to treat type 2 diabetes mellitus, has been shown to activate AMPK in the liver, thereby reducing gluconeogenesis and enhancing insulin sensitivity [23]. Activated AMPK in the liver upregulates Glut4 expression by increasing glucose uptake in the muscle and adipocytes [4]. Moreover, metformin promotes glucose oxidation in the muscles [24]. The hepatic mRNA expression of Prkab1, an AMPK subunit, was significantly upregulated in the GUM group compared to that in the HFD group, and the expression of Prkag1, another subunit of AMPK, in the HFDM, GU, and GUM groups was upregulated. Furthermore, protein expression of phosphor-AMPK-a was the highest among the experimental group. Thus, Glut4 mRNA expression was significantly upregulated in the eWATs of the GU and GUM groups compared to that in the HFD group. Moreover, the Glut4 mRNA expression was significantly upregulated in the muscles of the HFDM, GU, and GUM groups compared to that in the HFD group. Furthermore, the GUM group showed significantly upregulated mRNA expression of glycolysis-related genes such as Hk2, Gpi1, Pfkm, and Aldoa. Supplementation with the combination of metformin and G. uralensis Fischer increased glycolysis in the liver and muscles and glucose uptake in the eWAT and muscle but decreased gluconeogenesis in the liver. Consistent with these results, the GUM group showed significantly decreased blood glucose and plasma glucose levels and the AUC of the IPGTT. HOMA-IR measures glucose–insulin homeostasis as a method to evaluate insulin resistance [25]. The HOMA-IR value in the HFD group was significantly higher than that in the ND group, but it was significantly lower in the GUM group than in the HFD group. Altogether, the synergistic action of metformin and G. uralensis Fischer supplementation increased glucose uptake in adipocytes and muscles, enhanced hepatic and muscle glycolysis with AMPK activation, and decreased hepatic gluconeogenesis. These synergistic actions of metformin and G. uralensis Fischer supplementation resulted in hypoglycemic effects, as evidenced by decreased plasma glucose levels.
Interestingly, in our study, the elevated hepatic glycogen level was observed in the liver along with the increased activity of PEPCK, which is a gluconeogenic enzyme, in the HFD group. In a state of energy overload caused by a high-fat diet, glycogen use as an energy source is reduced and glucose metabolism seems to be active compared to the ND group. In addition, a previous study suggested that abnormally elevated fasting glucagon levels with fasting plasma glucose levels occurred via inactivation of Akt and upregulation of FoxO1 activity [26]. Meanwhile, metformin and GU supplementation normalized the impaired glucose metabolism through the hepatic glycogen reduction and PEPCK activity.
Furthermore, AMPK regulates lipid metabolism by inhibiting fatty acid synthase-related markers and stimulating fatty acid oxidation [27]. In this study, hepatic Prkab1, an AMPK subunit, and phospho-AMPKa expression in the GUM group was significantly increased compared to the HFD group. Thus, the expression of genes related to fatty acid synthesis was significantly decreased, but that of genes related to fatty acid oxidation was significantly increased. Consistent with these results, the activities of hepatic lipogenic enzymes were significantly lower in the GUM group than in the HFD group. The GUM group showed significantly decreased levels of hepatic TG, whereas the levels of cholesterol and fatty acids tended to decrease compared to those in the HFD group. Moreover, hepatic morphological observations revealed smaller lipid formation in the GUM group than in the HFD group. Consequently, the synergistic action of supplementation with metformin and G. uralensis Fischer water extract inhibits hepatic lipid accumulation by increasing fatty acid oxidation and decreasing lipogenesis.
Obesity is associated with a state of chronic inflammation caused by increased levels of serum pro-inflammatory cytokines and decreased levels of anti-inflammatory adipokines, such as adiponectin, which may also contribute to adipose tissue inflammation [28]. In previous studies, metformin and G. uralensis Fischer improved obesity-related inflammation by decreasing leptin and increasing adiponectin levels, respectively [29,30]. In our study, the levels of plasma inflammatory cytokines (IL-6 and TNF-α) were significantly higher in the HFD group than in the ND group. However, the HFDM group showed significantly decreased plasma TNF-α levels, and the GUM group showed significantly decreased levels of inflammatory cytokines (IL-6 and TNF-α).
Oxidative stress induces adipokine imbalance, increases reactive oxygen species production, and reduces antioxidant activity, resulting in oxidative damage and exacerbating inflammation and injury [31,32]. Several studies have reported that metformin and licorice extract reduce oxidative stress and possess anti-inflammatory and antioxidant properties [16,33]. This study showed that the erythrocyte H2O2 content in the HFD group was significantly higher than that in the ND group. However, the metformin-treated groups, HFDM and GUM, showed significantly increased SOD activity in the erythrocytes compared to the HFD group. Therefore, erythrocyte H2O2 content was significantly lower in the GU group than in the HFD group, as well as in the HFDM and GUM groups. However, the HFDM, GU, and GUM groups showed significantly increased GR activity compared to the HFD group. The HFDM and GU groups showed significantly increased GPx activity, and the GU and GUM groups showed significantly increased PON activity. The levels of AST and ALT, which indicate the hepatotoxicity index, tended to increase in the HFD group and BUN levels were significantly higher in the HFD group than in the ND group. The HFDM, GU, and GUM groups showed decreased AST, ALT, and BUN levels. Taken together, the synergistic action of metformin and G. uralensis Fischer supplementation may protect against oxidative stress by improving antioxidant enzyme activity and attenuating lipid peroxidation.
Metformin combination therapy is commonly used to maintain blood glucose levels in type 2 diabetes patients. Interest in metformin combination therapy using natural product is increasing, as side effects from drug overdose are of concern. In our study, metformin with GU supplementation had synergistic effects on hyperglycemic control via AMPK activation without any liver toxicity. Metformin and GU supplementation was able to improve the metabolic status of diet-induced obesity in mice, which constitutes one of the challenged scientific findings regarding metformin combination therapy.
4. Materials and Methods
4.1. Preparation of Metformin and G. uralensis Fischer (GU) Extract
Metformin was purchased from Sigma-Aldrich (St. Louis, MO, USA), and G. uralensis Fischer (GU) water extract was supplied by Daegu Haany University (Gyeongsan, Korea).
GU was purchased from Bonchowon (Yeongcheon-si, Korea), and was produced according to Korean Good Manufacturing Practice (GMP). Dried GU (100 g) was extracted with 10-fold volume of boiled water at room temperature (2 h for each extraction) and then filtered. Then, the water extract was evaporated using a rotary vacuum evaporator (Sumileyela, Gyeonggi-do, Korea) at 45 °C and the solvent was evaporated in vacuo to give an extract with a yield of 11.5% by weight of GU. The prepared powder was kept at −80 °C and dissolved in water when used. Total polyphenol and flavonoid contents of the GU water extract were 28.44 ± 0.99 mg gallic acid equivalents/g and 15.55 ± 0.05 mg quercetin equivalents/g, respectively.
4.2. Experimental Animals and Diet
- Experiment I: Evaluation of the Effective Dose of GU Extract
Male, 4-week-old C57BL/6J mice (Jabio, Suwon, Korea) were individually housed at room temperature (22 ± 2 °C) and maintained using a 12 h/12 h light/dark cycle. Twenty-one mice were randomly assigned to a high-fat diet (HFD; n = 7; 60 kcal% fat) group, HFD with 0.015% (w/w) G. uralensis Fischer (LGU; n = 7), or HFD with 0.03% (w/w) G. uralensis Fischer (HGU; n = 7) for 16 weeks. The diets were fed in pellet form for 16 weeks (Supplementary Table S1). The mice had free access to food and water during the experiment.
- Experiment II: Synergy effect of metformin and GU combination
The experimental design is shown in Figure 8. Male, 4-week-old C57BL/6J mice (n = 50) were purchased from Jabio (Suwon, South Korea). The mice were housed under the same conditions as described in Experiment I. Mice were randomly assigned to a normal diet (ND; n = 10), HFD (n = 20; 60 kcal% fat), or HFD with 0.015% (w/w) G. uralensis Fischer (GU, n = 20) for 8 weeks. After 8 weeks of HFD and GU supplementation, HFD and GU groups were randomly divided into two groups for metformin treatment and fed HFD with 0.05% metformin (HFDM, n = 10) or HFD with 0.015% GU extract and 0.05% metformin (GUM, n = 10) for 8 weeks. The diets were fed in pellet form for 16 weeks (Supplementary Table S2).
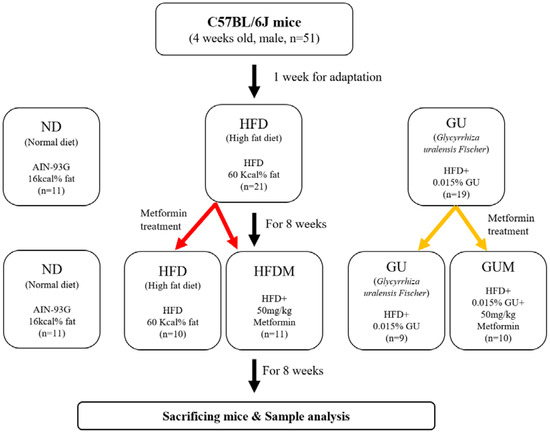
Figure 8.
Experimental design.
The human metformin dose set by the Ministry of Food and Drug Safety guidelines is 500 mg/day for adults. This dose was converted to a mouse dose using the body surface area normalization method [34].
At the end of the diet period, the mice were sacrificed, and the blood; liver; WAT of epididymal, perirenal, retroperitoneum, subcutaneous, and interscapular depots; interscapular brown adipose tissue; and skeletal muscle samples were obtained immediately, weighed, and stored at −70 °C. The animal study protocols were approved by the Kyungpook National University Ethics Committee (approval no. KNU 2020-0090).
4.3. Blood Analysis
Plasma triglyceride (TG; #AM157S), total cholesterol (TC; #AM202), HDL-C (#AM203), and AST (AST; #AM103-K), ALT (ALT; #AM102) concentrations were determined using commercially available enzymatic kits (Asan, Seoul, Republic of Korea). Plasma free fatty acid (FFA; #ab65341) level was measured using enzyme-linked immunosorbent assay (ELISA) kits (Abcam, Cambridge, UK). The BUN levels were measured using a kit (#EIABUN, Thermo Fisher Scientific Inc, Millipore, MA, USA). The levels of plasma insulin, glucagon, leptin, resistin, IL-1b, IL-6, TNF-α, and monocyte chemoattractant protein (MCP)-1 were determined using a MILLIPLEX Mouse Metabolic Hormone Expanded Panel (insulin, glucagon, leptin, and resistin) and mouse cytokine/chemokine panel (IL-1b, IL-6, TNF-a, and MCP-1) kits (Merck Millipore, Billerica, MA, USA), respectively. Plasma adiponectin levels were measured using the Mouse Adiponectin/Acrp30 Quantikine ELISA Kit (#MRP300, R&D systems, Minneapolis, MN, USA). Homeostatic model assessment of IR (HOMA-IR) was calculated as (fasting glucose (mmol/L) × fasting insulin (µIU/mL))/22.5. For the intraperitoneal glucose tolerance tests (IPGTTs), mice were fasted for 12 h at 15 weeks after the start of the experiments and then injected intraperitoneally with glucose (0.5 g/kg body weight). Blood glucose levels were measured from the tail vein with a glucose analyzer (One Touch Ultra, Wayne, PA, USA) at 0, 30, 60, and 120 min after glucose injection.
4.4. Hepatic and Fecal Lipid Contents
The classical Folch lipid extraction method was used for lipid extraction from the liver [35]. The lipid content of the liver and feces was determined using the same enzymatic kits used for the plasma analyses.
4.5. Hepatic Lipid-, Glucose-, and Antioxidant-Regulating Enzyme Activities
Hepatic cytosolic, microsomal, and mitochondrial fractions were prepared according to the Hulcher and Oleson method [36], and protein levels were determined using the Bradford methods. The ME, FAS, PAP, glucokinase (GK), and PEPCK activities and the glycogen concentrations were determined as described in our previous studies [37].
Hepatic H2O2 production, GSH amount, and PON, GPx, GR, catalase, and SOD activities were measured as previously described [38].
4.6. Morphology of the Liver and Fat Tissues
Liver and epididymal WAT were fixed in paraformaldehyde/phosphate-buffered saline (PBS) (10% v/v) and stained with hematoxylin and eosin and oil red O; epididymal WAT paraffin-embedded sections were stained using hematoxylin and eosin [39]. For fatty liver detection, liver tissue was embedded in optimal cutting temperature (OCT) compound and stored at −80 °C [40]. The OCT-embedded samples were sectioned to obtain 4 μm thick slices and stained with oil red O for the evaluation of fat droplets. The stained areas were analyzed under an optical microscope (Nikon, Tokyo, Japan) at ×200 magnification.
4.7. mRNA Expression Analysis
Total RNA from all samples was reverse-transcribed to cDNA using a PrimeScript™ RT reagent Kit with gDNA Eraser (#RR047, Takara, Shiga, Japan). Real-time RT-PCR was performed using the TB Green PCR Kit (#RR820, Takara) and the CFX96 real-time system (Bio-Rad, Hercules, CA, USA). The expression level of mouse-specific GAPDH was used as an internal control. Primer sequences are shown in Table 2.
Table 2.
Primer sequences of genes used for real-time PCR.
4.8. Western Blot
The proteins were loaded onto a 10% SDS–polyacrylamide gel, and electrophoresis was carried out in a Tris–glycine buffer for 1 h. After transferring to nylon membranes and checking the position of the bands with a Ponceau solution, the membranes were blocked (5% skim milk in TBS, 0.1% Tween-20) at room temperature for 60 min and then incubated with the primary antibody overnight at 4 °C. Each primary antibody was diluted with 5% skim milk. AMPK and GAPDH molecules were probed and detected with anti p-AMPKα (cell signaling, #2535, 1:1000, Danvers, MA, USA), anti-AMPKα (cell signaling, #5832, 1:1000, Danvers, MA, USA), and anti-GAPDH (Santa Cruz, sc-32233, 1:1000, Dallas, TX, USA). After washing, the membrane was incubated for 30 min in TBST buffer (25 mM Tris-base, 155 mM NaCl, and 0.1% Tween-20) and incubated with anti-rabbit IgG polyclonal Ab-HRP (Cell Signaling, #7074S, 1:3000, Danvers, MA, USA) or anti-mouse IgG polyclonal Ab-HRP (Cell Signaling, #7076S, 1:3000, Danvers, MA, USA) secondary antibody at room temperature for 1 h. The membrane was washed with TBST buffer for 30 min. Immunoreactive bands were developed by using an ECL kit (Pierce Chemical Co., Rockford, IL, USA), and the molecular weight of the bands was quantified by densitometry using the Image J algorithm (National Institutes of Health, Bethesda, MD, USA).
4.9. Statistical Analyses
Data are expressed as the mean ± standard error of the mean (SEM). Statistical analyses were performed using the SPSS software (SPSS, Inc., Chicago, IL, USA). Statistical differences between ND and HFD results were determined using the Mann–Whitney U test. The Kruskal–Wallis test was performed among the HFD groups, and Bonferroni correction was applied post hoc. Differences were considered statistically significant at p < 0.05.
5. Conclusions
The results of this study indicate that the G. uralensis Fischer extract showed better anti-obesity effects at the low dose compared to the high dose, and the combined administration of metformin and G. uralensis Fischer extract is more effective than metformin administered alone in preventing obesity and its complications, such as fatty liver, inflammation, hyperglycemia, and dyslipidemia, in mice with DIO.
Supplementary Materials
The following supporting information can be downloaded at: https://www.mdpi.com/article/10.3390/ijms24020936/s1.
Author Contributions
M.-K.H.: Investigation, Formal analysis. Y.H. and H.-J.P.: Writing—original draft, Project administration. M.-R.S.: Formal analysis, Conceptualization. S.-S.R. and E.-Y.K.: Conceptualization, Supervision, Writing—review and editing. All authors have read and agreed to the published version of the manuscript.
Funding
This work was supported by a National Research Foundation of Korea (NRF) grant funded by the Korean Government (MSIT) (no. 2018R1A5A2025272) and the “Cooperative Research Program for Agriculture Science & Technology Development” (project no. PJ015272042022 and PJ017069012022) of the Rural Development Administration, Republic of Korea.
Institutional Review Board Statement
The animal protocols were approved by the Ethics Committee of Kyungpook National University on 24 August 2022 (approval no. KNU-2020-0090).
Informed Consent Statement
Not applicable.
Data Availability Statement
Not applicable.
Conflicts of Interest
The authors declare no conflict of interest.
References
- Foretz, M.; Guigas, B.; Bertrand, L.; Pollak, M.; Viollet, B. Metformin: From mechanisms of action to therapies. Cell. Metab. 2014, 20, 953–966. [Google Scholar] [CrossRef] [PubMed]
- Song, R. Mechanism of metformin: A tale of two sites. Diabetes Care 2016, 39, 187–189. [Google Scholar] [CrossRef]
- He, L.; Wondisford, F.E. Metformin action: Concentrations matter. Cell. Metab. 2015, 21, 159–162. [Google Scholar] [CrossRef] [PubMed]
- Kaneto, H.; Kimura, T.; Obata, A.; Shimoda, M.; Kaku, K. Multifaceted Mechanisms of Action of Metformin Which Have Been Unraveled One after Another in the Long History. Int. J. Mol. Sci. 2021, 22, 2596. [Google Scholar] [CrossRef]
- He, L.; Sabet, A.; Djedjos, S.; Miller, R.; Sun, X.; Hussain, M.A.; Radovick, S.; Wondisford, F.E. Metformin and insulin suppress hepatic gluconeogenesis through phosphorylation of CREB binding protein. Cell 2009, 137, 635–646. [Google Scholar] [CrossRef]
- Xu, J.-N.; Zeng, C.; Zhou, Y.; Peng, C.; Zhou, Y.-F.; Xue, Q. Metformin inhibits StAR expression in human endometriotic stromal cells via AMPK-mediated disruption of CREB-CRTC2 complex formation. J. Clin. Endocrinol. Metab. 2014, 99, 2795–2803. [Google Scholar] [CrossRef]
- Lee, J.-M.; Seo, W.-Y.; Song, K.-H.; Chanda, D.; Kim, Y.D.; Kim, D.-K.; Lee, M.-W.; Ryu, D.; Kim, Y.-H.; Noh, J.-R. AMPK-dependent repression of hepatic gluconeogenesis via disruption of CREB· CRTC2 complex by orphan nuclear receptor small heterodimer partner. J. Biol. Chem. 2010, 285, 32182–32191. [Google Scholar] [CrossRef]
- Woo, S.-L.; Xu, H.; Li, H.; Zhao, Y.; Hu, X.; Zhao, J.; Guo, X.; Guo, T.; Botchlett, R.; Qi, T. Metformin ameliorates hepatic steatosis and inflammation without altering adipose phenotype in diet-induced obesity. PLoS ONE 2014, 9, e91111. [Google Scholar] [CrossRef]
- Gallo, A.; Ceolotto, G.; Pinton, P.; Iori, E.; Murphy, E.; Rutter, G.A.; Rizzuto, R.; Semplicini, A.; Avogaro, A. Metformin prevents glucose-induced protein kinase C-β2 activation in human umbilical vein endothelial cells through an antioxidant mechanism. Diabetes 2005, 54, 1123–1131. [Google Scholar] [CrossRef][Green Version]
- Yerevanian, A.; Soukas, A.A. Metformin: Mechanisms in human obesity and weight loss. Curr. Obes. Rep. 2019, 8, 156–164. [Google Scholar] [CrossRef]
- Farr, O.M.; Mantzoros, C.S. Treatment options to prevent diabetes in subjects with prediabetes: Efficacy, cost effectiveness and future outlook. Metab. -Clin. Exp. 2017, 70, 192–195. [Google Scholar] [CrossRef]
- Hayes, J.; Anderson, R.; Stephens, J.W. Sitagliptin/metformin fixed-dose combination in type 2 diabetes mellitus: An evidence-based review of its place in therapy. Drug. Des. Devel. Ther. 2016, 10, 2263–2270. [Google Scholar]
- Wang, F.; He, Y.; Zhang, R.; Zeng, Q.; Zhao, X. Combination therapy of metformin plus dipeptidyl peptidase-4 inhibitor versus metformin plus sulfonylurea and their association with a decreased risk of cardiovascular disease in type 2 diabetes mellitus patients. Medicine 2017, 96, e7638. [Google Scholar] [CrossRef]
- Nathan, D.M.; Buse, J.B.; Davidson, M.B.; Ferrannini, E.; Holman, R.R.; Sherwin, R.; Zinman, B. Medical management of hyperglycemia in type 2 diabetes: A consensus algorithm for the initiation and adjustment of therapy: A consensus statement of the American Diabetes Association and the European Association for the Study of Diabetes. Diabetes Care 2009, 32, 193–203. [Google Scholar] [CrossRef] [PubMed]
- Ahn, J.; Lee, H.; Jang, J.; Kim, S.; Ha, T. Anti-obesity effects of glabridin-rich supercritical carbon dioxide extract of licorice in high-fat-fed obese mice. Food Chem. Toxicol. 2013, 51, 439–445. [Google Scholar] [CrossRef]
- Jung, J.-C.; Lee, Y.-H.; Kim, S.H.; Kim, K.-J.; Kim, K.-M.; Oh, S.; Jung, Y.-S. Hepatoprotective effect of licorice, the root of Glycyrrhiza uralensis Fischer, in alcohol-induced fatty liver disease. BMC. Complement. Altern. Med. 2015, 16, 19. [Google Scholar] [CrossRef]
- Wang, X.; Zhang, H.; Chen, L.; Shan, L.; Fan, G.; Gao, X. Liquorice, a unique “guide drug” of traditional Chinese medicine: A review of its role in drug interactions. J. Ethnopharmacol. 2013, 150, 781–790. [Google Scholar] [CrossRef]
- Gou, S.-H.; He, M.; Li, B.-B.; Zhu, N.-Y.; Ni, J.-M. Hepatoprotective effect of total flavonoids from Glycyrrhiza uralensis Fisch in liver injury mice. Nat. Prod. Res. 2020, 35, 6083–6087. [Google Scholar]
- Mae, T.; Kishida, H.; Nishiyama, T.; Tsukagawa, M.; Konishi, E.; Kuroda, M.; Mimaki, Y.; Sashida, Y.; Takahashi, K.; Kawada, T. A licorice ethanolic extract with peroxisome proliferator-activated receptor-γ ligand-binding activity affects diabetes in KK-Ay mice, abdominal obesity in diet-induced obese C57BL mice and hypertension in spontaneously hypertensive rats. J. Nutr. 2003, 133, 3369–3377. [Google Scholar] [CrossRef]
- Tanemoto, R.; Okuyama, T.; Matsuo, H.; Okumura, T.; Ikeya, Y.; Nishizawa, M. The constituents of licorice (Glycyrrhiza uralensis) differentially suppress nitric oxide production in interleukin-1β-treated hepatocytes. Biochem. Biophys. Rep. 2015, 2, 153–159. [Google Scholar] [CrossRef]
- Galati, G.; Lin, A.; Sultan, A.M.; O’Brien, P.J. Cellular and in vivo hepatotoxicity caused by green tea phenolic acids and catechins. Free Radic. Biol. Med. 2006, 40, 570–580. [Google Scholar] [CrossRef]
- Yen, G.-C.; Duh, P.-D.; Tsai, H.-L.; Huang, S.-L. Pro-oxidative properties of flavonoids in human lymphocytes. Biosci. Biotechnol. Biochem. 2003, 67, 1215–1222. [Google Scholar] [CrossRef] [PubMed]
- Rena, G.; Hardie, D.G.; Pearson, E.R. The mechanisms of action of metformin. Diabetologia 2017, 60, 1577–1585. [Google Scholar] [CrossRef]
- Malin, S.K.; Stewart, N.R. Metformin may contribute to inter-individual variability for glycemic responses to exercise. Front. Endocrinol. 2020, 11, 519. [Google Scholar] [CrossRef] [PubMed]
- Gutch, M.; Kumar, S.; Razi, S.M.; Gupta, K.K.; Gupta, A. Assessment of insulin sensitivity/resistance. Indian J. Endocrinol. Metab. 2015, 19, 160–164. [Google Scholar] [CrossRef]
- Liu, Q.; Zhang, F.-G.; Zhang, W.-S.; Pan, A.; Yang, Y.-L.; Liu, J.-F.; Li, P.; Liu, B.-L.; Qi, L.-W. Ginsenoside Rg1 inhibits glucagon-induced hepatic gluconeogenesis through Akt-FoxO1 interaction. Theranostics 2017, 7, 4001. [Google Scholar] [CrossRef]
- Hardie, D.G. Sensing of energy and nutrients by AMP-activated protein kinase. Am. J. Clin. Nutr. 2011, 93, 891S–896S. [Google Scholar] [CrossRef]
- Romeo, G.R.; Lee, J.; Shoelson, S.E. Metabolic syndrome, insulin resistance, and roles of inflammation–mechanisms and therapeutic targets. Arterioscler. Thromb. Vasc. Biol. 2012, 32, 1771–1776. [Google Scholar] [CrossRef]
- Liou, C.-J.; Lee, Y.-K.; Ting, N.-C.; Chen, Y.-L.; Shen, S.-C.; Wu, S.-J.; Huang, W.-C. Protective effects of Licochalcone A ameliorates obesity and non-alcoholic fatty liver disease via promotion of the Sirt-1/AMPK pathway in mice fed a high-fat diet. Cells 2019, 8, 447. [Google Scholar] [CrossRef]
- Dludla, P.V.; Nkambule, B.B.; Mazibuko-Mbeje, S.E.; Nyambuya, T.M.; Mxinwa, V.; Mokgalaboni, K.; Ziqubu, K.; Cirilli, I.; Marcheggiani, F.; Louw, J. Adipokines as a therapeutic target by metformin to improve metabolic function: A systematic review of randomized controlled trials. Pharmacol. Res. 2021, 163, 105219. [Google Scholar] [CrossRef]
- Vincent, H.K.; Innes, K.E.; Vincent, K.R. Oxidative stress and potential interventions to reduce oxidative stress in overweight and obesity. Diabetes Obes. Metab. 2007, 9, 813–839. [Google Scholar] [PubMed]
- Holguin, F.; Fitzpatrick, A. Obesity, asthma, and oxidative stress. J. Appl. Physiol. 2010, 108, 754–759. [Google Scholar] [PubMed]
- Esteghamati, A.; Eskandari, D.; Mirmiranpour, H.; Noshad, S.; Mousavizadeh, M.; Hedayati, M.; Nakhjavani, M. Effects of metformin on markers of oxidative stress and antioxidant reserve in patients with newly diagnosed type 2 diabetes: A randomized clinical trial. Clin. Nutr. 2013, 32, 179–185. [Google Scholar] [PubMed]
- Reagan-Shaw, S.; Nihal, M.; Ahmad, N. Dose translation from animal to human studies revisited. FASEB J. 2008, 22, 659–661. [Google Scholar] [CrossRef]
- Folch, J.; Lees, M.; Sloane Stanley, G.H. A simple method for the isolation and purification of total lipids from animal tissues. J. Biol. Chem. 1957, 226, 497–509. [Google Scholar] [CrossRef]
- Hulcher, F.H.; Oleson, W.H. Simplified spectrophotometric assay for microsomal 3-hydroxy-3-methylglutaryl CoA reductase by measurement of coenzyme A. J. Lipid Res. 1973, 14, 625–631. [Google Scholar] [CrossRef]
- Kwon, E.Y.; Choi, M.S. Dietary Eriodictyol Alleviates Adiposity, Hepatic Steatosis, Insulin Resistance, and Inflammation in Diet-Induced Obese Mice. Int. J. Mol. Sci. 2019, 20, 1227. [Google Scholar] [CrossRef]
- Kim, J.E.; Kwon, E.Y.; Han, Y. A Collagen Hydrolysate Containing Tripeptides Ameliorates Sarcopenia in Middle-Aged Mice. Molecules 2022, 27, 2718. [Google Scholar] [CrossRef]
- Han, Y.; Park, H.; Choi, B.-R.; Ji, Y.; Kwon, E.-Y.; Choi, M.-S. Alteration of microbiome profile by d-allulose in amelioration of high-fat-diet-induced obesity in mice. Nutrients 2020, 12, 352. [Google Scholar] [CrossRef]
- Yang, S.; Huang, X.-Y.; Zhou, N.; Wu, Q.; Liu, J.; Shi, J.-S. RNA-Seq Analysis of Protection against Chronic Alcohol Liver Injury by Rosa roxburghii Fruit Juice (Cili) in Mice. Nutrients 2022, 14, 1974. [Google Scholar] [CrossRef]
Disclaimer/Publisher’s Note: The statements, opinions and data contained in all publications are solely those of the individual author(s) and contributor(s) and not of MDPI and/or the editor(s). MDPI and/or the editor(s) disclaim responsibility for any injury to people or property resulting from any ideas, methods, instructions or products referred to in the content. |
© 2023 by the authors. Licensee MDPI, Basel, Switzerland. This article is an open access article distributed under the terms and conditions of the Creative Commons Attribution (CC BY) license (https://creativecommons.org/licenses/by/4.0/).