
Anionic Phospholipids Stimulate the Proton Pumping Activity of the Plant Plasma Membrane P-Type H+-ATPase
 , , , and
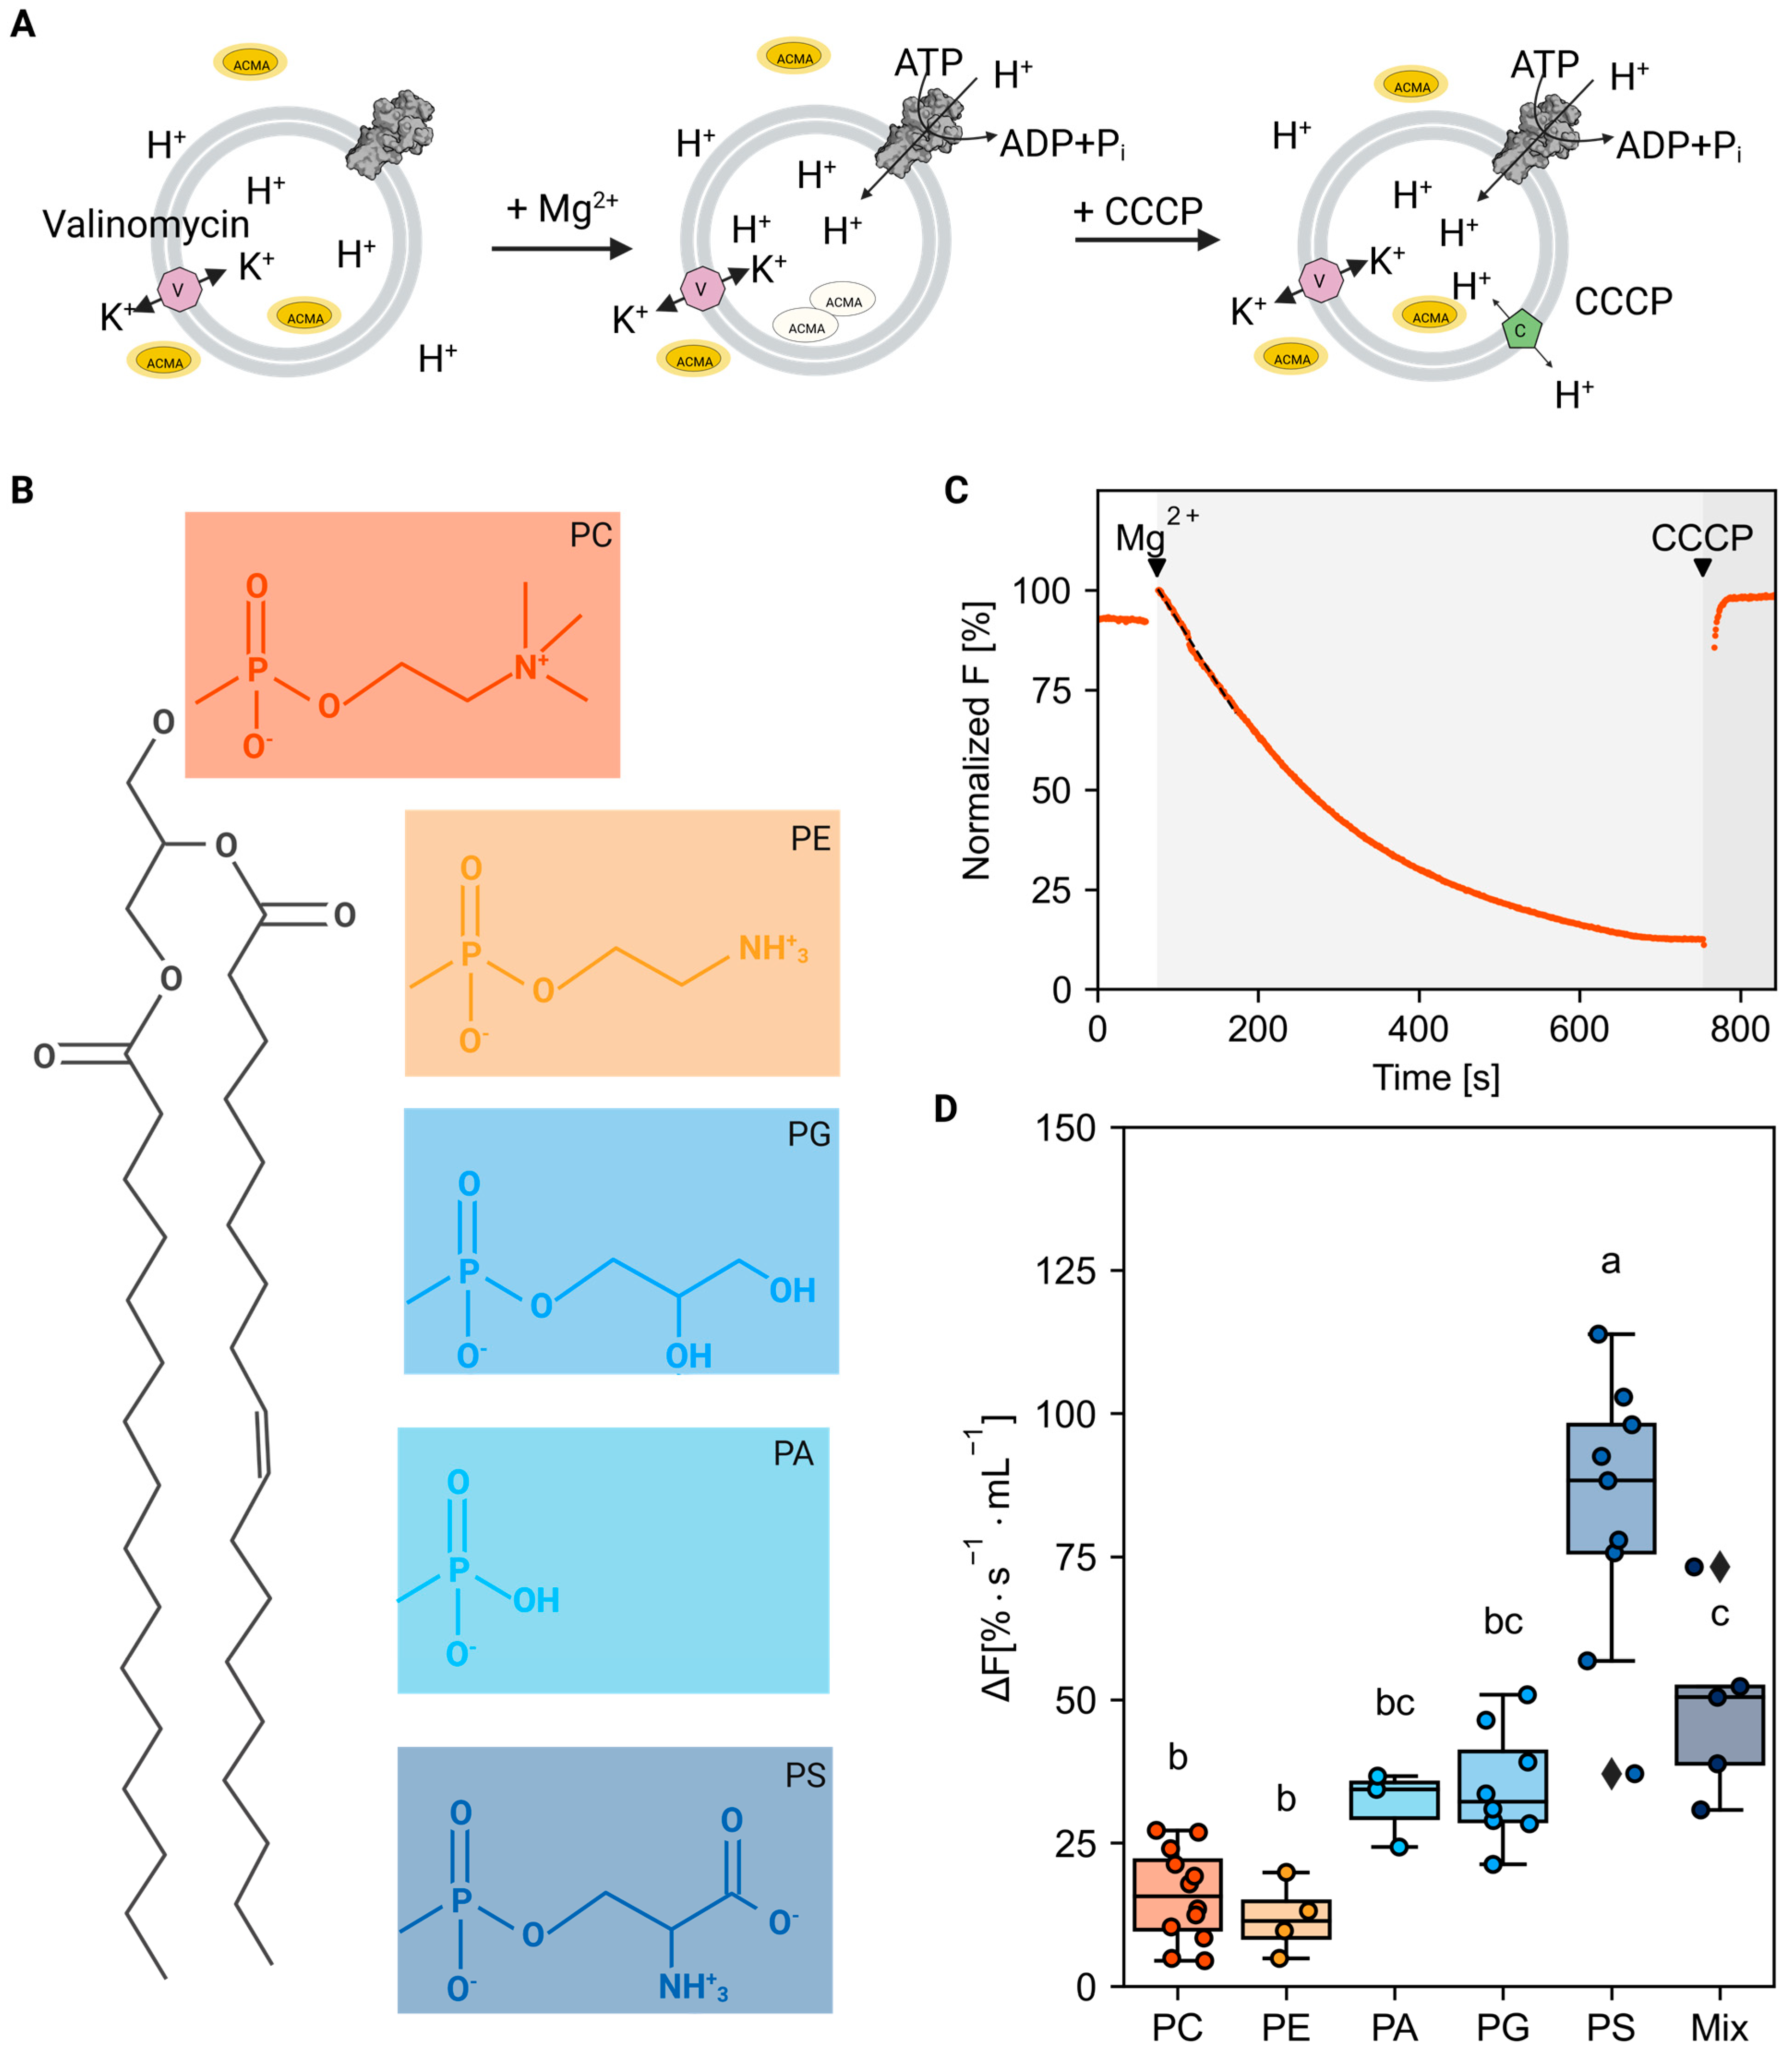
Abstract
1. Introduction
2. Results
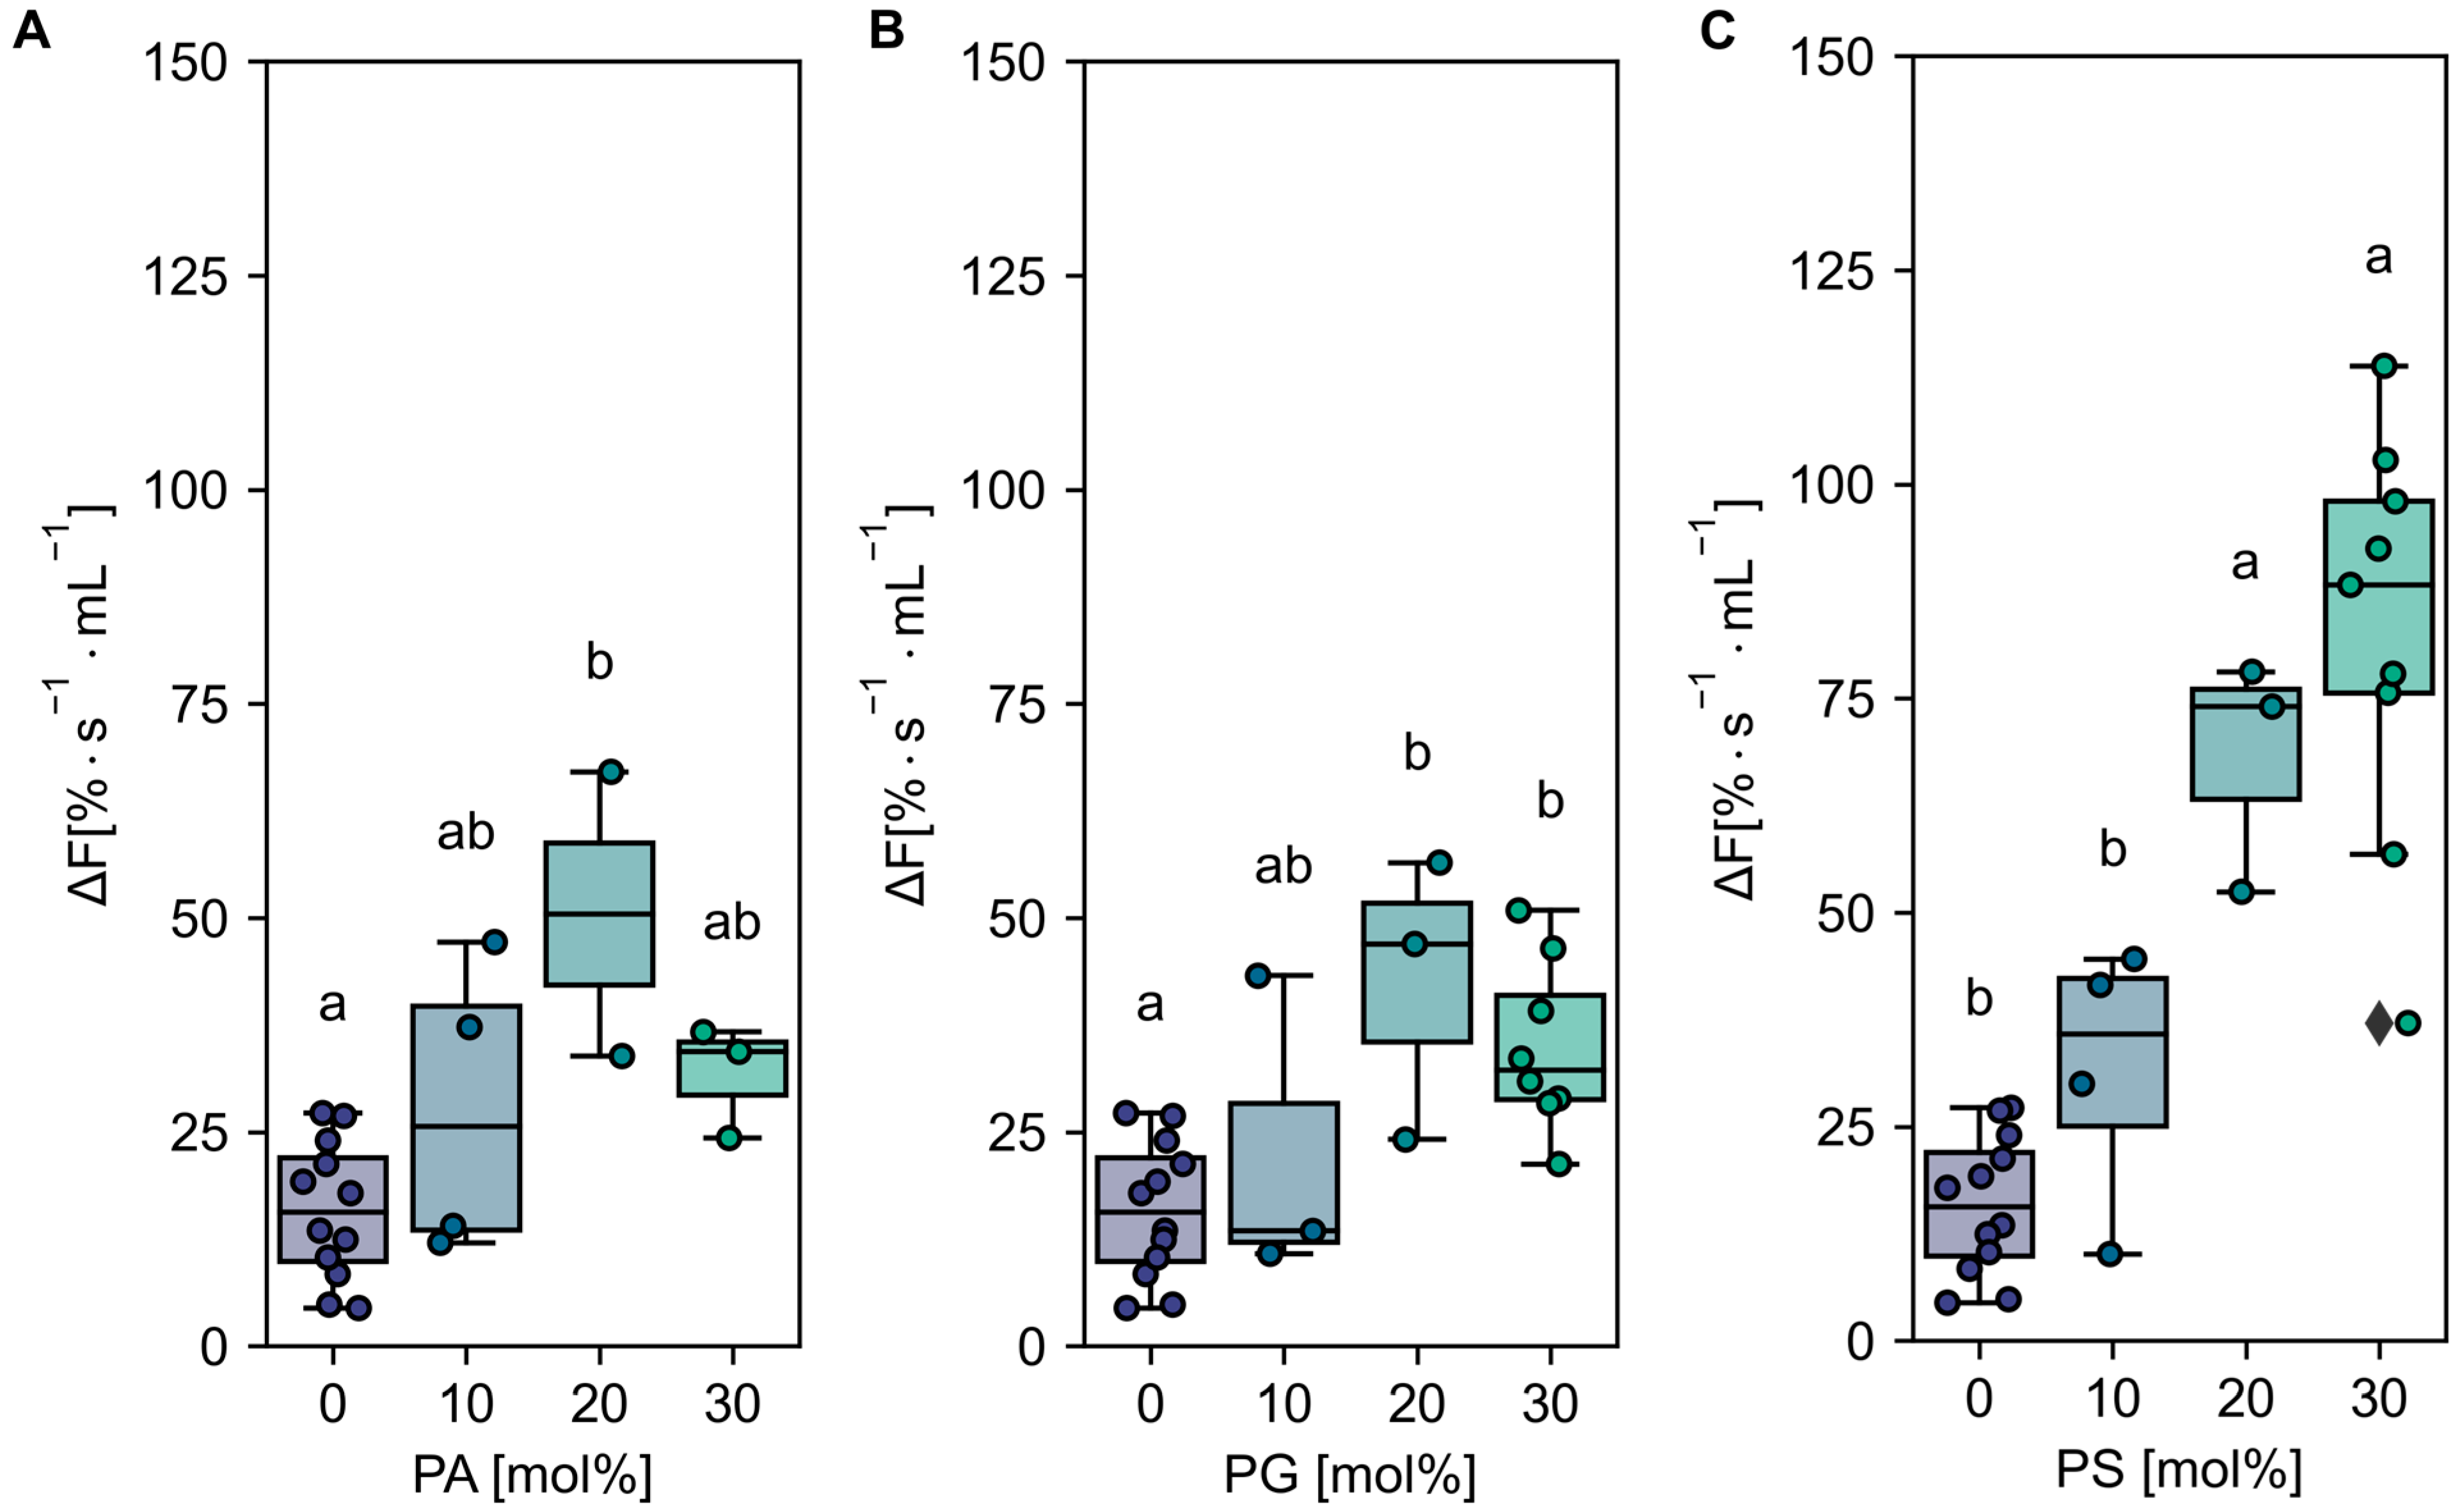
2.1. Activity of C-Terminal Truncated AHA2 Is Stimulated by Anionic Phospholipids
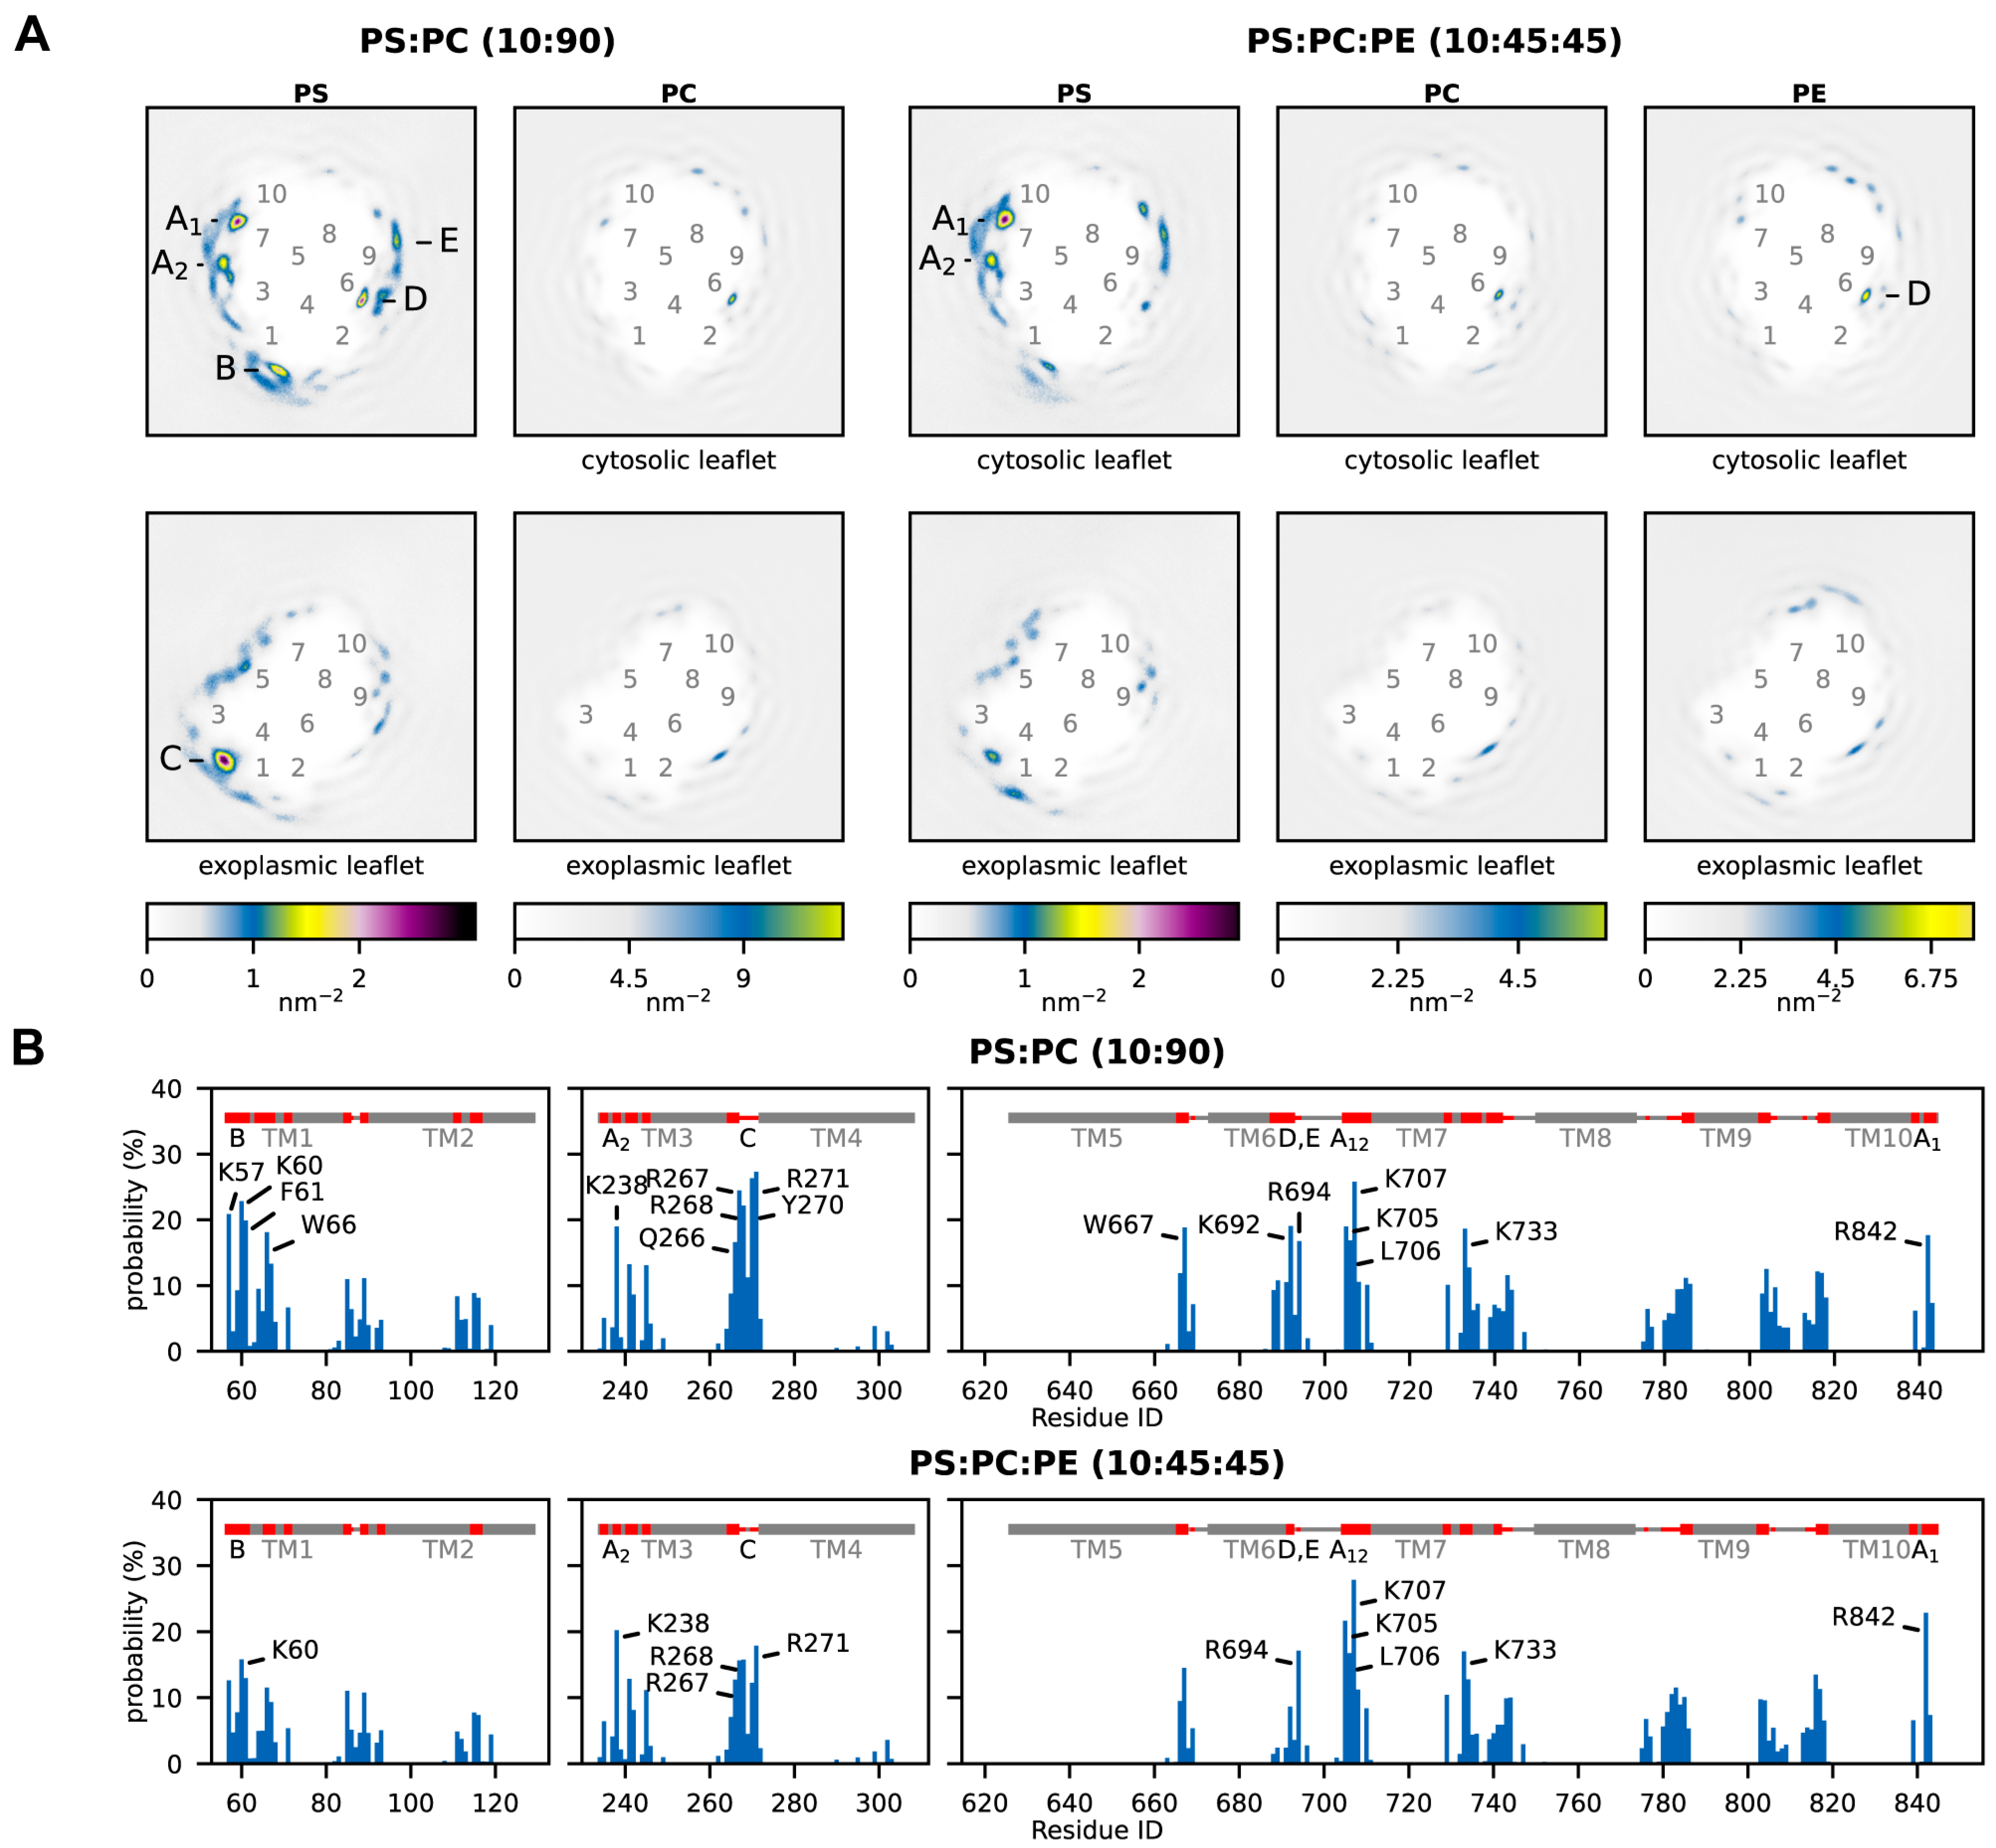
2.2. Anionic Phospholipids Interact Favorably at Distinct AHA2 Sites
2.3. Binding Sites for Anionic Lipids Are Partially Conserved among Plant and Fungal H+-ATPases
3. Discussion
4. Materials and Methods
4.1. Materials
4.2. Preparation of Arabidopsis Thaliana H+-ATPase Isoform 2
4.3. Liposome Preparation
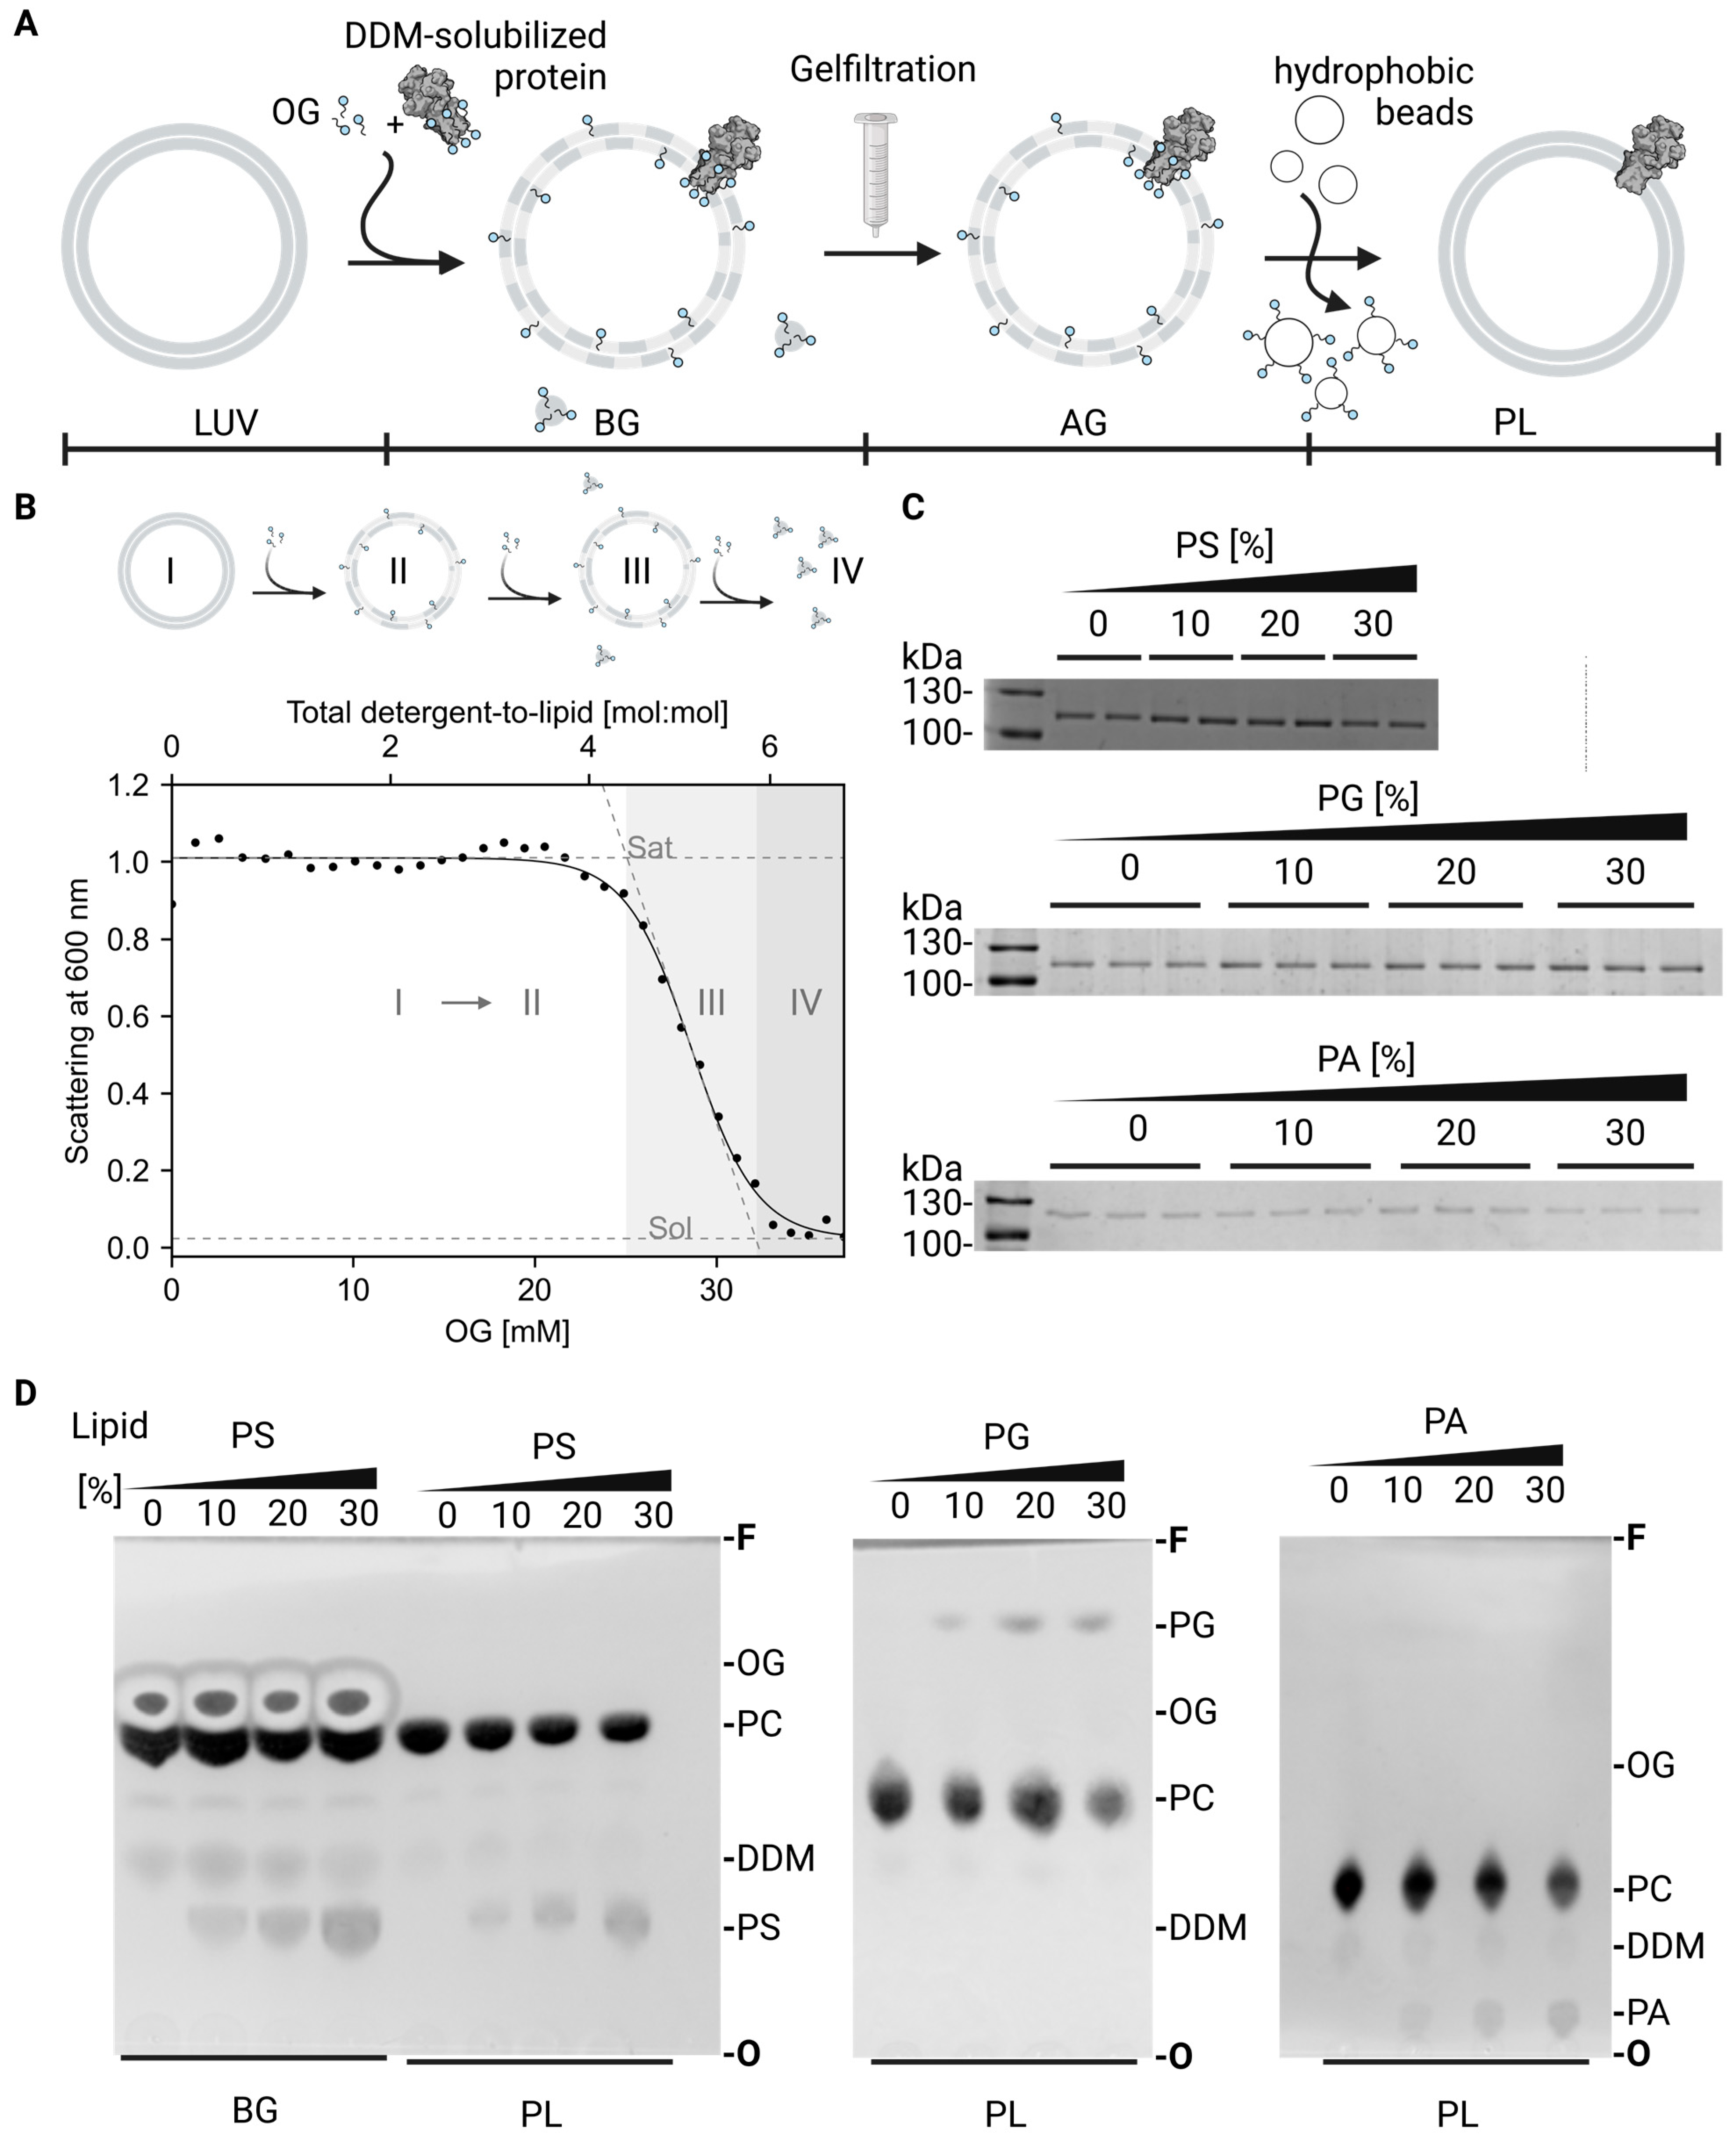
4.4. Vesicle Reconstitution
4.5. ATP-Dependent Proton Transport Assay
4.6. Protein Orientation Assay
4.7. Other Analytical Techniques
4.8. Data Analyses
4.9. Molecular Dynamics (MD) Simulations
4.10. MD Analyses
4.11. Multiple Sequence Alignment
Supplementary Materials
Author Contributions
Funding
Institutional Review Board Statement
Informed Consent Statement
Data Availability Statement
Acknowledgments
Conflicts of Interest
Abbreviations
Appendix A


Appendix B

References
- Vinothkumar, K.R.; Henderson, R. Structures of Membrane Proteins. Quart. Rev. Biophys. 2010, 43, 65–158. [Google Scholar] [CrossRef]
- Gaxiola, R.A.; Palmgren, M.G.; Schumacher, K. Plant Proton Pumps. FEBS Lett. 2007, 581, 2204–2214. [Google Scholar] [CrossRef]
- Kang, J.; Park, J.; Choi, H.; Burla, B.; Kretzschmar, T.; Lee, Y.; Martinoia, E. Plant ABC Transporters. Arab. Book 2011, 9, e0153. [Google Scholar] [CrossRef]
- Axelsen, K.B.; Palmgren, M.G. Evolution of Substrate Specificities in the P-Type ATPase Superfamily. J. Mol. Evol. 1998, 46, 84–101. [Google Scholar] [CrossRef]
- Axelsen, K.B.; Palmgren, M.G. Inventory of the Superfamily of P-Type Ion Pumps in Arabidopsis. Plant Physiol. 2001, 126, 696–706. [Google Scholar] [CrossRef]
- Palmgren, M.G. Plant Plasma Membrane H+-ATPases: Powerhouses for Nutrient Uptake. Annu. Rev. Plant. Physiol. Plant. Mol. Biol. 2001, 52, 817–845. [Google Scholar] [CrossRef]
- Palmgren, M.G.; Nissen, P. P-Type ATPases. Annu. Rev. Biophys. 2011, 40, 243–266. [Google Scholar] [CrossRef]
- Sondergaard, T.E.; Schulz, A.; Palmgren, M.G. Energization of Transport Processes in Plants. Roles of the Plasma Membrane H+-ATPase. Plant Physiol. 2004, 136, 2475–2482. [Google Scholar] [CrossRef]
- Palmgren, M.G. Regulation of Plant Plasma Membrane H+-ATPase Activity. Physiol. Plant 1991, 83, 314–323. [Google Scholar] [CrossRef]
- Axelsen, K.B.; Venema, K.; Jahn, T.; Baunsgaard, L.; Palmgren, M.G. Molecular Dissection of the C-Terminal Regulatory Domain of the Plant Plasma Membrane H+-ATPase AHA2: Mapping of Residues That When Altered Give Rise to an Activated Enzyme. Biochemistry 1999, 38, 7227–7234. [Google Scholar] [CrossRef]
- Fuglsang, A.T.; Visconti, S.; Drumm, K.; Jahn, T.; Stensballe, A.; Mattei, B.; Jensen, O.N.; Aducci, P.; Palmgren, M.G. Binding of 14-3-3 Protein to the Plasma Membrane H+-ATPase AHA2 Involves the Three C-Terminal Residues Tyr946-Thr-Val and Requires Phosphorylation of Thr947. J. Biol. Chem. 1999, 274, 36774–36780. [Google Scholar] [CrossRef]
- Rudashevskaya, E.L.; Ye, J.; Jensen, O.N.; Fuglsang, A.T.; Palmgren, M.G. Phosphosite Mapping of P-Type Plasma Membrane H+-ATPase in Homologous and Heterologous Environments. J. Biol. Chem. 2012, 287, 4904–4913. [Google Scholar] [CrossRef]
- Falhof, J.; Pedersen, J.T.; Fuglsang, A.T.; Palmgren, M. Plasma Membrane H+-ATPase Regulation in the Center of Plant Physiology. Mol. Plant 2016, 9, 323–337. [Google Scholar] [CrossRef]
- Han, X.; Yang, Y.; Zhao, F.; Zhang, T.; Yu, X. An Improved Protein Lipid Overlay Assay for Studying Lipid–Protein Interactions. Plant Methods 2020, 16, 33. [Google Scholar] [CrossRef]
- Kasamo, K.; Nouchi, I. The Role of Phospholipids in Plasma Membrane ATPase Activity in Vigna Radiata L. (Mung Bean) Roots and Hypocotyls. Plant Physiol. 1987, 83, 323–328. [Google Scholar] [CrossRef]
- Serrano, R.; Montesinos, C.; Sanchez, J. Lipid Requirements of the Plasma Membrane ATPases from Oat Roots and Yeast. Plant Sci. 1988, 56, 117–122. [Google Scholar] [CrossRef]
- Brauer, D.; Tu, S.-I. Phospholipid Requirement of the Vanadate-Sensitive ATPase from Maize Roots Evaluated by Two Methods. Plant Physiol. 1989, 89, 867–874. [Google Scholar] [CrossRef]
- Kasamo, K.; Yamanashi, H. Functional Reconstitution of Plasma Membrane H+-ATPase from Mung Bean (Vigna radiata L.) Hypocotyls in Liposomes Prepared with Various Molecular Species of Phospholipids. Plant Cell Physiol. 1991, 32, 1219–1225. [Google Scholar] [CrossRef]
- Regenberg, B.; Villalba, J.M.; Lanfermeijer, F.C.; Palmgren, M.G. C-Terminal Deletion Analysis of Plant Plasma Membrane H+-ATPase: Yeast as a Model System for Solute Transport across the Plant Plasma Membrane. Plant Cell 1995, 7, 1655–1666. [Google Scholar] [CrossRef][Green Version]
- Focht, D.; Croll, T.I.; Pedersen, B.P.; Nissen, P. Improved Model of Proton Pump Crystal Structure Obtained by Interactive Molecular Dynamics Flexible Fitting Expands the Mechanistic Model for Proton Translocation in P-Type ATPases. Front. Physiol. 2017, 8, 5–19. [Google Scholar] [CrossRef]
- Pedersen, B.P.; Buch-Pedersen, M.J.; Preben Morth, J.; Palmgren, M.G.; Nissen, P. Crystal Structure of the Plasma Membrane Proton Pump. Nature 2007, 450, 1111–1114. [Google Scholar] [CrossRef]
- Buch-Pedersen, M.J.; Venema, K.; Serrano, R.; Palmgren, M.G. Abolishment of Proton Pumping and Accumulation in the E1P Conformational State of a Plant Plasma Membrane H+-ATPase by Substitution of a Conserved Aspartyl Residue in Transmembrane Segment 6. J. Biol. Chem. 2000, 275, 39167–39173. [Google Scholar] [CrossRef]
- Buch-Pedersen, M.J.; Palmgren, M.G. Conserved Asp684 in Transmembrane Segment M6 of the Plant Plasma Membrane P-Type Proton Pump AHA2 Is a Molecular Determinant of Proton Translocation. J. Biol. Chem. 2003, 278, 17845–17851. [Google Scholar] [CrossRef]
- Palmgren, M.G.; Axelsen, K.B. Evolution of P-Type ATPases. Biochim. Biophys. Acta—Bioenerg. 1998, 1365, 37–45. [Google Scholar] [CrossRef]
- Drachmann, N.D.; Olesen, C.; Møller, J.V.; Guo, Z.; Nissen, P.; Bublitz, M. Comparing Crystal Structures of Ca2+-ATPase in the Presence of Different Lipids. FEBS J. 2014, 281, 4249–4262. [Google Scholar] [CrossRef]
- Toyoshima, C.; Yonekura, S.-I.; Tsueda, J.; Iwasawa, S. Trinitrophenyl Derivatives Bind Differently from Parent Adenine Nucleotides to Ca2+-ATPase in the Absence of Ca2+. Proc. Natl. Acad. Sci. USA 2011, 108, 1833–1838. [Google Scholar] [CrossRef]
- Toyoshima, C.; Iwasawa, S.; Ogawa, H.; Hirata, A.; Tsueda, J.; Inesi, G. Crystal Structures of the Calcium Pump and Sarcolipin in the Mg2+-Bound E1 State. Nature 2013, 495, 260–264. [Google Scholar] [CrossRef]
- Obara, K.; Miyashita, N.; Xu, C.; Toyoshima, I.; Sugita, Y.; Inesi, G.; Toyoshima, C. Structural Role of Countertransport Revealed in Ca2+ Pump Crystal Structure in the Absence of Ca2+. Proc. Natl. Acad. Sci. USA 2005, 102, 14489–14496. [Google Scholar] [CrossRef]
- Cornelius, F.; Habeck, M.; Kanai, R.; Toyoshima, C.; Karlish, S.J.D. General and Specific Lipid–Protein Interactions in Na,K-ATPase. Biochim. Biophys. Acta Biomembr. 2015, 1848, 1729–1743. [Google Scholar] [CrossRef]
- Kanai, R.; Ogawa, H.; Vilsen, B.; Cornelius, F.; Toyoshima, C. Crystal Structure of a Na+-Bound Na+,K+-ATPase Preceding the E1P State. Nature 2013, 502, 201–206. [Google Scholar] [CrossRef]
- Habeck, M.; Kapri-Pardes, E.; Sharon, M.; Karlish, S.J.D. Specific Phospholipid Binding to Na,K-ATPase at Two Distinct Sites. Proc. Natl. Acad. Sci. USA 2017, 114, 2904–2909. [Google Scholar] [CrossRef]
- Pei, J.; Grishin, N.V. AL2CO: Calculation of Positional Conservation in a Protein Sequence Alignment. Bioinformatics 2001, 17, 700–712. [Google Scholar] [CrossRef]
- Athanasopoulos, A.; André, B.; Sophianopoulou, V.; Gournas, C. Fungal Plasma Membrane Domains. FEMS Microbiol. Rev. 2019, 43, 642–673. [Google Scholar] [CrossRef]
- Addison, R.; Scarborough, G.A. Solubilization and Purification of the Neurospora Plasma Membrane H+-ATPase. J. Biol. Chem. 1981, 256, 13165–13171. [Google Scholar] [CrossRef]
- Scarborough, G.A. Properties of the Neurospora Crassa Plasma Membrane ATPase. Arch. Biochem. Biophys. 1977, 180, 384–393. [Google Scholar] [CrossRef]
- Hossain, K.R.; Clarke, R.J. General and Specific Interactions of the Phospholipid Bilayer with P-Type ATPases. Biophys. Rev. 2019, 11, 353–364. [Google Scholar] [CrossRef]
- Wielandt, A.G.; Pedersen, J.T.; Falhof, J.; Kemmer, G.C.; Lund, A.; Ekberg, K.; Fuglsang, A.T.; Pomorski, T.G.; Buch-Pedersen, M.J.; Palmgren, M. Specific Activation of the Plant P-Type Plasma Membrane H+-ATPase by Lysophospholipids Depends on the Autoinhibitory N- and C-Terminal Domains. J. Biol. Chem. 2015, 290, 16281–16291. [Google Scholar] [CrossRef]
- De Michelis, M.I.; Papini, R.; Pugliarello, M.C. Multiple Effects of Lysophosphatidylcholine on the Activity of the Plasma Membrane H+ -ATPase of Radish Seedlings*. Bot. Acta 1997, 110, 43–48. [Google Scholar] [CrossRef]
- Ekberg, K.; Pedersen, B.P.; Sørensen, D.M.; Nielsen, A.K.; Veierskov, B.; Nissen, P.; Palmgren, M.G.; Buch-Pedersen, M.J. Structural Identification of Cation Binding Pockets in the Plasma Membrane Proton Pump. Proc. Natl. Acad. Sci. USA 2010, 107, 21400–21405. [Google Scholar] [CrossRef]
- Rhee, K.-H. Domain Movements of Plasma Membrane H+-ATPase: 3D Structures of Two States by Electron Cryo-Microscopy. EMBO J. 2002, 21, 3582–3589. [Google Scholar] [CrossRef]
- Morsomme, P.; de Kerchove d’Exaerde, A.; De Meester, S.; Thinès, D.; Goffeau, A.; Boutry, M. Single Point Mutations in Various Domains of a Plant Plasma Membrane H+-ATPase Expressed in Saccharomyces Cerevisiae Increase H+-Pumping and Permit Yeast Growth at Low PH. EMBO J. 1996, 15, 5513–5526. [Google Scholar] [CrossRef] [PubMed]
- Merlot, S.; Leonhardt, N.; Fenzi, F.; Valon, C.; Costa, M.; Piette, L.; Vavasseur, A.; Genty, B.; Boivin, K.; Müller, A.; et al. Constitutive Activation of a Plasma Membrane H+-ATPase Prevents Abscisic Acid-Mediated Stomatal Closure. EMBO J. 2007, 26, 3216–3226. [Google Scholar] [CrossRef]
- Kanczewska, J.; Marco, S.; Vandermeeren, C.; Maudoux, O.; Rigaud, J.-L.; Boutry, M. Activation of the Plant Plasma Membrane H+-ATPase by Phosphorylation and Binding of 14-3-3 Proteins Converts a Dimer into a Hexamer. Proc. Natl. Acad. Sci. USA 2005, 102, 11675–11680. [Google Scholar] [CrossRef]
- Kasamo, K. Mechanism for the Activation of Plasma Membrane H+ -ATPase from Rice (Oryza Sativa L.) Culture Cells by Molecular Species of a Phospholipid. Plant Physiol. 1990, 93, 1049–1052. [Google Scholar] [CrossRef] [PubMed]
- Zhao, P.; Zhao, C.; Chen, D.; Yun, C.; Li, H.; Bai, L. Structure and Activation Mechanism of the Hexameric Plasma Membrane H+-ATPase. Nat. Commun. 2021, 12, 6439. [Google Scholar] [CrossRef]
- Heit, S.; Geurts, M.M.G.; Murphy, B.J.; Corey, R.A.; Mills, D.J.; Kühlbrandt, W.; Bublitz, M. Structure of the Hexameric Fungal Plasma Membrane Proton Pump in Its Autoinhibited State. Sci. Adv. 2021, 7, eabj5255. [Google Scholar] [CrossRef]
- Curran, A.C.; Hwang, I.; Corbin, J.; Martinez, S.; Rayle, D.; Sze, H.; Harper, J.F. Autoinhibition of a Calmodulin-Dependent Calcium Pump Involves a Structure in the Stalk That Connects the Transmembrane Domain to the ATPase Catalytic Domain. J. Biol. Chem. 2000, 275, 30301–30308. [Google Scholar] [CrossRef] [PubMed]
- Morsomme, P.; Dambly, S.; Maudoux, O.; Boutry, M. Single Point Mutations Distributed in 10 Soluble and Membrane Regions of the Nicotiana Plumbaginifolia Plasma Membrane PMA2 H+-ATPase Activate the Enzyme and Modify the Structure of the C-Terminal Region. J. Biol. Chem. 1998, 273, 34837–34842. [Google Scholar] [CrossRef]
- Ruiz-Granados, Y.; De La Cruz-Torres, V.; Sampedro, J. The Oligomeric State of the Plasma Membrane H+-ATPase from Kluyveromyces Lactis. Molecules 2019, 24, 958. [Google Scholar] [CrossRef]
- Nguyen, T.T.; Blackburn, M.R.; Sussman, M.R. Intermolecular and Intramolecular Interactions of the Arabidopsis Plasma Membrane Proton Pump Revealed Using a Mass Spectrometry Cleavable Cross-Linker. Biochemistry 2020, 59, 2210–2225. [Google Scholar] [CrossRef]
- van ’t Klooster, J.S.; Cheng, T.-Y.; Sikkema, H.R.; Jeucken, A.; Moody, B.; Poolman, B. Periprotein Lipidomes of Saccharomyces Cerevisiae Provide a Flexible Environment for Conformational Changes of Membrane Proteins. eLife 2020, 9, e57003. [Google Scholar] [CrossRef]
- Cid, A.; Perona, R.; Serrano, R. Replacement of the Promoter of the Yeast Plasma Membrane ATPase Gene by a Galactose-Dependent Promoter and Its Physiological Consequences. Curr. Genet. 1987, 12, 105–110. [Google Scholar] [CrossRef]
- Rigaud, J.-L.; Pitard, B.; Levy, D. Reconstitution of Membrane Proteins into Liposomes: Application to Energy-Transducing Membrane Proteins. Biochim. Biophys. Acta—Bioenerg. 1995, 1231, 223–246. [Google Scholar] [CrossRef]
- Dufour, J.P.; Goffeau, A.; Tsong, T.Y. Active Proton Uptake in Lipid Vesicles Reconstituted with the Purified Yeast Plasma Membrane ATPase. Fluorescence Quenching of 9-Amino-6-Chloro-2-Methoxyacridine. J. Biol. Chem. 1982, 257, 9365–9371. [Google Scholar] [CrossRef] [PubMed]
- Paweletz, L.; Veit, S.; Pomorski, T. A Fluorescence-Based Approach Utilizing Self-Labeling Enzyme Tags to Determine Protein Orientation in Large Unilamellar Vesicles. BIO-PROTOCOL 2022, 12, e4542. [Google Scholar] [CrossRef]
- Bartlett, G.R. Phosphorus assay in column chromatography. J. Biol. Chem. 1959, 234, 466–468. [Google Scholar] [CrossRef] [PubMed]
- Van Rossum, G.; Drake, F.L. The Python Language Reference; Drake, F.L., Ed.; Python documentation manual/Guido van Rossum; Release 3.0.1 [Repr.]; Python Software Foundation: Hampton, NH, USA, 2010; ISBN 978-1-4414-1269-0. [Google Scholar]
- Virtanen, P.; Gommers, R.; Oliphant, T.E.; Haberland, M.; Reddy, T.; Cournapeau, D.; Burovski, E.; Peterson, P.; Weckesser, W.; Bright, J.; et al. SciPy 1.0: Fundamental Algorithms for Scientific Computing in Python. Nat. Methods 2020, 17, 261–272. [Google Scholar] [CrossRef] [PubMed]
- Seabold, S.; Perktold, J. Statsmodels: Econometric and Statistical Modeling with Python. In Proceedings of the 9th Python in Science Conference, Austin, TX, USA, 28 June–3 July 2010; pp. 92–96. [Google Scholar] [CrossRef]
- Bedre, R. Reneshbedre/Bioinfokit: Bioinformatics Data Analysis and Visualization Toolkit. Zenodo 2020. [Google Scholar] [CrossRef]
- de Jong, D.H.; Singh, G.; Bennett, W.F.D.; Arnarez, C.; Wassenaar, T.A.; Schäfer, L.V.; Periole, X.; Tieleman, D.P.; Marrink, S.J. Improved Parameters for the Martini Coarse-Grained Protein Force Field. J. Chem. Theory Comput. 2013, 9, 687–697. [Google Scholar] [CrossRef]
- Marrink, S.J.; de Vries, A.H.; Mark, A.E. Coarse Grained Model for Semiquantitative Lipid Simulations. J. Phys. Chem. B 2004, 108, 750–760. [Google Scholar] [CrossRef]
- Marrink, S.J.; Risselada, H.J.; Yefimov, S.; Tieleman, D.P.; de Vries, A.H. The MARTINI Force Field: Coarse Grained Model for Biomolecular Simulations. J. Phys. Chem. B 2007, 111, 7812–7824. [Google Scholar] [CrossRef] [PubMed]
- Monticelli, L.; Kandasamy, S.K.; Periole, X.; Larson, R.G.; Tieleman, D.P.; Marrink, S.-J. The MARTINI Coarse-Grained Force Field: Extension to Proteins. J. Chem. Theory Comput. 2008, 4, 819–834. [Google Scholar] [CrossRef]
- Periole, X.; Cavalli, M.; Marrink, S.-J.; Ceruso, M.A. Combining an Elastic Network with a Coarse-Grained Molecular Force Field: Structure, Dynamics, and Intermolecular Recognition. J. Chem. Theory Comput. 2009, 5, 2531–2543. [Google Scholar] [CrossRef] [PubMed]
- Wassenaar, T.A.; Ingólfsson, H.I.; Böckmann, R.A.; Tieleman, D.P.; Marrink, S.J. Computational Lipidomics with Insane: A Versatile Tool for Generating Custom Membranes for Molecular Simulations. J. Chem. Theory Comput. 2015, 11, 2144–2155. [Google Scholar] [CrossRef] [PubMed]
- Pronk, S.; Páll, S.; Schulz, R.; Larsson, P.; Bjelkmar, P.; Apostolov, R.; Shirts, M.R.; Smith, J.C.; Kasson, P.M.; van der Spoel, D.; et al. GROMACS 4.5: A High-Throughput and Highly Parallel Open Source Molecular Simulation Toolkit. Bioinformatics 2013, 29, 845–854. [Google Scholar] [CrossRef]
- van der Spoel, D.; Lindahl, E.; Hess, B.; Groenhof, G.; Mark, A.E.; Berendsen, H.J.C. GROMACS: Fast, Flexible, and Free. J. Comput. Chem. 2005, 26, 1701–1718. [Google Scholar] [CrossRef]
- Abraham, M.J.; Murtola, T.; Schulz, R.; Páll, S.; Smith, J.C.; Hess, B.; Lindahl, E. GROMACS: High Performance Molecular Simulations through Multi-Level Parallelism from Laptops to Supercomputers. SoftwareX 2015, 1–2, 19–25. [Google Scholar] [CrossRef]
- de Jong, D.H.; Baoukina, S.; Ingólfsson, H.I.; Marrink, S.J. Martini Straight: Boosting Performance Using a Shorter Cutoff and GPUs. Comput. Phys. Commun. 2016, 199, 1–7. [Google Scholar] [CrossRef]
- Gowers, R.; Linke, M.; Barnoud, J.; Reddy, T.; Melo, M.; Seyler, S.; Domański, J.; Dotson, D.; Buchoux, S.; Kenney, I.; et al. MDAnalysis: A Python Package for the Rapid Analysis of Molecular Dynamics Simulations. In Proceedings of the 15th Python in Science Conference, Austin, TX, USA, 11–17 July 2016; pp. 98–105. [Google Scholar] [CrossRef]
- Michaud-Agrawal, N.; Denning, E.J.; Woolf, T.B.; Beckstein, O. MDAnalysis: A Toolkit for the Analysis of Molecular Dynamics Simulations. J. Comput. Chem. 2011, 32, 2319–2327. [Google Scholar] [CrossRef]
- Madeira, F.; Park, Y.M.; Lee, J.; Buso, N.; Gur, T.; Madhusoodanan, N.; Basutkar, P.; Tivey, A.R.N.; Potter, S.C.; Finn, R.D.; et al. The EMBL-EBI Search and Sequence Analysis Tools APIs in 2019. Nucleic Acids Res. 2019, 47, W636–W641. [Google Scholar] [CrossRef]
- Sievers, F.; Wilm, A.; Dineen, D.; Gibson, T.J.; Karplus, K.; Li, W.; Lopez, R.; McWilliam, H.; Remmert, M.; Söding, J.; et al. Fast, Scalable Generation of High-quality Protein Multiple Sequence Alignments Using Clustal Omega. Mol. Syst. Biol. 2011, 7, 539. [Google Scholar] [CrossRef] [PubMed]
- Venema, K.; Palmgren, M.G. Metabolic Modulation of Transport Coupling Ratio in Yeast Plasma Membrane H+-ATPase. J. Biol. Chem. 1995, 270, 19659–19667. [Google Scholar] [CrossRef] [PubMed]
- Eriks, L.R.; Mayor, J.A.; Kaplan, R.S. A Strategy for Identification and Quantification of Detergents Frequently Used in the Purification of Membrane Proteins. Anal. Biochem. 2003, 323, 234–241. [Google Scholar] [CrossRef] [PubMed]


Disclaimer/Publisher’s Note: The statements, opinions and data contained in all publications are solely those of the individual author(s) and contributor(s) and not of MDPI and/or the editor(s). MDPI and/or the editor(s) disclaim responsibility for any injury to people or property resulting from any ideas, methods, instructions or products referred to in the content. |
© 2023 by the authors. Licensee MDPI, Basel, Switzerland. This article is an open access article distributed under the terms and conditions of the Creative Commons Attribution (CC BY) license (https://creativecommons.org/licenses/by/4.0/).
Share and Cite
Paweletz, L.C.; Holtbrügge, S.L.; Löb, M.; De Vecchis, D.; Schäfer, L.V.; Günther Pomorski, T.; Justesen, B.H. Anionic Phospholipids Stimulate the Proton Pumping Activity of the Plant Plasma Membrane P-Type H+-ATPase. Int. J. Mol. Sci. 2023, 24, 13106. https://doi.org/10.3390/ijms241713106
Paweletz LC, Holtbrügge SL, Löb M, De Vecchis D, Schäfer LV, Günther Pomorski T, Justesen BH. Anionic Phospholipids Stimulate the Proton Pumping Activity of the Plant Plasma Membrane P-Type H+-ATPase. International Journal of Molecular Sciences. 2023; 24(17):13106. https://doi.org/10.3390/ijms241713106
Chicago/Turabian StylePaweletz, Laura C., Simon L. Holtbrügge, Malina Löb, Dario De Vecchis, Lars V. Schäfer, Thomas Günther Pomorski, and Bo Højen Justesen. 2023. "Anionic Phospholipids Stimulate the Proton Pumping Activity of the Plant Plasma Membrane P-Type H+-ATPase" International Journal of Molecular Sciences 24, no. 17: 13106. https://doi.org/10.3390/ijms241713106
APA StylePaweletz, L. C., Holtbrügge, S. L., Löb, M., De Vecchis, D., Schäfer, L. V., Günther Pomorski, T., & Justesen, B. H. (2023). Anionic Phospholipids Stimulate the Proton Pumping Activity of the Plant Plasma Membrane P-Type H+-ATPase. International Journal of Molecular Sciences, 24(17), 13106. https://doi.org/10.3390/ijms241713106