
Serum 5-Methyltetrahydrofolate Status Is Associated with One-Carbon Metabolism-Related Metabolite Concentrations and Enzyme Activity Indicators in Young Women

 , ,
, ,
Abstract
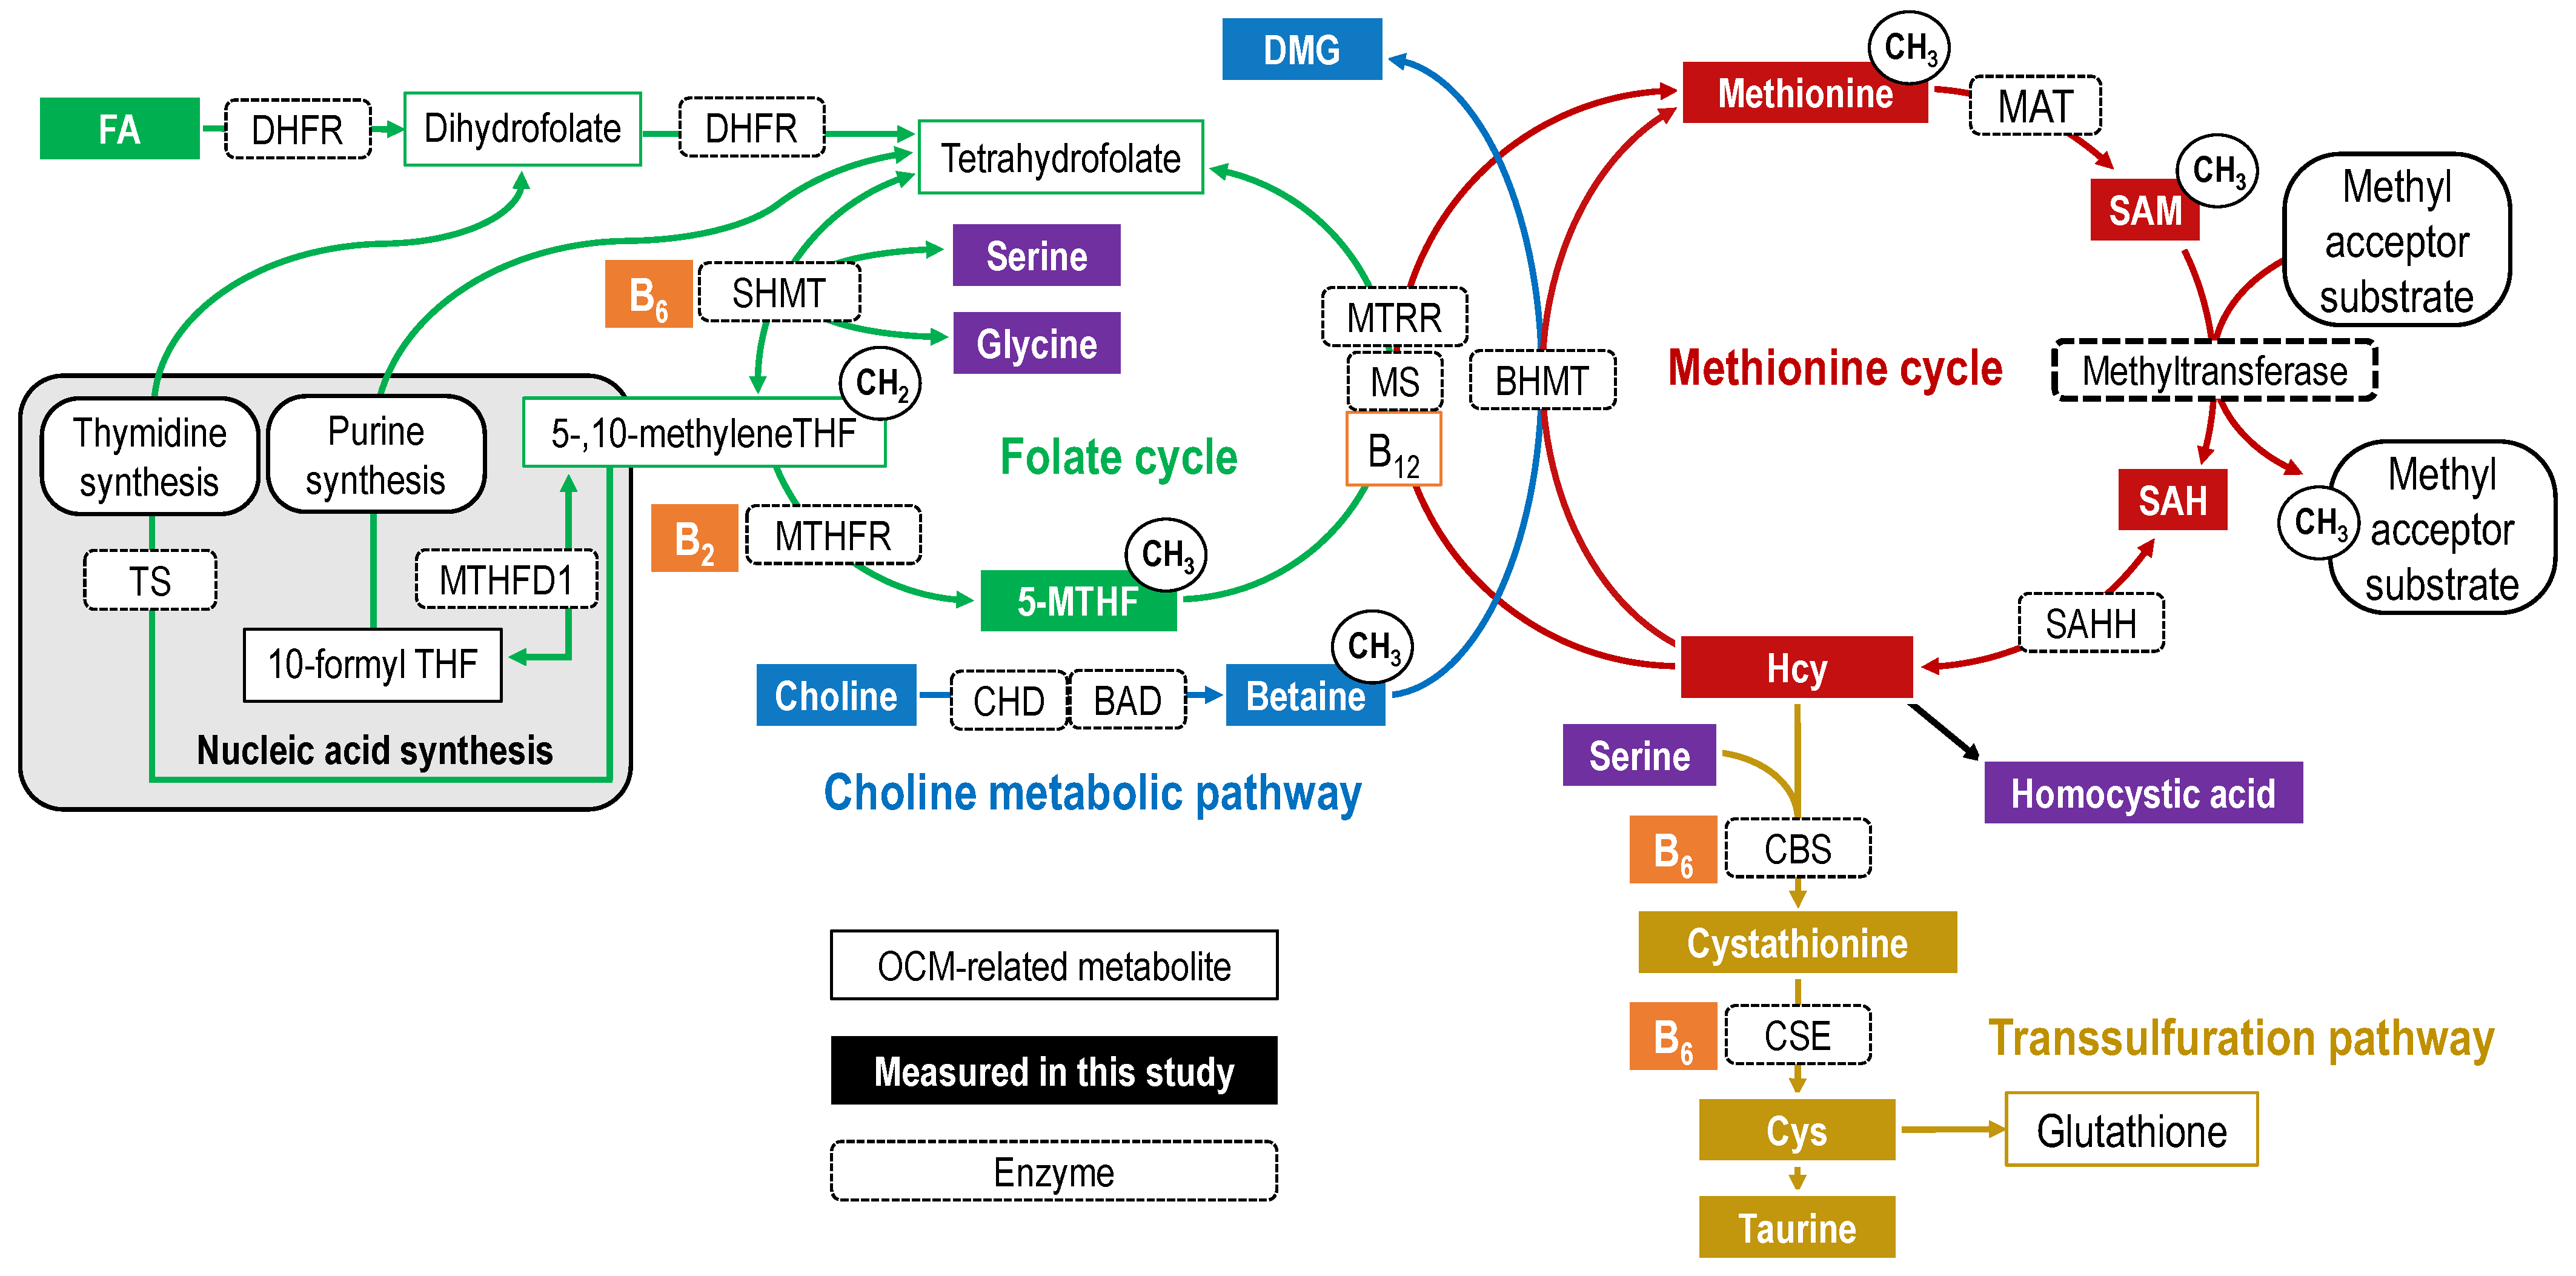
1. Introduction
2. Results
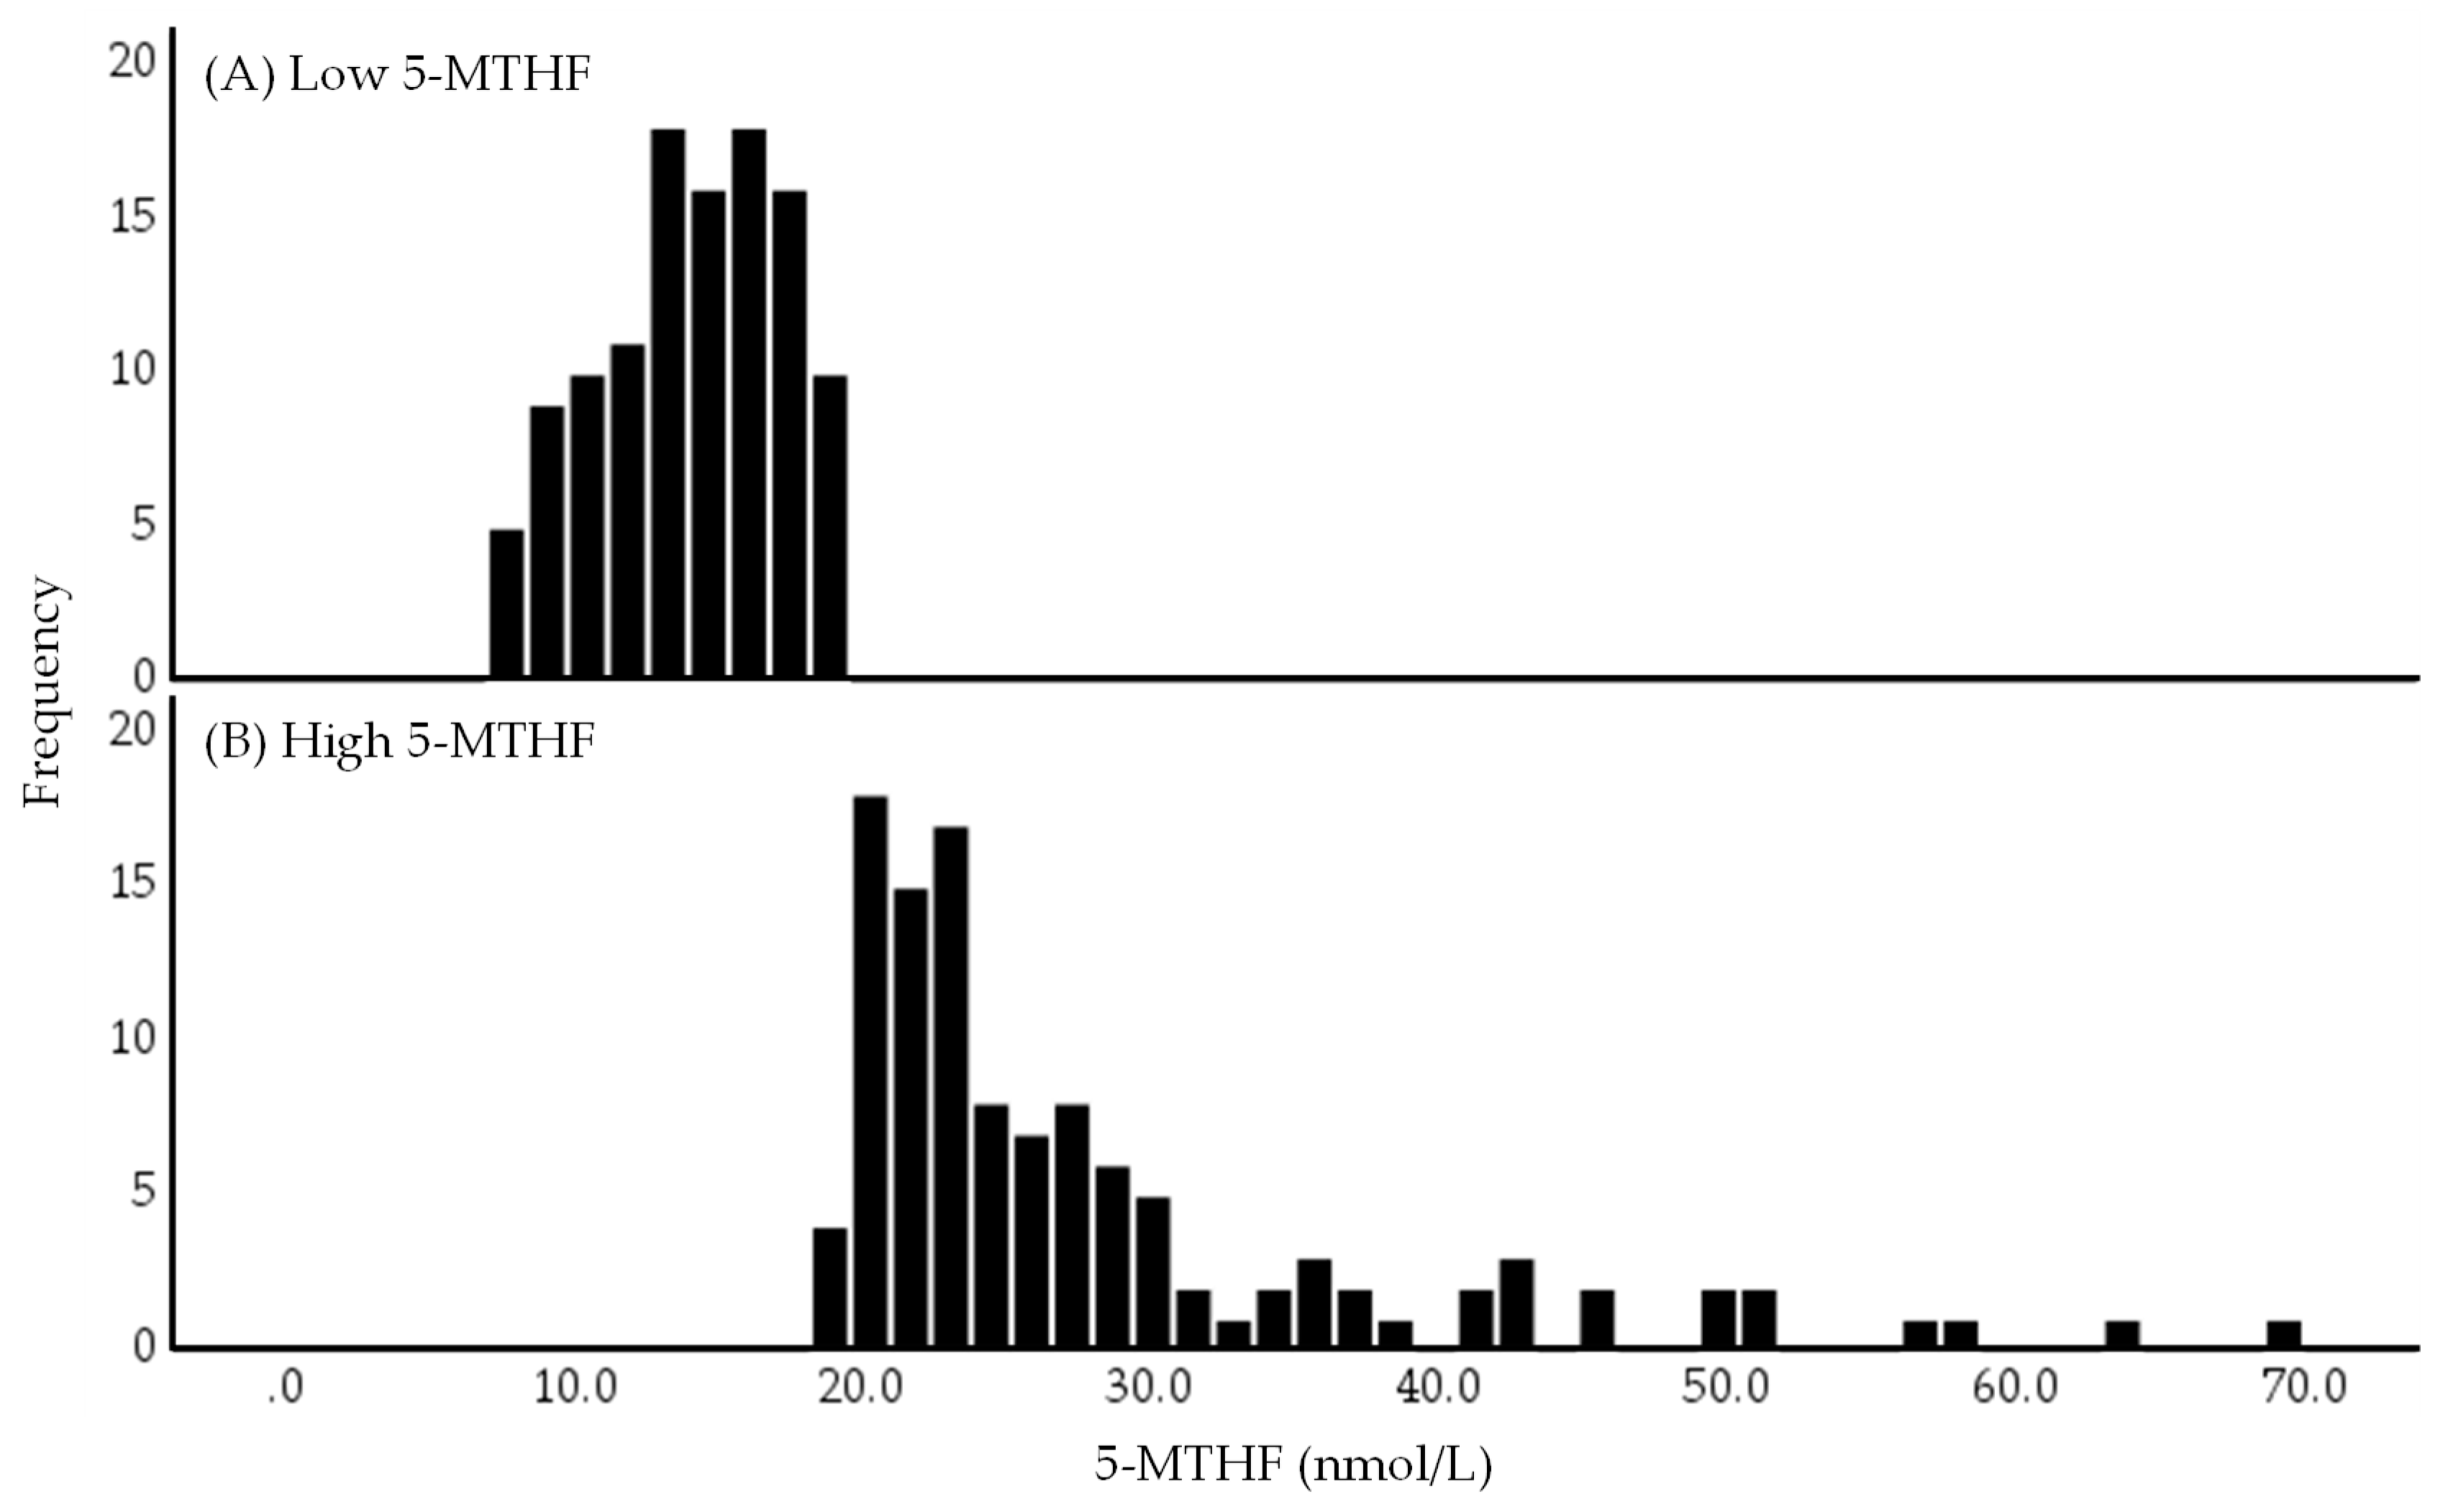
2.1. Distribution of Serum 5-MTHF Concentrations in Low and High 5-MTHF Groups
2.2. Characteristics of the Study Population
2.3. Energy and Nutrient Intakes
2.4. Distribution of Serum OCM-Related Metabolite Concentrations
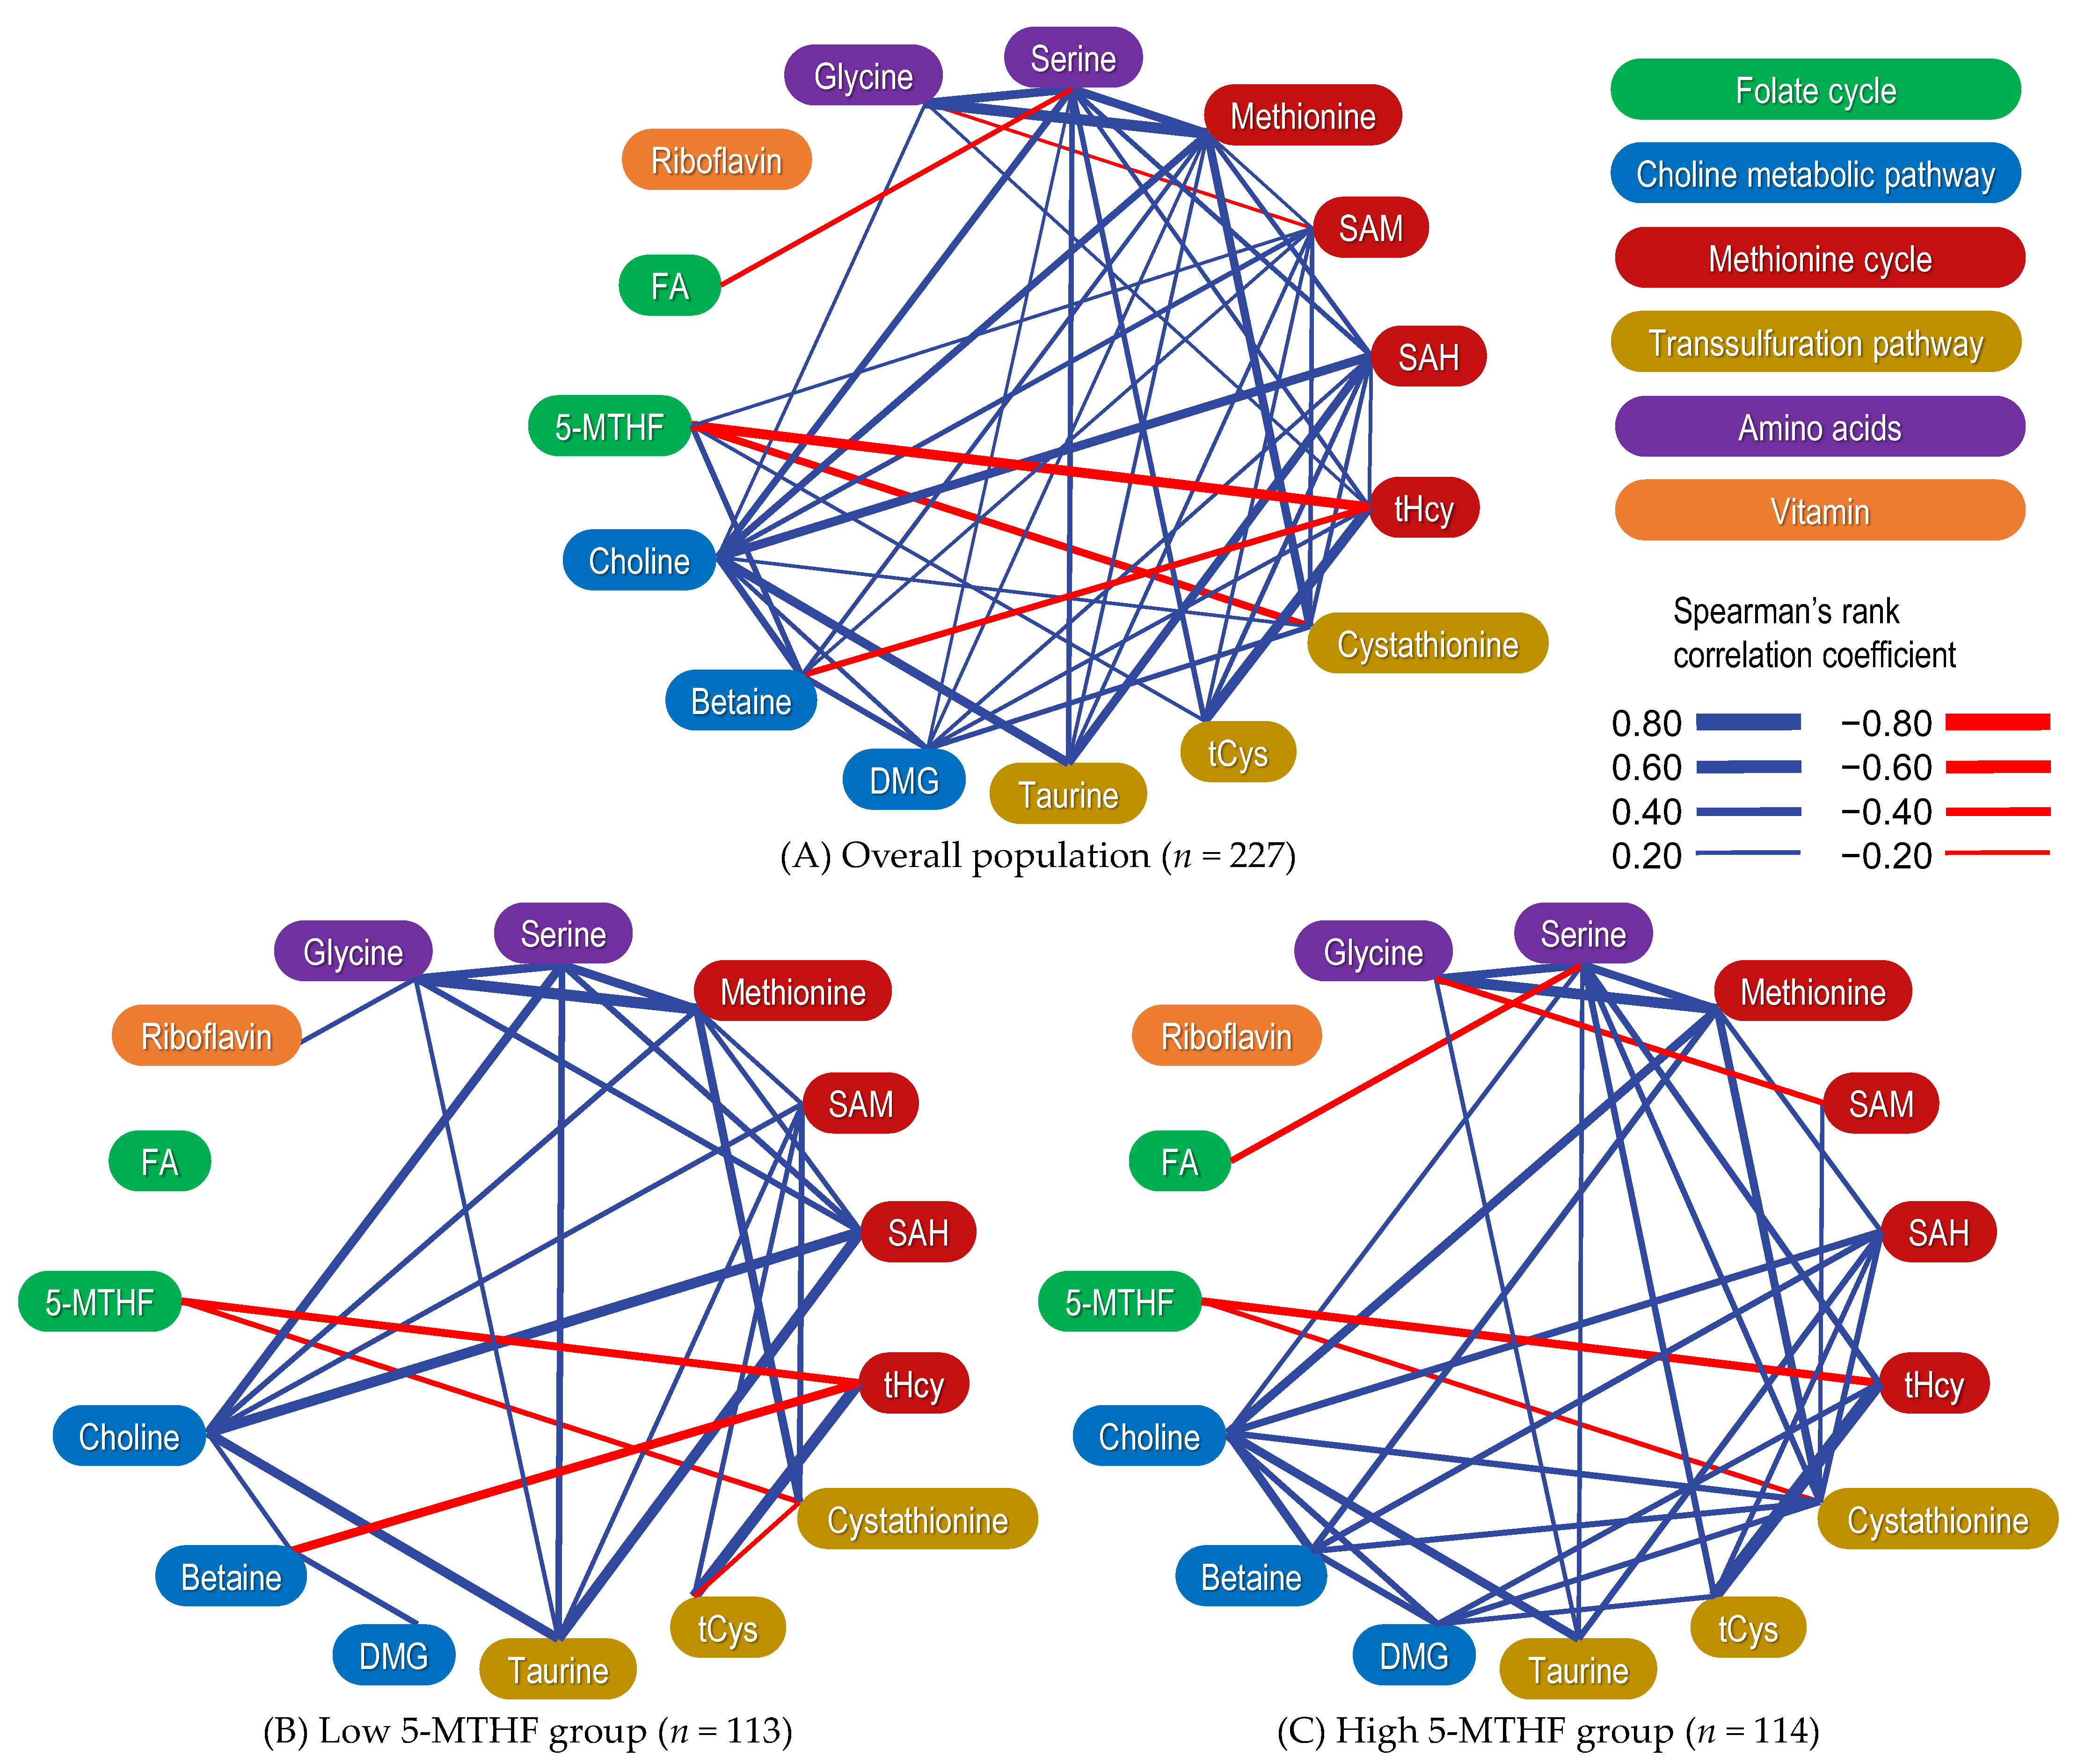
2.5. Correlation between Serum OCM-Related Metabolite Concentrations
2.6. Correlation between OCM-Related Metabolites Stratified by 5-MTHF Status
3. Discussion
4. Materials and Methods
4.1. Study Design
4.2. Participants
4.3. Ethics
4.4. Sample Collection and Processing
4.5. Measurement of Serum OCM-Related Metabolites
4.6. Attribute Data
4.7. Nutrient Intake
4.8. Blood Pressure Measurement
4.9. Anthropometric Data
4.10. Statistical Analysis
5. Conclusions
Supplementary Materials
Author Contributions
Funding
Institutional Review Board Statement
Informed Consent Statement
Data Availability Statement
Acknowledgments
Conflicts of Interest
Abbreviations
| 5-MTHF | 5-methyltetrahydrofolate |
| BHMT | Betaine–homocysteine S-methyltransferase |
| BMI | Body mass index |
| CBS | Cystathionine β-synthase |
| CSE | Cystathionine γ-lyase |
| Cys | Cysteine |
| DMG | Dimethylglycine |
| FA | Folic acid |
| Hcy | Homocysteine |
| MAT | Methionine adenosyltransferase |
| MTHFR | Methylenetetrahydrofolate reductase |
| OCM | One-carbon metabolism |
| SAH | S-adenosylhomocysteine |
| SAM | S-adenosylmethionine |
| tCys | Total cysteine |
| tHcy | Total homocysteine |
| THF | Tetrahydrofolate |
Appendix A
Appendix A.1. Association between Betaine Concentrations and tHcy/tCys Ratio
Appendix A.2. Association between Betaine and SAM Concentrations
Appendix A.3. 5-MTHF Status and its Association with Choline Metabolic Pathways
References
- Clare, C.E.; Brassington, A.H.; Kwong, W.Y.; Sinclair, K.D. One-Carbon Metabolism: Linking Nutritional Biochemistry to Epigenetic Programming of Long-Term Development. Annu. Rev. Anim. Biosci. 2019, 7, 263–287. [Google Scholar] [CrossRef]
- Stover, P.J.; Field, M.S. Trafficking of intracellular folates. Adv. Nutr. 2011, 2, 325–331. [Google Scholar] [CrossRef]
- Shane, B. Folate and vitamin B12 metabolism: Overview and interaction with riboflavin, vitamin B6, and polymorphisms. Food Nutr. Bull. 2008, 29, S5–S16. discussion S17–S19. [Google Scholar] [CrossRef] [PubMed]
- Schnell, J.R.; Dyson, H.J.; Wright, P.E. Structure, dynamics, and catalytic function of dihydrofolate reductase. Annu. Rev. Biophys. Biomol. Struct. 2004, 33, 119–140. [Google Scholar] [CrossRef] [PubMed]
- Rao, N.A.; Ambili, M.; Jala, V.R.; Subramanya, H.S.; Savithri, H.S. Structure-function relationship in serine hydroxymethyltransferase. Biochim. Biophys. Acta 2003, 1647, 24–29. [Google Scholar] [CrossRef]
- Födinger, M.; Hörl, W.H.; Sunder-Plassmann, G. Molecular biology of 5,10-methylenetetrahydrofolate reductase. J. Nephrol. 2000, 13, 20–33. [Google Scholar]
- Pfeiffer, C.M.; Fazili, Z.; McCoy, L.; Zhang, M.; Gunter, E.W. Determination of folate vitamers in human serum by stable-isotope-dilution tandem mass spectrometry and comparison with radioassay and microbiologic assay. Clin. Chem. 2004, 50, 423–432. [Google Scholar] [CrossRef]
- Kirsch, S.H.; Knapp, J.P.; Herrmann, W.; Obeid, R. Quantification of key folate forms in serum using stable-isotope dilution ultra performance liquid chromatography-tandem mass spectrometry. J. Chromatogr. B Analyt. Technol. Biomed. Life Sci. 2010, 878, 68–75. [Google Scholar] [CrossRef]
- Craig, S.A. Betaine in human nutrition. Am. J. Clin. Nutr. 2004, 80, 539–549. [Google Scholar] [CrossRef] [PubMed]
- Sunden, S.L.; Renduchintala, M.S.; Park, E.I.; Miklasz, S.D.; Garrow, T.A. Betaine-homocysteine methyltransferase expression in porcine and human tissues and chromosomal localization of the human gene. Arch. Biochem. Biophys. 1997, 345, 171–174. [Google Scholar] [CrossRef] [PubMed]
- Finkelstein, J.D.; Harris, B.J.; Kyle, W.E. Methionine metabolism in mammals: Kinetic study of betaine-homocysteine methyltransferase. Arch. Biochem. Biophys. 1972, 153, 320–324. [Google Scholar] [CrossRef] [PubMed]
- Sullivan, D.M.; Hoffman, J.L. Fractionation and kinetic properties of rat liver and kidney methionine adenosyltransferase isozymes. Biochemistry 1983, 22, 1636–1641. [Google Scholar] [CrossRef]
- Chiang, P.K.; Gordon, R.K.; Tal, J.; Zeng, G.C.; Doctor, B.P.; Pardhasaradhi, K.; McCann, P.P. S-Adenosylmethionine and methylation. FASEB J. 1996, 10, 471–480. [Google Scholar] [CrossRef] [PubMed]
- Lucock, M. Folic acid: Nutritional biochemistry, molecular biology, and role in disease processes. Mol. Genet. Metab. 2000, 71, 121–138. [Google Scholar] [CrossRef]
- Ducker, G.S.; Rabinowitz, J.D. One-Carbon Metabolism in Health and Disease. Cell. Metab. 2017, 25, 27–42. [Google Scholar] [CrossRef]
- Finkelstein, J.D. The metabolism of homocysteine: Pathways and regulation. Eur. J. Pediatr. 1998, 157 (Suppl. S2), S40–S44. [Google Scholar] [CrossRef] [PubMed]
- Caudill, M.; Bailey, L. Folate and choline interrelationships: Metabolic and potential health implications. In Folate in Health and Disease, 2nd ed.; CRC Press: Boca Raton, FL, USA; Taylor and Francis Group: Oxford, UK, 2009; pp. 449–465. [Google Scholar]
- Sbodio, J.I.; Snyder, S.H.; Paul, B.D. Regulators of the transsulfuration pathway. Br. J. Pharmacol. 2019, 176, 583–593. [Google Scholar] [CrossRef]
- Stipanuk, M.H. Sulfur amino acid metabolism: Pathways for production and removal of homocysteine and cysteine. Annu. Rev. Nutr. 2004, 24, 539–577. [Google Scholar] [CrossRef]
- Banerjee, R.; Zou, C.G. Redox regulation and reaction mechanism of human cystathionine-β-synthase: A PLP-dependent hemesensor protein. Arch. Biochem. Biophys. 2005, 433, 144–156. [Google Scholar] [CrossRef]
- Jurkowska, H.; Kaczor-Kaminska, M.; Bronowicka-Adamska, P.; Wrobel, M. Cystathionine γ-lyase. Postepy Hig. Med. Dosw. Online 2014, 68, 1–9. [Google Scholar] [CrossRef]
- Guttormsen, A.B.; Schneede, J.; Ueland, P.M.; Refsum, H. Kinetics of total plasma homocysteine in subjects with hyperhomocysteinemia due to folate or cobalamin deficiency. Am. J. Clin. Nutr. 1996, 63, 194–202. [Google Scholar] [CrossRef]
- Peng, H.Y.; Man, C.F.; Xu, J.; Fan, Y. Elevated homocysteine levels and risk of cardiovascular and all-cause mortality: A meta-analysis of prospective studies. J. Zhejiang Univ. Sci. B 2015, 16, 78–86. [Google Scholar] [CrossRef] [PubMed]
- Humphrey, L.L.; Fu, R.; Rogers, K.; Freeman, M.; Helfand, M. Homocysteine level and coronary heart disease incidence: A systematic review and meta-analysis. Mayo Clin. Proc. 2008, 83, 1203–1212. [Google Scholar] [CrossRef] [PubMed]
- Wu, X.; Zhou, Q.; Chen, Q.; Li, Q.; Guo, C.; Tian, G.; Qie, R.; Han, M.; Huang, S.; Li, Y.; et al. Association of homocysteine level with risk of stroke: A dose-response meta-analysis of prospective cohort studies. Nutr. Metab. Cardiovasc. Dis. 2020, 30, 1861–1869. [Google Scholar] [CrossRef] [PubMed]
- Rabelo, N.N.; Telles, J.P.M.; Pipek, L.Z.; Nascimento, R.F.V.; Gusmao, R.C.; Teixeira, M.J.; Figueiredo, E.G. Homocysteine is associated with higher risks of ischemic stroke: A systematic review and meta-analysis. PLoS ONE 2022, 17, e0276087. [Google Scholar] [CrossRef] [PubMed]
- Ho, R.C.; Cheung, M.W.; Fu, E.; Win, H.H.; Zaw, M.H.; Ng, A.; Mak, A. Is high homocysteine level a risk factor for cognitive decline in elderly? A systematic review, meta-analysis, and meta-regression. Am. J. Geriatr. Psychiatry 2011, 19, 607–617. [Google Scholar] [CrossRef]
- Wang, Q.; Zhao, J.; Chang, H.; Liu, X.; Zhu, R. Homocysteine and Folic Acid: Risk Factors for Alzheimer’s Disease-An Updated Meta—Analysis. Front. Aging Neurosci. 2021, 13, 665114. [Google Scholar] [CrossRef]
- Muntjewerff, J.W.; Kahn, R.S.; Blom, H.J.; den Heijer, M. Homocysteine, methylenetetrahydrofolate reductase and risk of schizophrenia: A meta-analysis. Mol. Psychiatry 2006, 11, 143–149. [Google Scholar] [CrossRef]
- Numata, S.; Kinoshita, M.; Tajima, A.; Nishi, A.; Imoto, I.; Ohmori, T. Evaluation of an association between plasma total homocysteine and schizophrenia by a Mendelian randomization analysis. BMC Med. Genet. 2015, 16, 54. [Google Scholar] [CrossRef]
- Huang, P.; Wang, F.; Sah, B.K.; Jiang, J.; Ni, Z.; Wang, J.; Sun, X. Homocysteine and the risk of age-related macular degeneration: A systematic review and meta-analysis. Sci. Rep. 2015, 5, 10585. [Google Scholar] [CrossRef]
- Lei, X.; Zeng, G.; Zhang, Y.; Li, Q.; Zhang, J.; Bai, Z.; Yang, K. Association between homocysteine level and the risk of diabetic retinopathy: A systematic review and meta-analysis. Diabetol. Metab. Syndr. 2018, 10, 61. [Google Scholar] [CrossRef]
- He, T.; Jin, X.; Koh, Y.S.; Zhang, Q.; Zhang, C.; Liu, F. The association of homocysteine, folate, vitamin B12, and vitamin B6 with fracture incidence in older adults: A systematic review and meta-analysis. Ann. Transl. Med. 2021, 9, 1143. [Google Scholar] [CrossRef] [PubMed]
- Zheng, Y.; Deng, H.Y.; Qiao, Z.Y.; Gong, F.X. Homocysteine level and gestational diabetes mellitus: A systematic review and meta-analysis. Gynecol. Endocrinol. 2021, 37, 987–994. [Google Scholar] [CrossRef] [PubMed]
- Zhang, C.; Hu, J.; Wang, X.; Gu, H. High level of homocysteine is associated with pre-eclampsia risk in pregnant woman: A meta-analysis. Gynecol. Endocrinol. 2022, 38, 705–712. [Google Scholar] [CrossRef] [PubMed]
- Dai, C.; Fei, Y.; Li, J.; Shi, Y.; Yang, X. A Novel Review of Homocysteine and Pregnancy Complications. Biomed. Res. Int. 2021, 2021, 6652231. [Google Scholar] [CrossRef]
- Hogeveen, M.; Blom, H.J.; den Heijer, M. Maternal homocysteine and small-for-gestational-age offspring: Systematic review and meta-analysis. Am. J. Clin. Nutr. 2012, 95, 130–136. [Google Scholar] [CrossRef]
- Zhang, D.; Wen, X.; Wu, W.; Guo, Y.; Cui, W. Elevated homocysteine level and folate deficiency associated with increased overall risk of carcinogenesis: Meta-analysis of 83 case-control studies involving 35,758 individuals. PLoS ONE 2015, 10, e0123423. [Google Scholar] [CrossRef] [PubMed]
- Skovierova, H.; Vidomanova, E.; Mahmood, S.; Sopkova, J.; Drgova, A.; Cervenova, T.; Halasova, E.; Lehotsky, J. The Molecular and Cellular Effect of Homocysteine Metabolism Imbalance on Human Health. Int. J. Mol. Sci. 2016, 17, 1733. [Google Scholar] [CrossRef] [PubMed]
- Xiao, Y.; Su, X.; Huang, W.; Zhang, J.; Peng, C.; Huang, H.; Wu, X.; Huang, H.; Xia, M.; Ling, W. Role of S-adenosylhomocysteine in cardiovascular disease and its potential epigenetic mechanism. Int. J. Biochem. Cell Biol. 2015, 67, 158–166. [Google Scholar] [CrossRef]
- Marti-Carvajal, A.J.; Sola, I.; Lathyris, D.; Dayer, M. Homocysteine-lowering interventions for preventing cardiovascular events. Cochrane Database Syst. Rev. 2017, 8, CD006612. [Google Scholar] [CrossRef]
- Boldyrev, A.A. Molecular mechanisms of homocysteine toxicity. Biochemistry 2009, 74, 589–598. [Google Scholar] [CrossRef] [PubMed]
- Crider, K.S.; Devine, O.; Hao, L.; Dowling, N.F.; Li, S.; Molloy, A.M.; Li, Z.; Zhu, J.; Berry, R.J. Population red blood cell folate concentrations for prevention of neural tube defects: Bayesian model. BMJ 2014, 349, g4554. [Google Scholar] [CrossRef] [PubMed]
- Shaw, G.M.; Finnell, R.H.; Blom, H.J.; Carmichael, S.L.; Vollset, S.E.; Yang, W.; Ueland, P.M. Choline and risk of neural tube defects in a folate-fortified population. Epidemiology 2009, 20, 714–719. [Google Scholar] [CrossRef]
- Shaw, G.M.; Carmichael, S.L.; Yang, W.; Selvin, S.; Schaffer, D.M. Periconceptional dietary intake of choline and betaine and neural tube defects in offspring. Am. J. Epidemiol. 2004, 160, 102–109. [Google Scholar] [CrossRef] [PubMed]
- Mota-Martorell, N.; Jove, M.; Borras, C.; Berdun, R.; Obis, E.; Sol, J.; Cabre, R.; Pradas, I.; Galo-Licona, J.D.; Puig, J.; et al. Methionine transsulfuration pathway is upregulated in long-lived humans. Free Radic. Biol. Med. 2021, 162, 38–52. [Google Scholar] [CrossRef]
- Cochrane, K.M.; Williams, B.A.; Elango, R.; Barr, S.I.; Karakochuk, C.D. Pregnancy-induced alterations of 1-carbon metabolism and significance for maternal nutrition requirements. Nutr. Rev. 2022, 80, 1985–2001. [Google Scholar] [CrossRef]
- Kalhan, S.C. One carbon metabolism in pregnancy: Impact on maternal, fetal and neonatal health. Mol. Cell. Endocrinol. 2016, 435, 48–60. [Google Scholar] [CrossRef]
- Yetley, E.A.; Pfeiffer, C.M.; Phinney, K.W.; Fazili, Z.; Lacher, D.A.; Bailey, R.L.; Blackmore, S.; Bock, J.L.; Brody, L.C.; Carmel, R.; et al. Biomarkers of folate status in NHANES: A roundtable summary. Am. J. Clin. Nutr. 2011, 94, 303S–312S. [Google Scholar] [CrossRef]
- Sobczynska-Malefora, A.; Harrington, D.J. Laboratory assessment of folate (vitamin B(9)) status. J. Clin. Pathol. 2018, 71, 949–956. [Google Scholar] [CrossRef]
- Verstraete, J.; Kiekens, F.; Strobbe, S.; De Steur, H.; Gellynck, X.; Van Der Straeten, D.; Stove, C.P. Clinical determination of folates: Recent analytical strategies and challenges. Anal. Bioanal. Chem. 2019, 411, 4383–4399. [Google Scholar] [CrossRef]
- Menezo, Y.; Elder, K.; Clement, A.; Clement, P. Folic Acid, Folinic Acid, 5 Methyl TetraHydroFolate Supplementation for Mutations That Affect Epigenesis through the Folate and One-Carbon Cycles. Biomolecules 2022, 12, 197. [Google Scholar] [CrossRef] [PubMed]
- Nijhout, H.F.; Reed, M.C.; Lam, S.L.; Shane, B.; Gregory, J.F., 3rd; Ulrich, C.M. In silico experimentation with a model of hepatic mitochondrial folate metabolism. Theor. Biol. Med. Model. 2006, 3, 40. [Google Scholar] [CrossRef] [PubMed]
- King, W.D.; Ho, V.; Dodds, L.; Perkins, S.L.; Casson, R.I.; Massey, T.E. Relationships among biomarkers of one-carbon metabolism. Mol. Biol. Rep. 2012, 39, 7805–7812. [Google Scholar] [CrossRef]
- Obeid, R.; Kirsch, S.H.; Kasoha, M.; Eckert, R.; Herrmann, W. Concentrations of unmetabolized folic acid and primary folate forms in plasma after folic acid treatment in older adults. Metabolism 2011, 60, 673–680. [Google Scholar] [CrossRef]
- Fredriksen, A.; Meyer, K.; Ueland, P.M.; Vollset, S.E.; Grotmol, T.; Schneede, J. Large-scale population-based metabolic phenotyping of thirteen genetic polymorphisms related to one-carbon metabolism. Hum. Mutat. 2007, 28, 856–865. [Google Scholar] [CrossRef]
- Rooney, M.; Bottiglieri, T.; Wasek-Patterson, B.; McMahon, A.; Hughes, C.F.; McCann, A.; Horigan, G.; Strain, J.J.; McNulty, H.; Ward, M. Impact of the MTHFR C677T polymorphism on one-carbon metabolites: Evidence from a randomised trial of riboflavin supplementation. Biochimie 2020, 173, 91–99. [Google Scholar] [CrossRef]
- Zhang, H.Y.; Luo, G.A.; Liang, Q.L.; Wang, Y.; Yang, H.H.; Wang, Y.M.; Zheng, X.Y.; Song, X.M.; Chen, G.; Zhang, T.; et al. Neural tube defects and disturbed maternal folate- and homocysteine-mediated one-carbon metabolism. Exp. Neurol. 2008, 212, 515–521. [Google Scholar] [CrossRef]
- Ulvik, A.; Hustad, S.; McCann, A.; Midttun, O.; Nygard, O.K.; Ueland, P.M. Ratios of One-Carbon Metabolites Are Functional Markers of B-Vitamin Status in a Norwegian Coronary Angiography Screening Cohort. J. Nutr. 2017, 147, 1167–1173. [Google Scholar] [CrossRef]
- Kvestad, I.; McCann, A.; Chandyo, R.K.; Giil, L.M.; Shrestha, M.; Ulak, M.; Hysing, M.; Ueland, P.M.; Strand, T.A. One-Carbon Metabolism in Nepalese Infant-Mother Pairs and Child Cognition at 5 Years Old. J. Nutr. 2021, 151, 883–891. [Google Scholar] [CrossRef]
- Eussen, S.J.; Nilsen, R.M.; Midttun, O.; Hustad, S.; Ijssennagger, N.; Meyer, K.; Fredriksen, A.; Ulvik, A.; Ueland, P.M.; Brennan, P.; et al. North-south gradients in plasma concentrations of B-vitamins and other components of one-carbon metabolism in Western Europe: Results from the European Prospective Investigation into Cancer and Nutrition (EPIC) Study. Br. J. Nutr. 2013, 110, 363–374. [Google Scholar] [CrossRef] [PubMed]
- Sadre-Marandi, F.; Dahdoul, T.; Reed, M.C.; Nijhout, H.F. Sex differences in hepatic one-carbon metabolism. BMC Syst. Biol. 2018, 12, 89. [Google Scholar] [CrossRef]
- Obeid, R.; Schon, C.; Pietrzik, K.; Menzel, D.; Wilhelm, M.; Smulders, Y.; Knapp, J.P.; Bohni, R. Pharmacokinetics of Sodium and Calcium Salts of (6S)-5-Methyltetrahydrofolic Acid Compared to Folic Acid and Indirect Comparison of the Two Salts. Nutrients 2020, 12, 3623. [Google Scholar] [CrossRef]
- Hannisdal, R.; Ueland, P.M.; Svardal, A. Liquid chromatography-tandem mass spectrometry analysis of folate and folate catabolites in human serum. Clin. Chem. 2009, 55, 1147–1154. [Google Scholar] [CrossRef] [PubMed]
- Fazili, Z.; Sternberg, M.R.; Potischman, N.; Wang, C.Y.; Storandt, R.J.; Yeung, L.; Yamini, S.; Gahche, J.J.; Juan, W.; Qi, Y.P.; et al. Demographic, Physiologic, and Lifestyle Characteristics Observed with Serum Total Folate Differ among Folate Forms: Cross-Sectional Data from Fasting Samples in the NHANES 2011–2016. J. Nutr. 2020, 150, 851–860. [Google Scholar] [CrossRef] [PubMed]
- Melse-Boonstra, A.; Holm, P.I.; Ueland, P.M.; Olthof, M.; Clarke, R.; Verhoef, P. Betaine concentration as a determinant of fasting total homocysteine concentrations and the effect of folic acid supplementation on betaine concentrations. Am. J. Clin. Nutr. 2005, 81, 1378–1382. [Google Scholar] [CrossRef] [PubMed]
- Holm, P.I.; Ueland, P.M.; Kvalheim, G.; Lien, E.A. Determination of choline, betaine, and dimethylglycine in plasma by a high-throughput method based on normal-phase chromatography-tandem mass spectrometry. Clin. Chem. 2003, 49, 286–294. [Google Scholar] [CrossRef] [PubMed]
- Holm, P.I.; Ueland, P.M.; Vollset, S.E.; Midttun, O.; Blom, H.J.; Keijzer, M.B.; den Heijer, M. Betaine and folate status as cooperative determinants of plasma homocysteine in humans. Arter. Thromb. Vasc. Biol. 2005, 25, 379–385. [Google Scholar] [CrossRef] [PubMed]
- Midttun, O.; Hustad, S.; Schneede, J.; Vollset, S.E.; Ueland, P.M. Plasma vitamin B-6 forms and their relation to transsulfuration metabolites in a large, population-based study. Am. J. Clin. Nutr. 2007, 86, 131–138. [Google Scholar] [CrossRef]
- Guiraud, S.P.; Montoliu, I.; Da Silva, L.; Dayon, L.; Galindo, A.N.; Corthesy, J.; Kussmann, M.; Martin, F.P. High-throughput and simultaneous quantitative analysis of homocysteine-methionine cycle metabolites and co-factors in blood plasma and cerebrospinal fluid by isotope dilution LC-MS/MS. Anal. Bioanal. Chem. 2017, 409, 295–305. [Google Scholar] [CrossRef]
- Reed, M.C.; Nijhout, H.F.; Neuhouser, M.L.; Gregory, J.F., 3rd; Shane, B.; James, S.J.; Boynton, A.; Ulrich, C.M. A mathematical model gives insights into nutritional and genetic aspects of folate-mediated one-carbon metabolism. J. Nutr. 2006, 136, 2653–2661. [Google Scholar] [CrossRef]
- Wagner, C.; Briggs, W.T.; Cook, R.J. Inhibition of glycine N-methyltransferase activity by folate derivatives: Implications for regulation of methyl group metabolism. Biochem. Biophys. Res. Commun. 1985, 127, 746–752. [Google Scholar] [CrossRef] [PubMed]
- Reed, M.C.; Gamble, M.V.; Hall, M.N.; Nijhout, H.F. Mathematical analysis of the regulation of competing methyltransferases. BMC Syst. Biol. 2015, 9, 69. [Google Scholar] [CrossRef] [PubMed]
- Jencks, D.A.; Mathews, R.G. Allosteric inhibition of methylenetetrahydrofolate reductase by adenosylmethionine. Effects of adenosylmethionine and NADPH on the equilibrium between active and inactive forms of the enzyme and on the kinetics of approach to equilibrium. J. Biol. Chem. 1987, 262, 2485–2493. [Google Scholar] [CrossRef] [PubMed]
- Kutzbach, C.; Stokstad, E.L. Mammalian methylenetetrahydrofolate reductase. Partial purification, properties, and inhibition by S-adenosylmethionine. Biochim. Biophys. Acta 1971, 250, 459–477. [Google Scholar] [CrossRef] [PubMed]
- Finkelstein, J.D.; Martin, J.J. Inactivation of betaine-homocysteine methyltransferase by adenosylmethionine and adenosylethionine. Biochem. Biophys. Res. Commun. 1984, 118, 14–19. [Google Scholar] [CrossRef] [PubMed]
- Garcia-Trevijano, E.R.; Latasa, M.U.; Carretero, M.V.; Berasain, C.; Mato, J.M.; Avila, M.A. S-adenosylmethionine regulates MAT1A and MAT2A gene expression in cultured rat hepatocytes: A new role for S-adenosylmethionine in the maintenance of the differentiated status of the liver. FASEB J. 2000, 14, 2511–2518. [Google Scholar] [CrossRef] [PubMed]
- Finkelstein, J.D.; Kyle, W.E.; Martin, J.L.; Pick, A.M. Activation of cystathionine synthase by adenosylmethionine and adenosylethionine. Biochem. Biophys. Res. Commun. 1975, 66, 81–87. [Google Scholar] [CrossRef]
- Duncan, T.M.; Reed, M.C.; Nijhout, H.F. A population model of folate-mediated one-carbon metabolism. Nutrients 2013, 5, 2457–2474. [Google Scholar] [CrossRef]
- Duncan, T.M.; Reed, M.C.; Nijhout, H.F. The relationship between intracellular and plasma levels of folate and metabolites in the methionine cycle: A model. Mol. Nutr. Food Res. 2013, 57, 628–636. [Google Scholar] [CrossRef]
- Kubo, Y.; Fukuoka, H.; Kawabata, T.; Shoji, K.; Mori, C.; Sakurai, K.; Nishikawa, M.; Ohkubo, T.; Oshida, K.; Yanagisawa, N.; et al. Distribution of 5-Methyltetrahydrofolate and Folic Acid Levels in Maternal and Cord Blood Serum: Longitudinal Evaluation of Japanese Pregnant Women. Nutrients 2020, 12, 1633. [Google Scholar] [CrossRef]
- Cheng, Y.; Liu, S.; Chen, D.; Yang, Y.; Liang, Q.; Huo, Y.; Zhou, Z.; Zhang, N.; Wang, Z.; Liu, L.; et al. Association between serum 5-methyltetrahydrofolate and homocysteine in Chinese hypertensive participants with different MTHFR C677T polymorphisms: A cross-sectional study. Nutr. J. 2022, 21, 29. [Google Scholar] [CrossRef]
- Lima, A.; Ferin, R.; Bourbon, M.; Baptista, J.; Pavao, M.L. Hypercysteinemia, A Potential Risk Factor for Central Obesity and Related Disorders in Azores, Portugal. J. Nutr. Metab. 2019, 2019, 1826780. [Google Scholar] [CrossRef] [PubMed]
- Mansoor, M.A.; Hervig, T.; Stakkestad, J.A.; Drablos, P.A.; Apeland, T.; Wentzel-Larsen, T.; Bates, C.J. Serum folate is significantly correlated with plasma cysteine concentrations in healthy industry workers. Ann. Nutr. Metab. 2011, 58, 68–73. [Google Scholar] [CrossRef] [PubMed]
- Finkelstein, J.D. Metabolic regulatory properties of S-adenosylmethionine and S-adenosylhomocysteine. Clin. Chem. Lab. Med. 2007, 45, 1694–1699. [Google Scholar] [CrossRef] [PubMed]
- Finkelstein, J.D.; Kyle, W.E.; Harris, B.J. Methionine metabolism in mammals: Regulatory effects of S-adenosylhomocysteine. Arch. Biochem. Biophys. 1974, 165, 774–779. [Google Scholar] [CrossRef] [PubMed]
- Gylling, B.; Myte, R.; Ulvik, A.; Ueland, P.M.; Midttun, O.; Schneede, J.; Hallmans, G.; Haggstrom, J.; Johansson, I.; Van Guelpen, B.; et al. One-carbon metabolite ratios as functional B-vitamin markers and in relation to colorectal cancer risk. Int. J. Cancer 2019, 144, 947–956. [Google Scholar] [CrossRef]
- Li, Z.; Liu, M.; Chen, C.; Pan, Y.; Cui, X.; Sun, J.; Zhao, F.; Cao, Y. Simultaneous determination of serum homocysteine, cysteine, and methionine in patients with schizophrenia by liquid chromatography-tandem mass spectrometry. Biomed. Chromatogr. 2022, 36, e5366. [Google Scholar] [CrossRef]
- Miller, J.W.; Beresford, S.A.; Neuhouser, M.L.; Cheng, T.Y.; Song, X.; Brown, E.C.; Zheng, Y.; Rodriguez, B.; Green, R.; Ulrich, C.M. Homocysteine, cysteine, and risk of incident colorectal cancer in the Women’s Health Initiative observational cohort. Am. J. Clin. Nutr. 2013, 97, 827–834. [Google Scholar] [CrossRef]
- Keller, A.C.; Klawitter, J.; Hildreth, K.L.; Christians, U.; Putnam, K.; Kohrt, W.M.; Reusch, J.E.B.; Moreau, K.L. Elevated plasma homocysteine and cysteine are associated with endothelial dysfunction across menopausal stages in healthy women. J. Appl. Physiol. 2019, 126, 1533–1540. [Google Scholar] [CrossRef]
- Imbard, A.; Smulders, Y.M.; Barto, R.; Smith, D.E.; Kok, R.M.; Jakobs, C.; Blom, H.J. Plasma choline and betaine correlate with serum folate, plasma S-adenosyl-methionine and S-adenosyl-homocysteine in healthy volunteers. Clin. Chem. Lab. Med. 2013, 51, 683–692. [Google Scholar] [CrossRef] [PubMed]
- Eussen, S.J.; Ueland, P.M.; Clarke, R.; Blom, H.J.; Hoefnagels, W.H.; van Staveren, W.A.; de Groot, L.C. The association of betaine, homocysteine and related metabolites with cognitive function in Dutch elderly people. Br. J. Nutr. 2007, 98, 960–968. [Google Scholar] [CrossRef]
- Holm, P.I.; Hustad, S.; Ueland, P.M.; Vollset, S.E.; Grotmol, T.; Schneede, J. Modulation of the homocysteine-betaine relationship by methylenetetrahydrofolate reductase 677 C->t genotypes and B-vitamin status in a large-scale epidemiological study. J. Clin. Endocrinol. Metab. 2007, 92, 1535–1541. [Google Scholar] [CrossRef] [PubMed]
- Lever, M.; George, P.M.; Dellow, W.J.; Scott, R.S.; Chambers, S.T. Homocysteine, glycine betaine, and N,N-dimethylglycine in patients attending a lipid clinic. Metabolism 2005, 54, 1–14. [Google Scholar] [CrossRef] [PubMed]
- Velzing-Aarts, F.V.; Holm, P.I.; Fokkema, M.R.; van der Dijs, F.P.; Ueland, P.M.; Muskiet, F.A. Plasma choline and betaine and their relation to plasma homocysteine in normal pregnancy. Am. J. Clin. Nutr. 2005, 81, 1383–1389. [Google Scholar] [CrossRef] [PubMed]
- Schwahn, B.C.; Chen, Z.; Laryea, M.D.; Wendel, U.; Lussier-Cacan, S.; Genest, J., Jr.; Mar, M.H.; Zeisel, S.H.; Castro, C.; Garrow, T.; et al. Homocysteine-betaine interactions in a murine model of 5,10-methylenetetrahydrofolate reductase deficiency. FASEB J. 2003, 17, 512–514. [Google Scholar] [CrossRef]
- Holm, P.I.; Bleie, O.; Ueland, P.M.; Lien, E.A.; Refsum, H.; Nordrehaug, J.E.; Nygard, O. Betaine as a determinant of postmethionine load total plasma homocysteine before and after B-vitamin supplementation. Arter. Thromb. Vasc. Biol. 2004, 24, 301–307. [Google Scholar] [CrossRef]
- McGregor, D.O.; Dellow, W.J.; Lever, M.; George, P.M.; Robson, R.A.; Chambers, S.T. Dimethylglycine accumulates in uremia and predicts elevated plasma homocysteine concentrations. Kidney Int. 2001, 59, 2267–2272. [Google Scholar] [CrossRef]
- Fernandez-Roig, S.; Cavalle-Busquets, P.; Fernandez-Ballart, J.D.; Ballesteros, M.; Berrocal-Zaragoza, M.I.; Salat-Batlle, J.; Ueland, P.M.; Murphy, M.M. Low folate status enhances pregnancy changes in plasma betaine and dimethylglycine concentrations and the association between betaine and homocysteine. Am. J. Clin. Nutr. 2013, 97, 1252–1259. [Google Scholar] [CrossRef]
- Christensen, K.E.; Wu, Q.; Wang, X.; Deng, L.; Caudill, M.A.; Rozen, R. Steatosis in mice is associated with gender, folate intake, and expression of genes of one-carbon metabolism. J. Nutr. 2010, 140, 1736–1741. [Google Scholar] [CrossRef]
- Finkelstein, J.D.; Martin, J.J. Methionine metabolism in mammals. Distribution of homocysteine between competing pathways. J. Biol. Chem. 1984, 259, 9508–9513. [Google Scholar] [CrossRef]
- Refsum, H.; Grindflek, A.W.; Ueland, P.M.; Fredriksen, A.; Meyer, K.; Ulvik, A.; Guttormsen, A.B.; Iversen, O.E.; Schneede, J.; Kase, B.F. Screening for serum total homocysteine in newborn children. Clin. Chem. 2004, 50, 1769–1784. [Google Scholar] [CrossRef]
- DeRatt, B.N.; Ralat, M.A.; Lysne, V.; Tayyari, F.; Dhar, I.; Edison, A.S.; Garrett, T.J.; Midttun, O.; Ueland, P.M.; Nygard, O.K.; et al. Metabolomic Evaluation of the Consequences of Plasma Cystathionine Elevation in Adults with Stable Angina Pectoris. J. Nutr. 2017, 147, 1658–1668. [Google Scholar] [CrossRef] [PubMed]
- MacCoss, M.J.; Fukagawa, N.K.; Matthews, D.E. Measurement of intracellular sulfur amino acid metabolism in humans. Am. J. Physiol. Endocrinol. Metab. 2001, 280, E947–E955. [Google Scholar] [CrossRef]
- Ciccimaro, E.; Blair, I.A. Stable-isotope dilution LC-MS for quantitative biomarker analysis. Bioanalysis 2010, 2, 311–341. [Google Scholar] [CrossRef] [PubMed]
- Refsum, H.; Smith, A.D.; Ueland, P.M.; Nexo, E.; Clarke, R.; McPartlin, J.; Johnston, C.; Engbaek, F.; Schneede, J.; McPartlin, C.; et al. Facts and recommendations about total homocysteine determinations: An expert opinion. Clin. Chem. 2004, 50, 3–32. [Google Scholar] [CrossRef] [PubMed]
- Bailey, L.B.; Stover, P.J.; McNulty, H.; Fenech, M.F.; Gregory, J.F., 3rd; Mills, J.L.; Pfeiffer, C.M.; Fazili, Z.; Zhang, M.; Ueland, P.M.; et al. Biomarkers of Nutrition for Development-Folate Review. J. Nutr. 2015, 145, 1636S–1680S. [Google Scholar] [CrossRef]
- Dominguez-Salas, P.; Moore, S.E.; Cole, D.; da Costa, K.A.; Cox, S.E.; Dyer, R.A.; Fulford, A.J.; Innis, S.M.; Waterland, R.A.; Zeisel, S.H.; et al. DNA methylation potential: Dietary intake and blood concentrations of one-carbon metabolites and cofactors in rural African women. Am. J. Clin. Nutr. 2013, 97, 1217–1227. [Google Scholar] [CrossRef]
- Lind, M.V.; Lauritzen, L.; Pedersen, O.; Vestergaard, H.; Stark, K.D.; Hansen, T.; Ross, A.B.; Kristensen, M. Higher intake of fish and fat is associated with lower plasma s-adenosylhomocysteine: A cross-sectional study. Nutr. Res. 2017, 46, 78–87. [Google Scholar] [CrossRef]
- Lind, M.V.; Lauritzen, L.; Vestergaard, H.; Hansen, T.; Pedersen, O.; Kristensen, M.; Ross, A.B. One-carbon metabolism markers are associated with cardiometabolic risk factors. Nutr. Metab. Cardiovasc. Dis. 2018, 28, 402–410. [Google Scholar] [CrossRef]
- van Driel, L.M.; Eijkemans, M.J.; de Jonge, R.; de Vries, J.H.; van Meurs, J.B.; Steegers, E.A.; Steegers-Theunissen, R.P. Body mass index is an important determinant of methylation biomarkers in women of reproductive ages. J. Nutr. 2009, 139, 2315–2321. [Google Scholar] [CrossRef]
- Pfeiffer, C.M.; Sternberg, M.R.; Fazili, Z.; Yetley, E.A.; Lacher, D.A.; Bailey, R.L.; Johnson, C.L. Unmetabolized folic acid is detected in nearly all serum samples from US children, adolescents, and adults. J. Nutr. 2015, 145, 520–531. [Google Scholar] [CrossRef]
- Hustad, S.; Eussen, S.; Midttun, O.; Ulvik, A.; van de Kant, P.M.; Morkrid, L.; Gislefoss, R.; Ueland, P.M. Kinetic modeling of storage effects on biomarkers related to B vitamin status and one-carbon metabolism. Clin. Chem. 2012, 58, 402–410. [Google Scholar] [CrossRef]
- Stabler, S.P.; Allen, R.H. Quantification of serum and urinary S-adenosylmethionine and S-adenosylhomocysteine by stable-isotope-dilution liquid chromatography-mass spectrometry. Clin. Chem. 2004, 50, 365–372. [Google Scholar] [CrossRef]
- Zheng, X.H.; Jiang, L.Y.; Zhao, L.T.; Zhang, Q.Y.; Ding, L. Simultaneous quantitation of folic acid and 5-methyltetrahydrofolic acid in human plasma by HPLC-MS/MS and its application to a pharmacokinetic study. J. Pharm. Anal. 2015, 5, 269–275. [Google Scholar] [CrossRef] [PubMed]
- U.S. Department of Health and Human Services; CDER; CVM. Bioanalytical Method Validation Guidance for Industry. Available online: https://www.fda.gov/files/drugs/published/Bioanalytical-Method-Validation-Guidance-for-Industry.pdf (accessed on 15 March 2023).
- Wang, D.H.; Kogashiwa, M.; Ohta, S.; Kira, S. Validity and reliability of a dietary assessment method: The application of a digital camera with a mobile phone card attachment. J. Nutr. Sci. Vitaminol. 2002, 48, 498–504. [Google Scholar] [CrossRef] [PubMed]
- Gibson, R.; Eriksen, R.; Lamb, K.; McMeel, Y.; Vergnaud, A.C.; Spear, J.; Aresu, M.; Chan, Q.; Elliott, P.; Frost, G. Dietary assessment of British police force employees: A description of diet record coding procedures and cross-sectional evaluation of dietary energy intake reporting (The Airwave Health Monitoring Study). BMJ Open 2017, 7, e012927. [Google Scholar] [CrossRef]
- Ortega, R.M.; Perez-Rodrigo, C.; Lopez-Sobaler, A.M. Dietary assessment methods: Dietary records. Nutr. Hosp. 2015, 31 (Suppl. S3), 38–45. [Google Scholar] [CrossRef]
- Date, C.; Tokudome, Y.; Yoshiike, N. The Manual for Dietary Survey, 3rd ed.; Nanzando Co., Ltd.: Tokyo, Japen, 2016. [Google Scholar]
- Council for Science and Technology; Ministry of Education, Culture, Sports, Science and Technology, Japan. Standard Tables of Food Composition in Japan 2015, 7th ed.; Official Gazette Co-Operation of Japan: Tokyo, Japan, 2015. (In Japanese)
- Shimamoto, K.; Ando, K.; Fujita, T.; Hasebe, N.; Higaki, J.; Horiuchi, M.; Imai, Y.; Imaizumi, T.; Ishimitsu, T.; Ito, M.; et al. The Japanese Society of Hypertension Guidelines for the Management of Hypertension (JSH 2014). Hypertens. Res. 2014, 37, 253–390. [Google Scholar] [CrossRef] [PubMed]
- Inoue-Choi, M.; Nelson, H.H.; Robien, K.; Arning, E.; Bottiglieri, T.; Koh, W.P.; Yuan, J.M. One-carbon metabolism nutrient status and plasma S-adenosylmethionine concentrations in middle-aged and older Chinese in Singapore. Int. J. Mol. Epidemiol. Genet. 2012, 3, 160–173. [Google Scholar]


| Variables | Overall Population (n = 227) | Low 5-MTHF Group (n = 113) | High 5-MTHF Group (n = 114) | |||||||
|---|---|---|---|---|---|---|---|---|---|---|
| Median | 25th | 75th | Median | 25th | 75th | Median | 25th | 75th | p-Value a | |
| Age (years) | 20 | 19 | 21 | 20 | 19 | 21 | 20 | 19 | 21 | 0.873 |
| Height (cm) | 158 | 155 | 162 | 159 | 155 | 162 | 158 | 155 | 163 | 0.858 |
| Body weight (kg) | 51.2 | 47.4 | 55.3 | 50.8 | 47.0 | 55.3 | 51.6 | 47.5 | 55.4 | 0.887 |
| BMI (kg/m2) | 20.2 | 19.1 | 21.6 | 20.1 | 19.1 | 21.8 | 20.3 | 19.0 | 21.4 | 0.855 |
| Body fat percentage (%) | 24.9 | 22.5 | 28.4 | 24.9 | 23.0 | 28.4 | 24.9 | 22.2 | 28.3 | 0.480 |
| Mean systolic blood pressure (mmHg) | 106.5 | 100.0 | 114.5 | 106.5 | 100.5 | 113.3 | 106.8 | 99.0 | 116.1 | 0.985 |
| Mean diastolic blood pressure (mmHg) | 68.0 | 64.0 | 74.0 | 68.5 | 65.0 | 73.5 | 67.8 | 62.5 | 75.1 | 0.474 |
| Overall Population (n = 227) | Low 5-MTHF Group (n = 113) | High 5-MTHF Group (n = 114) | ||||||||
|---|---|---|---|---|---|---|---|---|---|---|
| Median | 25th | 75th | Median | 25th | 75th | Median | 25th | 75th | p-Value a | |
| Energy (kcal)a | 1731 | 1460 | 1964 | 1672 | 1408 | 1896 | 1797 | 1496 | 2082 | 0.110 |
| Protein (% energy) | 14.2 | 13.1 | 15.5 | 14.0 | 12.9 | 15.3 | 14.3 | 13.3 | 15.8 | 0.222 |
| Fat (% energy) | 31.9 | 28.5 | 35.1 | 31.6 | 28.3 | 35.4 | 32.0 | 29.2 | 34.2 | 0.799 |
| Carbohydrate (% energy) | 52.4 | 49.0 | 55.5 | 51.9 | 48.8 | 55.5 | 52.4 | 49.3 | 55.3 | 0.942 |
| Methionine (mg/1000 kcal) | 740 | 657 | 832 | 730 | 631 | 823 | 745 | 663 | 840 | 0.566 |
| Cystine (mg/1000 kcal) | 489 | 452 | 527 | 492 | 453 | 522 | 489 | 446 | 535 | 0.841 |
| Total sulfur-containing amino acids (mg/1000 kcal) | 1229 | 1113 | 1351 | 1223 | 1096 | 1348 | 1233 | 1113 | 1355 | 0.582 |
| Glycine (mg/1000 kcal) | 1448 | 1286 | 1625 | 1452 | 1297 | 1623 | 1442 | 1276 | 1628 | 0.998 |
| Serine (mg/1000 kcal) | 1547 | 1405 | 1665 | 1546 | 1394 | 1646 | 1551 | 1413 | 1696 | 0.327 |
| Saturated fatty acids (% energy) | 10.0 | 8.6 | 11.2 | 9.8 | 8.4 | 11.5 | 10.1 | 8.7 | 11.1 | 0.997 |
| Polyunsaturated fatty acids (g/1000 kcal) | 6.53 | 5.76 | 7.27 | 6.48 | 5.56 | 7.22 | 6.65 | 5.86 | 7.42 | 0.109 |
| n-3 polyunsaturated fatty acids (g/1000 kcal) | 1.02 | 0.85 | 1.23 | 0.99 | 0.83 | 1.22 | 1.03 | 0.85 | 1.23 | 0.297 |
| n-6 polyunsaturated fatty acids (g/1000 kcal) | 5.44 | 4.80 | 6.11 | 5.43 | 4.64 | 6.04 | 5.47 | 4.96 | 6.18 | 0.099 |
| Total fiber (g/1000 kcal) | 7.09 | 6.16 | 8.34 | 6.68 | 5.81 | 7.76 | 7.67 | 6.79 | 8.81 | <0.001 |
| Sodium (mg/1000 kcal) | 1911 | 1681 | 2220 | 2006 | 1692 | 2353 | 1855 | 1662 | 2123 | 0.025 |
| Potassium (mg/1000 kcal) | 1092 | 973 | 1228 | 1051 | 943 | 1139 | 1176 | 1025 | 1287 | <0.001 |
| Calcium (mg/1000 kcal) | 258 | 223 | 311 | 252 | 206 | 296 | 266 | 230 | 321 | 0.006 |
| Magnesium (mg/1000 kcal) | 118 | 105 | 135 | 113 | 99 | 126 | 126 | 111 | 138 | <0.001 |
| Iron (mg/1000 kcal) | 3.76 | 3.32 | 4.16 | 3.55 | 3.19 | 4.05 | 3.84 | 3.46 | 4.27 | 0.001 |
| Zinc (mg/1000 kcal) | 4.12 | 3.77 | 4.51 | 4.11 | 3.80 | 4.57 | 4.15 | 3.73 | 4.51 | 0.907 |
| Vitamin A (μg retinol activity equivalent/1000 kcal) | 243 | 196 | 295 | 235 | 189 | 278 | 258 | 205 | 326 | 0.011 |
| Vitamin D (µg/1000 kcal) | 2.28 | 1.37 | 3.32 | 2.12 | 1.46 | 3.35 | 2.34 | 1.33 | 3.34 | 0.589 |
| Thiamin (mg/1000 kcal) | 0.498 | 0.433 | 0.612 | 0.476 | 0.419 | 0.597 | 0.518 | 0.448 | 0.663 | 0.010 |
| Riboflavin (mg/1000 kcal) | 0.596 | 0.538 | 0.684 | 0.573 | 0.525 | 0.674 | 0.613 | 0.550 | 0.698 | 0.094 |
| Vitamin B6 (mg/1000 kcal) | 0.568 | 0.494 | 0.667 | 0.537 | 0.460 | 0.626 | 0.631 | 0.535 | 0.706 | <0.001 |
| Vitamin B12 (μg/1000 kcal) | 2.49 | 1.62 | 3.76 | 2.42 | 1.63 | 3.78 | 2.56 | 1.54 | 3.71 | 0.716 |
| Folate (μg dietary folate equivalents/1000 kcal) | 144 | 123 | 170 | 136 | 113 | 160 | 162 | 135 | 187 | <0.001 |
| Vitamin C (mg/1000 kcal) | 41.9 | 32.4 | 54.2 | 37.1 | 28.2 | 48.3 | 44.2 | 35.5 | 59.7 | <0.001 |
| Overall Population (n = 227) | Low 5-MTHF Group (n = 113) | High 5-MTHF Group (n = 114) | |||||||||
|---|---|---|---|---|---|---|---|---|---|---|---|
| Analytes (unit) | Median | 25th | 75th | Median | 25th | 75th | Median | 25th | 75th | p-Value b | |
| Folate cycle | 5-MTHF (nmol/L) | 19.2 | 14.4 | 24.2 | 14.4 | 11.8 | 16.7 | 24.1 | 21.4 | 29.6 | - |
| FA (nmol/L) | 1.08 | 0.62 | 1.91 | 0.99 | 0.59 | 1.95 | 1.18 | 0.74 | 1.89 | 0.503 | |
| Choline metabolic pathway | Choline (µmol/L) | 7.56 | 6.55 | 8.43 | 7.44 | 6.41 | 8.30 | 7.58 | 6.69 | 8.61 | 0.299 |
| Betaine (µmol/L) | 38.7 | 32.9 | 45.5 | 37.7 | 32.0 | 42.5 | 40.9 | 34.5 | 47.5 | 0.004 | |
| DMG (µmol/L) | 2.97 | 2.50 | 3.60 | 3.01 | 2.52 | 3.78 | 2.91 | 2.40 | 3.48 | 0.207 | |
| Betaine/DMG | 13.2 | 10.5 | 15.4 | 12.4 | 10.0 | 14.4 | 13.9 | 11.5 | 16.9 | <0.001 | |
| Methionine cycle | Methionine (µmol/L) | 24.2 | 22.0 | 26.9 | 24.5 | 22.0 | 28.0 | 24.0 | 22.0 | 26.6 | 0.302 |
| SAM (nmol/L) | 55.6 | 50.7 | 60.6 | 54.5 | 48.8 | 60.2 | 56.9 | 51.6 | 61.3 | 0.059 | |
| SAH (nmol/L) | 14.5 | 12.1 | 17.1 | 14.8 | 11.5 | 17.4 | 14.4 | 12.4 | 17.1 | 0.928 | |
| SAM/SAH | 3.92 | 3.15 | 4.96 | 3.88 | 3.11 | 4.95 | 3.97 | 3.22 | 5.04 | 0.732 | |
| tHcy (µmol/L) | 6.39 | 5.53 | 7.41 | 6.92 | 5.89 | 7.96 | 6.07 | 5.21 | 6.75 | <0.001 | |
| Homocysteic acid (µmol/L) | 0 a | 0 a | 0 a | 0 a | 0 a | 0 a | 0 a | 0 a | 0 a | - | |
| Transsulfuration pathway | Cystathionine (nmol/L) | 90.0 | 73.5 | 111.0 | 96.4 | 80.7 | 116.5 | 84.0 | 68.9 | 100.6 | <0.001 |
| tCys (µmol/L) | 199 | 185 | 211 | 194 | 181 | 208 | 203 | 191 | 213 | 0.009 | |
| tHcy/tCys | 0.0322 | 0.0287 | 0.0370 | 0.0354 | 0.0308 | 0.0400 | 0.0302 | 0.0265 | 0.0328 | <0.001 | |
| Taurine (µmol/L) | 112 | 97 | 129 | 111 | 99 | 131 | 113 | 96 | 127 | 0.633 | |
| Amino acids | Serine (µmol/L) | 146 | 130 | 167 | 144 | 129 | 164 | 151 | 130 | 168 | 0.421 |
| Glycine (µmol/L) | 202 | 180 | 225 | 205 | 179 | 229 | 198 | 180 | 221 | 0.402 | |
| Vitamins | Riboflavin (nmol/L) | 11.8 | 7.9 | 17.5 | 11.0 | 8.0 | 17.0 | 12.5 | 7.8 | 17.6 | 0.415 |
| Pyridoxamine (nmol/L) | 0 a | 0 a | 0 a | 0 a | 0 a | 0 a | 0 a | 0 a | 0 a | - | |
| Pyridoxine (nmol/L) | 0 a | 0 a | 0 a | 0 a | 0 a | 0 a | 0 a | 0 a | 0 a | - | |
| Enzyme Activity Indices | 5-MTHF | FA | Choline | Betaine | DMG | Methionine | SAM | SAH | tHcy | Cystathionine | tCys | Taurine | Serine | Glycine | Riboflavin | |
|---|---|---|---|---|---|---|---|---|---|---|---|---|---|---|---|---|
| Overall population (n = 227) | Betaine/DMG | 0.284 ** | 0.073 | 0.062 | 0.503 ** | −0.642 ** | 0.020 | −0.028 | −0.084 | −0.385 ** | −0.158 * | −0.110 | −0.034 | −0.032 | −0.001 | 0.127 |
| SAM/SAH | 0.059 | 0.132 * | −0.299 ** | −0.053 | −0.095 | −0.177 ** | 0.313 ** | −0.895 ** | −0.149 * | −0.090 | −0.154 * | −0.289 ** | −0.237 ** | −0.174 ** | −0.063 | |
| tHcy/tCys | −0.602 ** | −0.007 | 0.025 | −0.324 ** | 0.120 | 0.022 | −0.090 | 0.086 | 0.877 ** | 0.189 ** | 0.034 | 0.128 | 0.086 | 0.090 | −0.071 | |
| Low 5-MTHF group (n = 113) | Betaine/DMG | 0.173 | 0.072 | 0.076 | 0.498 ** | −0.654 ** | −0.032 | −0.001 | −0.212 * | −0.374 ** | −0.164 | −0.052 | −0.057 | −0.066 | −0.087 | 0.103 |
| SAM/SAH | 0.091 | 0.269 ** | −0.388 ** | 0.107 | −0.081 | −0.174 | 0.248 ** | −0.883 ** | −0.147 | −0.003 | −0.095 | −0.389 ** | −0.261 ** | −0.309 ** | −0.149 | |
| tHcy/tCys | −0.450 ** | −0.057 | −0.022 | −0.444 ** | 0.045 | −0.030 | −0.064 | 0.119 | 0.894 ** | 0.037 | 0.136 | 0.126 | 0.083 | 0.086 | −0.010 | |
| High 5-MTHF group (n = 114) | Betaine/DMG | 0.150 | 0.053 | 0.037 | 0.461 ** | −0.641 ** | 0.105 | −0.108 | 0.027 | −0.290 ** | −0.027 | −0.239 * | −0.010 | −0.026 | 0.112 | 0.093 |
| SAM/SAH | 0.065 | −0.019 | −0.197 * | −0.213 * | −0.110 | −0.174 | 0.398 ** | −0.900 ** | −0.159 | −0.189 * | −0.219 * | −0.188 * | −0.195 * | −0.042 | 0.001 | |
| tHcy/tCys | −0.439 ** | 0.059 | 0.137 | −0.087 | 0.146 | −0.014 | −0.022 | 0.074 | 0.854 ** | 0.123 | 0.144 | 0.131 | 0.184 | 0.067 | −0.093 |
Disclaimer/Publisher’s Note: The statements, opinions and data contained in all publications are solely those of the individual author(s) and contributor(s) and not of MDPI and/or the editor(s). MDPI and/or the editor(s) disclaim responsibility for any injury to people or property resulting from any ideas, methods, instructions or products referred to in the content. |
© 2023 by the authors. Licensee MDPI, Basel, Switzerland. This article is an open access article distributed under the terms and conditions of the Creative Commons Attribution (CC BY) license (https://creativecommons.org/licenses/by/4.0/).
Share and Cite
Kubo, Y.; Shoji, K.; Tajima, A.; Horiguchi, S.; Fukuoka, H.; Nishikawa, M.; Kagawa, Y.; Kawabata, T. Serum 5-Methyltetrahydrofolate Status Is Associated with One-Carbon Metabolism-Related Metabolite Concentrations and Enzyme Activity Indicators in Young Women. Int. J. Mol. Sci. 2023, 24, 10993. https://doi.org/10.3390/ijms241310993
Kubo Y, Shoji K, Tajima A, Horiguchi S, Fukuoka H, Nishikawa M, Kagawa Y, Kawabata T. Serum 5-Methyltetrahydrofolate Status Is Associated with One-Carbon Metabolism-Related Metabolite Concentrations and Enzyme Activity Indicators in Young Women. International Journal of Molecular Sciences. 2023; 24(13):10993. https://doi.org/10.3390/ijms241310993
Chicago/Turabian StyleKubo, Yoshinori, Kumiko Shoji, Akiko Tajima, Sayaka Horiguchi, Hideoki Fukuoka, Masazumi Nishikawa, Yasuo Kagawa, and Terue Kawabata. 2023. "Serum 5-Methyltetrahydrofolate Status Is Associated with One-Carbon Metabolism-Related Metabolite Concentrations and Enzyme Activity Indicators in Young Women" International Journal of Molecular Sciences 24, no. 13: 10993. https://doi.org/10.3390/ijms241310993
APA StyleKubo, Y., Shoji, K., Tajima, A., Horiguchi, S., Fukuoka, H., Nishikawa, M., Kagawa, Y., & Kawabata, T. (2023). Serum 5-Methyltetrahydrofolate Status Is Associated with One-Carbon Metabolism-Related Metabolite Concentrations and Enzyme Activity Indicators in Young Women. International Journal of Molecular Sciences, 24(13), 10993. https://doi.org/10.3390/ijms241310993