Abstract
Escherichia coli K1 is a leading cause of neonatal meningitis. The asymptomatic carriage of these strains in the maternal intestinal microbiota constitutes a risk of vertical transmission to the infant at birth. The aim of this work was to evaluate the efficacy of phage therapy against E. coli K1 in an intestinal environment and its impact on the intestinal microbiota. For this purpose, three independent experiments were conducted on the SHIME® system, the first one with only the phage vB_EcoP_K1_ULINTec4, the second experiment with only E. coli K1 and the last experiment with both E. coli K1 and the phage. Microbiota monitoring was performed using metagenetics, qPCR, SCFA analysis and the induction of AhR. The results showed that phage vB_EcoP_K1_ULINTec4, inoculated alone, was progressively cleared by the system and replicates in the presence of its host. E. coli K1 persisted in the microbiota but decreased in the presence of the phage. The impact on the microbiota was revealed to be donor dependent, and the bacterial populations were not dramatically affected by vB_K1_ULINTec4, either alone or with its host. In conclusion, these experiments showed that the phage was able to infect the E. coli K1 in the system but did not completely eliminate the bacterial load.
1. Introduction
Escherichia coli is, with Group B streptococci (GBS), a leading cause of neonatal sepsis and meningitis worldwide. These infections can occur before or after 72 h of life, which differentiates between early-onset and late-onset. In pre-term newborns, E. coli is the most commonly isolated bacteria in neonatal meningitis cases [1,2,3]. The associated risks factors include low or very low birth weight, degree of prematurity, ruptured membranes and maternal peripartum infection [3,4,5]. Despite the use of effective antibiotics, neonatal meningitis has a mortality of 10% in developed countries and 40–50% in developing countries. Among the survivors, 50% develop devastating neurological sequelae and permanent disabilities [5,6,7]. The K1 capsular type is predominant in E. coli strains causing meningitis. This important virulence factor allows the bacteria to survive and multiply in and outside the gastrointestinal tract. In addition to being a major cause of meningitis and sepsis in newborns, E. coli K1 can cause urinary tract infections in humans and is also involved in several animal diseases, including avian colibacillosis [8,9]. Beta-lactam antibiotics are usually used in the empirical treatment of E. coli neonatal meningitis (ECNM), in combination with gentamicin [10]. However, antibiotic resistance due to the emergence of strains producing extended-spectrum beta-lactamase is becoming a concern, indicating the need to develop alternative treatments [10,11,12]. The pathogenesis of E. coli K1 associated meningitis is not fully understood. The early steps can include a gastro-intestinal colonization, followed by a bacterial translocation from the small intestine and the colon into the systemic circulation. The bacteriemia can lead to sepsis and/or meningitis by crossing the blood–brain barrier (BBB) [13,14]. Various factors are involved in the pathogenesis. The expression of a K1 capsule allows the passage and the intracellular survival of E. coli in human brain microvascular endothelial cells’ (HBMEC) vacuoles by modulating their maturation and by preventing fusion with lyzosomes [15,16]. In neonatal meningitis, this capsular type was linked to several specific serotypes: O18:K1:H7, O1:K1, O7:K1, O16:K1, O83:K1 and O45:K1:H7 [7,17]. Virulence factors OmpA and type 1 fimbriae have been associated with the attachment to the BBB, and ibeA and CNF1 with the bacterial invasion [15]. Several studies have focused on vaccinal prevention of ECNM [18,19]. It might be tempting to develop a vaccine targeting the K1 capsule but its structure, composed of α2,8-linked polysialic acid, is very similar to that of the human neural cell adhesion molecule, making its application problematic [20].
A perinatal vertical transmission from mother to infant is highly suspected to be an important first step in the onset of ECNM. Indeed, the presence of this bacteria in the neonate cerebrospinal fluid and the feces of both mother and infant is an indication that the maternal microbiota is a reservoir of ECNM strains. Extraintestinal E. coli, including E. coli K1, are frequently found as commensal bacteria in the gut microbiota of pregnant women and other healthy individuals. However, their ability to colonize other environments, like the vagina of pregnant women, and subsequently the gastrointestinal tract of newborns, are early steps for the development of ECNM. A rat model was able to reproduce some of the key features related to pathogenesis [13,14,21,22,23,24,25]. After the colonization of the gastrointestinal tract of newborn pups with E. coli K1, the colonizing bacteria could translocate from the lumen of the gastrointestinal tract to the bloodstream and reach the central nervous system [26]. This model has also been used to assess potential treatments and prevention solutions [27,28]. The SHIME® (Simulator of Human Intestinal Microbial Ecosystem) (Prodigest, Ghent, Belgium) is a complex and dynamic in vitro gastro-intestinal model useful for long-term experiments. It allows the study of the behavior and interactions of bacteria, phages and gut microbiota within the digestive system. The SHIME® model has shown promising results in several studies, highlighting its potential as a valuable tool in phage research [29,30,31,32].
Phage therapy is a promising alternative to antibiotics and has already been evaluated to treat ECNM through systemic delivery [33,34,35]. The efficacy of vB_EcoP_K1_ULINTec4 (K1_ULINTec4), a K1-dependent phage targeting E. coli K1, showed an improvement in its survival on E. coli-infected Galleria mellonella larvae [33]. In this study, we investigated the potential of phage therapy and the impact of this treatment on bacterial populations and productions in the prevention of neonatal meningitis by specifically targeting E. coli K1 in the gut microbiota of pregnant women, using the SHIME® model. Three different experimental conditions were designed for assessment: the persistence and the effects of the phage alone, the effect of E. coli K1 alone and the dynamics and effects of the phage treatment in the presence of E. coli K1 on the intestinal microbiota.
2. Results
2.1. Determination of the Optimal Phage Concentration in the Galleria mellonella Model
The preliminary experiment allowed the determination of the optimal dose of the inoculation of E. coli K1 (C5) in the model, enabling a lethality between 90 and 100%. This concentration, 106 CFU/10 µL, was used for the main experiment.
The survival curves of the main experiment showed that infected phage-treated larvae had significantly higher survival rates than infected, untreated larvae. No significant differences were identified between the different treatment multiplicities of infection (MOIs). Treated larvae had significantly lower survival rates than uninfected controls (PBS + PBS and PBS + K1_ULINTec4 MOI 100). The survival curves are presented in Figure 1. Based on these results, an MOI of 1 was chosen for the experiments conducted in the SHIME model.
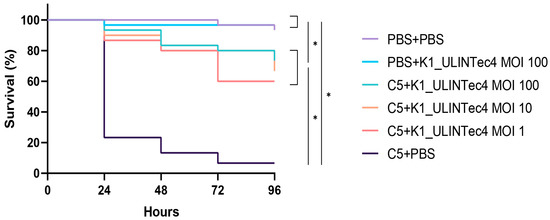
Figure 1.
Survival curves of the main experiment assessing different MOIs of the phage K1_ULINTec4 in the G. mellonella model. C5: E. coli K1 strain C5, PBS: phosphate-buffered saline. Statistical significance is indicated as p < 0.05 (*).
2.2. Triple-SHIME Experiments
The results related to the concentration of K1_ULINTec4 and E. coli K1 that were added to the SHIME systems of the three different donors were analyzed together. However, due to the large inter-individual variability between the microbiota of the donors, results related to intestinal microbiota (metagenetics, qPCR, SCFA and AhR) were analyzed separately, except for alpha diversity results.
2.2.1. Persistence and Evolution of the Concentration of K1_ULINTec4
The elimination of active K1_ULINTec4 from system 1 (inoculated with phage alone) was close to the theoretical calculated elimination of inert molecules. This reflects a good stability of the phage in the system, for several days at 37 °C and despite pH variations between the proximal and distal colons. However, prolonged phage persistence above the limit of quantification was detected for donor 2 at the end of the run (Figure S1). In system 3 (inoculated with both bacteria and phage), the phage concentration followed the same trend at the beginning of the run, and then reached a stabilization at around 104 PFU/mL. At day 46, this difference in phage persistence between systems 1 and 3 was significant in both proximal and distal colons (p = 0.02). The curves representing the evolution of the theoretical phage concentrations and those measured in systems 1 and 3 are presented in Figure 2.

Figure 2.
Graphical representation of the theoretical K1_ULINTec4 concentrations and those measured in systems 1 (phage alone) and 3 (bacteria + phage) for the proximal and distal colons. The replicates represent the mean results of the three separate donors with SD. The dotted line represents the limit of quantification. Statistical significance is indicated as p < 0.05 (*).
2.2.2. Evolution of E. coli K1 Concentrations
The presence of E. coli K1 was detectable in systems 2 and 3 from day 21, which corresponds to the first quantifiable sample after the inoculation of C5 performed in both systems. Then, the bacteria could be quantified each day until the end of the run in both systems. An increase in concentration was visible on day 28 in the distal colon of system 2 (p = 0.01) (Figure 3a). On day 35, a significant decrease in concentration was detected in the proximal colon of system 3. A trend of decreasing was also visible in the distal colon, although it was not statistically significant (p = 0.0506) (Figure 3b). The comparison of the relative quantification of systems 2 and 3 revealed no significant differences (Supplementary Materials Figure S2). Individual values of relative quantification are presented in the Supplementary Materials, Figures S3 and S4.
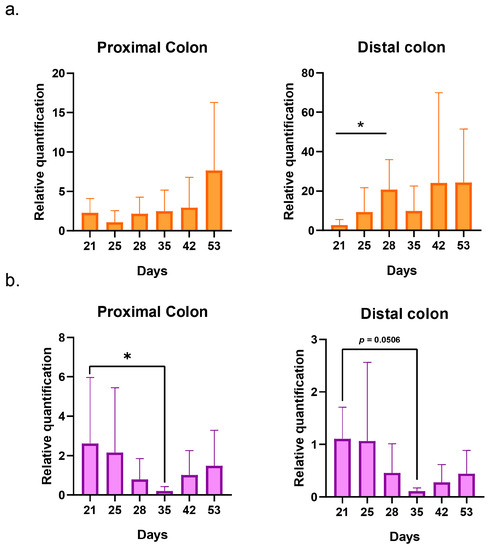
Figure 3.
Graphical representation of the evolution of E. coli K1 relative quantifications in systems 2 (bacteria alone) (a) and 3 (bacteria + phage) (b) for the proximal and distal colons. The replicates represent the mean results of the three separate donors with SD. Statistical significance is indicated as p < 0.05 (*).
2.2.3. Impact on Pregnant Donors’ Microbiota
The analysis of alpha diversity showed no significant differences in the evolution of bacterial diversity over time in both proximal and distal colons of the three systems (Supplementary Materials Table S1). The Shannon diversity indexes varied between 1.18 ± 0.31 and 1.85 ± 0.2 in proximal colons and 1.92 ± 0.55 and 2.53 ± 0.39 in distal colons. The Simpson indexes varied between 0.53 ± 0.14 and 0.79 ± 0.02 in proximal colons and 0.68 ± 0.17 and 0.87 ± 0.03 in distal colons The Piélou equitability indexes varied between 0.44 ± 0.08 and 0.62 ± 0.02 in proximal colons and 0.52 ± 0.14 and 0.67 ± 0.05 in distal colons.
- Donor 1
The metagenetic analysis of the fecal inoculum at day 0 showed a predominance of Bacillota and Bacteroidota at the phylum level. The main genera and species represented in terms of relative abundance were Bacteroides vulgatus, Faecalibacterium prausnitzii, genera of the Lachnospiraceae family, Agathobacter sp., Subdoligranulum sp., Faecalibacterium sp., Bacteroides uniformis, genera of the Oscillospirales order, Bacteroides sp. and Alistipes putredinis (Figure 4).
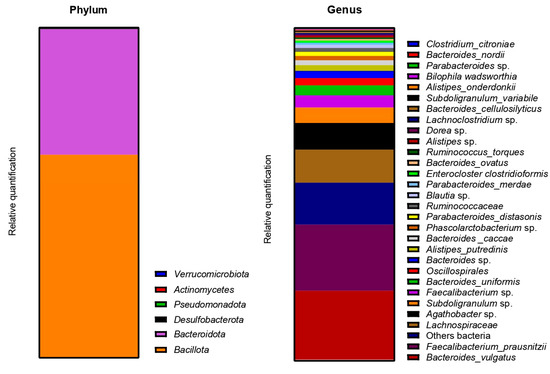
Figure 4.
Relative abundance in bacterial composition (16S rDNA) at the phylum (left) and genus/species (right) levels in the fecal inoculum of donor 1.
The Beta-diversity of all samples are represented in Figure 5 using non-metric multidimensional scaling. The HOMOVA statistical test showed no significant differences between groups, either between systems or between days of experiment. A drift of diversity (not significant) was visible over the days in the distal colon, but not in the proximal colon.
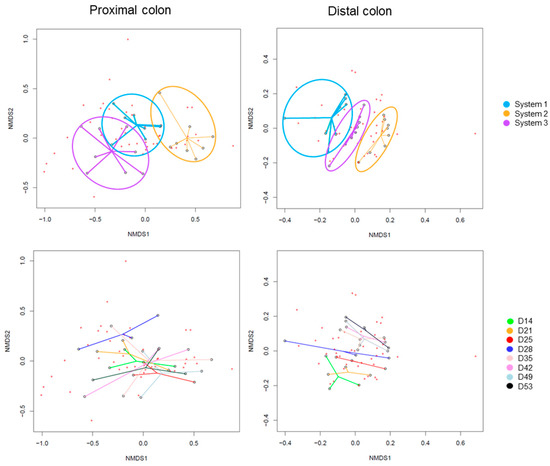
Figure 5.
Non-Metric Multidimensional Scaling (NMDS) of Beta-diversity by systems (up) or by days of experiment (down) in proximal and distal colons of donor 1. D: day.
The evolutions of relative abundances of phyla and genera after 14 days of stabilization are presented in Figure 6. The two main phyla were still represented by Bacillota and Bacteroidota, followed by Pseudomonadota. The main genera and species were Enterocloster clostridioformis, Bacteroides vulgatus, Bacteroides ovatus, Phascolarctobacterium sp. and Bacteroides caccae. E. coli was also graphically visible, mainly in the proximal colons of systems 2 and 3 (PC2 and PC3).
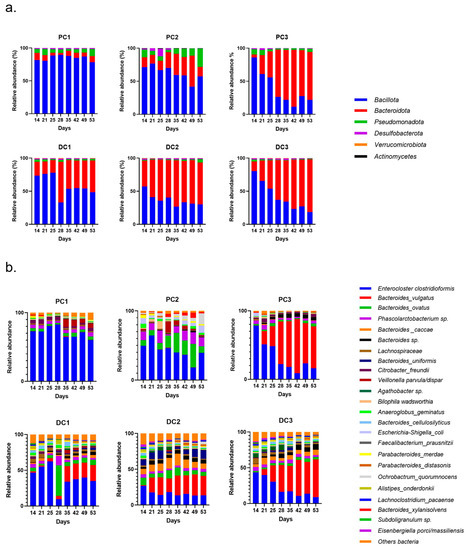
Figure 6.
Evolution of relative abundances (16s rDNA) at the phylum (a) and genus/species (b) from day 14 (end of stabilization of the microbiota) to day 53 for donor 1. PC: proximal colon, DC: distal colon, 1: system 1, 2: system 2, 3: system 3.
The monitoring of several bacterial groups by qPCR allowed variations over time to be highlighted. The timeline of the experiment, including timepoints T1, T2, T3 and T4, is described in Section 4.4. In system 1, Bacillota increased until T2 and then decreased at T3 in the proximal colon. In DC1, we observed an increase in Bacillota at T4. For Bacteroidota, a decrease appeared in PC1 at T2, and an increase was detected in DC1 at the end on the run. A decrease in Gammaproteobacteria was observed at T4 in DC1. Actinomycetes was decreased at T2 in both colons and at T4 in DC1. An increase in Escherichia coli appeared in PC1 at T3 and T4. Akkermansia was decreased in both colons at T3.
In system 2, a decrease in Bacillota was observed in PC2 and DC2 at T4 and T3, respectively. Bacteroidota was first increased at T1 and then decreased at T2 in PC2. In DC2, an increase was observed at T2. A decrease in Gammaprotebacteria appeared in PC2 and DC2 at T3 and T2, respectively. Conversely, an increase in Actinomycetes was observed in PC2 and DC2 at T3 and T4, respectively. A decrease in E. coli in PC2 at T2 was also significant, despite the injection of C5 during this period. Akkermansia also showed a decrease at T2, which was visible until the end of the run.
In system 3, a decrease in Bacillota appeared at T3 in the proximal colon. Several significant variations were also demonstrated in both colons for Bacteroidota, with an overall increase in their relative quantification. A significant decrease was observed for Gammaproteobacteria in PC3 at T2 and T3 and for Actinomycetes at T4 for both colons. The species E. coli showed a significant decrease in its relative quantification in PC3 at T3, and with a p-value = 0.055 in DC3 at T4. Akkermansia in the proximal colon showed a similar decrease to the one observed in PC2. The qPCR results are shown in the Supplementary Materials, Figure S5.
Some variations were observed in the SCFA concentrations and are presented in Figure 7. In system 1, a significant increase in butyrate at the end of the run and an increase in propionate at T3 and T4 were observed. Moreover, a decrease in acetate was detected in PC1 at T4. In system 2, acetate was increased in both colons, at T3 in PC2 and from T1 to T4 in DC2. An increase in butyrate and propionate appeared, respectively, in PC2 and DC2 at the end of the run. In system 3, a significant increase in propionate was visible from T2 to T4 in DC3. The same trend was visible in PC3, with no significant results (CTRL-T2: p = 0.0733, CTRL-T4: p = 0.0759). For butyrate, a decrease at T2 was followed by an increase at T4 in DC3. In PC3, a trend of increasing was observed at T4 (T2–T4: p = 0.09). Moreover, a significant decrease in acetate appeared at T4 in PC3. The AhR receptor was progressively and significantly induced in PC1, PC2, and PC3 and remained stable in the distal colons (Figure 8).
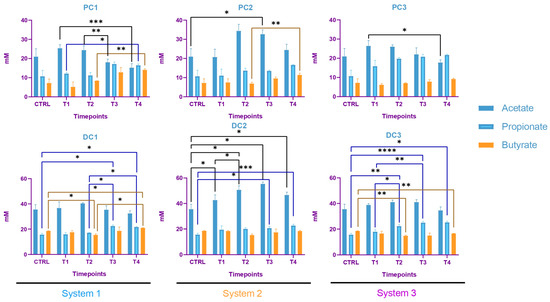
Figure 7.
Evolution in production of short chain fatty acids (SCFA) in proximal and distal colons of the three systems of donor 1. PC: proximal colon, DC: distal colon, 1: system 1, 2: system 2, 3: system 3. Statistical significance is indicated as p < 0.05 (*), p < 0.01 (**), p < 0.001 (***) and p < 0.0001 (****).
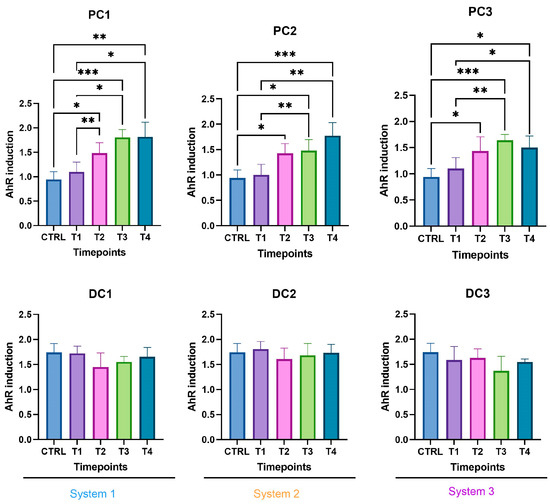
Figure 8.
Induction of the AhR receptor in proximal and distal colons of the three systems of donor 1. PC: proximal colon, DC: distal colon, 1: system 1, 2: system 2, 3: system 3. Statistical significance is indicated as p < 0.05 (*), p < 0.01 (**), and p < 0.001 (***).
- 2.
- Donor 2
As for donor 1, the metagenetic analysis of the fecal inoculum at day 0 showed a pre-dominance of Bacillota and Bacteroidota at the phyla level. Pseudomonadota and Verrucomicrobia were also visible, as shown in Figure 9. The main genera and species represented in terms of relative abundance were Enterocloster clostridioformis, genera from the Ruminococcacceae family, Citrobacter freundii, Bacteroides ovatus, Ruminoclostridium sp., Bacteroides vulgatus, genera from the Christensenellaceae family, Dialister invisus, Alistipes putredinis and genera from the Lachnospiraceae family.
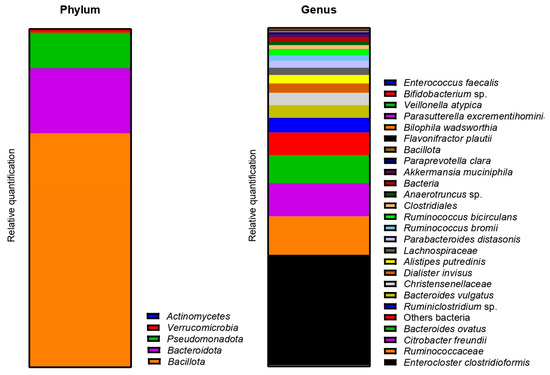
Figure 9.
Relative abundance in bacterial composition (16S rDNA) at the phylum (left) and genus/species (right) levels, in the fecal inoculum of donor 2.
The Beta-diversity of all samples are represented in Figure 10 using non-metric multi-dimensional scaling. The HOMOVA statistical test showed no significant difference between groups, either between systems or between days of experiment. A drift in diversity was visible (not significant) over the days between days 14, 21, 25 and 28 and days 35, 42, 49 and 53 in both colons.
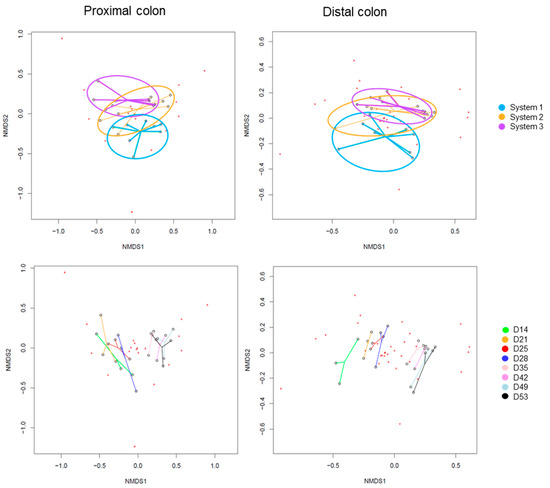
Figure 10.
Non-Metric Multidimensional Scaling (NMDS) of Beta-diversity by systems (up) or by days of experiment (down) in proximal and distal colons of donor 2. D: day.
The evolution of relative abundances of phyla and genera after 14 days of stabili-zation are presented in Figure 11. The main represented phyla were Bacillota, Bacteroidota and Pseudomonadota in proximal colons. In distal colons, the third-most-represented phylum was Verrucomicrobiota. The main genera were Enterocloster clostridioformis, Veillonella atypica, Bacteroides ovatus, Akkermansia muciniphila and Parabacteroides distasonis. E. coli was also graphically visible in both PC2 and PC3.
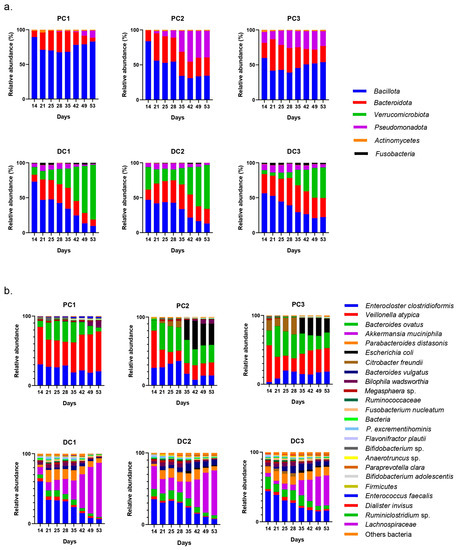
Figure 11.
Evolution of relative abundances (16s rDNA) of phylum (a) and genus/species (b) from day 14 (end of stabilization of the microbiota) to day 53 for donor 2. PC: proximal colon, DC: distal colon, 1: system 1, 2: system 2, 3: system 3.
The results of the monitoring of bacterial groups by qPCR showed some variations (Supplementary Materials Figure S6). In system 1, a significant decrease in Bacilllota appeared at T3 in DC1. Regarding Gammaproteobacteria, a decrease at T2 was followed by an increase at T3 and T4 in PC1, and decreases at T3 and T4 in DC1 were observed. A decrease in Actinomycetes and Akkermansia also appeared in PC1 at T4, and at T3 and T4, respectively. Conversely, increases in E. coli and Akkermansia were observed at T4 in DC1.
In system 2, a significant drop in Bacillota and Gammaproteobacteria occurred at T3 in DC2. Conversely, an increase in Gammaproteobacteria in PC2 occurred at T4. Actinomycetes and E. coli were significantly increased at T4 in DC2. E. coli also increased at T3 and T4 in PC2. A variation of Akkermansia was observed in DC2, with a decrease at T2 followed by an increase at T4.
In system 3, a significant decrease in Bacillota occurred at T4 in DC3. Bacteroidota were decreased at T4 in PC3. A progressive increase occurred for Gammaproteobacteria, from T2 to T4 in PC3. An increase occurred for E. coli in parallel with a decrease in Akkermansia at T4 in PC3.
In system 1, increases in propionate and butyrate production appeared in both colons at the end of the run. Moreover, a decrease in acetate was detected at T2 in PC1. In system 2, acetate production dropped between T2 and T3 in both colons and then increased at T4 in PC2. The same trend was observed for propionate in PC2. In DC2, propionate increased at T4. In system 3, we also observed a decrease in acetate at T2, followed by an increase at T4 in DC3 and an increase in propionate at T4 in both colons. The SCFA productions results are presented in Figure 12. The AhR receptor was induced in DC1, with an increase at T3 and T4. An increase was also observed at T2 in DC2 and in both PC3 and DC3 at T4. (Figure 13).
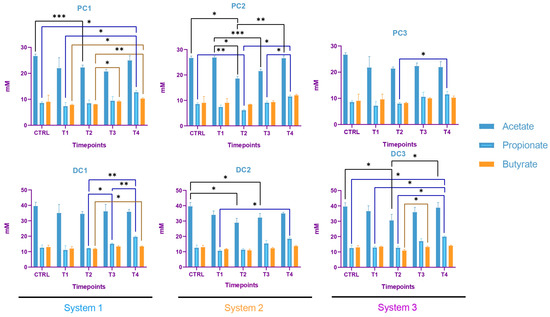
Figure 12.
Evolution in the production of short chain fatty acids (SCFA) in proximal and distal colons of the three systems of donor 2. PC: proximal colon, DC: distal colon, 1: system 1, 2: system 2, 3: system 3. Statistical significance is indicated as p < 0.05 (*), p < 0.01 (**) and p < 0.001 (***).
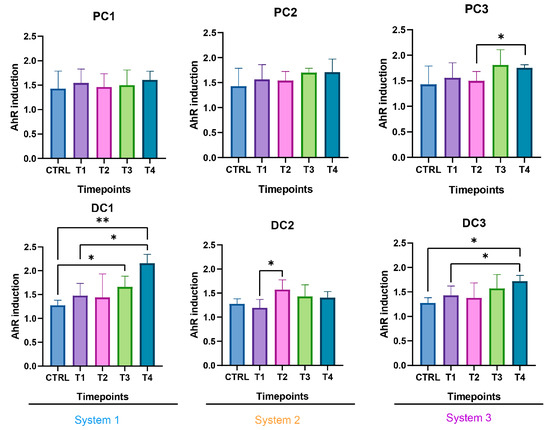
Figure 13.
Induction of the AhR receptor in proximal and distal colons of the three systems of donor 2. PC: proximal colon, DC: distal colon, 1: system 1, 2: system 2, 3: system 3. Statistical significance is indicated as p < 0.05 (*) and p < 0.01 (**).
- 3.
- Donor 3
The metagenetic analysis of the fecal inoculum at day 0 showed a predominance of Bacillota and Bacteroidota at the phyla level (Figure 14). The main genera/species represented in terms of relative abundance were genera and species from the Lachnospiraceae family, Faecalibacterium, Blautia, Bacteroides vulgatus, Ruminococcus, Subdoligranulum variabile, Dialister, Coprococcus eutactus, genera from the Oscillospirales order and genera from the Christensenellaceae family.
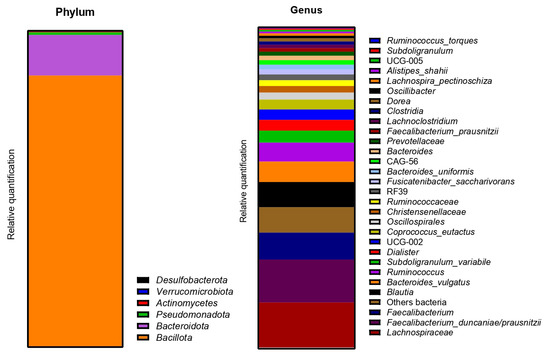
Figure 14.
Relative abundance in bacterial composition (16S rDNA) at the phylum (left) and genus/species (right) levels in the fecal inoculum of donor 3.
The Beta-diversity of all samples is represented in Figure 15, using non-metric multi-dimensional scaling. The HOMOVA statistical test showed no significant differences between groups, either between systems or between days of experiment. A clustering was visible by system in both colons. A drift in diversity (not significant) was also visible at days 49 and 53 in the proximal colon.
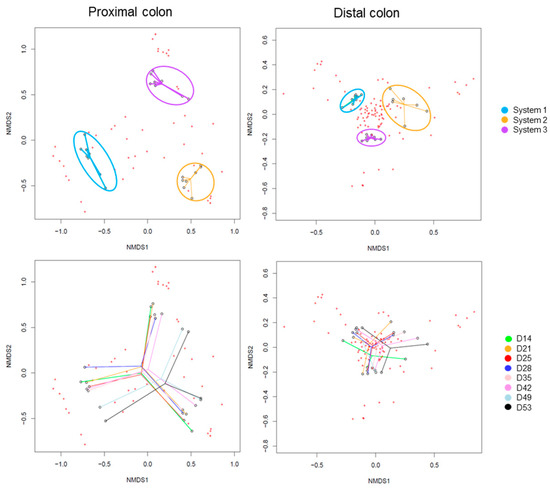
Figure 15.
Non-Metric Multidimensional Scaling (NMDS) of Beta-diversity by systems (up) or by days of experiment (down) in proximal and distal colons of donor 3. D: day.
After the stabilization period, the bacterial composition of the microbiota of the proximal colon stabilized differently in each system (system 1, 2 and 3), despite the fact that no anomalies in pH, temperature, or tightness were detected during this period. This was mainly visible at the genus level, with a predominance of E. coli in PC1, Enterocloster clostridioformis in PC2 and Klebsiella pneumoniae in PC3 with, as a repercussion, an important representation of Pseudomonadota in PC1 and PC3 at the phyla level. Despite these data, the results were analyzed by separating the systems and colons as performed for donors 1 and 2. It is important to keep in mind, however, that it was not possible to determine whether one or none of the systems were able to represent the bacterial diversity present in the starting inoculum. The evolution of the relative abundance is shown in Figure 16.
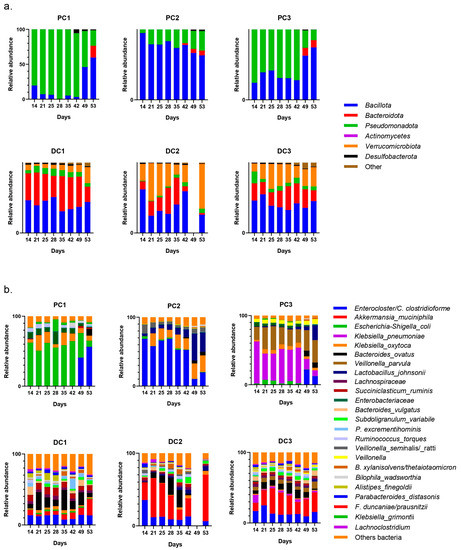
Figure 16.
Evolution of relative abundances (16s rDNA) of phylum (a) and genus/species (b) after 14 days of stabilization of the microbiota from donor 3. PC: proximal colon, DC: distal colon, 1: system 1, 2: system 2, 3: system 3.
Some variations in the relative quantifications by qPCR were observed and are shown in Figure S7. In system 1, increases in Bacillota and Gammaproteobacteria appeared at T4 in PC1. In DC1, a decrease was detected in Gammaproteobacteria and Akkermansia at T3. An increase in Actinomycetes was demonstrated at T3 and T4 in PC1 and DC1, respectively, and a decrease at T4 for PC1. For E. coli, a significant increase appeared at T2 in DC1.
For system 2, increases were detected in PC2 for Bacillota at T2 and Bacteroidota at T4. In DC2, significant increases in Gammaproteobacteria, Actinomycetes and Akkermansia were observed at T4. In system 3, an increase in Bacteroidota at T4 was detected in PC3. No other significant changes were highlighted in system 3.
The SCFA production in system 1 remained stable during the run, except for an increase in butyrate in DC1 at T4. In system 2, a decrease in acetate and an increase in proprionate were observed at T4 in PC2. In DC2, an increase in butyrate appeared at the end of the run. In system 3, acetate and propionate were increased at T3 and T4, respectively, in PC3. In DC3, propionate and butyrate were both increased at T3 (Figure 17). The AhR was more strongly induced at T4 for PC1, both PC2 and DC2, and PC3, despite a drop at T3 in PC3 (Figure 18).
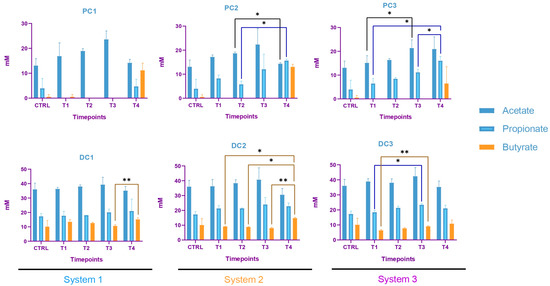
Figure 17.
Evolution in production of short chain fatty acids (SCFA) in proximal and distal colons of the three systems of donor 3. PC: proximal colon, DC: distal colon, 1: system 1, 2: system 2, 3: system 3. Statistical significance is indicated as p < 0.05 (*) and p < 0.01 (**).
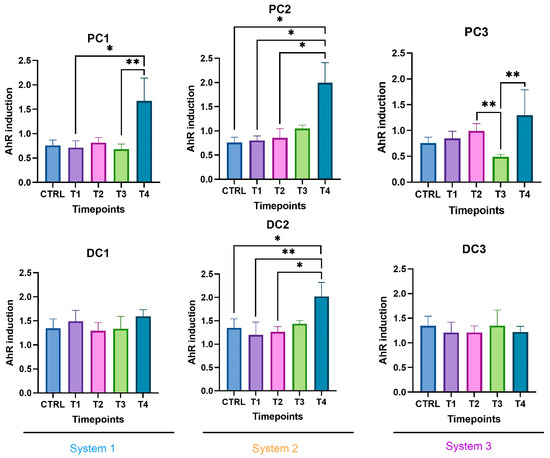
Figure 18.
Induction of the AhR receptor in proximal and distal colons of the three systems of donor 3. PC: proximal colon, DC: distal colon, 1: system 1, 2: system 2, 3: system 3. Statistical significance is indicated as p < 0.05 (*) and p < 0.01 (**).
3. Discussion
In this study, the aim was to evaluate the therapeutic potential of K1_ULINTec4 in the elimination of an E. coli K1 strain in the microbiota of pregnant women to prevent its transmission and the development of sepsis and meningitis in newborns. This preventive treatment would not be enough to completely eliminate the risk of developing an infection in the newborn. Indeed, these strains can come from other sources, such as the environment, equipment, and hospital staff [36,37]. Targeting these bacteria in the intestinal microbiota of pregnant woman could nevertheless reduce the risk of infection. The aim of this study was to evaluate not only the efficacy of phage therapy, but also its impact on the bacterial populations of the intestinal microbiota.
The first objective was to select an appropriate phage concentration to be inoculated into the SHIME® model. Different concentrations, expressed as multiplicity of infection (MOI), had been previously tested in an in vivo G. mellonella model [33]. In this study, this experiment was repeated with the C5 strain and three different MOI (100, 10 and 1) of K1_ULINTec4. The treatment increased the survival rate of the larvae independently of the tested concentrations. Therefore, an MOI of 1 was chosen for the experiments conducted in the gastrointestinal model. This ratio corresponds to a concentration of 1010 PFU/administration in the SHIME model, corresponding to 108 PFU/mL after distribution in the volume of the bioreactors, which is consistent with the doses generally used therapeutically in humans [38]. Moreover, this dose was the highest achievable dose under the amplification and concentration conditions used in this study.
The K1_ULINTec4 phage was found to be able to persist in the SHIME® model, as evidenced by its persistence being similar to the theoretical persistence of the inert molecule in the proximal colon. This aptitude is not commonly seen, as described in other studies where phages tend to disappear more rapidly [29,30,39]. In most cases, this is certainly due to the pH conditions experienced and/or the action of bile and pancreatin [39]. For donors 1 and 3, the fact that the phage was eventually washed out of the system was also a sign that K1_ULINTec4 could not find a host to support its replication in the commensal bacteria of the intestinal microbiota. However, a low quantifiable phage titer was detected at the end of the run in the distal colon of donor 2. It is therefore possible that the phage replicated in this system in the absence of E coli K1 inoculation. This could be due to the presence of low levels of E coli K1 in the donor’s intestinal microbiota not being detected either by qPCR screening or by concentration monitoring during the run. In parallel, it was observed that when both C5 and K1_ULINTec4 (system 3) were inoculated, the phage concentration differed significantly from system 1 eighteen days after the last phage inoculation in both colons, meaning that K1_ULINTec4 was able to replicate using the C5 strain in the model. Its concentration even tended to stabilize, highlighting the possibility that the phage continues to replicate in the presence of its host bacteria without a complete elimination.
Regarding E. coli K1 inoculated in system 2 (C5 alone) and 3 (C5 + K1_ULINTec4), it could be detected from the first sampling day until the last day of the run, reflecting the persistence of the bacteria in the system even after the inoculations were stopped. Unfortunately, despite the effective replication of the phage in system 3, the phage treatment did not completely eliminate the bacterial load. A significant decrease and a decreasing trend occurred at T3, respectively, in PC3 (p = 0.0179) and DC3 (p = 0.0506), which may reflect a transient action of the phage. The coexistence of both phages and bacteria in system 3 may indicate the appearance of resistant clones. One possible explanation is that E. coli K1 identified by qPCR may have ceased production of their K1 capsule, resulting in a decreased or inhibited phage replication. This may result in a reduction in the virulence of the bacteria that were inoculated. This phenomenon has previously been observed by other researchers, who have demonstrated that phages able to selectively degrade the PSA capsule on the surface of E. coli K1 using endosialidases can alter its phenotype, reduce bacteremia, and decrease mortality rates in rats [28]. The phage K1_ULINTec4 encodes an endosialidase, allowing it to target the K1 capsule of E. coli [33]. It would be interesting to evaluate the virulence of E. coli K1 isolates after contact with the phage. Indeed, the resistance mechanisms that bacteria deploy against phages generally lead to fitness trade-offs that can reduce antibiotic resistance, virulence or colonization abilities [40]. Nevertheless, the phenomenon of pleiotropy can also generate trade-up effects, especially demonstrated in terms of antibiotic resistance [41,42]. It is therefore important to study these effects when evaluating phage-based treatments.
In order to reflect diversity in the Triple-SHIME experiments, three different pregnant donors were selected. However, the presence of donor inter-variability did not allow for an analysis of the metagenetic results together. Therefore, each donor was analyzed separately. To be able to go further into the statistical interpretation of the results, it would have been interesting to carry out technical replicates of each donor, which could not be performed in this study. Nevertheless, the different analyses carried out in the study are complementary and help to reinforce the obtained results.
The metagenetic analysis of the donor 1 fecal inoculum led to its classification as enterotype 1 due to the abundance of the genus Bacteroides [43,44]. After the stabilization of the intestinal microbiota in the model, the main genera detected corresponded to those of the starting inoculum, but with a different level of abundance. Indeed, the conditions of the model favored the development of some species to the detriment of others in each part of the colon. For example, the acidic pH of the proximal colons and the presence of highly fermentable nutrients was more favorable to the development of bacteria of the phylum Pseudomonadota. However, some differences are to be noted, such as the important abundance of bacteria from the genus Enterocloster clostridioformis (formerly Clostridium clostridioforme and Lachnoclostridium clostridioforme), an acetate and propionate producer and member of the family Lachnospiracae, frequently found in abundance in the intestinal microbiota [45]. When comparing the results of the monitoring of certain bacterial groups by qPCR with the results of metagenetics, certain concordances were observed: a decrease in the abundance of Bacillota in PC2, DC2 and PC3 at the end of the run, and an increase in Bacteroidota in DC1, PC2 and DC2, PC3 and DC3. A decrease in Gammaproteobacteria in PC3 and of E. coli, belonging to this class, in PC3 and DC3 seems to indicate an action of the phage on the inoculated bacteria. A decrease in E. coli was also visible in PC2, but was not maintained over time. The gut microbiota’s bacterial composition has a significant impact on short-chain fatty acids (SCFAs) production in the colon. SCFAs are the result of the fermentation of non-digestible dietary fibers by colonic bacteria, and different bacterial species have specific preferences for fermentation substrates and therefore produce different SCFAs in varying amounts [46]. In distal colons, the significant increase in propionate from T3 is consistent with the qPCR increase in the Bacteroidota phylum and is represented by a greater abundance of Bacteroides ovatus and Bacteroides vulgatus. In this study, the AhR activity can be linked to SCFAs productions. Indeed, previous studies have shown that butyrate, propionate and acetate can trigger AhR-responsive gene expression in vitro in a dose-dependent manner, with a greater sensitivity of butyrate (from 0.5 mM), followed by propionate (from 1 mM) and acetate (from 20 mM) [47,48]. SCFAs, particularly butyrate, can increase AhR activity without directly binding to the receptor. Butyrate acts as a histone deacetylase HDAC inhibitor (iHDAC), which results in increased AhR recruitment in the presence of agonist tryptophan-derived metabolites [49]. Increases in butyrate and propionate in PC1, butyrate in PC2 and propionate in PC3 resulted in significant AhR activity in proximal colons.
The predominance of Bacillota, including Ruminococcus, classified donor 2 as enterotype 3 [43,44]. After stabilization, the predominant species present in the starting inoculum, Enterocloster clostridioformis and Bacteroides ovatus, were maintained. The abundance of Veillonella atypica and Akkermansia municiphila became more prominent in the proximal colon for Veillonella, and in both colons for both species. A drop in Bacteroidota was visible at the end of the run, using both qPCR and metagenetic analyses, in PC2 and PC3. An increase in the Gammaproteobacteria class was detected by qPCR in the three proximal colons, and followed the same trend in the relative abundances of Pseudomonadota. This significant increase could be explained by the increase in Bilophila wadsoworthia species in PC1, while it would rather reflect an increase in E. coli in PC2 and PC3, as supported by the corresponding qPCR results. A decrease in Bacillota appeared in the three distal colons at the end of the run. In parallel, the genus Akkermansia was significantly decreased in PC1 and PC3 and increased in DC1 and DC2. Regarding volatile fatty acid production, a decrease in acetate concentration occurred in PC1, PC2, DC2 and DC3 at T2 and then increased again until T4. At the end of the run, increases in propionate were visible in all systems, and the butyrate increased in system 1 and DC3. The activation of the AhR receptor was found to be significant in PC3 and appeared to correlate with propionate production. In DC1 and DC3, the activity of the AhR receptor was increased at the end of the run, as for propionate and butyrate productions.
The gut microbiota of donor 3 was classified as enterotype 3, as for donor 2 [43,44]. Very surprisingly, after the stabilization of the microbiota in the model, the composition of the bacterial populations differed between the three systems. This was mainly visible in the metagenetic results of the proximal colons. Only a few predominant taxa persisted in visible abundance in the model: Lachnospiracae, Bacteroides vulgatus, Subdoligranulum, Ruminococcus torques and Lachnoclostridium. Interestingly, the major taxa that persisted after stabilization were the same as the predominant species found in donor 2, Enterocloster clostridioformis, Bacteroides ovatus, Veillonella and Akkermansia municiphila, found in low abundance in the starting inoculum. This reflected a bias in the model that reinforced certain genera more adapted to the applied conditions. No technical problems were detected during the stabilization phase, so these differences are difficult to explain. One hypothesis could be undetected variations induced by the model during the stabilization phase. Referring to donor 2, and taking into account the similarity at the enterotype level, system 2 seemed to have stabilized in the most appropriate way. Few variations were highlighted in qPCR, compared to other donors. The Bacteroidota phylum, composed of the main propionate-producing species, was absent from the proximal colons throughout the experiment, except at the end of the run [50]. This observation was confirmed by the metagenetics results, but also by the SCFA production. In PC1, the propionate concentration, low at the start (4 mM), became undetectable until T4, when production was observed again. This observation differs from PC2 and PC3, where a production of propionate was found in the absence of Bacteroidota until T3. The production of propionate in that case could be explained by the presence of Veillonella in both PC2 and PC3, and not in PC1 [51]. The evolution of the butyrate concentration followed the same trend as the propionate in PC1, with a low concentration at the start followed by an absence of production and an increase at the end. This was observed in the three proximal colons. These results were consistent with the levels of AhR activation, and were correlated with the genus Bacteroides ovatus, which appeared at the end of the run in the three bioreactors [52].
All the results related to the intestinal microbiota showed that the effects observed were donor dependent. This was expected, given the inter-variability between donors. Working with three different donors made it possible to evaluate the treatment, taking into account the inter-individual variability, which would not be possible for a single inoculum repeated three times, or an inoculum composed of a mixture of several donors. Significant variations were observed in the different systems, but did not make it possible to demonstrate a common and significant effect of the three applied treatments (phage alone, bacteria and bacteria + phage) in the systems. In addition, most of the significant results were observed at the end of the run, which can be explained by variations due to the long duration of the experiments. These observations confirm a limited and donor-dependent impact of the phage and E. coli K1 on the intestinal microbiota. In addition, Alpha- and Beta-diversity analyses of the three donors did not reveal any significant differences, once again demonstrating the limited impact of these treatments. However, the K1_ULINTec4 phage inoculated into the model in the presence of E. coli K1 resulted in a decrease in bacterial concentration after the cessation of injections, and a prolonged persistence of the phage compared to its persistence when inoculated alone. These observations help to confirm that K1_ULINTec4 replicated in the model using the inoculated E. coli K1. Additionally, the possible appearance of phage-resistant mutants may have allowed E. coli K1 to persist in the model. The genomic analysis and evaluation of these E. coli K1 mutants resistant to phage K1_ULINTec4 could provide further insight into the pathogenicity of these strains.
4. Materials and Methods
4.1. Strains and Culture
The neonatal meningitis E. coli (NMEC) strain C5 “Bort” (O18ac:K1:H7) was used throughout the study. It was originally isolated in 1975 from cerebrospinal fluid of a newborn [53]. It was purchased from the American-type culture collection (ATCC) (LGC standards, Molsheim, France) and is referred to as Escherichia coli (Migula) Castellani and Chalmers ATCC 700973. Cultures were grown in LB Lennox broth at 37 °C. The phage vB_EcoP_K1_ULINTec4 was isolated in 2020 in Liège from wastewater using O18:K1 avian pathogenic E. coli strains (APEC45). This K1-dependent phage, belonging to the Vectrevirus genus, was characterized in vitro and in vivo using the Galleria mellonella model [33]. In this study, cesium chloride phage purification was performed for the determination of the multiplicity of infection (MOI) in G. mellonella, as described previously (Antoine et al. [33]). Phage cultures used in the SHIME® model were grown following a previously described propagation protocol, with some modifications [33]. After filtration (0.22 µm), phage lysate was concentrated by ultracentrifugation at 50,000× g for 3 h. The pellet was resuspended in phosphate-buffered saline solution (PBS) and ultracentrifuged a second time using the same parameters. Finally, the pellet was resuspended in PBS and stored at 4 °C before use. Phage titrations were performed using serial dilutions and a top agar overlay method [33].
4.2. Determination of the Optimal Phage Concentration in the Galleria mellonella Model
The preliminary and main experiments were performed as described previously (Antoine et al. [33]). To the determine optimal bacterial inoculation dose, 6 groups of 10 larvae were inoculated with C5 at different concentrations, ranging from 10² CFU/10 µL to 106 CFU/10 µL or PBS. The optimal inoculation dose was expected to result in 90–100% lethality after 4 days.
In the main experiment, 180 larvae were divided in 6 groups (Table 1). The larvae were injected twice at 1 h intervals, and the survival rate was assessed every 24 h for 96 h.

Table 1.
Groups of larvae used in the survival experiment.
4.3. Fecal Material Collection and Screening
The collection of the human fecal material and its research use was approved by the Ethical Committee of the Liège University Hospital (ULiège, Liège, Belgium; file number 2022/274). The three adult donors were, respectively, 30, 35 and 36 years old and met the following criteria: being a healthy pregnant woman between 18 and 40 years old, not following any particular diet (e.g., vegetarian, vegan, high protein, etc.), being antibiotic-free for at least 3 months before feces collection, not presenting any medical conditions, such as diabetes or gastrointestinal diseases.
Fecal samples were stored anaerobically at 4 °C before being processed as described previously (Goya-Jorge et al. [47]). They were stored at −80 °C until their use for experimentations.
A screening for naturally occurring E. coli K1 in the fecal samples from the donors was performed using qPCR targeting the neuB gene [54]. DNA extraction was performed using the QIAamp PowerFecal Pro DNA Kit (Qiagen, Hilden, Germany), following the manufacturer instructions. Real-time PCR was run using CFX96 Touch Real-Time PCR Detection System (Biorad, Hercules, CA, USA), according to the manufacturer’s recommendations, in 20 µL reaction volume using the FastGene® Probe 2 × qPCR Universal Mix (Nippon genetics, Tokyo, Japan). Details about primers, probes and cycle steps are described by Antoine et al. [33]. Samples were run in triplicate, including positive, negative and no template (NTC) controls.
The presence of phages from feces that could potentially infect the C5 strain was also assessed using an enrichment method [55]. Briefly, 1 g of feces was diluted 10 times in PBS and then filter-sterilized using a 0.22 µm sterile syringe filter (ref.514-0073, VWR, Leicestershire, UK). Then, the filtrate was added to an equivalent volume of twice-concentrated LB Lennox (1 mM CaCl2, 1 mM MgSO4, Sigma-Aldrich, Saint-Louis, MO, USA), as well as 100 µL of C5 culture at an optical density (OD) of 0.25. A sterility control and a growth control were also included. All tubes were incubated at 37 °C until potential lysis occurred. Samples were then centrifuged and filtered-sterilized (0.22 µm) before spreading on an LB Lennox agar plate and covered with a bacterial overlay (OD: 0.25). Plates were incubated at 37 °C for 24h to check the presence of plaques of lysis.
4.4. Human Gastrointestinal Model Set-Up and Experimental Design
Three independent triple-SHIME® runs were performed to reproduce the colon microbiota of the three different donors, using standard conditions, as previously described [56]. Each run was composed of three independent experiments conducted in three separate dynamic systems, working in parallel. Each system was composed of bioreactors representing the stomach/small intestine (ST/SM), the proximal colon (PC) and the distal colon (DC). The temperature was maintained at 37 °C using a continuous warm water flow between the double glass wall of the bioreactors. Anaerobic conditions were maintained throughout the experiment and the headspace was flushed once a day with a nitrogen flow (2.0 L/min). The pH of the colon bioreactors (PC: 5.6–5.9, DC: 6.6–6.9) was recorded with internal pH probes and regulated with the automatic addition of acid (HCl 0.5M) or base (NaOH 0.5M) solutions (ChemLab, Zedelgem, Belgium). Verifications of the pH range were performed three times a week during the entire experiment with an external pH measurement (Mettler-Toledo, Zaventem, Belgium). On the inoculation day, PC and DC bioreactors were filled with 500 mL and 800 mL of nutritional medium, respectively (ref: PD-NM001B, Prodigest, Ghent, Belgium), referred to as feed. Then, defrosted feces were added to the bioreactors at proportional volumes (PC: 25 mL, DC: 40 mL). The 3 systems were continuously maintained under agitation (300 rpm) and automatically fed three times a day with 140 mL of feed and 60 mL of a medium simulating bile and pancreatic juice (PJ) (NaHCO3-pancreatin-bile salts, Prodigest, Ghent, Belgium). The experimental set-up is illustrated in Figure 19b.
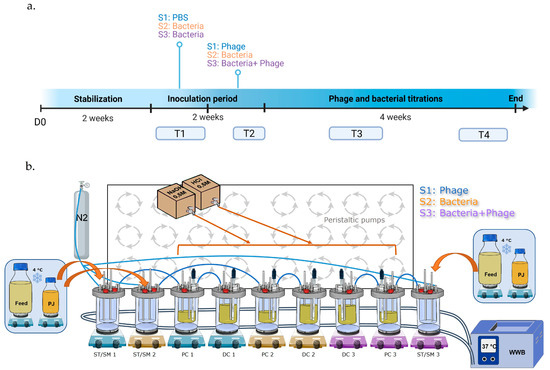
Figure 19.
Timeline of experiment (a) and experimental setting of the Triple-SHIME (b). S1: system 1, S2: system 2, S3: system 3, D0: day 0 T1: timepoint 1 (days 14 and 21), T2: timepoint 2 (days 25 and 28), T3: timepoint 3 (days 35 and 42), T4: timepoint 4 (days 49 and 53), ST/SM: stomach/small intestine, PC: proximal colon, DC distal colon, PJ: pancreatic juice, N2: nitrogen, WWB: warm water bath.
Each run was conducted for 8 weeks. After feces inoculation in the 3 systems, the microbiota was stabilized for 2 weeks [57]. A 108 CFU/mL concentration was chosen based on a previous study assessing the colonization of E. coli K1 in a mouse gastrointestinal tract [21]. System 1 was inoculated with K1_ULINTec4 only, system 2 with C5 only and system 3 with both C5 and K1_ULINTec4. Each inoculation had a volume of 10 mL of either PBS resuspended culture of C5 at a concentration of 1010 CFU/mL PBS or K1_ULINTec4 at a concentration of 1010 PFU/mL. Bacteria, phage and PBS were directly injected into the bioreactors using a 10 mL syringe with needle. After stabilization, system 1 was inoculated with PBS, while systems 2 and 3 were inoculated with C5 on a daily basis for one week. Then, system 1 was inoculated with both PBS and K1_ULINTec4, system 2 with both C5 and PBS and system 3 with both C5 and K1_ULINTec4 at one hour intervals, respectively. All the systems continued to run for 4 more weeks. Samples in colon bioreactors were collected three times a week and stored at −20 °C until extraction and analysis. Additional 2 mL samples were collected to perform phage titrations by culture. A timeline summarizing the main steps of the run is shown in Figure 19a.
The persistence of K1_ULINTec4 in systems 1 and 3 was compared to the theoretical persistence in the system, which was calculated taking into account the transfer and removal of fluids [29,30].
4.5. 16S rDNA Gene Sequencing and qPCR of Selected Bacterial Groups
The DNA was extracted and sequenced using the same pipeline described in Laforêt et al. [29]. The selected timepoints were chosen to cover the most important periods of the run (T1: D14-D21; T2: D25-D28; T3: D35-D42, T4: D49-D53). They are represented in the timeline of Figure 19. Raw metagenetics data are available in the Supplementary Material.
Seven taxa were targeted by qPCR to follow specific bacterial groups: Bacillota (formerly Firmicutes), Bacteroidota (formerly Bacteroidetes) and Actinomycetes (formerly Actinobacteria) as 3 of the main prevalent phyla of the intestinal microbiota, Gammaproteobacteria [58], E. coli [59] and E. coli K1 [54] to follow the impact of phage and Akkermansia municiphila [60] as a gut health marker. Indeed, Akkermansia municiphila is known as a probiotic for its beneficial effects on health, and particularly its action on metabolic diseases, inflammatory bowel diseases, diseases of the central nervous system and many others [61,62]. Real-time PCR assays were performed using a CFX96 Touch Real-Time PCR Detection System (Biorad, Hercules, CA, USA), in 96-well plates (Nippon Genetics Europe, Düren, Germany) in technical duplicates, in 20 µL reaction volume. Except for E. coli K1 (see protocol in Section 4.3), the enzyme used was the Takyon™ No ROX SYBR MasterMix, and the primers and probe (Eurogentec, Seraing, Belgium) were used at a final concentration between 300 nM and 500 nm, respectively. The following steps were applied: initial denaturation at 95 °C for 5 min, followed by 35 cycles of denaturation at 95 °C for 15 s, annealing at a specific temperature depending on the target (Supplementary Materials Table S1) for 15 s and elongation at 72 °C for 30 s followed by a final elongation at 72 °C for 5 min. Then, melt-curves (65–95 °C) were performed to assess the specificity of the assay. A relative quantification using the 2−ΔΔCt method was performed to standardize the results for the total bacterial population [63].
4.6. Short-Chain Fatty Acids Analysis
Collected samples were centrifuged at 17,000× g for 5 min at room temperature. The supernatants were filtered-sterilized at 0.22 µm using syringe filters (ref.514-0073, VWR, Leicestershire, UK) to remove E. coli K1 before analysis. Solid-phase microextraction (SPME) followed by gas chromatography coupled to mass spectrometry (GC–MS) was used to quantify the short-chain fatty acids (SCFA), following the protocol developed by Douny et al. [64] and described in Laforêt et al. [29].
4.7. AhR Activity and Cytotoxicity Assays
AhR activity assay was conducted as described previously by Goya-Jorge et al. [47]. To evaluate the activation of the AhR receptor, AhR_HT29-Lucia (Invivogen, Toulouse, France), a human colon adenocarcinoma AhR-reporter cell line, was used. Cells were cultured according to the manufacturer’s recommendations, in DMEM supplemented with 4.5 g/L glucose, 2 mM L-glutamine, 10% of FBS and antibiotics: 100 μg/mL Pen/Strep, 100 μg/mL of Normocin and 100 μg/mL of Zeocin. They were incubated in 75 cm2 culture flasks at 37 °C in 5% CO2. Passages were performed when a confluence of 80–90% was reached. Cells were washed with PBS and detached using a 0.25% solution of trypsin-EDTA before seeding them in new flasks. For the experiment, AhR_HT29 Lucia cells were seeded at a concentration of 3.0 × 10⁵ cells/mL in CellStart® 96-well microplates and incubated overnight before treatment. After 24 h of exposure to the supernatants of the bioreactor samples, 20 μL of the cell supernatant was transferred to Nunc ™ white 96-well plates before adding 50 μL/well of Quanti-Luc™ assay reagent. Bioluminescence was measured using a luminometer (ORION II, Berthold Detection System, Pforzheim, Germany). In parallel, cell viability was assessed using the 3-(4,5-dimethylthiazol-2-yl)-2,5-diphenyltetrazolium bromide (MTT) bioassay [65,66]. The MTT formazan absorbance was read at 550/630 nm using an ELX800TM microplate reader spectrophotometer (Agilent BioTek Inc., Winooski, VT, USA). All assays were performed in technical triplicate.
4.8. Statistical Analysis
Diversity indexes were calculated using R with Rcmdr and vegan packages. All other statistical analyses and graphical representations were performed using GraphPad Prism version 8.0.2 for Windows, GraphPad Software (San Diego, CA, USA). After assessing the normality of the results, a repeated measures ANOVA was performed paired with Tukey’s multiple comparison test. A Friedman test paired with Dunn’s multiple comparison test was used when the results were not normal.
Supplementary Materials
The following supporting information can be downloaded at: https://www.mdpi.com/article/10.3390/ijms241310580/s1.
Author Contributions
Conceptualization, C.A., D.T. and V.D.; Data curation, C.A., A.F., B.T. and G.D.; Formal analysis, C.A.; Funding acquisition, D.T. and V.D.; Investigation, C.A., F.L., C.D., J.-N.D., A.F. and M.-L.S.; Methodology, C.A., F.L., E.G.-J., D.T. and V.D.; Project administration, D.T. and V.D.; Resources, C.A., F.L., E.G.-J., I.G., S.L. and V.D.; Software, C.A.; Supervision, D.T. and V.D.; Validation, C.A., D.T. and V.D.; Visualization, C.A.; Writing—original draft, C.A., D.T. and V.D.; Writing—review and editing, C.A., F.L., E.G.-J., I.G., S.L., C.D., J.-N.D., A.F., B.T., M.-L.S., G.D., D.T. and V.D. All authors have read and agreed to the published version of the manuscript.
Funding
The project was financially supported by Wallonia in the framework of the call for projects organized by the BioWin competitiveness cluster.
Institutional Review Board Statement
The study was conducted in accordance with the Declaration of Helsinki, and approved by the Ethics Committee of the “Comité d’Ethique Hospitalo-Facultaire Universitaire de Liège (ref: 2021/408 approved on the 4 February 2022).
Informed Consent Statement
Informed consent was obtained from all subjects involved in the study. Written informed consent has been obtained from the patients to publish this paper.
Data Availability Statement
Not applicable.
Conflicts of Interest
This work was performed in the context of a regionally funded project dedicated to the commercial development of bacteriophages as human medicines. A.F. is employed by FoodChain ID GENOMICS SA, which participated in this project. The other authors declare no conflict of interest.
References
- Gaschignard, J.; Levy, C.; Romain, O.; Cohen, R.; Bingen, E.; Aujard, Y.; Boileau, P. Neonatal Bacterial Meningitis: 444 Cases in 7 Years. Pediatr. Infect. Dis. J. 2011, 30, 212. [Google Scholar] [CrossRef] [PubMed]
- Zainel, A.; Mitchell, H.; Sadarangani, M. Bacterial Meningitis in Children: Neurological Complications, Associated Risk Factors, and Prevention. Microorganisms 2021, 9, 535. [Google Scholar] [CrossRef] [PubMed]
- Ku, L.C.; Boggess, K.A.; Cohen-Wolkowiez, M. Bacterial Meningitis in the Infant. Clin. Perinatol. 2015, 42, 29–45. [Google Scholar] [CrossRef]
- Klinger, G.; Levy, I.; Sirota, L.; Boyko, V.; Reichman, B.; Lerner-Geva, L. Epidemiology and Risk Factors for Early Onset Sepsis among Very-Low-Birthweight Infants. Am. J. Obstet. Gynecol. 2009, 201, 38.e1–38.e6. [Google Scholar] [CrossRef] [PubMed]
- Furyk, J.S.; Swann, O.; Molyneux, E. Systematic Review: Neonatal Meningitis in the Developing World. Trop. Med. Int. Health 2011, 16, 672–679. [Google Scholar] [CrossRef]
- Doran, K.S.; Fulde, M.; Gratz, N.; Kim, B.J.; Nau, R.; Prasadarao, N.; Schubert-Unkmeir, A.; Tuomanen, E.I.; Valentin-Weigand, P. Host–Pathogen Interactions in Bacterial Meningitis. Acta Neuropathol. 2016, 131, 185–209. [Google Scholar] [CrossRef]
- Houdouin, V.; Bonacorsi, S.; Bidet, P.; Blanco, J.; De La Rocque, F.; Cohen, R.; Aujard, Y.; Bingen, E. Association between Mortality of Escherichia coli Meningitis in Young Infants and Non-Virulent Clonal Groups of Strains. Clin. Microbiol. Infect. 2008, 14, 685–690. [Google Scholar] [CrossRef]
- King, J.E.; Aal Owaif, H.A.; Jia, J.; Roberts, I.S. Phenotypic Heterogeneity in Expression of the K1 Polysaccharide Capsule of Uropathogenic Escherichia coli and Downregulation of the Capsule Genes during Growth in Urine. Infect. Immun. 2015, 83, 2605–2613. [Google Scholar] [CrossRef]
- Kathayat, D.; Lokesh, D.; Ranjit, S.; Rajashekara, G. Avian Pathogenic Escherichia coli (APEC): An Overview of Virulence and Pathogenesis Factors, Zoonotic Potential, and Control Strategies. Pathogens 2021, 10, 467. [Google Scholar] [CrossRef]
- Sikias, P.; Biran, V.; Foix-L’Hélias, L.; Plainvert, C.; Boileau, P.; Bonacorsi, S. EOS study group Early-Onset Neonatal Sepsis in the Paris Area: A Population-Based Surveillance Study from 2019 to 2021. Arch. Dis. Child. Fetal Neonatal Ed. 2023, 108, 114–120. [Google Scholar] [CrossRef]
- Dubois, D.; Prasadarao, N.V.; Mittal, R.; Bret, L.; Roujou-Gris, M.; Bonnet, R. CTX-M β-Lactamase Production and Virulence of Escherichia coli K1. Emerg. Infect. Dis. 2009, 15, 1988–1990. [Google Scholar] [CrossRef] [PubMed]
- Wijetunge, D.S.S.; Gongati, S.; DebRoy, C.; Kim, K.S.; Couraud, P.O.; Romero, I.A.; Weksler, B.; Kariyawasam, S. Characterizing the Pathotype of Neonatal Meningitis Causing Escherichia coli (NMEC). BMC Microbiol. 2015, 15, 211. [Google Scholar] [CrossRef]
- McCarthy, A.J.; Birchenough, G.M.H.; Taylor, P.W. Loss of Trefoil Factor 2 Sensitizes Rat Pups to Systemic Infection with the Neonatal Pathogen Escherichia coli K1. Infect. Immun. 2019, 87, e00878-18. [Google Scholar] [CrossRef] [PubMed]
- Witcomb, L.A.; Czupryna, J.; Francis, K.P.; Frankel, G.; Taylor, P.W. Non-Invasive Three-Dimensional Imaging of Escherichia coli K1 Infection Using Diffuse Light Imaging Tomography Combined with Micro-Computed Tomography. Methods 2017, 127, 62–68. [Google Scholar] [CrossRef] [PubMed]
- Herold, R.; Schroten, H.; Schwerk, C. Virulence Factors of Meningitis-Causing Bacteria: Enabling Brain Entry across the Blood–Brain Barrier. Int. J. Mol. Sci. 2019, 20, 5393. [Google Scholar] [CrossRef] [PubMed]
- Kim, K.J.; Elliott, S.J.; Di Cello, F.; Stins, M.F.; Kim, K.S. The K1 Capsule Modulates Trafficking of E. Coli-Containing Vacuoles and Enhances Intracellular Bacterial Survival in Human Brain Microvascular Endothelial Cells. Cell. Microbiol. 2003, 5, 245–252. [Google Scholar] [CrossRef]
- Basmaci, R.; Bonacorsi, S.; Bidet, P.; Biran, V.; Aujard, Y.; Bingen, E.; Béchet, S.; Cohen, R.; Levy, C. Escherichia coli Meningitis Features in 325 Children From 2001 to 2013 in France. Clin. Infect. Dis. 2015, 61, 779–786. [Google Scholar] [CrossRef]
- Gu, H.; Liao, Y.; Zhang, J.; Wang, Y.; Liu, Z.; Cheng, P.; Wang, X.; Zou, Q.; Gu, J. Rational Design and Evaluation of an Artificial Escherichia coli K1 Protein Vaccine Candidate Based on the Structure of OmpA. Front. Cell. Infect. Microbiol. 2018, 8, 172. [Google Scholar] [CrossRef]
- Zhang, J.; Sun, H.; Gao, C.; Wang, Y.; Cheng, X.; Yang, Y.; Gou, Q.; Lei, L.; Chen, Y.; Wang, X.; et al. Development of a Chitosan-modified PLGA Nanoparticle Vaccine for Protection against Escherichia coli K1 Caused Meningitis in Mice. J. Nanobiotechnol. 2021, 19, 69. [Google Scholar] [CrossRef]
- Westphal, N.; Theis, T.; Loers, G.; Schachner, M.; Kleene, R. Nuclear Fragments of the Neural Cell Adhesion Molecule NCAM with or without Polysialic Acid Differentially Regulate Gene Expression. Sci. Rep. 2017, 7, 13631. [Google Scholar] [CrossRef]
- Birchenough, G.M.H.; Dalgakiran, F.; Witcomb, L.A.; Johansson, M.E.V.; McCarthy, A.J.; Hansson, G.C.; Taylor, P.W. Postnatal Development of the Small Intestinal Mucosa Drives Age-Dependent, Regio-Selective Susceptibility to Escherichia coli K1 Infection. Sci. Rep. 2017, 7, 83. [Google Scholar] [CrossRef] [PubMed]
- McCarthy, A.J.; Negus, D.; Martin, P.; Pechincha, C.; Oswald, E.; Stabler, R.A.; Taylor, P.W. Pathoadaptive Mutations of Escherichia coli K1 in Experimental Neonatal Systemic Infection. PLoS ONE 2016, 11, e0166793. [Google Scholar] [CrossRef] [PubMed]
- Bioluminescent Imaging Reveals Novel Patterns of Colonization and Invasion in Systemic Escherichia coli K1 Experimental Infection in the Neonatal Rat. Available online: https://journals.asm.org/doi/epdf/10.1128/IAI.00953-15?src=getftr (accessed on 25 March 2023).
- Martindale, J.; Stroud, D.; Moxon, E.R.; Tang, C.M. Genetic Analysis of Escherichia coli K1 Gastrointestinal Colonization. Mol. Microbiol. 2000, 37, 1293–1305. [Google Scholar] [CrossRef] [PubMed]
- Glode, M.P.; Sutton, A.; Moxon, E.R.; Robbins, J.B. Pathogenesis of Neonatal Escherichia coli Meningitis: Induction of Bacteremia and Meningitis in Infant Rats Fed E. coli K1. Infect. Immun. 1977, 16, 75–80. [Google Scholar] [CrossRef] [PubMed]
- Pluschke, G.; Mercer, A.; Kusećek, B.; Pohl, A.; Achtman, M. Induction of Bacteremia in Newborn Rats by Escherichia coli K1 Is Correlated with Only Certain O (Lipopolysaccharide) Antigen Types. Infect. Immun. 1983, 39, 599–608. [Google Scholar] [CrossRef]
- Huang, S.-H.; He, L.; Zhou, Y.; Wu, C.-H.; Jong, A. Lactobacillus rhamnosus GG Suppresses Meningitic E. coli K1 Penetration across Human Intestinal Epithelial Cells In Vitro and Protects Neonatal Rats against Experimental Hematogenous Meningitis. Int. J. Microbiol. 2008, 2009, e647862. [Google Scholar] [CrossRef]
- Mushtaq, N.; Redpath, M.B.; Luzio, J.P.; Taylor, P.W. Prevention and Cure of Systemic Escherichia coli K1 Infection by Modification of the Bacterial Phenotype. Antimicrob. Agents Chemother. 2004, 48, 1503–1508. [Google Scholar] [CrossRef]
- Laforêt, F.; Antoine, C.; Lebrun, S.; Gonza, I.; Goya-Jorge, E.; Douny, C.; Duprez, J.-N.; Scippo, M.-L.; Taminiau, B.; Daube, G.; et al. Impact Assessment of VB_KpnP_K1-ULIP33 Bacteriophage on the Human Gut Microbiota Using a Dynamic In Vitro Model. Viruses 2023, 15, 719. [Google Scholar] [CrossRef]
- Verthé, K.; Possemiers, S.; Boon, N.; Vaneechoutte, M.; Verstraete, W. Stability and Activity of an Enterobacter Aerogenes-Specific Bacteriophage under Simulated Gastro-Intestinal Conditions. Appl. Microbiol. Biotechnol. 2004, 65, 465–472. [Google Scholar] [CrossRef]
- Federici, S.; Kredo-Russo, S.; Valdés-Mas, R.; Kviatcovsky, D.; Weinstock, E.; Matiuhin, Y.; Silberberg, Y.; Atarashi, K.; Furuichi, M.; Oka, A.; et al. Targeted Suppression of Human IBD-Associated Gut Microbiota Commensals by Phage Consortia for Treatment of Intestinal Inflammation. Cell 2022, 185, 2879–2898.e24. [Google Scholar] [CrossRef]
- Moye, Z.D.; Woolston, J.; Abbeele, P.V.D.; Duysburgh, C.; Verstrepen, L.; Das, C.R.; Marzorati, M.; Sulakvelidze, A. A Bacteriophage Cocktail Eliminates Salmonella Typhimurium from the Human Colonic Microbiome While Preserving Cytokine Signaling and Preventing Attachment to and Invasion of Human Cells by Salmonella In Vitro. J. Food Prot. 2019, 82, 1336–1349. [Google Scholar] [CrossRef]
- Antoine, C.; Laforêt, F.; Blasdel, B.; Fall, A.; Duprez, J.-N.; Mainil, J.; Delcenserie, V.; Thiry, D. In Vitro Characterization and In Vivo Efficacy Assessment in Galleria Mellonella Larvae of Newly Isolated Bacteriophages against Escherichia coli K1. Viruses 2021, 13, 2005. [Google Scholar] [CrossRef]
- Smith, H.W.; Huggins, M.B. Successful Treatment of Experimental Escherichia coli Infections in Mice Using Phage: Its General Superiority over Antibiotics. Microbiology 1982, 128, 307–318. [Google Scholar] [CrossRef]
- Schneider, G.; Szentes, N.; Horváth, M.; Dorn, Á.; Cox, A.; Nagy, G.; Doffkay, Z.; Maróti, G.; Rákhely, G.; Kovács, T. Kinetics of Targeted Phage Rescue in a Mouse Model of Systemic Escherichia coli K1. BioMed Res. Int. 2018, 2018, e7569645. [Google Scholar] [CrossRef]
- Alkeskas, A.; Ogrodzki, P.; Saad, M.; Masood, N.; Rhoma, N.R.; Moore, K.; Farbos, A.; Paszkiewicz, K.; Forsythe, S. The Molecular Characterisation of Escherichia coli K1 Isolated from Neonatal Nasogastric Feeding Tubes. BMC Infect. Dis. 2015, 15, 449. [Google Scholar] [CrossRef]
- Alos, J.I.; Lambert, T.; Courvalin, P. Comparison of Two Molecular Methods for Tracing Nosocomial Transmission of Escherichia coli K1 in a Neonatal Unit. J. Clin. Microbiol. 1993, 31, 1704–1709. [Google Scholar] [CrossRef]
- Suh, G.A.; Lodise, T.P.; Tamma, P.D.; Knisely, J.M.; Alexander, J.; Aslam, S.; Barton, K.D.; Bizzell, E.; Totten, K.M.C.; Campbell, J.L.; et al. Considerations for the Use of Phage Therapy in Clinical Practice. Antimicrob. Agents Chemother. 2022, 66, e02071-21. [Google Scholar] [CrossRef]
- Scanlan, J.G.; Hall, A.R.; Scanlan, P.D. Impact of Bile Salts on Coevolutionary Dynamics between the Gut Bacterium Escherichia coli and Its Lytic Phage PP01. Infect. Genet. Evol. 2019, 73, 425–432. [Google Scholar] [CrossRef]
- Mangalea, M.R.; Duerkop, B.A. Fitness Trade-Offs Resulting from Bacteriophage Resistance Potentiate Synergistic Antibacterial Strategies. Infect. Immun. 2020, 88, e00926-19. [Google Scholar] [CrossRef]
- Burmeister, A.R.; Fortier, A.; Roush, C.; Lessing, A.J.; Bender, R.G.; Barahman, R.; Grant, R.; Chan, B.K.; Turner, P.E. Pleiotropy Complicates a Trade-off between Phage Resistance and Antibiotic Resistance. Proc. Natl. Acad. Sci. USA 2020, 117, 11207–11216. [Google Scholar] [CrossRef]
- McGee, L.W.; Barhoush, Y.; Shima, R.; Hennessy, M. Phage-Resistant Mutations Impact Bacteria Susceptibility to Future Phage Infections and Antibiotic Response. Ecol. Evol. 2023, 13, e9712. [Google Scholar] [CrossRef] [PubMed]
- Costea, P.I.; Hildebrand, F.; Arumugam, M.; Bäckhed, F.; Blaser, M.J.; Bushman, F.D.; de Vos, W.M.; Ehrlich, S.D.; Fraser, C.M.; Hattori, M.; et al. Enterotypes in the Landscape of Gut Microbial Community Composition. Nat. Microbiol. 2018, 3, 8–16. [Google Scholar] [CrossRef] [PubMed]
- Arumugam, M.; Raes, J.; Pelletier, E.; Le Paslier, D.; Yamada, T.; Mende, D.R.; Fernandes, G.R.; Tap, J.; Bruls, T.; Batto, J.-M.; et al. Enterotypes of the Human Gut Microbiome. Nature 2011, 473, 174–180. [Google Scholar] [CrossRef] [PubMed]
- Gutiérrez, N.; Garrido, D. Species Deletions from Microbiome Consortia Reveal Key Metabolic Interactions between Gut Microbes. mSystems 2019, 4, e00185-19. [Google Scholar] [CrossRef]
- Morrison, D.J.; Preston, T. Formation of Short Chain Fatty Acids by the Gut Microbiota and Their Impact on Human Metabolism. Gut Microbes 2016, 7, 189–200. [Google Scholar] [CrossRef]
- Goya-Jorge, E.; Gonza, I.; Bondue, P.; Douny, C.; Taminiau, B.; Daube, G.; Scippo, M.-L.; Delcenserie, V. Human Adult Microbiota in a Static Colon Model: AhR Transcriptional Activity at the Crossroads of Host–Microbe Interaction. Foods 2022, 11, 1946. [Google Scholar] [CrossRef]
- Marinelli, L.; Martin-Gallausiaux, C.; Bourhis, J.-M.; Béguet-Crespel, F.; Blottière, H.M.; Lapaque, N. Identification of the Novel Role of Butyrate as AhR Ligand in Human Intestinal Epithelial Cells. Sci. Rep. 2019, 9, 643. [Google Scholar] [CrossRef]
- Modoux, M.; Rolhion, N.; Lefevre, J.H.; Oeuvray, C.; Nádvorník, P.; Illes, P.; Emond, P.; Parc, Y.; Mani, S.; Dvorak, Z.; et al. Butyrate Acts through HDAC Inhibition to Enhance Aryl Hydrocarbon Receptor Activation by Gut Microbiota-Derived Ligands. Gut Microbes 2022, 14, 2105637. [Google Scholar] [CrossRef]
- Louis, P.; Flint, H.J. Formation of Propionate and Butyrate by the Human Colonic Microbiota. Environ. Microbiol. 2017, 19, 29–41. [Google Scholar] [CrossRef]
- Reichardt, N.; Duncan, S.H.; Young, P.; Belenguer, A.; McWilliam Leitch, C.; Scott, K.P.; Flint, H.J.; Louis, P. Phylogenetic Distribution of Three Pathways for Propionate Production within the Human Gut Microbiota. ISME J. 2014, 8, 1323–1335. [Google Scholar] [CrossRef]
- Horvath, T.D.; Ihekweazu, F.D.; Haidacher, S.J.; Ruan, W.; Engevik, K.A.; Fultz, R.; Hoch, K.M.; Luna, R.A.; Oezguen, N.; Spinler, J.K.; et al. Bacteroides Ovatus Colonization Influences the Abundance of Intestinal Short Chain Fatty Acids and Neurotransmitters. iScience 2022, 25, 104158. [Google Scholar] [CrossRef]
- Bortolussi, R.; Ferrier, P. Protection against Escherichia coli K1 Infection in Newborn Rats by Antibody to K1 Capsular Polysaccharide Antigen. Infect. Immun. 1980, 28, 111–117. [Google Scholar] [CrossRef]
- Delannoy, S.; Beutin, L.; Mariani-Kurkdjian, P.; Fleiss, A.; Bonacorsi, S.; Fach, P. The Escherichia coli Serogroup O1 and O2 Lipopolysaccharides Are Encoded by Multiple O-Antigen Gene Clusters. Front. Cell. Infect. Microbiol. 2017, 7, 30. [Google Scholar] [CrossRef]
- Van Twest, R.; Kropinski, A.M. Bacteriophage Enrichment from Water and Soil. In Bacteriophages: Methods and Protocols, Volume 1: Isolation, Characterization, and Interactions; Clokie, M.R.J., Kropinski, A.M., Eds.; Methods in Molecular BiologyTM; Humana Press: Totowa, NJ, USA, 2009; pp. 15–21. ISBN 978-1-60327-164-6. [Google Scholar]
- Van den Abbeele, P.; Grootaert, C.; Marzorati, M.; Possemiers, S.; Verstraete, W.; Gérard, P.; Rabot, S.; Bruneau, A.; El Aidy, S.; Derrien, M.; et al. Microbial Community Development in a Dynamic Gut Model Is Reproducible, Colon Region Specific, and Selective for Bacteroidetes and Clostridium Cluster IX. Appl. Environ. Microbiol. 2010, 76, 5237–5246. [Google Scholar] [CrossRef]
- Van de Wiele, T.; den Abbeele, P.V.; Ossieur, W.; Possemiers, S.; Marzorati, M. The Simulator of the Human Intestinal Microbial Ecosystem (SHIME®). In The Impact of Food Bioactives on Health: In Vitro and Ex Vivo Models [Internet]; Springer: Berlin/Heidelberg, Germany, 2015. [Google Scholar]
- Bacchetti De Gregoris, T.; Aldred, N.; Clare, A.S.; Burgess, J.G. Improvement of Phylum- and Class-Specific Primers for Real-Time PCR Quantification of Bacterial Taxa. J. Microbiol. Methods 2011, 86, 351–356. [Google Scholar] [CrossRef]
- Penders, J.; Vink, C.; Driessen, C.; London, N.; Thijs, C.; Stobberingh, E.E. Quantification of Bifidobacterium Spp., Escherichia coli and Clostridium Difficile in Faecal Samples of Breast-Fed and Formula-Fed Infants by Real-Time PCR. FEMS Microbiol. Lett. 2005, 243, 141–147. [Google Scholar] [CrossRef]
- Everard, A.; Belzer, C.; Geurts, L.; Ouwerkerk, J.P.; Druart, C.; Bindels, L.B.; Guiot, Y.; Derrien, M.; Muccioli, G.G.; Delzenne, N.M.; et al. Cross-Talk between Akkermansia Muciniphila and Intestinal Epithelium Controls Diet-Induced Obesity. Proc. Natl. Acad. Sci. USA 2013, 110, 9066–9071. [Google Scholar] [CrossRef]
- Luo, Y.; Lan, C.; Li, H.; Ouyang, Q.; Kong, F.; Wu, A.; Ren, Z.; Tian, G.; Cai, J.; Yu, B.; et al. Rational Consideration of Akkermansia Muciniphila Targeting Intestinal Health: Advantages and Challenges. npj Biofilms Microbiomes 2022, 8, 81. [Google Scholar] [CrossRef]
- Xue, C.; Li, G.; Gu, X.; Su, Y.; Zheng, Q.; Yuan, X.; Bao, Z.; Lu, J.; Li, L. Health and Disease: Akkermansia Muciniphila, the Shining Star of the Gut Flora. Research 2023, 6, 0107. [Google Scholar] [CrossRef]
- Livak, K.J.; Schmittgen, T.D. Analysis of Relative Gene Expression Data Using Real-Time Quantitative PCR and the 2(-Delta Delta C(T)) Method. Methods 2001, 25, 402–408. [Google Scholar] [CrossRef]
- Douny, C.; Dufourny, S.; Brose, F.; Verachtert, P.; Rondia, P.; Lebrun, S.; Marzorati, M.; Everaert, N.; Delcenserie, V.; Scippo, M.-L. Development of an Analytical Method to Detect Short-Chain Fatty Acids by SPME-GC-MS in Samples Coming from an in Vitro Gastrointestinal Model. J. Chromatogr. B Anal. Technol. Biomed. Life Sci. 2019, 1124, 188–196. [Google Scholar] [CrossRef] [PubMed]
- Mosmann, T. Rapid Colorimetric Assay for Cellular Growth and Survival: Application to Proliferation and Cytotoxicity Assays. J. Immunol. Methods 1983, 65, 55–63. [Google Scholar] [CrossRef] [PubMed]
- Goya-Jorge, E.; Rampal, C.; Loones, N.; Barigye, S.J.; Carpio, L.E.; Gozalbes, R.; Ferroud, C.; Sylla-Iyarreta Veitía, M.; Giner, R.M. Targeting the Aryl Hydrocarbon Receptor with a Novel Set of Triarylmethanes. Eur. J. Med. Chem. 2020, 207, 112777. [Google Scholar] [CrossRef] [PubMed]
Disclaimer/Publisher’s Note: The statements, opinions and data contained in all publications are solely those of the individual author(s) and contributor(s) and not of MDPI and/or the editor(s). MDPI and/or the editor(s) disclaim responsibility for any injury to people or property resulting from any ideas, methods, instructions or products referred to in the content. |
© 2023 by the authors. Licensee MDPI, Basel, Switzerland. This article is an open access article distributed under the terms and conditions of the Creative Commons Attribution (CC BY) license (https://creativecommons.org/licenses/by/4.0/).