
Healthy Tissue Damage Following Cancer Ion Therapy: A Radiobiological Database Predicting Lymphocyte Chromosome Aberrations Based on the BIANCA Biophysical Model

 and
and 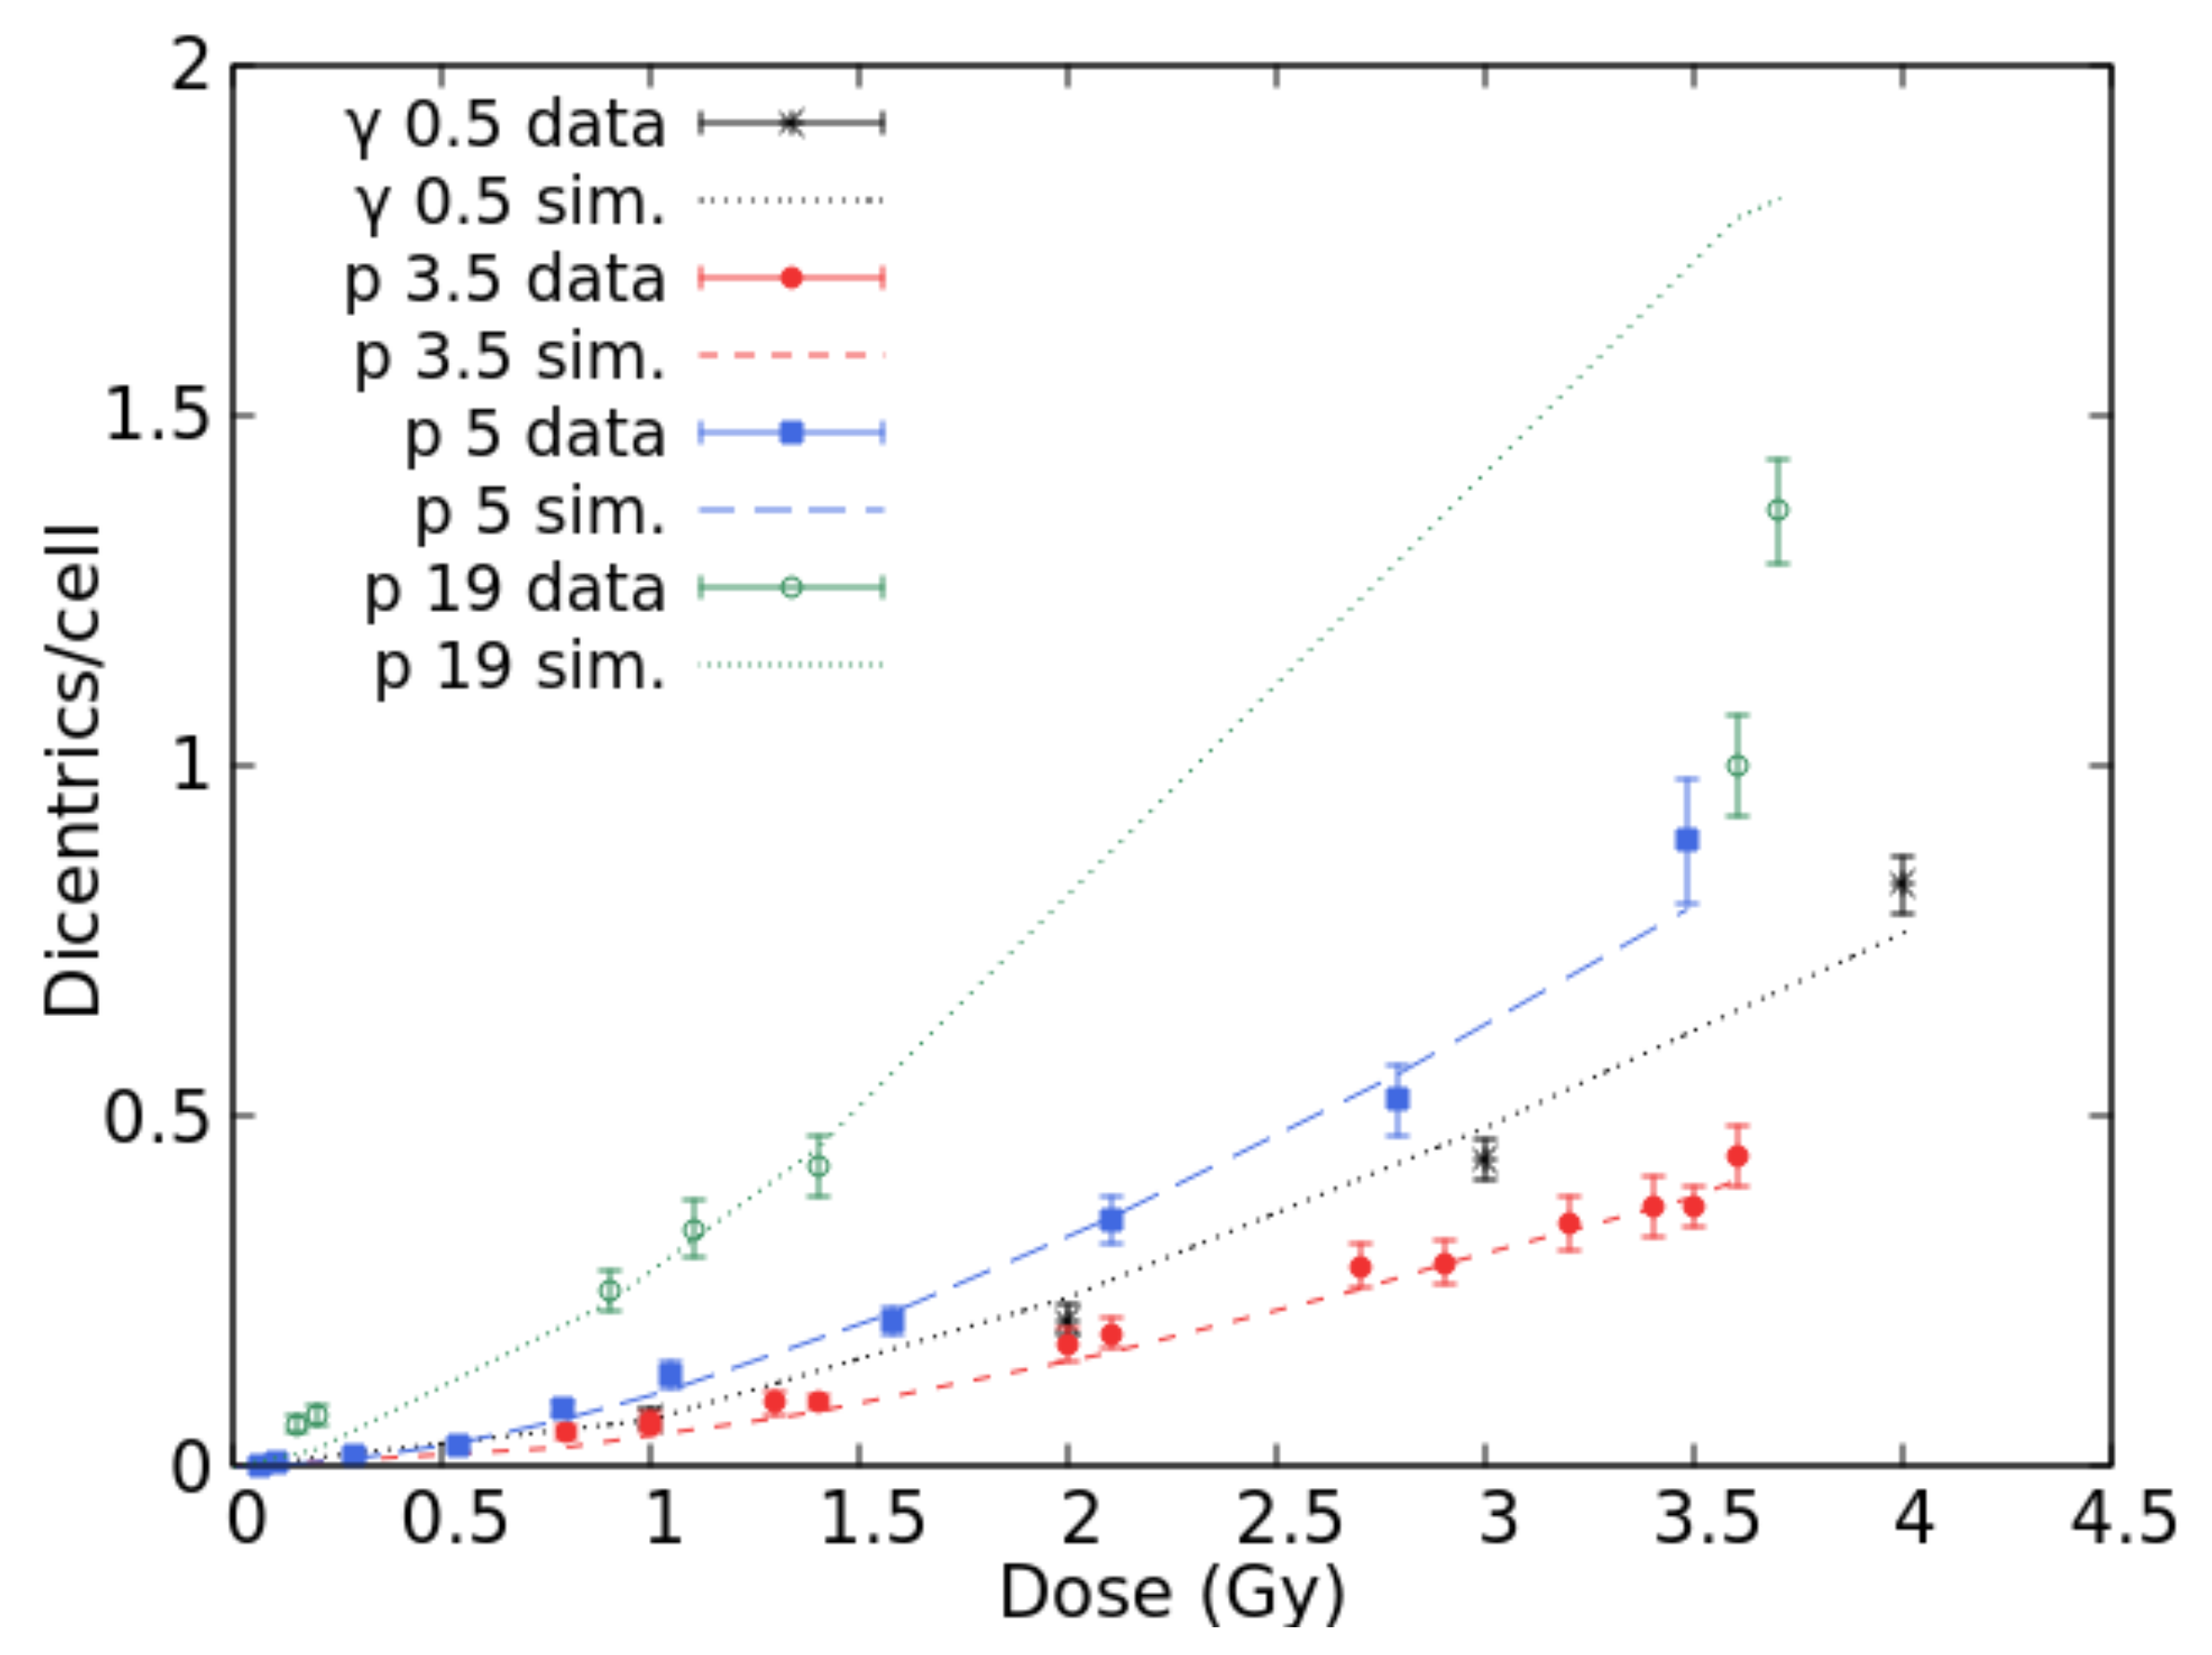
Abstract
1. Introduction
2. Results and Discussion
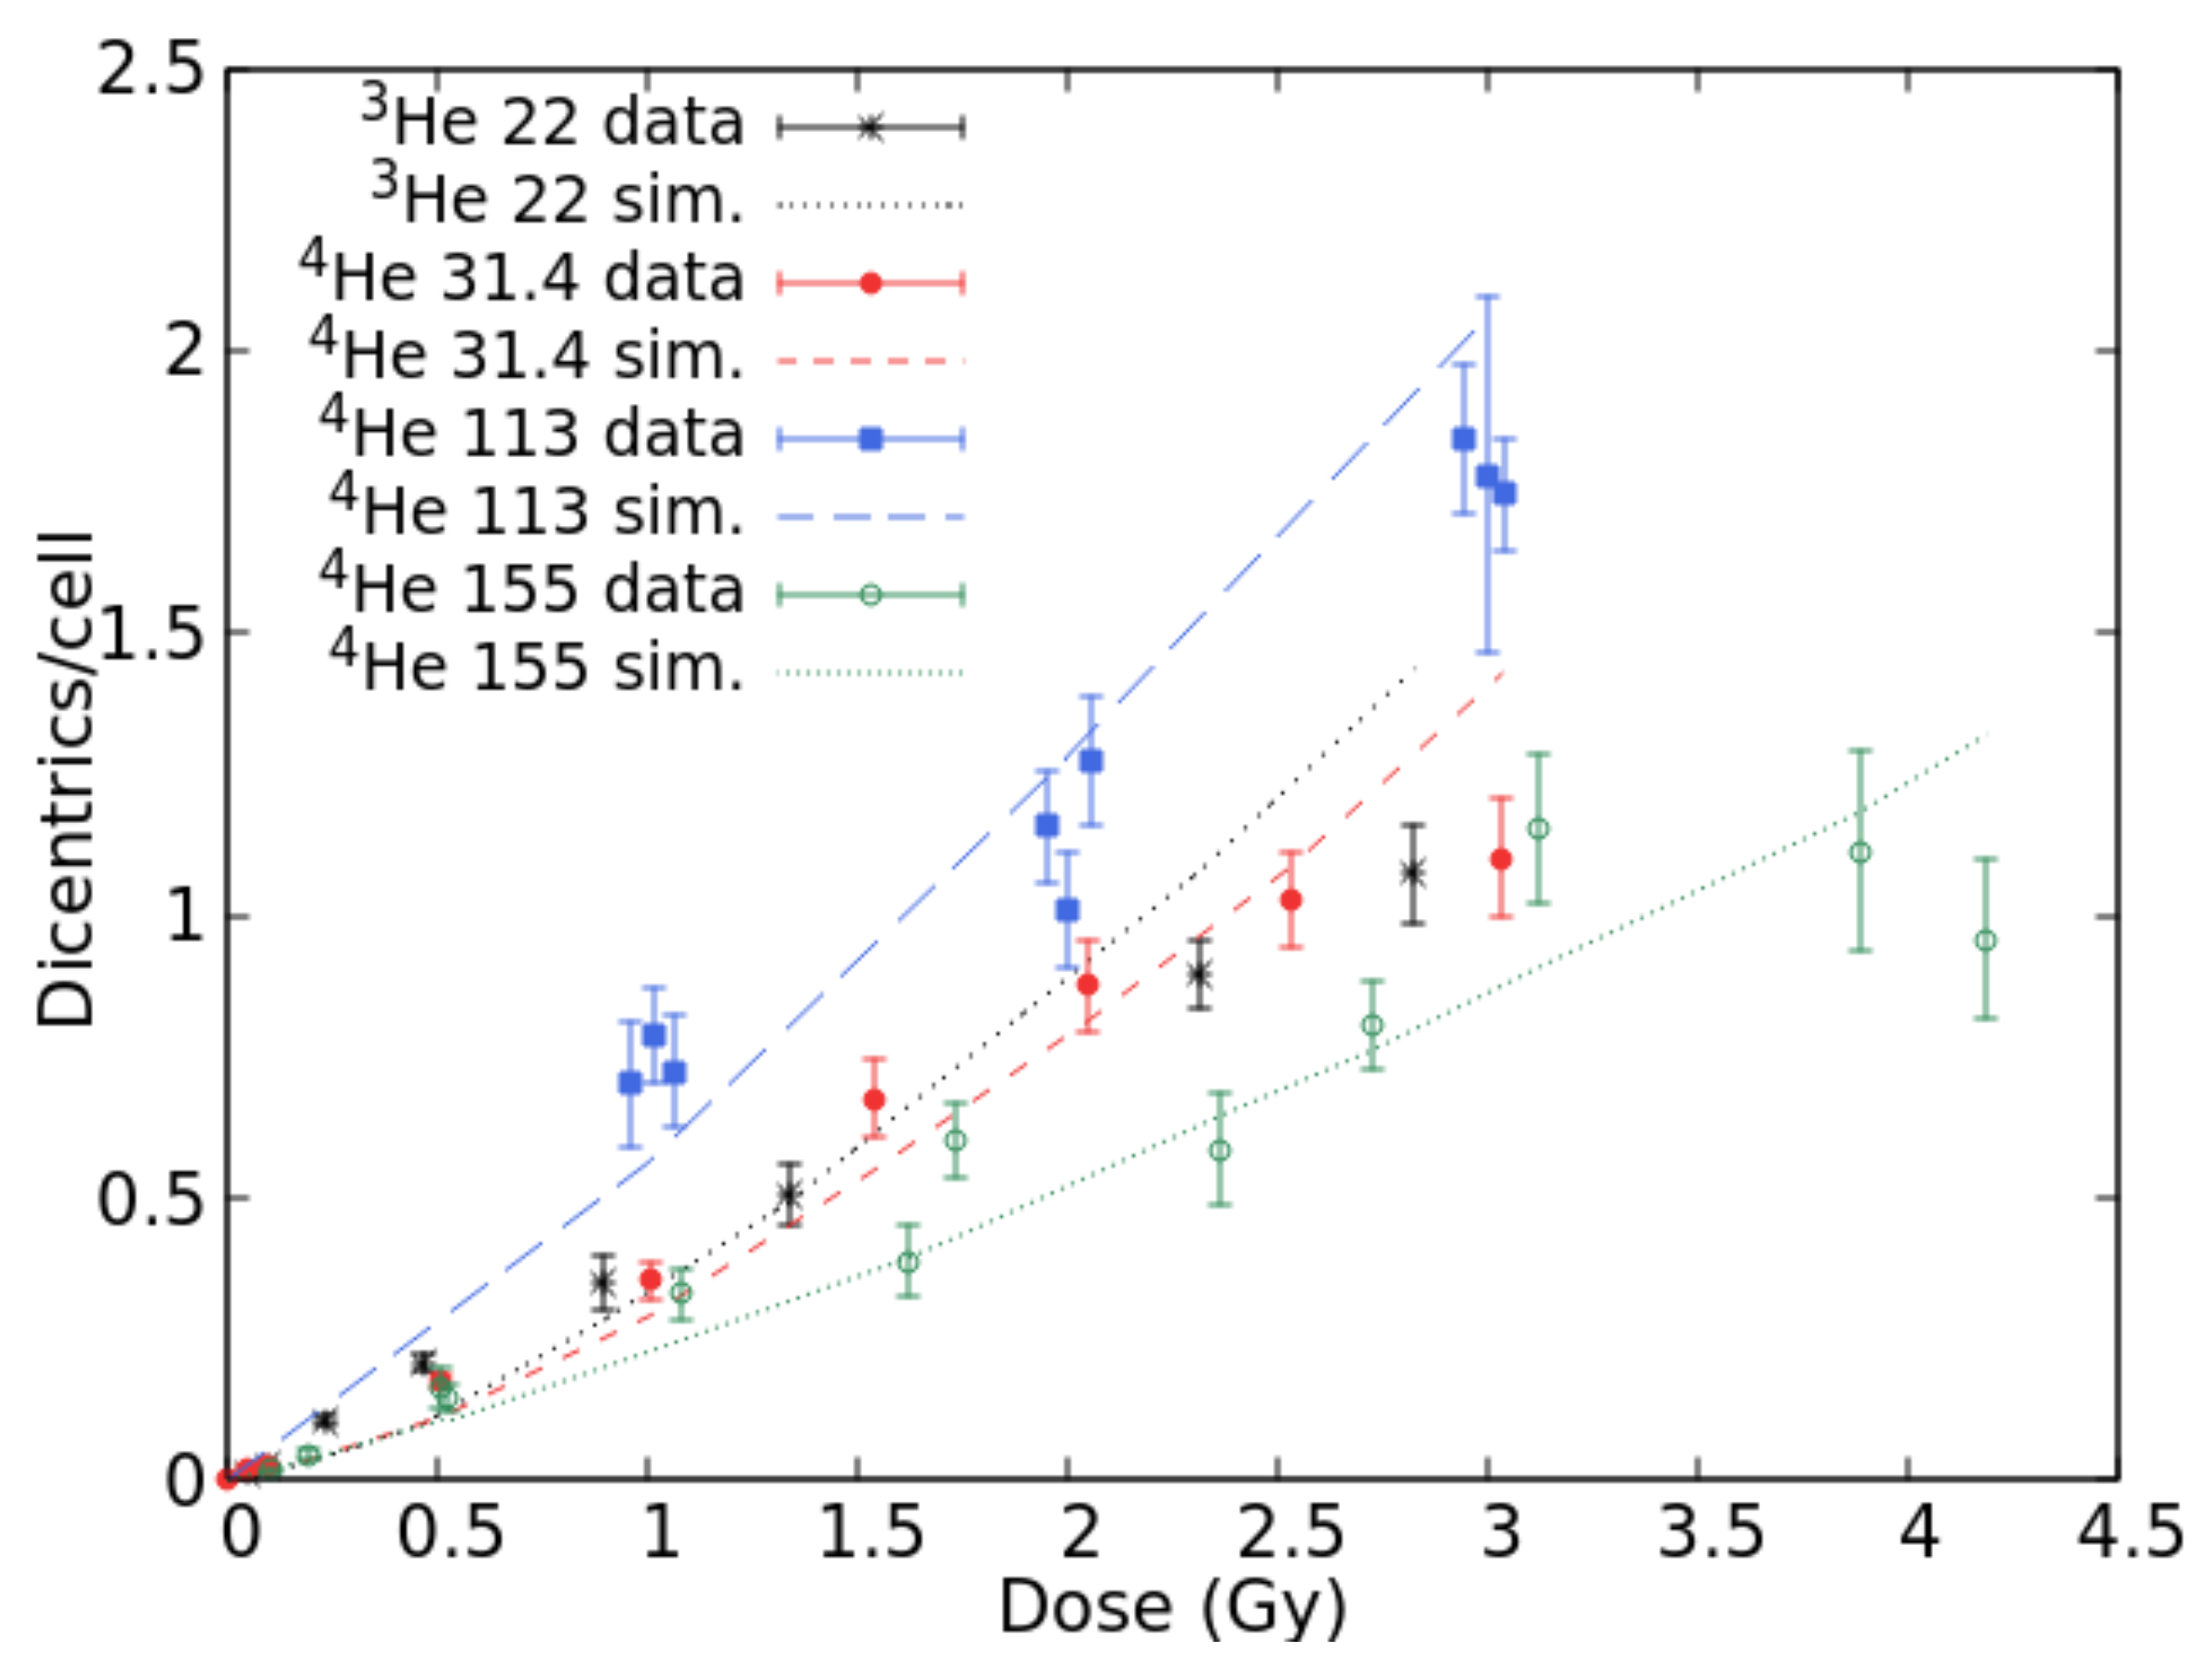
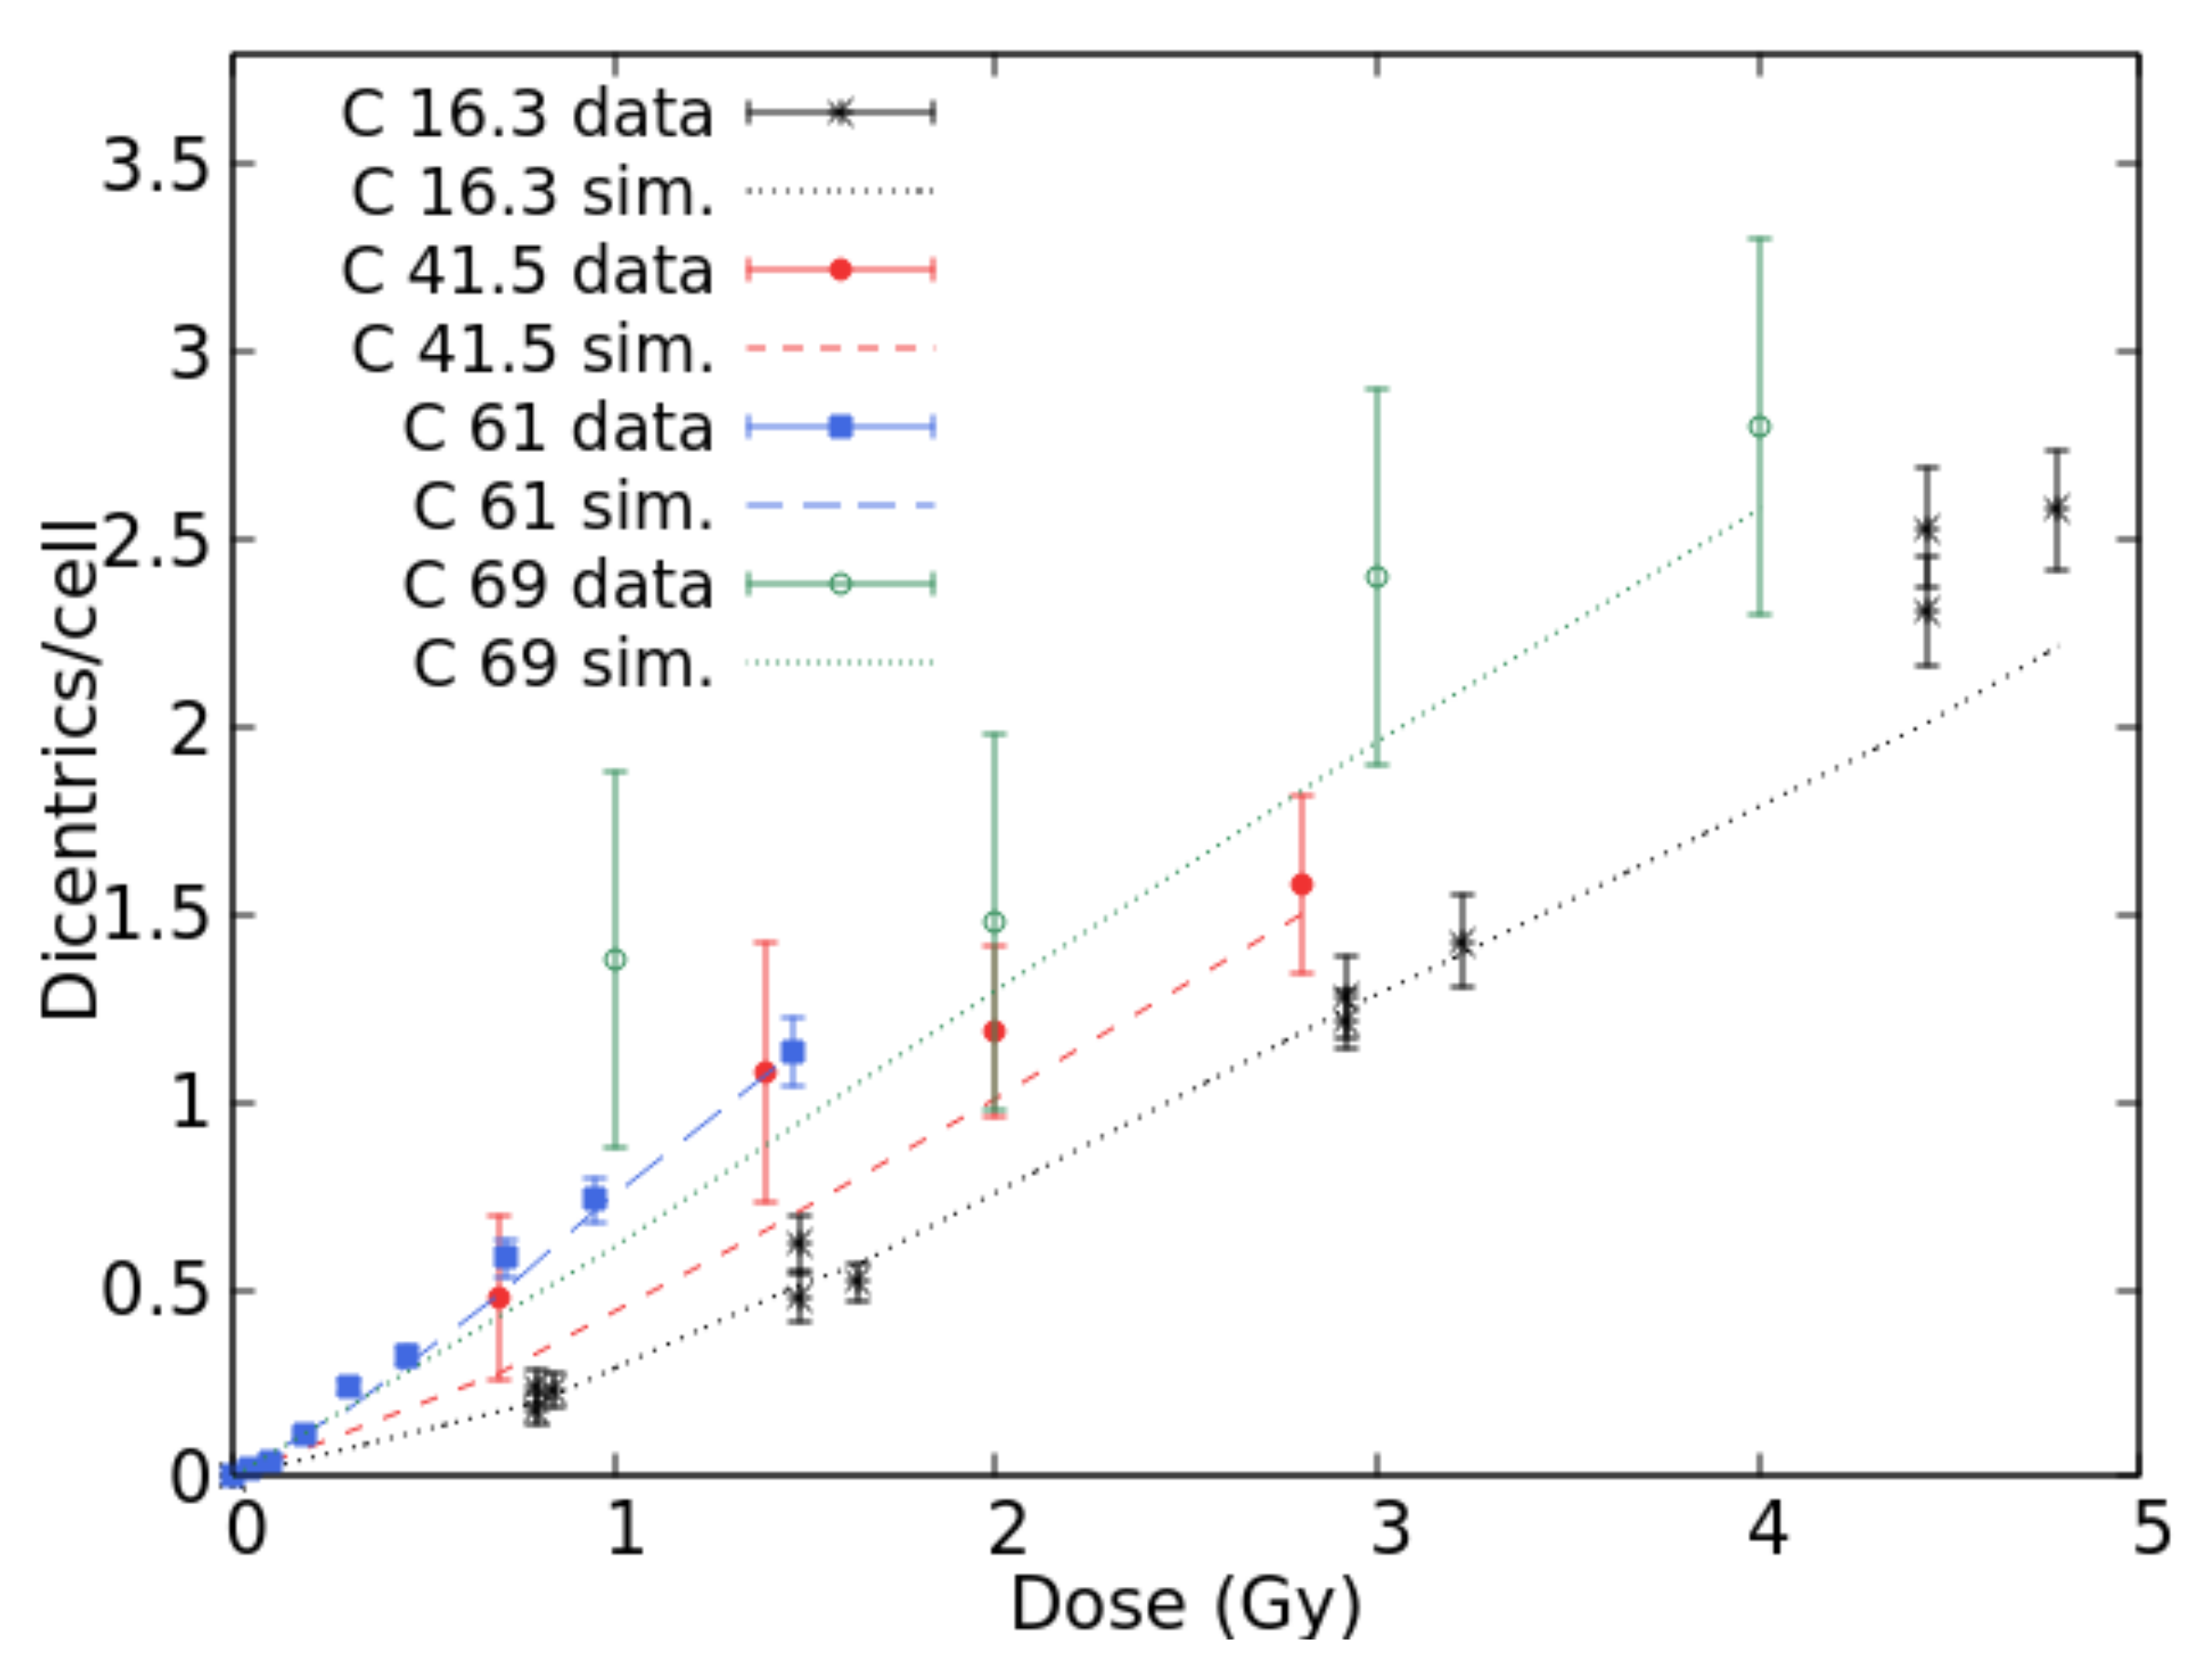
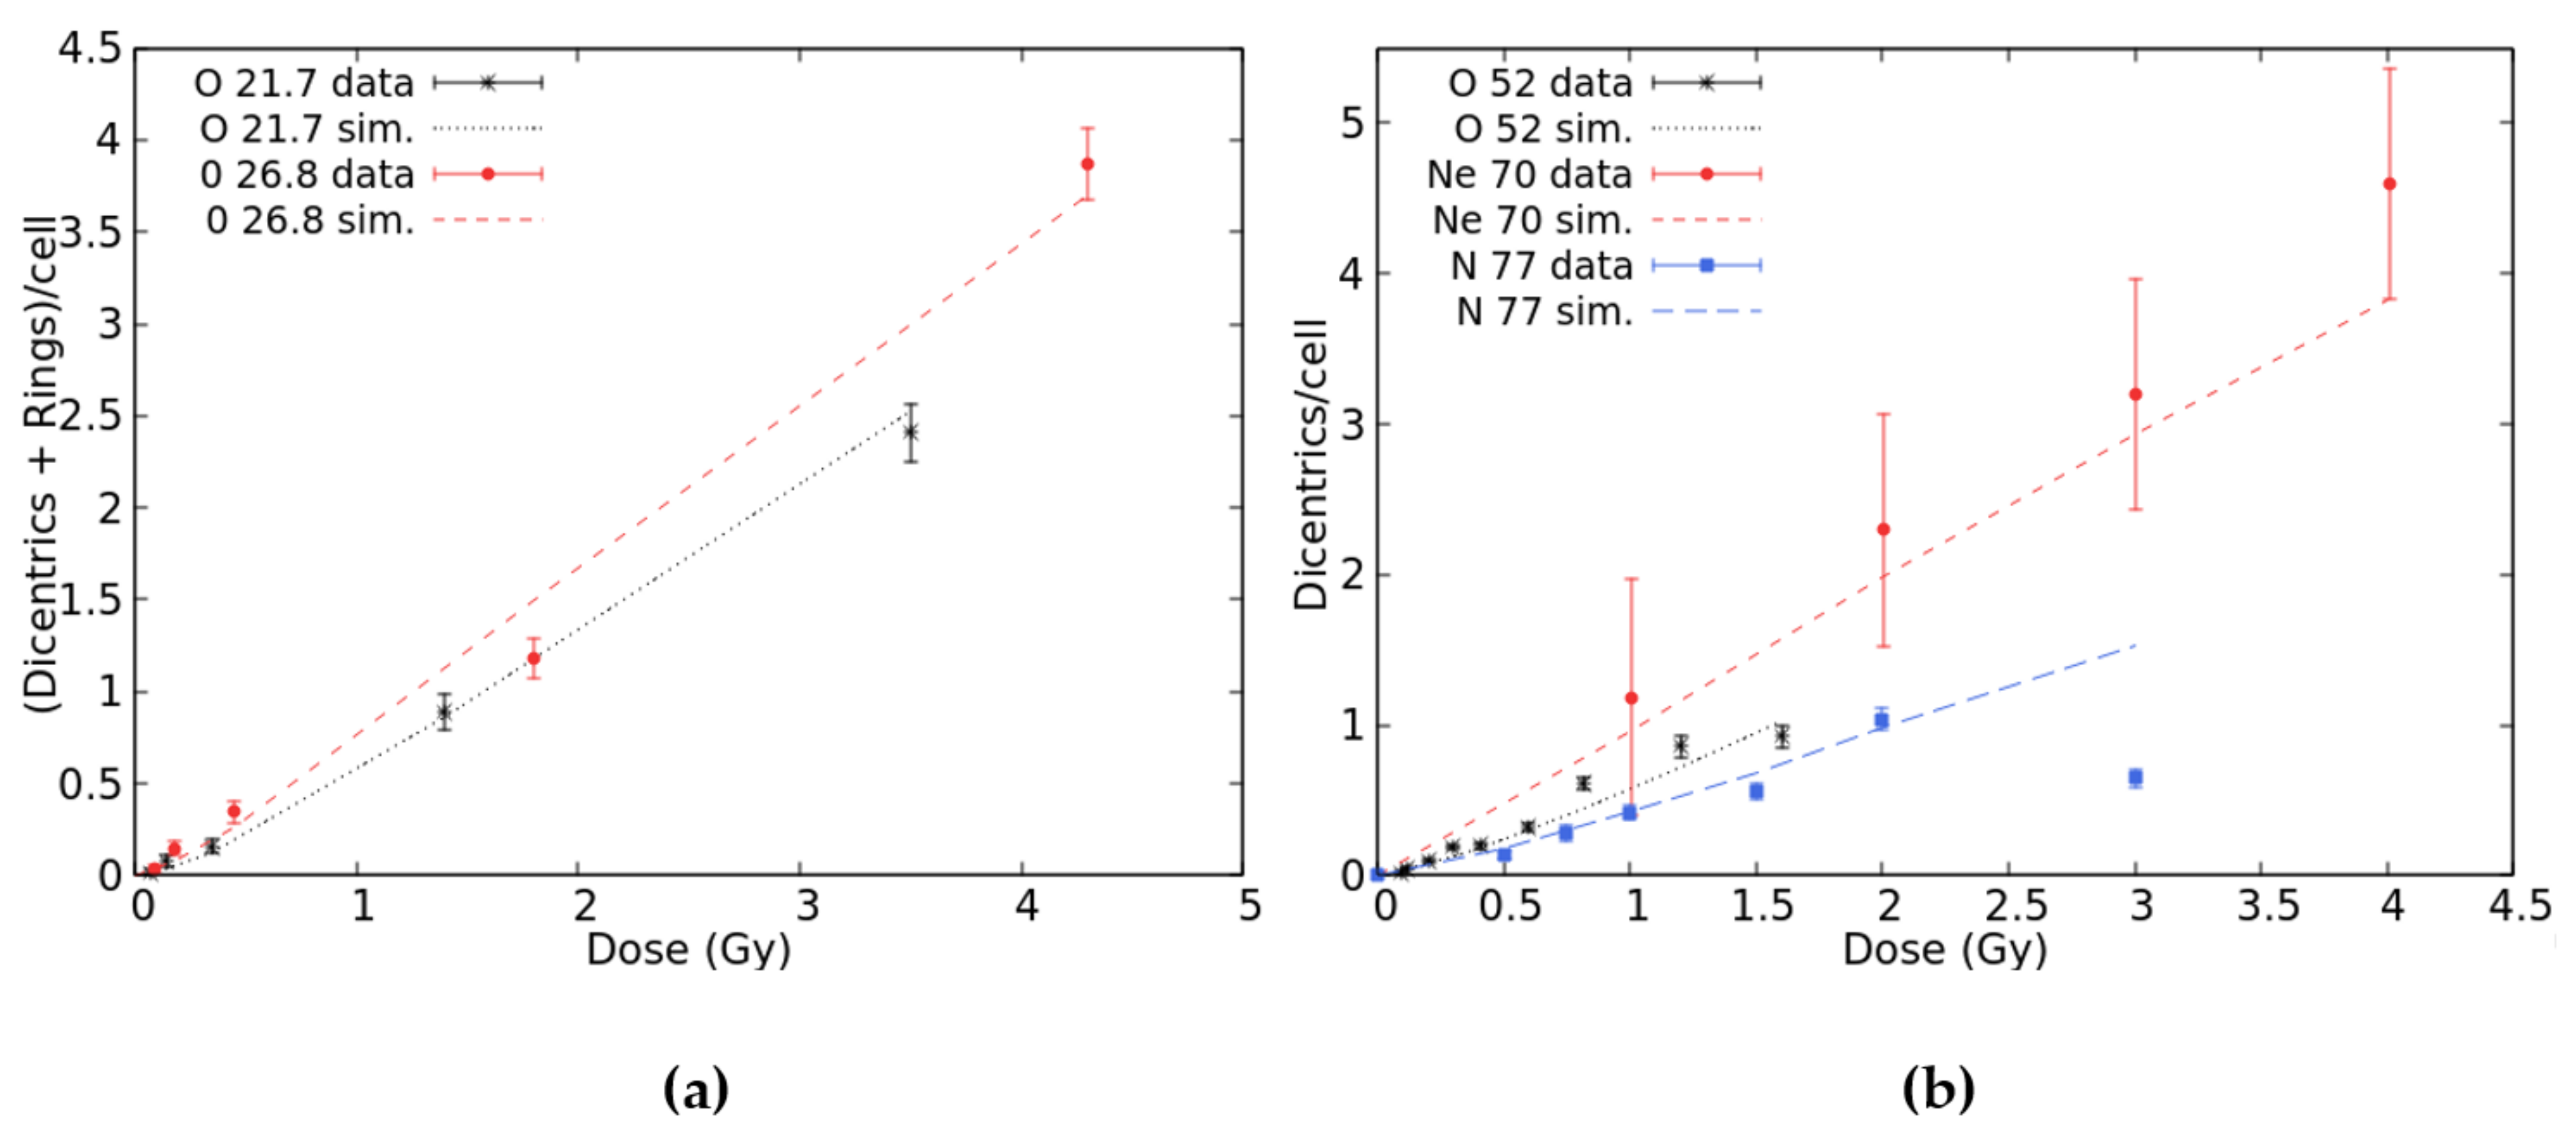
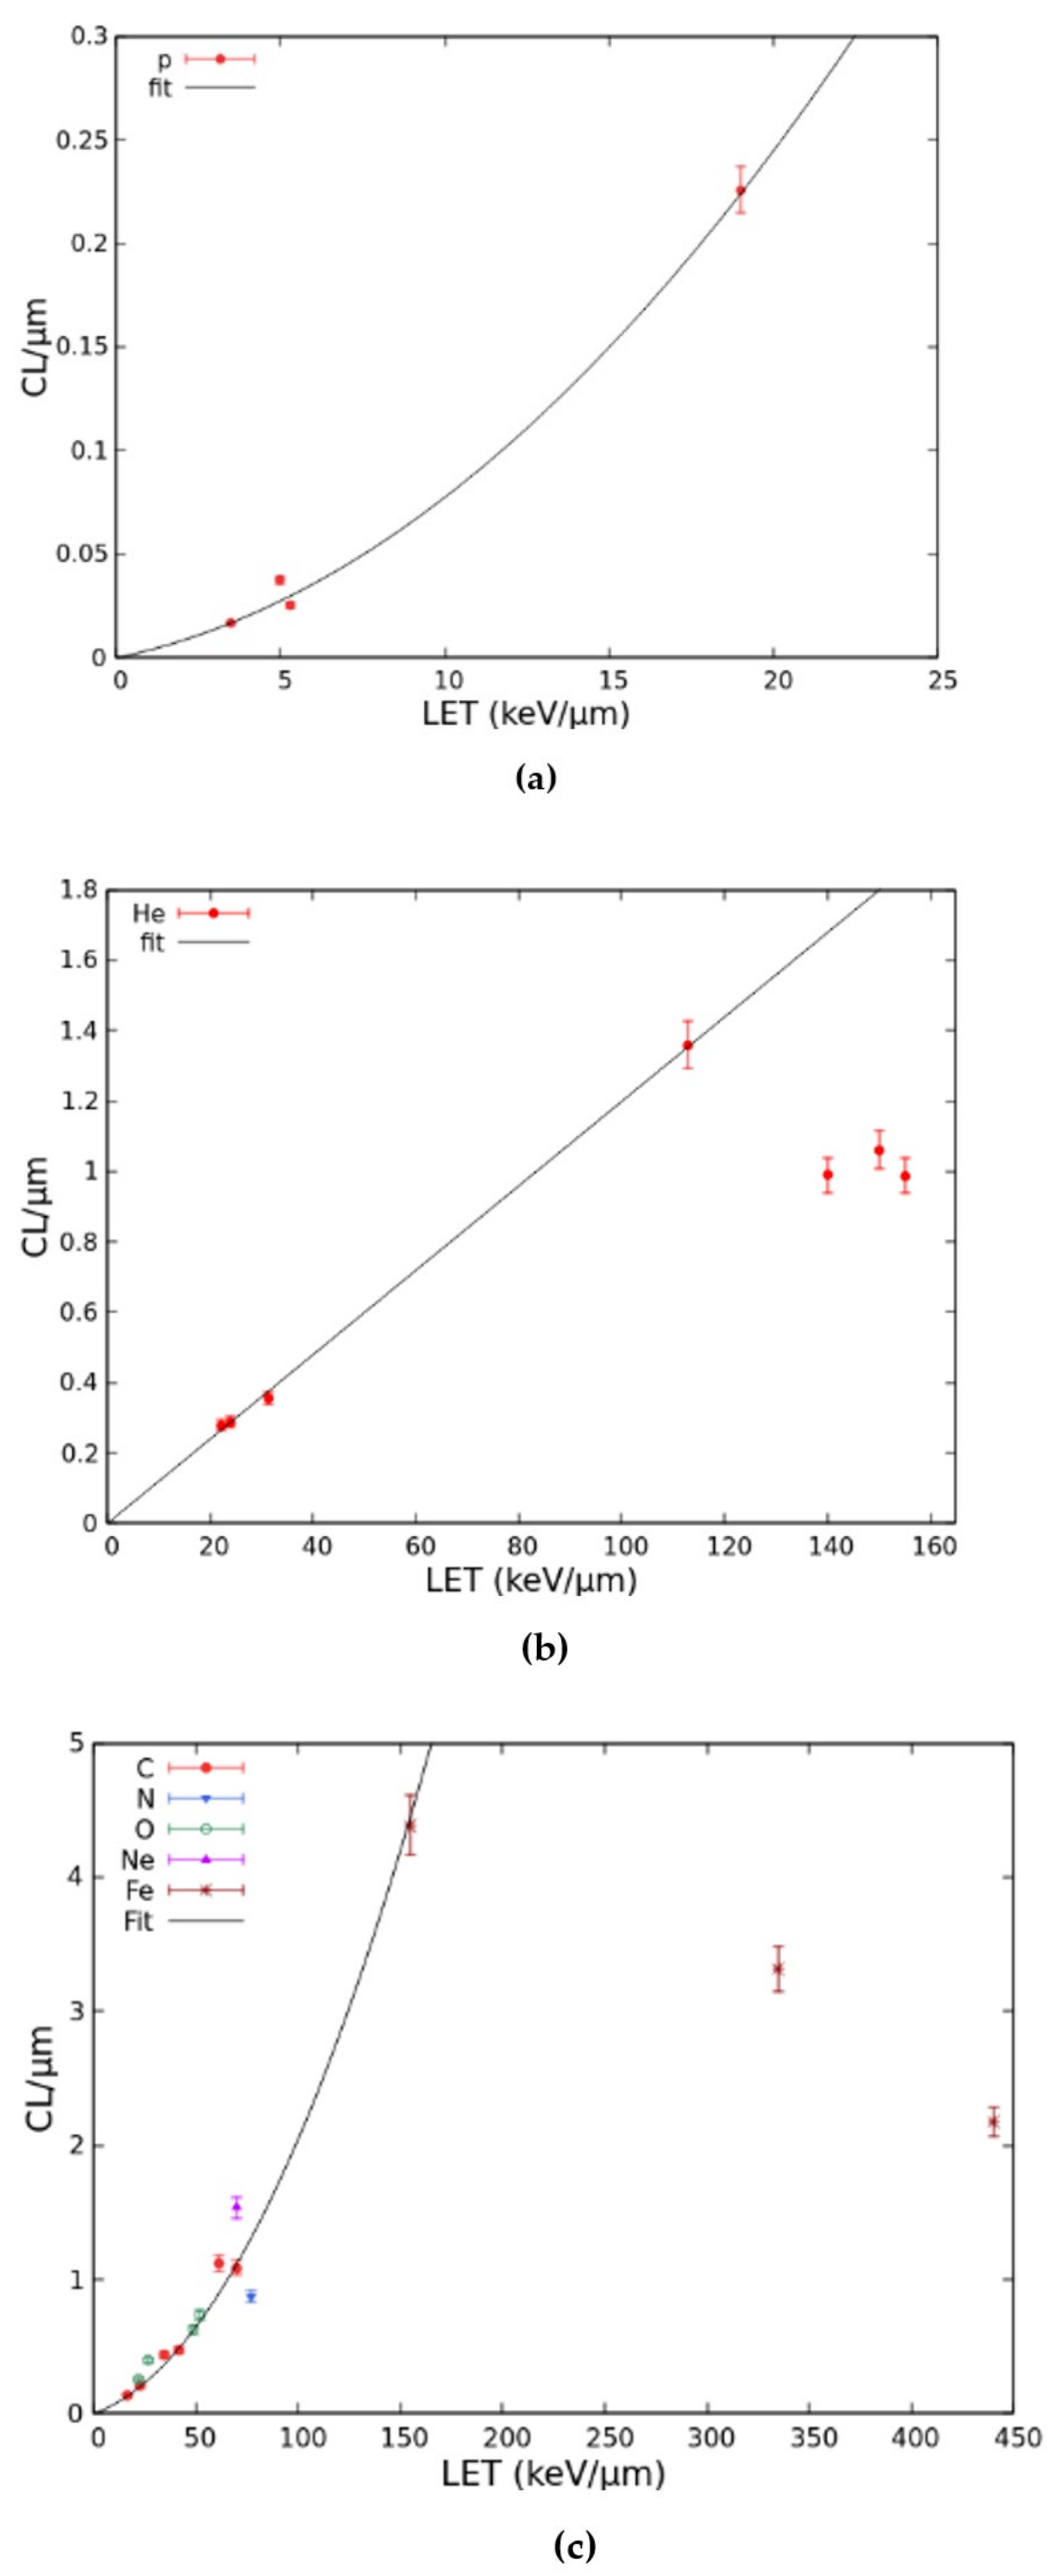
2.1. Benchmark with Experimental Data and Development of the Radiobiological Database
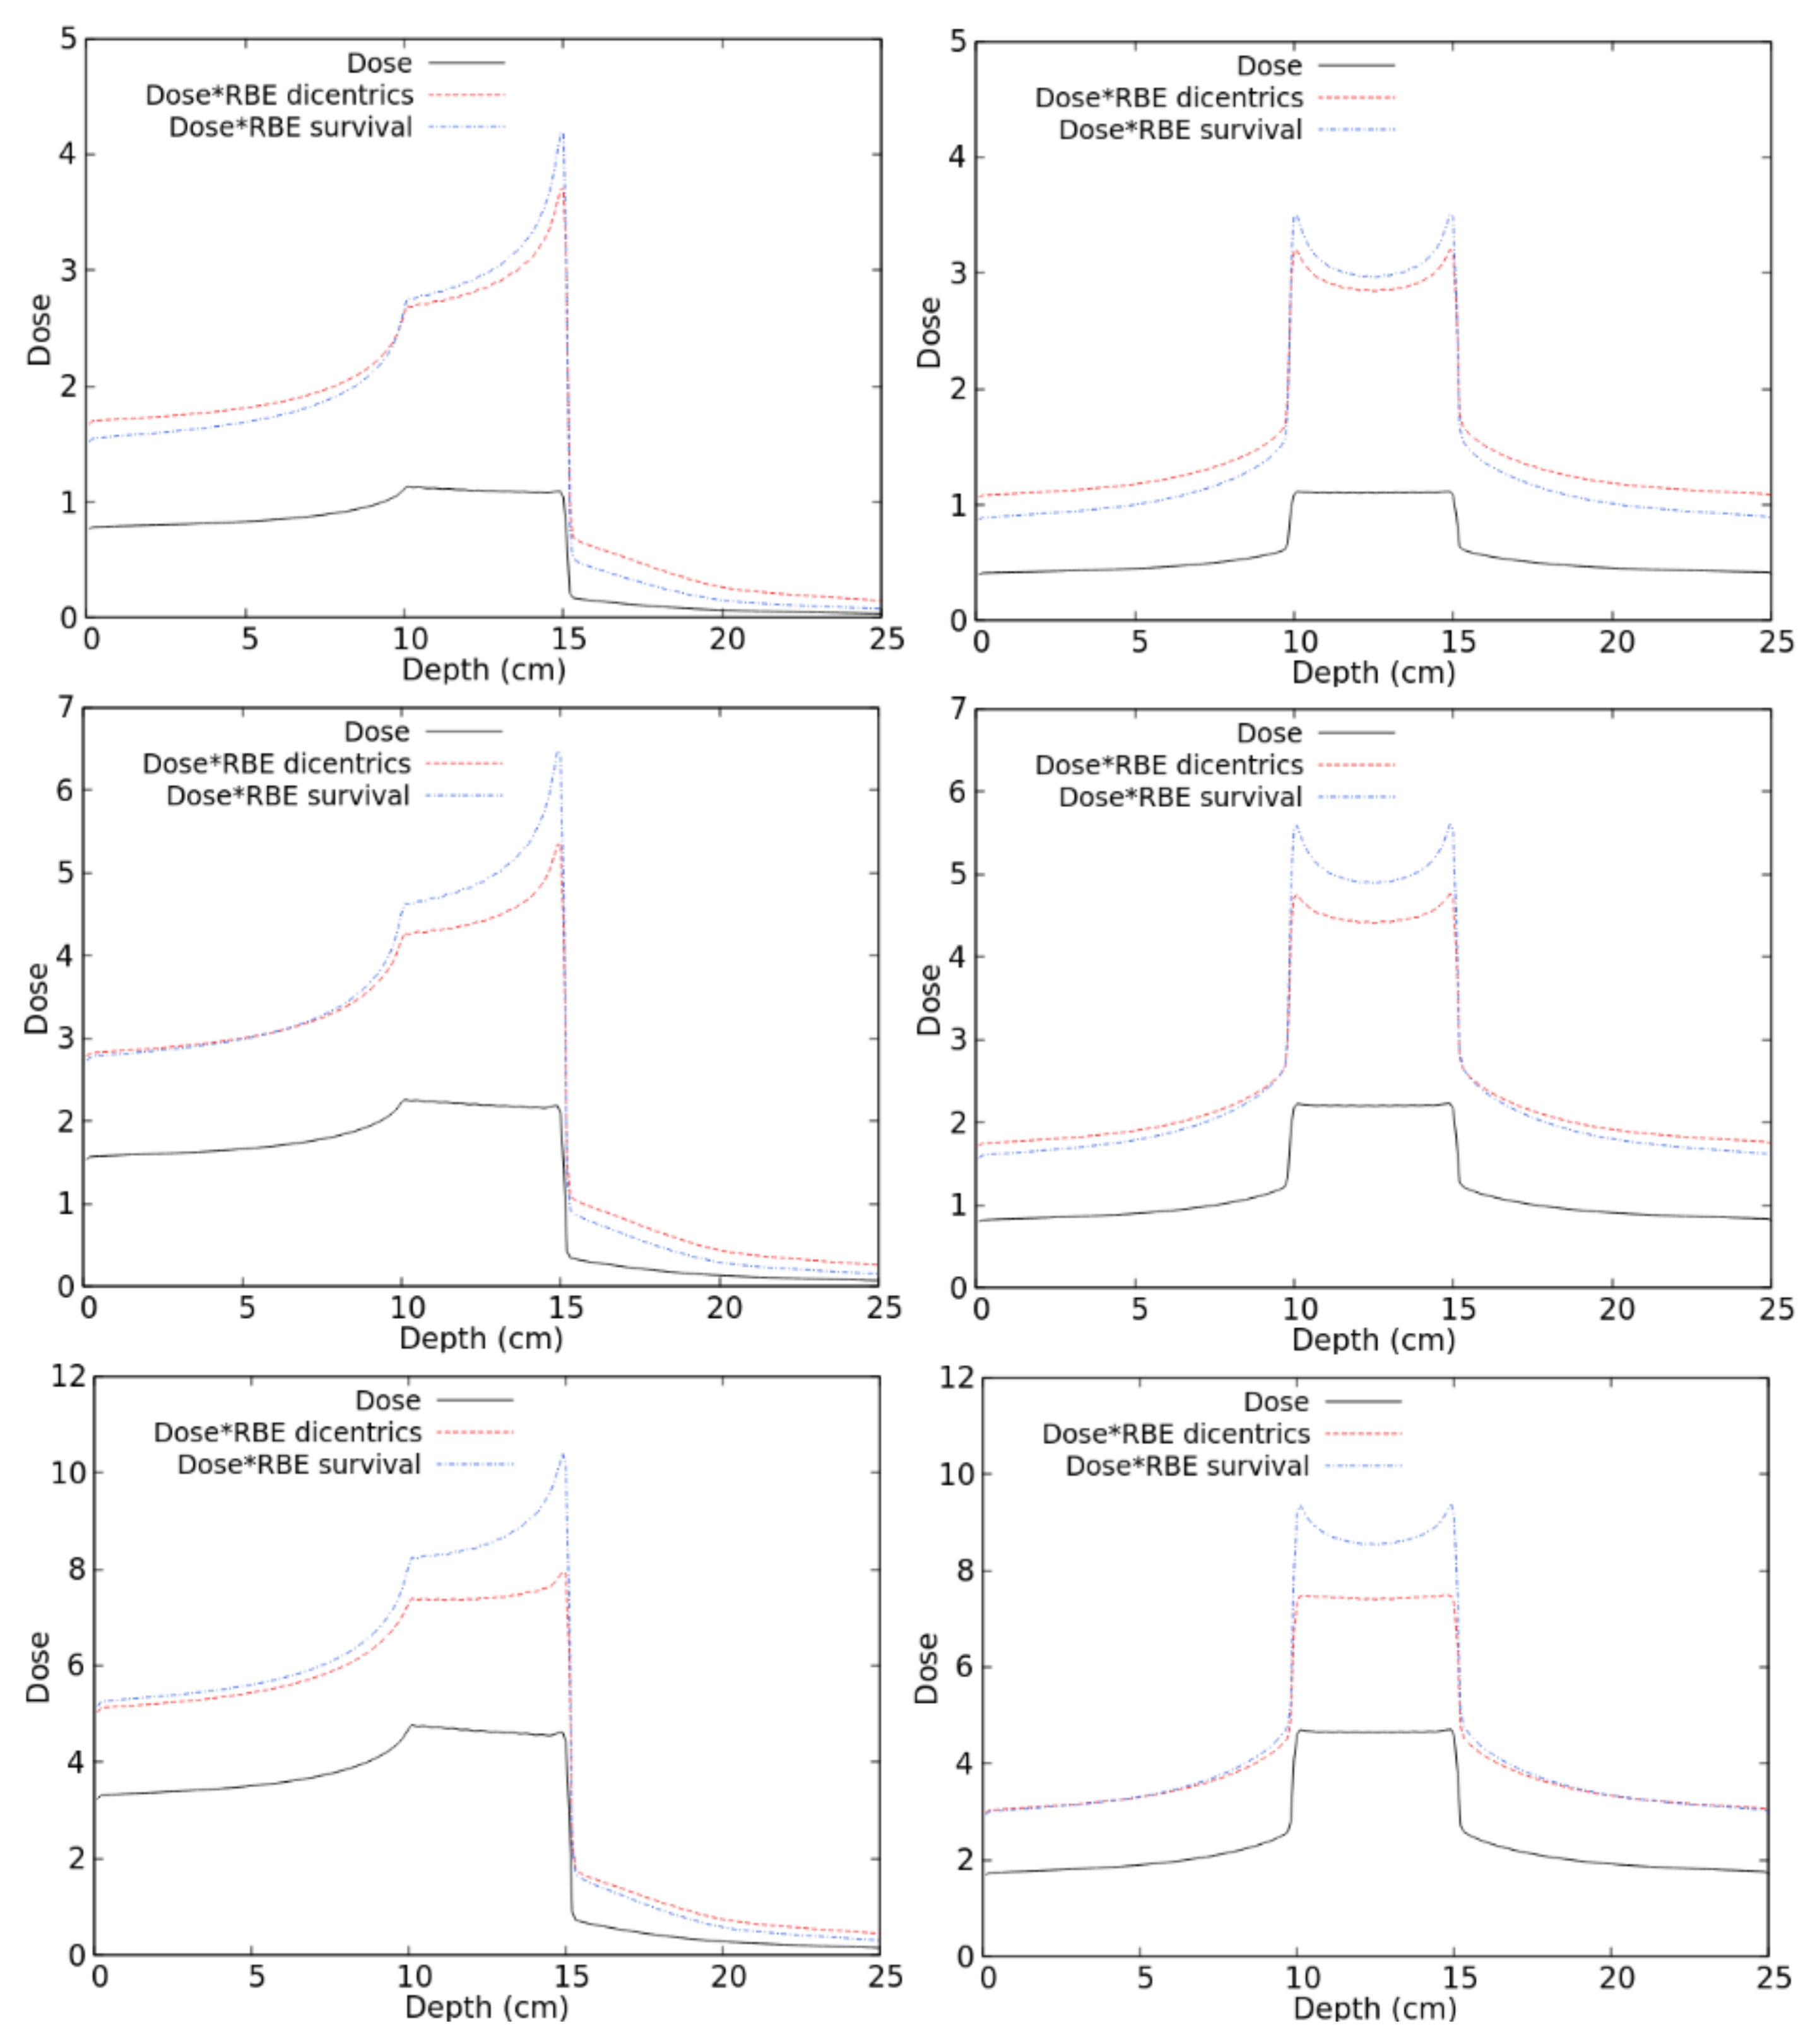
2.2. RBE Evaluation for Therapeutic-Like Carbon Beams
3. Materials and Methods
3.1. General Aspects of the Model
3.2. Reproduction of Experimental Dose–Response Curves for PBL Dicentrics
3.3. Interface with the FLUKA Code
4. Conclusions
Author Contributions
Funding
Institutional Review Board Statement
Informed Consent Statement
Data Availability Statement
Conflicts of Interest
References
- Durante, M.; Yamada, S.; Ando, K.; Furusawa, Y.; Kawata, T.; Majima, H.; Nakano, T.; Tsujii, H. X-rays vs. carbon-ion tumor therapy: Cytogenetic damage in lymphocytes. Int. J. Radiat. Oncol. 2000, 47, 793–798. [Google Scholar] [CrossRef]
- Ekstrand, K.E.; Raben, M.; Dixon, R.L.; Raben, S.P. The calculation of the dose to lymphocytes in external beam radiation therapy. Radiat. Res. 1981, 85, 399–407. [Google Scholar] [CrossRef]
- Kolb, H.-J. Bone marrow morbidity of radiotherapy. In Complications of Cancer Management; Butterworth-Neineman: Oxford, UK, 1991; pp. 398–410. [Google Scholar]
- Allan, J.; Travis, L.B. Mechanisms of therapy-related carcinogenesis. Nat. Rev. Cancer 2005, 5, 943–955. [Google Scholar] [CrossRef] [PubMed]
- Rabbitts, T. Chromosomal translocations in human cancer. Nat. Cell Biol. 1994, 372, 143–149. [Google Scholar] [CrossRef]
- Ballarini, F.; Ottolenghi, A. A model of chromosome aberration induction and chronic myeloid leukaemia incidence at low doses. Radiat. Environ. Biophys. 2004, 43, 165–171. [Google Scholar] [CrossRef] [PubMed]
- Bonassi, S.; Hagmar, L.; Strömberg, U.; Montagud, A.H.; Tinnerberg, H.; Forni, A.; Heikkilä, P.; Wanders, S.; Wilhardt, P.; Hansteen, I.-L.; et al. Chromosomal aberrations in lymphocytes predict human cancer independently of exposure to carcinogens. Cancer Res. 2000, 60, 1619–1625. [Google Scholar]
- Bonassi, S.; Norppa, H.; Ceppi, M.; Strömberg, U.; Vermeulen, R.; Znaor, A.; Cebulska-Wasilewska, A.; Fabianova, E.; Fucic, A.; Gundy, S.; et al. Chromosomal aberration frequency in lymphocytes predicts the risk of cancer: Results from a pooled cohort study of 22 358 subjects in 11 countries. Carcinogenesis 2008, 29, 1178–1183. [Google Scholar] [CrossRef] [PubMed]
- Ballarini, F.; Ottolenghi, A. Chromosome aberrations as biomarkers of radiation exposure: Modelling basic mechanisms. Adv. Space Res. 2003, 31, 1557–1568. [Google Scholar] [CrossRef]
- Ballarini, F.; Ottolenghi, A. A model of chromosome aberration induction: Applications to space research. Radiat. Res. 2005, 164, 567–570. [Google Scholar] [CrossRef] [PubMed]
- Lee, R.; Yamada, S.; Yamamoto, N.; Miyamoto, T.; Ando, K.; Durante, M.; Tsujii, H. Chromosomal aberrations in lymphocytes of lung cancer patients treated with carbon ions. J. Radiat. Res. 2004, 45, 195–199. [Google Scholar] [CrossRef] [PubMed][Green Version]
- Hartel, C.; Nikoghosyan, A.; Durante, M.; Sommer, S.; Nasonova, E.; Fournier, C.; Lee, R.; Debus, J.; Schulz-Ertner, D.; Ritter, S. Chromosomal aberrations in peripheral blood lymphocytes of prostate cancer patients treated with IMRT and carbon ions. Radiother. Oncol. 2010, 95, 73–78. [Google Scholar] [CrossRef] [PubMed]
- Aiginger, H.; Andersen, V.; Ballarini, F.; Battistoni, G.; Campanella, M.; Carboni, M.; Cerutti, F.; Empl, A.; Enghardt, W.; Fassò, A.; et al. The FLUKA code: New developments and application to 1GeV/n iron beams. Adv. Space Res. 2005, 35, 214–222. [Google Scholar] [CrossRef] [PubMed]
- Battistoni, G.; Bauer, J.; Boehlen, T.T.; Cerutti, F.; Chin, M.P.W.; Augusto, R.D.S.; Ferrari, A.; Ortega, P.G.; Kozlowska, W.S.; Magro, G.; et al. The FLUKA code: An accurate simulation tool for particle therapy. Front. Oncol. 2016, 6, 116. [Google Scholar] [CrossRef] [PubMed]
- Kozłowska, W.S.; Böhlen, T.T.; Cuccagna, C.; Ferrari, A.; Fracchiolla, F.; Magro, G.; Mairani, A.; Schwarz, M.; Vlachoudis, V.; Georg, D. FLUKA particle therapy tool for Monte Carlo independent calculation of scanned proton and carbon ion beam therapy. Phys. Med. Biol. 2019, 64, 075012. [Google Scholar] [CrossRef]
- Bohlen, T.T.; Cerutti, F.; Chin, M.P.W.; Fassò, A.; Ferrari, A.; Ortega, P.G.; Mairani, A.; Sala, P.R.; Smirnov, G.; Vlachoudis, V. The FLUKA code: Developments and challenges for high energy and medical applications. Nucl. Data Sheets 2014, 120, 211–214. [Google Scholar] [CrossRef]
- Ferrari, A.; Sala, P.R.; Fassò, A.; Ranft, J. FLUKA: A Multi-Particle Transport Code, CERN 2005-10 (2005), INFN/TC_05/11, SLAC-R-773; CERN: Geneva, Switzerland, 2005. [Google Scholar]
- Ballarini, F.; Battistoni, G.; Campanella, M.; Carboni, M.; Cerutti, F.; Empl, A.; Fassò, A.; Ferrari, A.; Gadioli, E.; Garzelli, M.V.; et al. The FLUKA code: An overview. J. Phys. Conf. Series 2006, 41, 151. [Google Scholar] [CrossRef]
- Carante, M.P.; Aricò, G.; Ferrari, A.; Karger, C.P.; Kozlowska, W.; Mairani, A.; Sala, P.; Ballarini, F. In vivo validation of the BIANCA biophysical model: Benchmarking against rat spinal cord RBE data. Int. J. Mol. Sci. 2020, 21, 3973. [Google Scholar] [CrossRef]
- Bauchinger, M.; Schmid, E. LET dependence of yield ratios of radiation-induced intra- and inter-chromosomal aberrations in human lymphocytes. Int. J. Radiat. Biol. 1998, 74, 17–25. [Google Scholar]
- Schmid, E.; Braselmann, H.; Nahrstedt, U. Comparison of gamma-ray induced dicentric yields in human lymphocytes measured by conventional analysis and FISH. Mutat. Res. Lett. 1995, 348, 125–130. [Google Scholar] [CrossRef]
- Rimpl, G.R.; Schmid, E.; Braselmann, H.; Bauchinger, M. Chromosome aberrations induced in human lymphocytes by 16.5 MeV protons. Int. J. Radiat. Biol. 1990, 58, 999–1007. [Google Scholar] [CrossRef]
- Schmid, E.; Roos, H.; Rimpl, G.; Bauchinger, M. Chromosome aberration frequencies in human lymphocytes irradiated in a multi-layer array by protons with different LET. Int. J. Radiat. Biol. 1997, 72, 661–665. [Google Scholar] [CrossRef]
- Edwards, A.A.; Lloyd, D.C.; Prosser, J.S.; Finnon, P.; Moquet, J.E. Chromosome aberrations induced in humans lymphocytes by 9.7 MeV protons and 23.5 MeV helium-3 ions. Int. J. Radiat. Biol. 1986, 50, 137–145. [Google Scholar]
- Edwards, A.A. The use of chromosomal aberrations in human lymphocytes for biological dosimetry. Radiat. Res. 1997, 148, S39–S44. [Google Scholar] [CrossRef] [PubMed]
- Di Giorgio, M.; Moquet, J.E.; Finnon, P.; Hone, P.A.; Kreiner, A.J.; Schuff, J.A.; Taja, M.R.; Vallerga, M.B.; López, F.O.; Debray, M.E.; et al. Chromosome aberrations induced in human lymphocytes by heavy charged particles in track segment mode. Radiat. Prot. Dosim. 2004, 108, 47–53. [Google Scholar] [CrossRef]
- Greinert, R.; Thieke, C.; Detzler, E.; Boguhn, O.; Frankenberg, D.; Harder, D. Chromosome aberrations induced in human lymphocytes by 3.45 MeV alpha particles analyzed by premature chromosome condensation. Radiat. Res. 1999, 152, 412. [Google Scholar] [CrossRef] [PubMed]
- Schmid, E.; Hieber, L.; Heinzmann, U.; Roos, H.; Kellerer, A.M. Analysis of chromosome aberrations in human peripheral lymphocytes induced by in vitro alpha-particle irradiation. Radiat. Environ. Biophys. 1996, 35, 179–184. [Google Scholar] [CrossRef] [PubMed]
- Edwards, A.A.; Purrott, R.J.; Prosser, J.S.; Lloyd, D.C. The induction of chromosome aberrations in human lymphocytes by alpha-radiation. Int. J Radiat. Biol. 1980, 38, 83–91. [Google Scholar] [CrossRef]
- Kowalska, A.; Nasonova, E.; Czerski, K.; Kutsalo, P.; Pereira, W.; Krasavin, E. Production and distribution of chromosome aberrations in human lymphocytes by particle beams with different LET. Radiat. Environ. Biophys. 2019, 58, 99–108. [Google Scholar] [CrossRef] [PubMed]
- Ohara, H.; Okazaki, N.; Monobe, M.; Watanabe, S.; Kanayama, M.; Minamihisamatsu, M. Induction of asymmetrical type of chromosomal aberrations in cultured human lymphocytes by ion beams of different energies at varying let from HIMAC and RRC. Adv. Space Res. 1998, 22, 1673–1682. [Google Scholar] [CrossRef]
- Wang, Z.Z.; Li, W.J.; Zhi, D.J.; Jing, X.G.; Wei, W.; Gao, Q.X.; Liu, B. Biodosimetry estimate for high-LET irradiation. Radiat. Environ. Biophys. 2007, 46, 229–235. [Google Scholar] [CrossRef] [PubMed]
- Dutrillaux, B.; Testard, I.; Sabatier, L. Chromosomal aberrations induced in human lymphocytes by high-LET irradiation. Int. J. Radiat. Biol. 1997, 72, 423–433. [Google Scholar]
- Govorun, R.D.; LukaSova, E.; Krasavin, E.A.; Kozubek, S.; Repin, M.V.; Kroha, V. Induction of Aberrations in Human Lymphocytes by Gamma-Rays and Fast Heavy Ions; Technical Report—SCAN-9807052; Joint Institute for Nuclear Research: Dubna, Russia, 1998. [Google Scholar]
- Carante, M.P.; Aricò, G.; Ferrari, A.; Kozlowska, W.; Mairani, A.; Ballarini, F. First benchmarking of the BIANCA model for cell survival predictions in a clinical hadron therapy scenario. Phys. Med. Biol. 2019, 64, 215008. [Google Scholar] [CrossRef]
- Carante, M.P.; Aimè, C.; Cajiao, J.J.T.; Ballarini, F. BIANCA, a biophysical model of cell survival and chromosome damage by protons, C-ions and He-ions at energies and doses used in hadrontherapy. Phys. Med. Biol. 2018, 63, 075007. [Google Scholar] [CrossRef]
- Ottolenghi, A.; Ballarini, F.; Merzagora, M. Modelling radiation-induced biological lesions: From initial energy depositions to chromosome aberrations. Radiat. Environ. Biophys. 1999, 38, 1–13. [Google Scholar] [CrossRef] [PubMed]
- Schuemann, J.; McNamara, A.L.; Warmenhoven, J.W.; Henthorn, N.T.; Kirkby, K.; Merchant, M.J.; Ingram, S.; Paganetti, H.; Held, K.D.; Ramos-Méndez, J.A.; et al. A New standard DNA damage (SDD) data format. Radiat. Res. 2018, 191, 76–92. [Google Scholar] [CrossRef] [PubMed]
- Cajiao, J.J.T.; Carante, M.P.; Rodriguez, M.A.B.; Ballarini, F. Proximity effects in chromosome aberration induction by low-LET ionizing radiation. DNA Repair 2017, 58, 38–46. [Google Scholar] [CrossRef] [PubMed]
- Cajiao, J.J.T.; Carante, M.P.; Rodriguez, M.A.B.; Ballarini, F. Proximity effects in chromosome aberration induction: Dependence on radiation quality, cell type and dose. DNA Repair 2018, 64, 45–52. [Google Scholar] [CrossRef]
- Ballarini, F.; Biaggi, M.; Ottollenghi, A. Nuclear architecture and radiation induced chromosome aberrations: Models and simulations. Radiat. Prot. Dosim. 2002, 99, 175–182. [Google Scholar] [CrossRef] [PubMed]
- Ottolenghi, A.; Ballarini, F.; Biaggi, M. Modelling chromosomal aberration induction by ionising radiation: The influence of interphase chromosome architecture. Adv. Space Res. 2001, 27, 369–382. [Google Scholar] [CrossRef]
- Carante, M.P.; Altieri, S.; Bortolussi, S.; Postuma, I.; Protti, N.; Ballarini, F. Modeling radiation-induced cell death: Role of different levels of DNA damage clustering. Radiat. Environ. Biophys. 2015, 54, 305–316. [Google Scholar] [CrossRef] [PubMed]
- Carante, M.P.; Ballarini, F. Calculating variations in biological effectiveness for a 62 MeV proton beam. Front. Oncol. 2016, 6, 76. [Google Scholar] [CrossRef] [PubMed]
- Ballarini, F.; Carante, M.P. Chromosome aberrations and cell death by ionizing radiation: Evolution of a biophysical model. Radiat. Phys. Chem. 2016, 128, 18–25. [Google Scholar] [CrossRef]
- Zaider, M.; Rossi, H.H. The synergistic effects of different radiations. Radiat. Res. 1980, 83, 732–739. [Google Scholar] [CrossRef] [PubMed]
- Mairani, A.; Brons, S.; Cerutti, F.; Fassò, A.; Ferrari, A.; Krämer, M.; Parodi, K.; Scholz, M.; Sommerer, F. The FLUKA Monte Carlo code coupled with the local effect model for biological calculations in carbon ion therapy. Phys. Med. Biol. 2010, 55, 4273–4289. [Google Scholar] [CrossRef]


Publisher’s Note: MDPI stays neutral with regard to jurisdictional claims in published maps and institutional affiliations. |
© 2021 by the authors. Licensee MDPI, Basel, Switzerland. This article is an open access article distributed under the terms and conditions of the Creative Commons Attribution (CC BY) license (https://creativecommons.org/licenses/by/4.0/).
Share and Cite
Embriaco, A.; Ramos, R.; Carante, M.; Ferrari, A.; Sala, P.; Vercesi, V.; Ballarini, F. Healthy Tissue Damage Following Cancer Ion Therapy: A Radiobiological Database Predicting Lymphocyte Chromosome Aberrations Based on the BIANCA Biophysical Model. Int. J. Mol. Sci. 2021, 22, 10877. https://doi.org/10.3390/ijms221910877
Embriaco A, Ramos R, Carante M, Ferrari A, Sala P, Vercesi V, Ballarini F. Healthy Tissue Damage Following Cancer Ion Therapy: A Radiobiological Database Predicting Lymphocyte Chromosome Aberrations Based on the BIANCA Biophysical Model. International Journal of Molecular Sciences. 2021; 22(19):10877. https://doi.org/10.3390/ijms221910877
Chicago/Turabian StyleEmbriaco, Alessia, Ricardo Ramos, Mario Carante, Alfredo Ferrari, Paola Sala, Valerio Vercesi, and Francesca Ballarini. 2021. "Healthy Tissue Damage Following Cancer Ion Therapy: A Radiobiological Database Predicting Lymphocyte Chromosome Aberrations Based on the BIANCA Biophysical Model" International Journal of Molecular Sciences 22, no. 19: 10877. https://doi.org/10.3390/ijms221910877
APA StyleEmbriaco, A., Ramos, R., Carante, M., Ferrari, A., Sala, P., Vercesi, V., & Ballarini, F. (2021). Healthy Tissue Damage Following Cancer Ion Therapy: A Radiobiological Database Predicting Lymphocyte Chromosome Aberrations Based on the BIANCA Biophysical Model. International Journal of Molecular Sciences, 22(19), 10877. https://doi.org/10.3390/ijms221910877