
Longitudinal and Transverse Relaxivity Analysis of Native Ferritin and Magnetoferritin at 7 T MRI

 , , ,
, , ,
Abstract
:1. Introduction
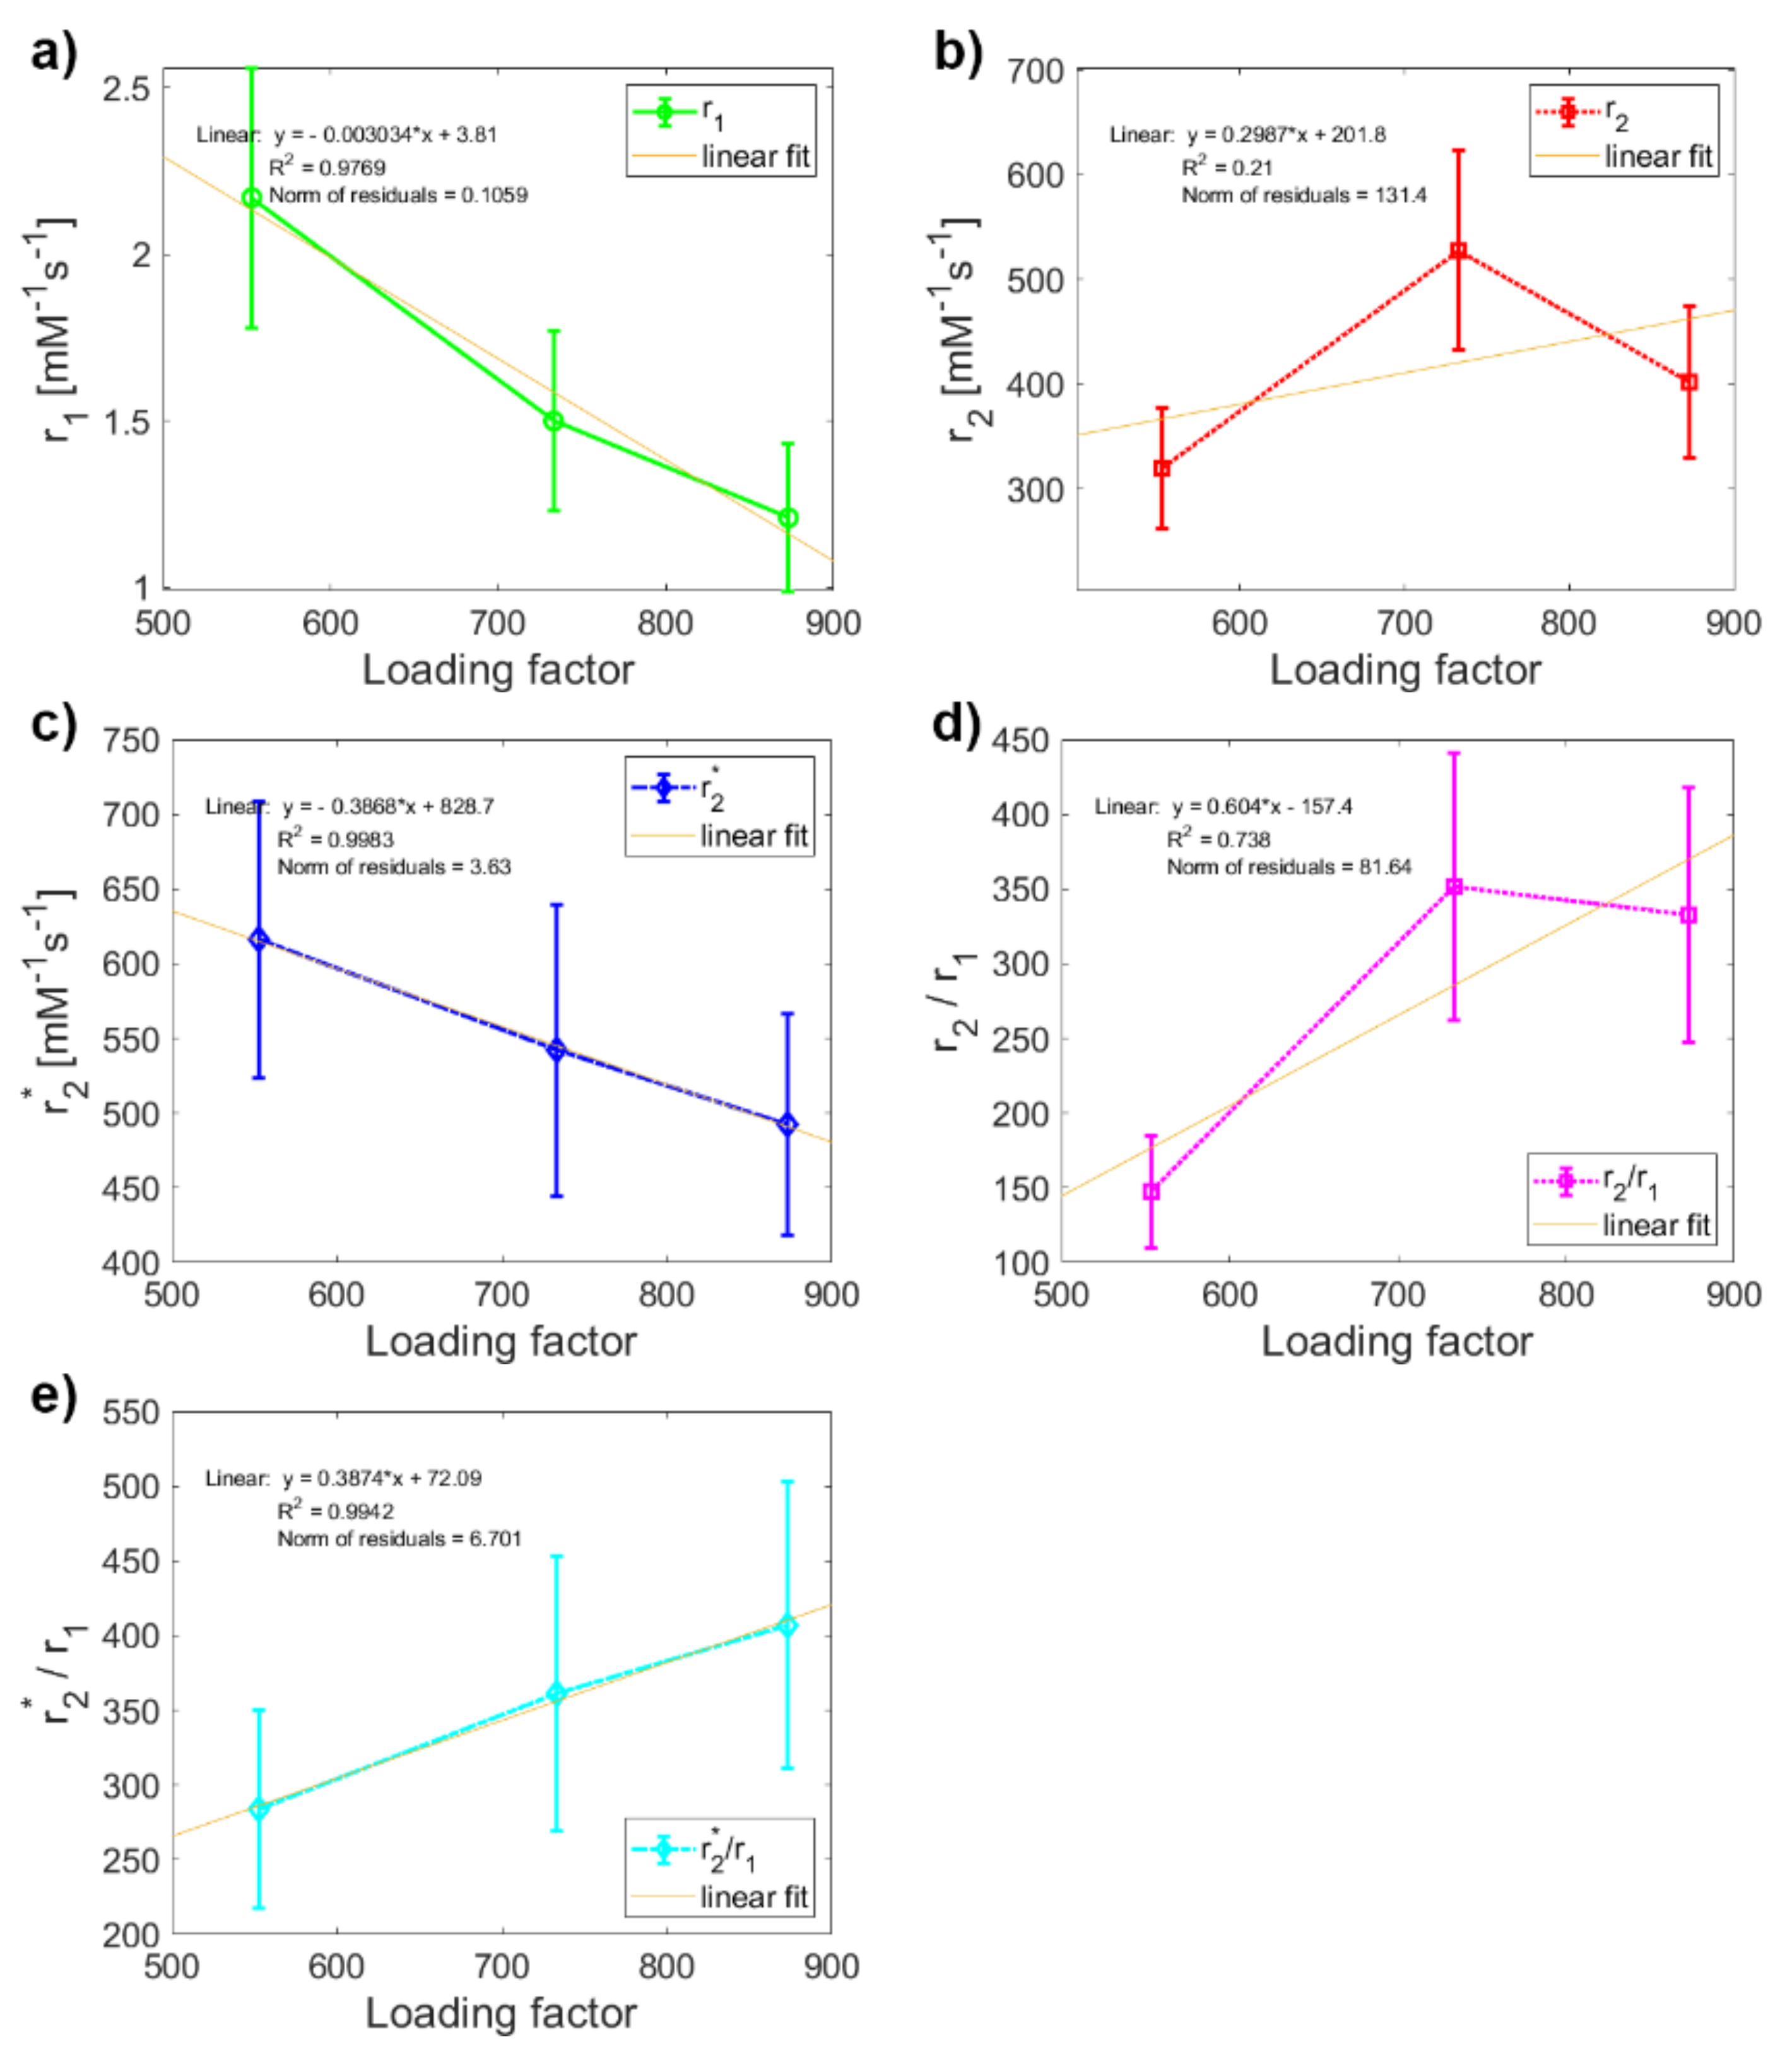
2. Results and Discussion
3. Materials and Methods
3.1. Chemicals
3.2. Synthesis of Magnetoferritin
3.3. Quantitative Determination of the Loading Factor
3.4. Measurement of the Hydrodynamic Diameter
3.5. Magnetometry
3.6. Magnetic Resonance Imaging
- T1 mapping—Rapid Acquisition with Refocused Echoes (RARE) pulse sequence, with repetition time TR = 5500, 3000, 1500, 800, 400 and 200 ms, and echo time TE = 7 ms.
- T2 mapping—Multi-Slice Multi-Echo (MSME) pulse sequence, with repetition time TR = 2000 ms, starting echo time TE = 8 ms, spacing = 8 ms, and 25 images.
- T2* mapping—Multi Gradient Echo (MGE) pulse sequence, with repetition time TR = 1200 ms, starting echo time TE = 5.1 ms, spacing = 5 ms, and 10 images.
3.7. Statistics
4. Conclusions
Supplementary Materials
Author Contributions
Funding
Institutional Review Board Statement
Informed Consent Statement
Data Availability Statement
Conflicts of Interest
References
- Ilbert, M.; Bonnefoy, V. Insight into the evolution of the iron oxidation pathways. Biochim. Biophys. Acta 2013, 1827, 161–175. [Google Scholar] [CrossRef] [Green Version]
- Wessling-Resnick, M. Iron homeostasis and the inflammatory response. Annu. Rev. Nutr. 2010, 30, 105–122. [Google Scholar] [CrossRef] [Green Version]
- Hagemeier, J.; Geurts, J.J.G.; Zivadinov, R. Brain iron accumulation in aging and neurodegenerative disorders. Expert Rev. Neuro. 2012, 12, 1467–1480. [Google Scholar] [CrossRef]
- Frank-Cannon, T.C.; McAlpine, A.L.T.; Tansey, M.G. Does neuroinflammation fan the flame in neurodegenerative diseases? Mol. Neurodegener. 2009, 4, 47. [Google Scholar] [CrossRef] [Green Version]
- Jung, M.; Mertens, C.; Tomat, E.; Brune, B. Iron as a central player and promising target in cancer progression. Int. J. Mol. Sci. 2019, 20, 273. [Google Scholar] [CrossRef] [PubMed] [Green Version]
- Milic, S.; Mikolasevic, I.; Orlic, L.; Devic, E.; Starcevic-Cizmarevic, N.; Stimac, D.; Kapovic, M.; Ristic, S. The role of iron and iron overload in chronic liver disease. Med. Sci. Monit. 2016, 22, 2144–2151. [Google Scholar] [CrossRef] [PubMed] [Green Version]
- Kobayashi, M.; Suhara, T.; Baba, Y.; Kawasaki, N.K.; Higa, J.; Matsui, T. Pathological roles of iron in cardiovascular disease. Curr. Drug Targets 2018, 19, 1068–1076. [Google Scholar] [CrossRef] [PubMed]
- Ganz, T. Does pathological iron overload impair the function of human lungs? EBioMedicine 2017, 20, 13–14. [Google Scholar] [CrossRef] [Green Version]
- Kirschvink, J.L.; Kobayashi-Kirschvink, A.; Woodford, B.J. Magnetite biomineralization in the human brain. Proc. Natl. Acad. Sci. USA 1992, 89, 7683–7687. [Google Scholar] [CrossRef] [PubMed] [Green Version]
- Hautot, D.; Pankhurst, Q.A.; Khan, N.; Dobson, J. Preliminary evaluation of nanoscale biogenic magnetite in Alzheimer’s disease brain tissue. Proc. R. Soc. Lond. B 2003, 270, S62–S64. [Google Scholar] [CrossRef] [PubMed] [Green Version]
- Dobson, J. Nanoscale biogenic iron oxides and neurodegenerative disease. FEBS Lett. 2001, 496, 1–5. [Google Scholar] [CrossRef] [Green Version]
- Wang, J.; Pantopoulos, K. Regulation of cellular iron metabolism. Biochem. J. 2011, 434, 365–381. [Google Scholar] [CrossRef] [Green Version]
- Tabner, B.J. Protein aggregation, metals and oxidative stress in neurodegenerative diseases. Biochem. Soc. Trans. 2005, 33, 1082–1086. [Google Scholar] [CrossRef]
- Klaunig, J.E.; Kamendulis, L.M.; Hocevar, B.A. Oxidative stress and oxidative damage in carcinogenesis. Toxicol. Pathol. 2010, 38, 96–109. [Google Scholar] [CrossRef] [PubMed] [Green Version]
- Strbak, O.; Balejcikova, L.; Kmetova, M.; Gomobos, J.; Trancikova, A.; Pokusa, M.; Kopcansky, P. Quantification of iron release from native ferritin and magnetoferritin induced by vitamins B2 and C. Int. J. Mol. Sci. 2020, 21, 6332. [Google Scholar] [CrossRef] [PubMed]
- Quintana, C.; Cowley, J.M.; Marhic, C. Electron nanodiffraction and high-resolution electron microscopy studies of the structure and composition of physiological and pathological ferritin. J. Struct. Biol. 2004, 147, 166–178. [Google Scholar] [CrossRef] [PubMed]
- Chasteen, N.D.; Harrison, P.M. Mineralization in ferritin: An efficient means of iron storage. J. Struct. Biol. 1999, 126, 182–194. [Google Scholar] [CrossRef] [PubMed] [Green Version]
- Bossoni, L.; Moursel, L.G.; Bulk, M.; Simon, B.G.; Webb, A.; Weerd, L.; Huber, M.; Carreta, P.; Lascalfari, A.; Oosterkamp, T.H. Human-brain ferritin studied by muon spin rotation: A pilot study. J. Phys. Condens. Matter 2017, 29, 415801. [Google Scholar] [CrossRef] [PubMed]
- Xue, L.; Deng, D.; Sun, J. Magnetoferritin: Process, prospects, and their biomedical applications. Int. J. Mol. Sci. 2019, 20, 2426. [Google Scholar] [CrossRef] [Green Version]
- Strbak, O.; Balejcikova, L.; Baciak, L.; Kovac, J.; Masarova-Kozelova, M.; Krafcik, A.; Dobrota, D.; Kopcansky, P. Low-field and high-field magnetic resonance contrast imaging of magnetoferritin as a pathological model system of iron accumulation. J. Phys. D Appl. Phys. 2017, 50, 365401. [Google Scholar] [CrossRef]
- Bulte, J.W.M.; Vymazal, J.; Brooks, R.A.; Pierpaoli, C.; Frank, J.A. Frequency dependence of MR relaxation times II. Iron oxides. J. Magn. Reson. Imaging 1993, 3, 641–648. [Google Scholar] [CrossRef]
- Bulte, J.W.M.; Douglas, T.; Mann, S.; Frankel, R.B.; Moskowitz, B.M.; Brooks, R.A.; Baumgarner, C.D.; Vymazal, J.; Strub, M.P.; Frank, J.A. Magnetoferritin: Characterization of a novel superparamagnetic MR contrast agent. J. Magn. Reson. Imaging 1994, 4, 497–505. [Google Scholar] [CrossRef] [PubMed]
- Papaefthymiou, G.C. The Mossbauer and magnetic properties of ferritin cores. Biochim. Biophys. Acta 2010, 1800, 886–897. [Google Scholar] [CrossRef]
- Gossuin, Y.; Hautot, D.; Muller, R.N.; Pankhurst, Q.; Dobson, J.; Morris, C.; Gillis, P.; Collingwood, J. Looking for biogenic magnetite in brain ferritin using NMR relaxometry. NMR Biomed. 2005, 18, 469–472. [Google Scholar] [CrossRef] [PubMed]
- Dusek, P.; Dezortova, M.; Wuerfel, J. Imaging of iron. Int. Rev. Neurobiol. 2013, 110, 195–239. [Google Scholar]
- Masarova, M.; Krafcik, A.; Teplan, M.; Strbak, O.; Gogola, D.; Boruta, P.; Dobrota, D.; Frollo, I. Comparison of iron oxide-related MRI artifacts in healthy and neuropathological human brain tissue. Acta Phys. Pol. A 2017, 131, 1108–1110. [Google Scholar] [CrossRef]
- Balejcikova, L.; Garamus, V.M.; Avdeev, M.V.; Petrenko, V.I.; Almasy, L.; Kopcansky, P. The Effect of Solution pH on the Structural Stability of Magnetoferritin. Colloids Surf. B Biointerfaces 2017, 156, 375–381. [Google Scholar] [CrossRef]
- Baumgartner, J.; Bertinetti, L.; Widdrat, M.; Hirt, A.M.; Faivre, D. Formation of Magnetite Nanoparticles at Low Temperature: From Superparamagnetic to Stable Single Domain Particles. PLoS ONE 2013, 8, e57070. [Google Scholar]
- Balejcikova, L.; Molcan, M.; Kovac, J.; Kubovcikova, M.; Saksl, K.; Mitroova, Z.; Timko, M.; Kopcansky, P. Hyperthermic effect in magnetoferritin aqueous colloidal solution. J. Mol. Liq. 2019, 283, 39–44. [Google Scholar] [CrossRef]
- Antal, I.; Strbak, O.; Khmara, I.; Koneracka, M.; Kubovcikova, M.; Zavisova, V.; Kmetova, M.; Baranovicova, E.; Dobrota, D. MRI relaxivity changes of the magnetic nanoparticles induced by different amino acid coatings. Nanomaterials 2020, 10, 394. [Google Scholar] [CrossRef] [Green Version]
- Bennett, K.M.; Shapiro, E.M.; Sotak, C.H.; Koretsky, A.P. Controlled aggregation of ferritin to modulate MRI relaxivity. Biophys. J. 2008, 95, 342–351. [Google Scholar] [CrossRef] [Green Version]
- Jordan, V.C.; Caplan, M.R.; Bennett, K.M. Simplified synthesis and relaxometry of magnetoferritin for magnetic resonance imaging. Magn. Reson. Med. 2010, 64, 1260–1266. [Google Scholar] [CrossRef] [PubMed]
- Hiemstra, T. Surface structure controlling nanoparticle behavior: Magnetism of ferrihydrite, magnetite, and maghemite. Environ. Sci.: Nano 2018, 5, 752–764. [Google Scholar] [CrossRef]
- Schober, P.; Boer, C.; Schwarte, L.A. Correlation coefficients: Appropriate use and interpretation. Anesth. Analg. 2018, 126, 1763–1768. [Google Scholar] [CrossRef]
- Estelrich, J.; Sanchez-Martin, M.J.; Busquets, M.A. Nanoparticles in magnetic resonance imaging: From simple to dual contrast agents. Int. J. Nanomed. 2015, 10, 1727–1741. [Google Scholar]
- Qin, J.; Laurent, S.; Jo, Y.S.; Roch, A.; Mikhaylova, M.; Bhujwalla, Z.M.; Muller, R.N.; Muhammed, M. A high-performance magnetic resonance imaging T2 contrast agent. Adv. Mater. 2007, 19, 1874–1878. [Google Scholar] [CrossRef]
- Strbak, O.; Antal, I.; Khmara, I.; Koneracka, M.; Kubovcikova, M.; Zavisova, V.; Molcan, M.; Jurikova, A.; Hnilicova, P.; Gombos, J.; et al. Influence of dextran molecular weight on the physical properties of magnetic nanoparticles for hyperthermia and MRI applications. Nanomaterials 2020, 10, 2468. [Google Scholar] [CrossRef]
- Michel, F.M.; Barrón, V.; Torrent, J.; Morales, M.P.; Serna, C.J.; Boily, J.F.; Liu, Q.; Ambrosini, A.; Cismasu, A.C.; Brown, G.E., Jr. Ordered ferrimagnetic form of ferrihydrite reveals links among structure, composition, and magnetism. Proc. Natl. Acad. Sci. USA 2010, 107, 2787–2792. [Google Scholar] [CrossRef] [PubMed] [Green Version]


| NF | MF1 | MF2 | MF3 | |
|---|---|---|---|---|
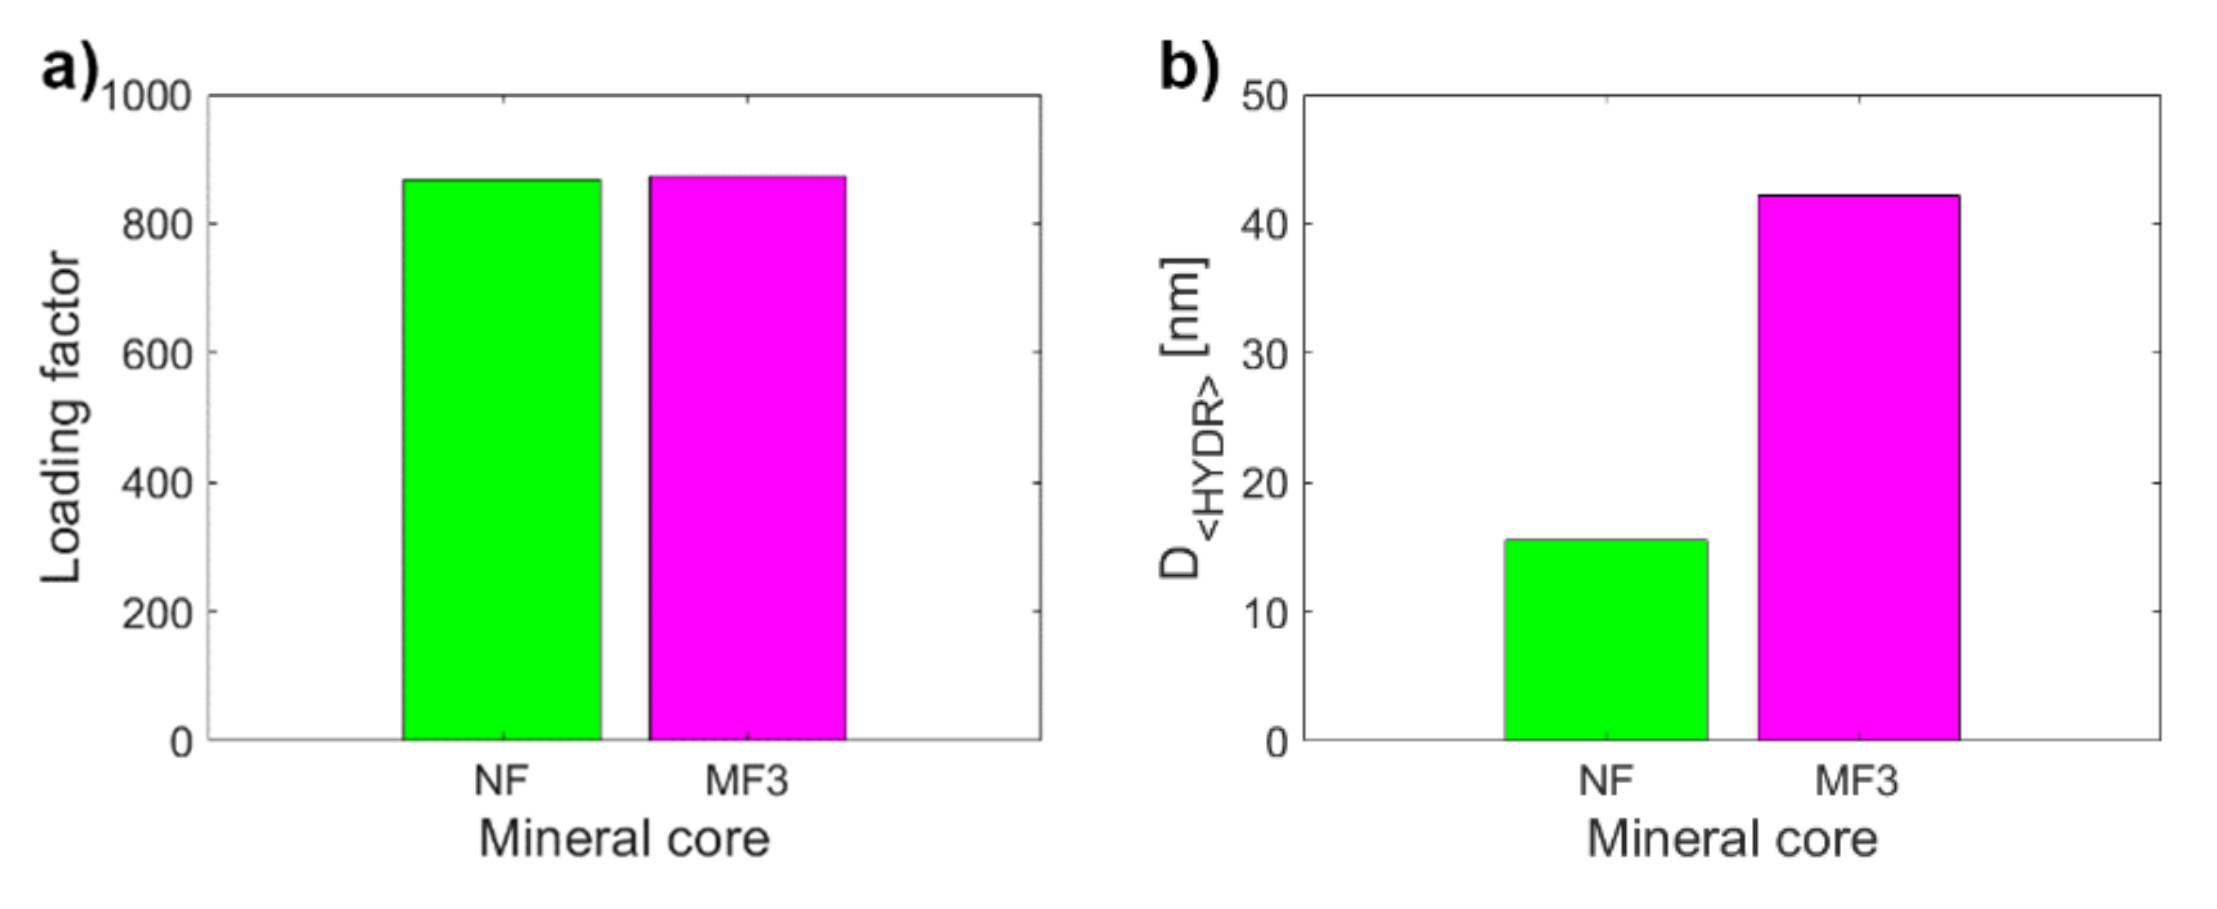
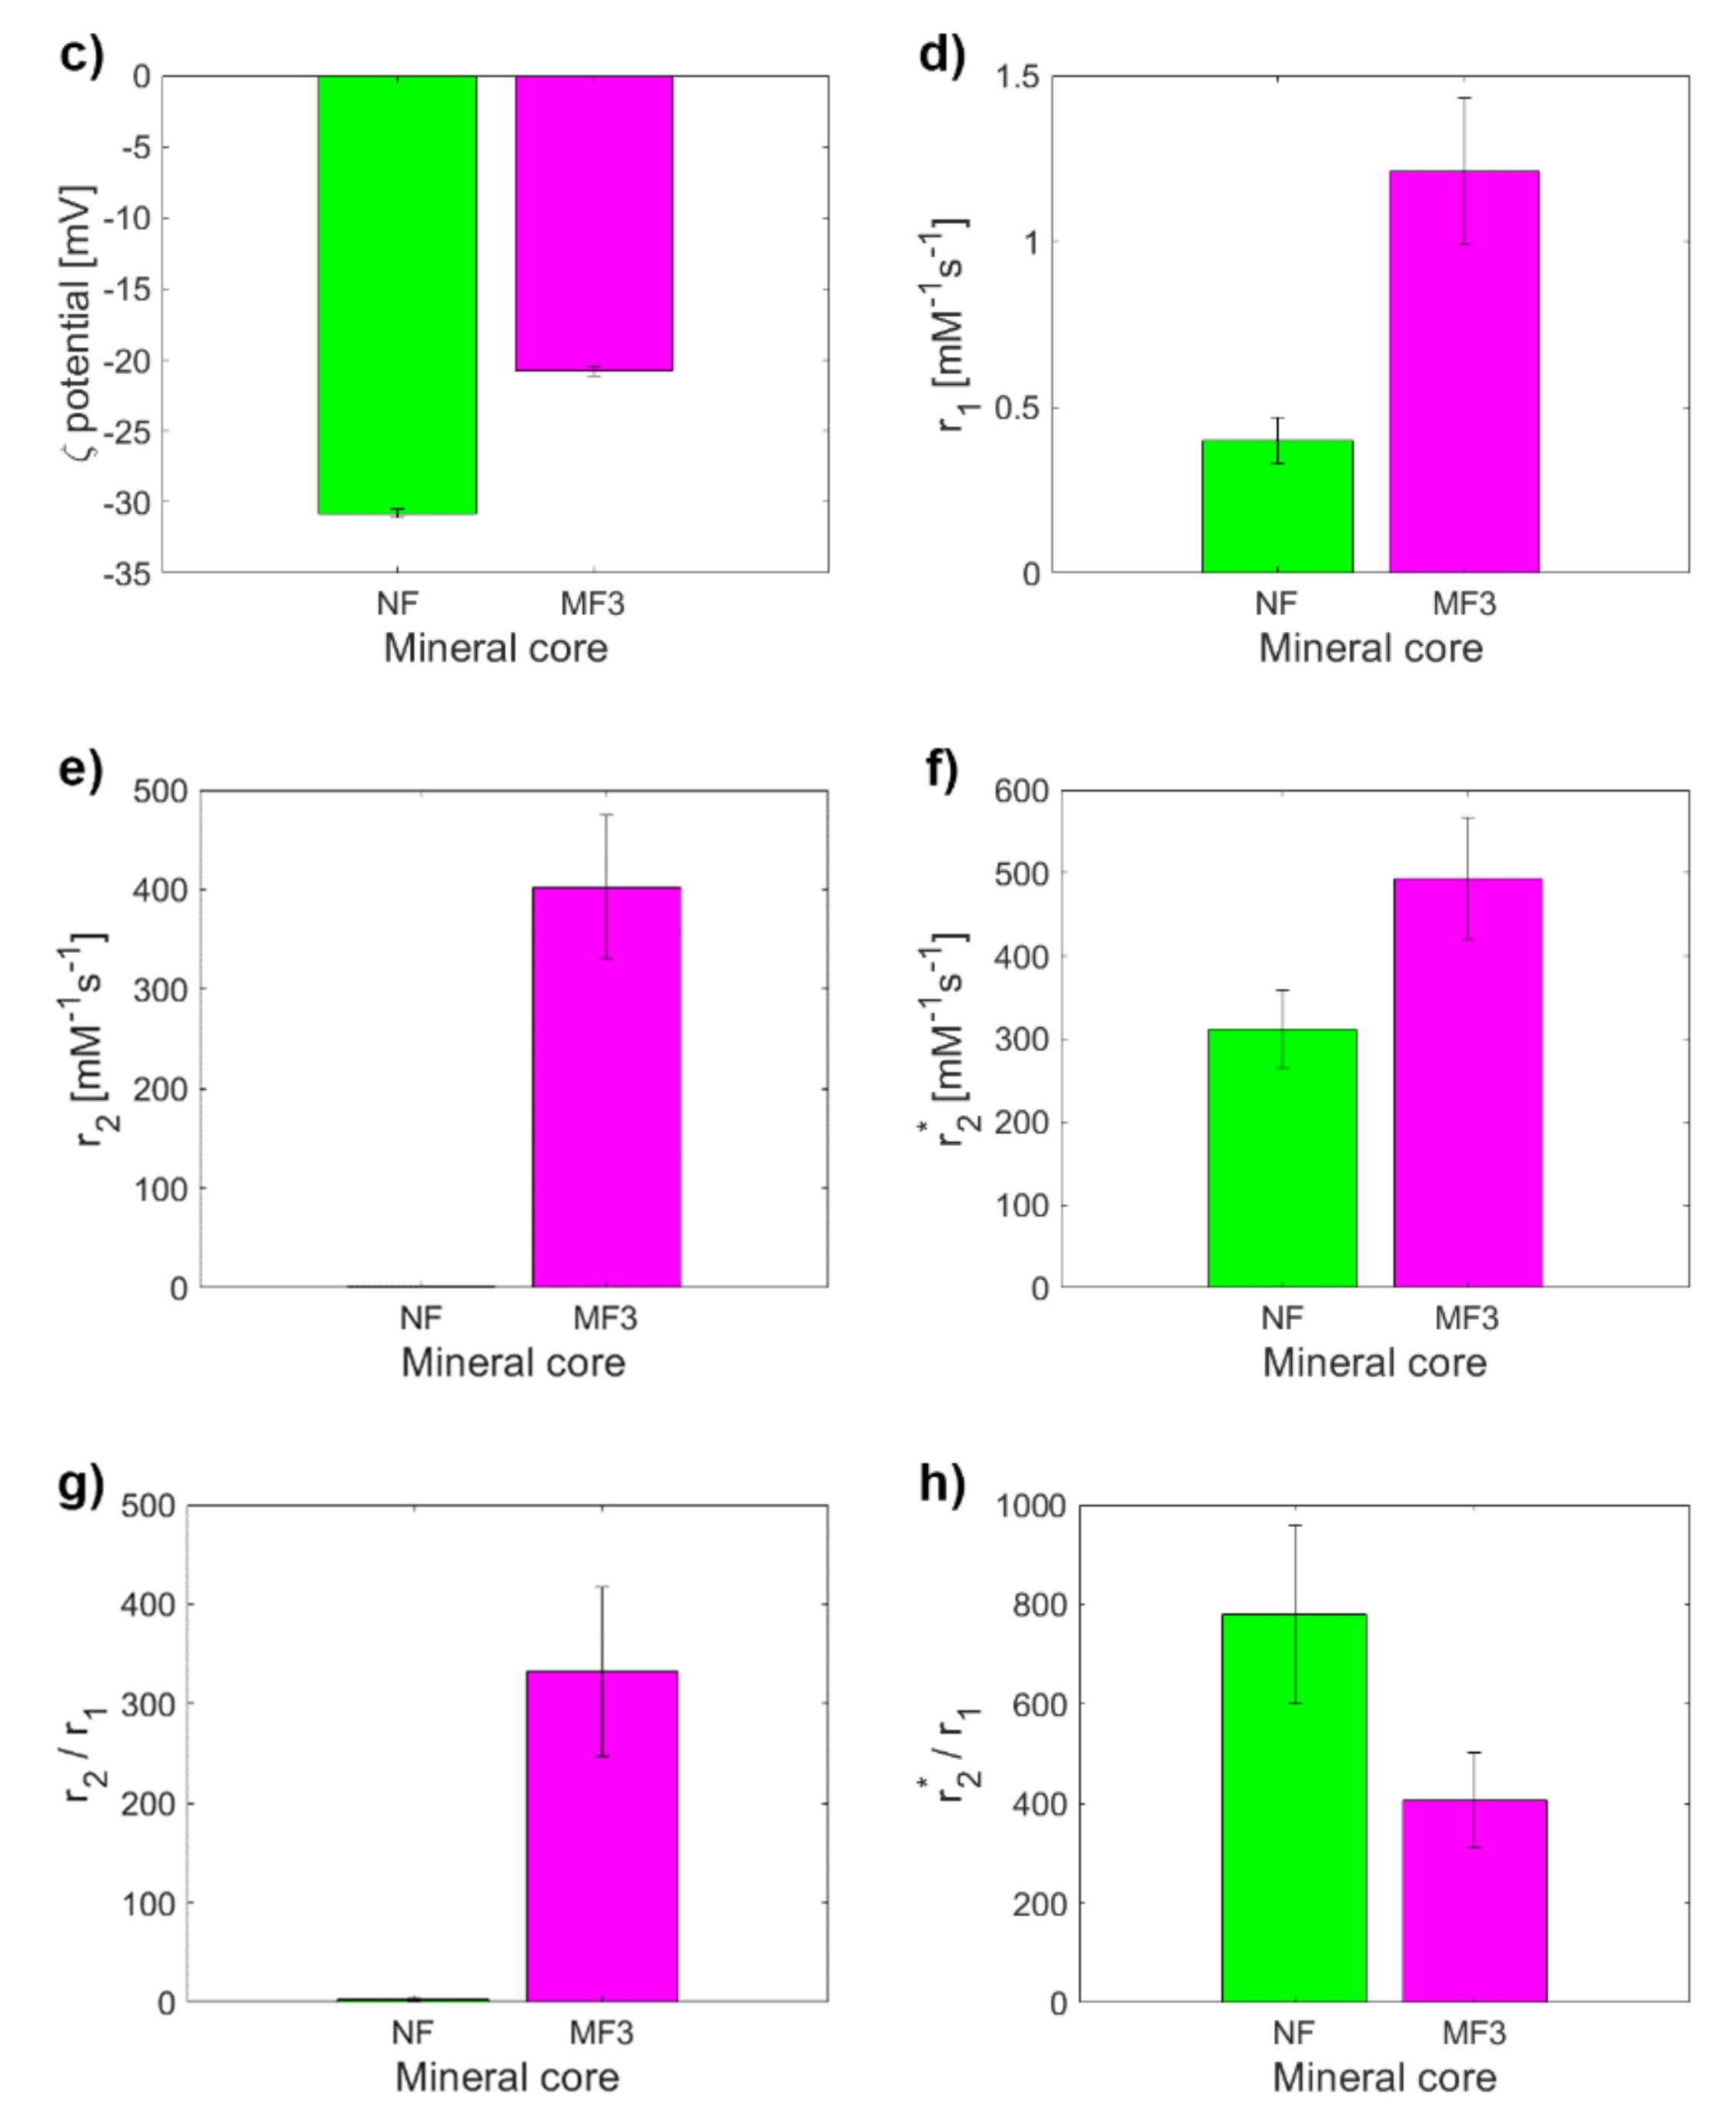
| LF | 868.00 ± 0.03 | 553.00 ± 0.08 | 733.00 ± 0.42 | 873.00 ± 0.11 |
| D<HYDR> (nm) | 15.600 ± 0.002 | 46.000 ± 0.003 | 46.500 ± 0.056 | 42.200 ± 0.012 |
| ζ potential (mV) | –30.8 ± 0.3 | –29.3 ± 0.5 | –26.9 ± 0.1 | –20.8 ± 0.3 |
| PDI | 0.30 ± 0.02 | 0.40 ± 0.02 | 0.40 ± 0.03 | 0.60 ± 0.01 |
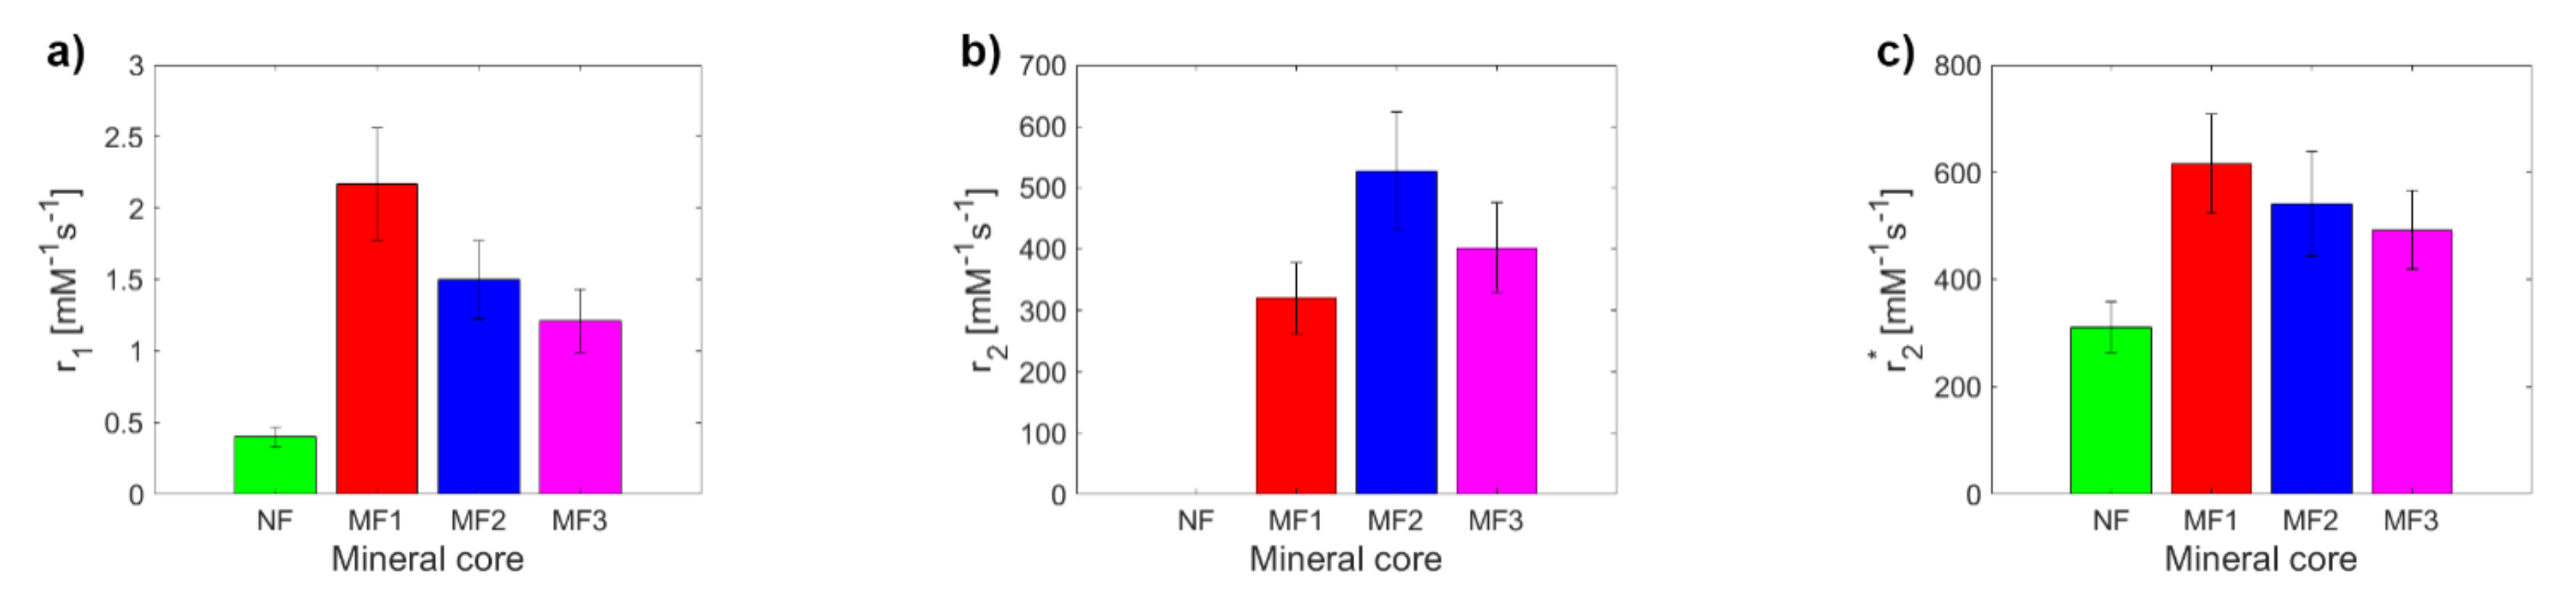
| r1 (mM−1s−1) | 0.40 ± 0.07 | 2.17 ± 0.39 | 1.50 ± 0.27 | 1.21 ± 0.22 |
| r2 (mM−1s−1) | 1.27 ± 0.23 | 320 ± 58 | 528 ± 95 | 402 ± 72 |
| r2* (mM−1s−1) | 311 ± 47 | 616 ± 92 | 542 ± 98 | 492 ± 74 |
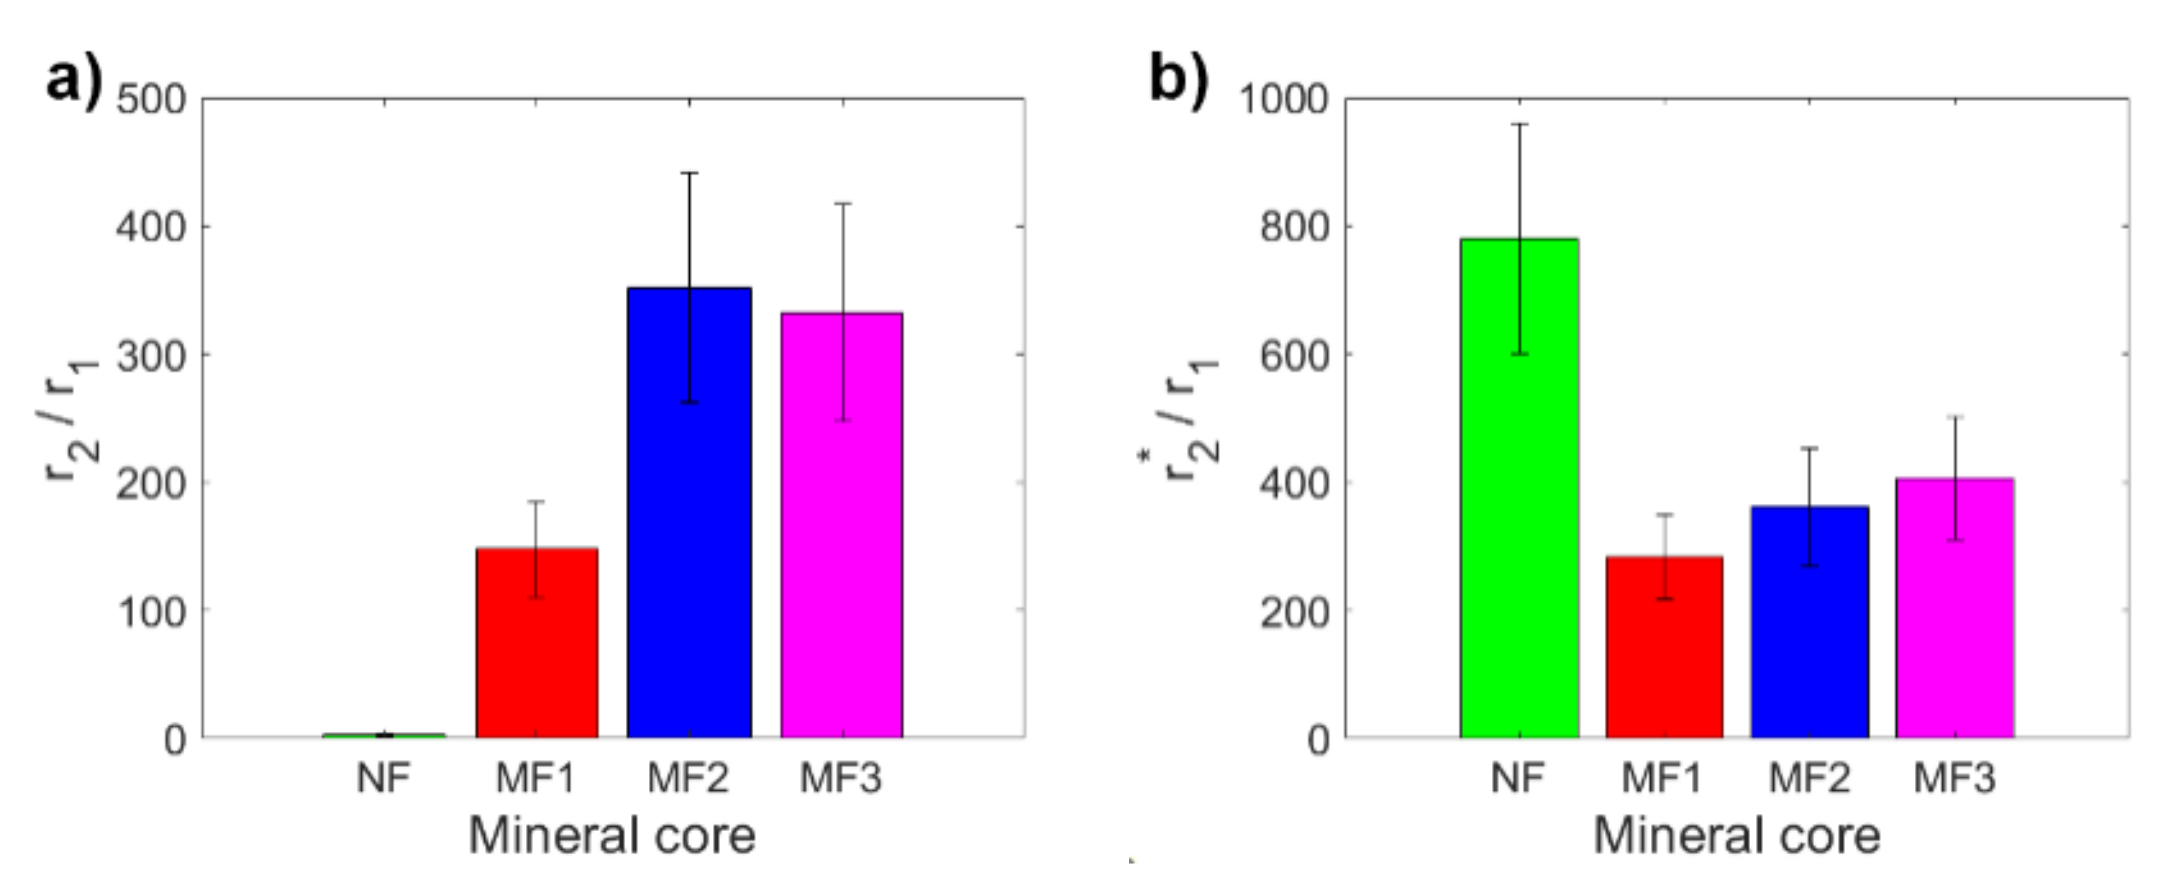
| r2/r1 | 3.18 ± 0.80 | 148 ± 38 | 352 ± 90 | 332 ± 85 |
| r2*/r1 | 779 ± 180 | 284 ± 66 | 361 ± 92 | 407 ± 96 |
| CC | RC T1w | RC T2w | RC T2*w | T1 | T2 | T2* | R1 | R2 | R2* |
|---|---|---|---|---|---|---|---|---|---|
| NF-MF1 | 0.48 | 0.97 | 0.75 | 0.67 | 0.45 | 0.60 | 0.67 | 0.45 | 0.60 |
| NF-MF2 | 0.48 | 0.87 | 0.73 | 0.67 | 0.17 | 0.62 | 0.67 | 0.17 | 0.62 |
| NF-MF3 | 0.48 | 0.95 | 0.75 | 0.78 | 0.72 | 0.60 | 0.78 | 0.72 | 0.60 |
| MF1-MF2 | 1.00 | 0.93 | 0.98 | 1.00 | 0.92 | 0.98 | 1.00 | 0.92 | 0.98 |
| MF1-MF3 | 1.00 | 0.98 | 1.00 | 0.97 | 0.92 | 1.00 | 0.97 | 0.92 | 1.00 |
| MF2-MF3 | 1.00 | 0.95 | 0.98 | 0.97 | 0.75 | 0.98 | 0.97 | 0.75 | 0.98 |
Publisher’s Note: MDPI stays neutral with regard to jurisdictional claims in published maps and institutional affiliations. |
© 2021 by the authors. Licensee MDPI, Basel, Switzerland. This article is an open access article distributed under the terms and conditions of the Creative Commons Attribution (CC BY) license (https://creativecommons.org/licenses/by/4.0/).
Share and Cite
Strbak, O.; Balejcikova, L.; Kmetova, M.; Gombos, J.; Kovac, J.; Dobrota, D.; Kopcansky, P. Longitudinal and Transverse Relaxivity Analysis of Native Ferritin and Magnetoferritin at 7 T MRI. Int. J. Mol. Sci. 2021, 22, 8487. https://doi.org/10.3390/ijms22168487
Strbak O, Balejcikova L, Kmetova M, Gombos J, Kovac J, Dobrota D, Kopcansky P. Longitudinal and Transverse Relaxivity Analysis of Native Ferritin and Magnetoferritin at 7 T MRI. International Journal of Molecular Sciences. 2021; 22(16):8487. https://doi.org/10.3390/ijms22168487
Chicago/Turabian StyleStrbak, Oliver, Lucia Balejcikova, Martina Kmetova, Jan Gombos, Jozef Kovac, Dusan Dobrota, and Peter Kopcansky. 2021. "Longitudinal and Transverse Relaxivity Analysis of Native Ferritin and Magnetoferritin at 7 T MRI" International Journal of Molecular Sciences 22, no. 16: 8487. https://doi.org/10.3390/ijms22168487
APA StyleStrbak, O., Balejcikova, L., Kmetova, M., Gombos, J., Kovac, J., Dobrota, D., & Kopcansky, P. (2021). Longitudinal and Transverse Relaxivity Analysis of Native Ferritin and Magnetoferritin at 7 T MRI. International Journal of Molecular Sciences, 22(16), 8487. https://doi.org/10.3390/ijms22168487