1. Introduction
Malignant pleural mesothelioma (MPM) is an aggressive tumor that develops in the lining of the lungs. This cancer is causally associated with asbestos exposure. Although asbestos use is banned in many of the world’s industrialized countries, the incidence of mesothelioma has overall not decreased for the last twenty years in most occidental countries [
1]. Surgery is an option for early-stage MPM patients but not for most patients with advanced invasive disease [
2] for whom treatment consists of palliative chemotherapy combining cisplatin with pemetrexed. While this treatment may relieve symptoms, it provides only modest survival, since the median survival average is 9–18 months from the time of diagnosis. Therefore, there is an urgent need for more effective treatments. Previous results from our laboratory, mostly obtained from in vitro experiments, suggest that inhibition of the Macrophage migration inhibitory factor (MIF)/CD74 pathway decreases the development of MPM [
3]. These data need validation in a reliable in vivo preclinical model. Several murine mesothelioma models have been developed, and the selection of an appropriate model depends upon the experimental aims. Asbestos-induced and genetically engineered mesothelioma mouse models recapitulate the phenotypic and genetic heterogeneity as well as the carcinogenesis steps of human mesothelioma. They have also a strong predictive power for drug response and resistance, but their use to validate new therapies is limited by a low take rate, a long latency in tumor development, and a high cost. Syngeneic transplantation of murine mesothelioma cell lines could be an alternative with a high take rate and a rapid tumor development. Nevertheless, murine and human cells present fundamental phenotypic and functional differences. For example, there are two CD74 isoforms in mice (p31 and p41) and four in humans (p33, p35, p41, and p43) [
4]. Up to now, the role of these different isoforms has not been clearly identified. Therefore, the effect of a treatment on murine mesothelial tumors could be not reproducible in human mesothelioma. Finally, preclinical studies on MPM mostly rely on subcutaneous or peritoneal xenotransplants of human mesothelioma cell lines in immunodeficient mice. These models provide reliable data and allow for rapid clinical translation. The major limitation is that the tumor environment is different from the in situ thoracic pleural mesothelioma environment. Transplantation in the orthotopic site offers a tumor microenvironment close to that of the original human tumor. To date, the use of the orthotopic thoracic site for xenografting has not been widespread, which is largely due to the technical difficulties in reaching and monitoring tumor development in this location. Here, we present a reliable orthotopic model of human MPM obtained after injection of a human mesothelioma cell line into the pleural space of athymic mice. Athymic mice have the advantage to be only partially immunodeficient, since they lack the thymus but produce most other immune cell types. Phenotypical and molecular characterizations of the tumor masses are described. For the first time in this orthotopic xenograft mesothelioma model, immune cell populations in the pleural environment of human mesothelioma-bearing mice are assessed.
3. Discussion
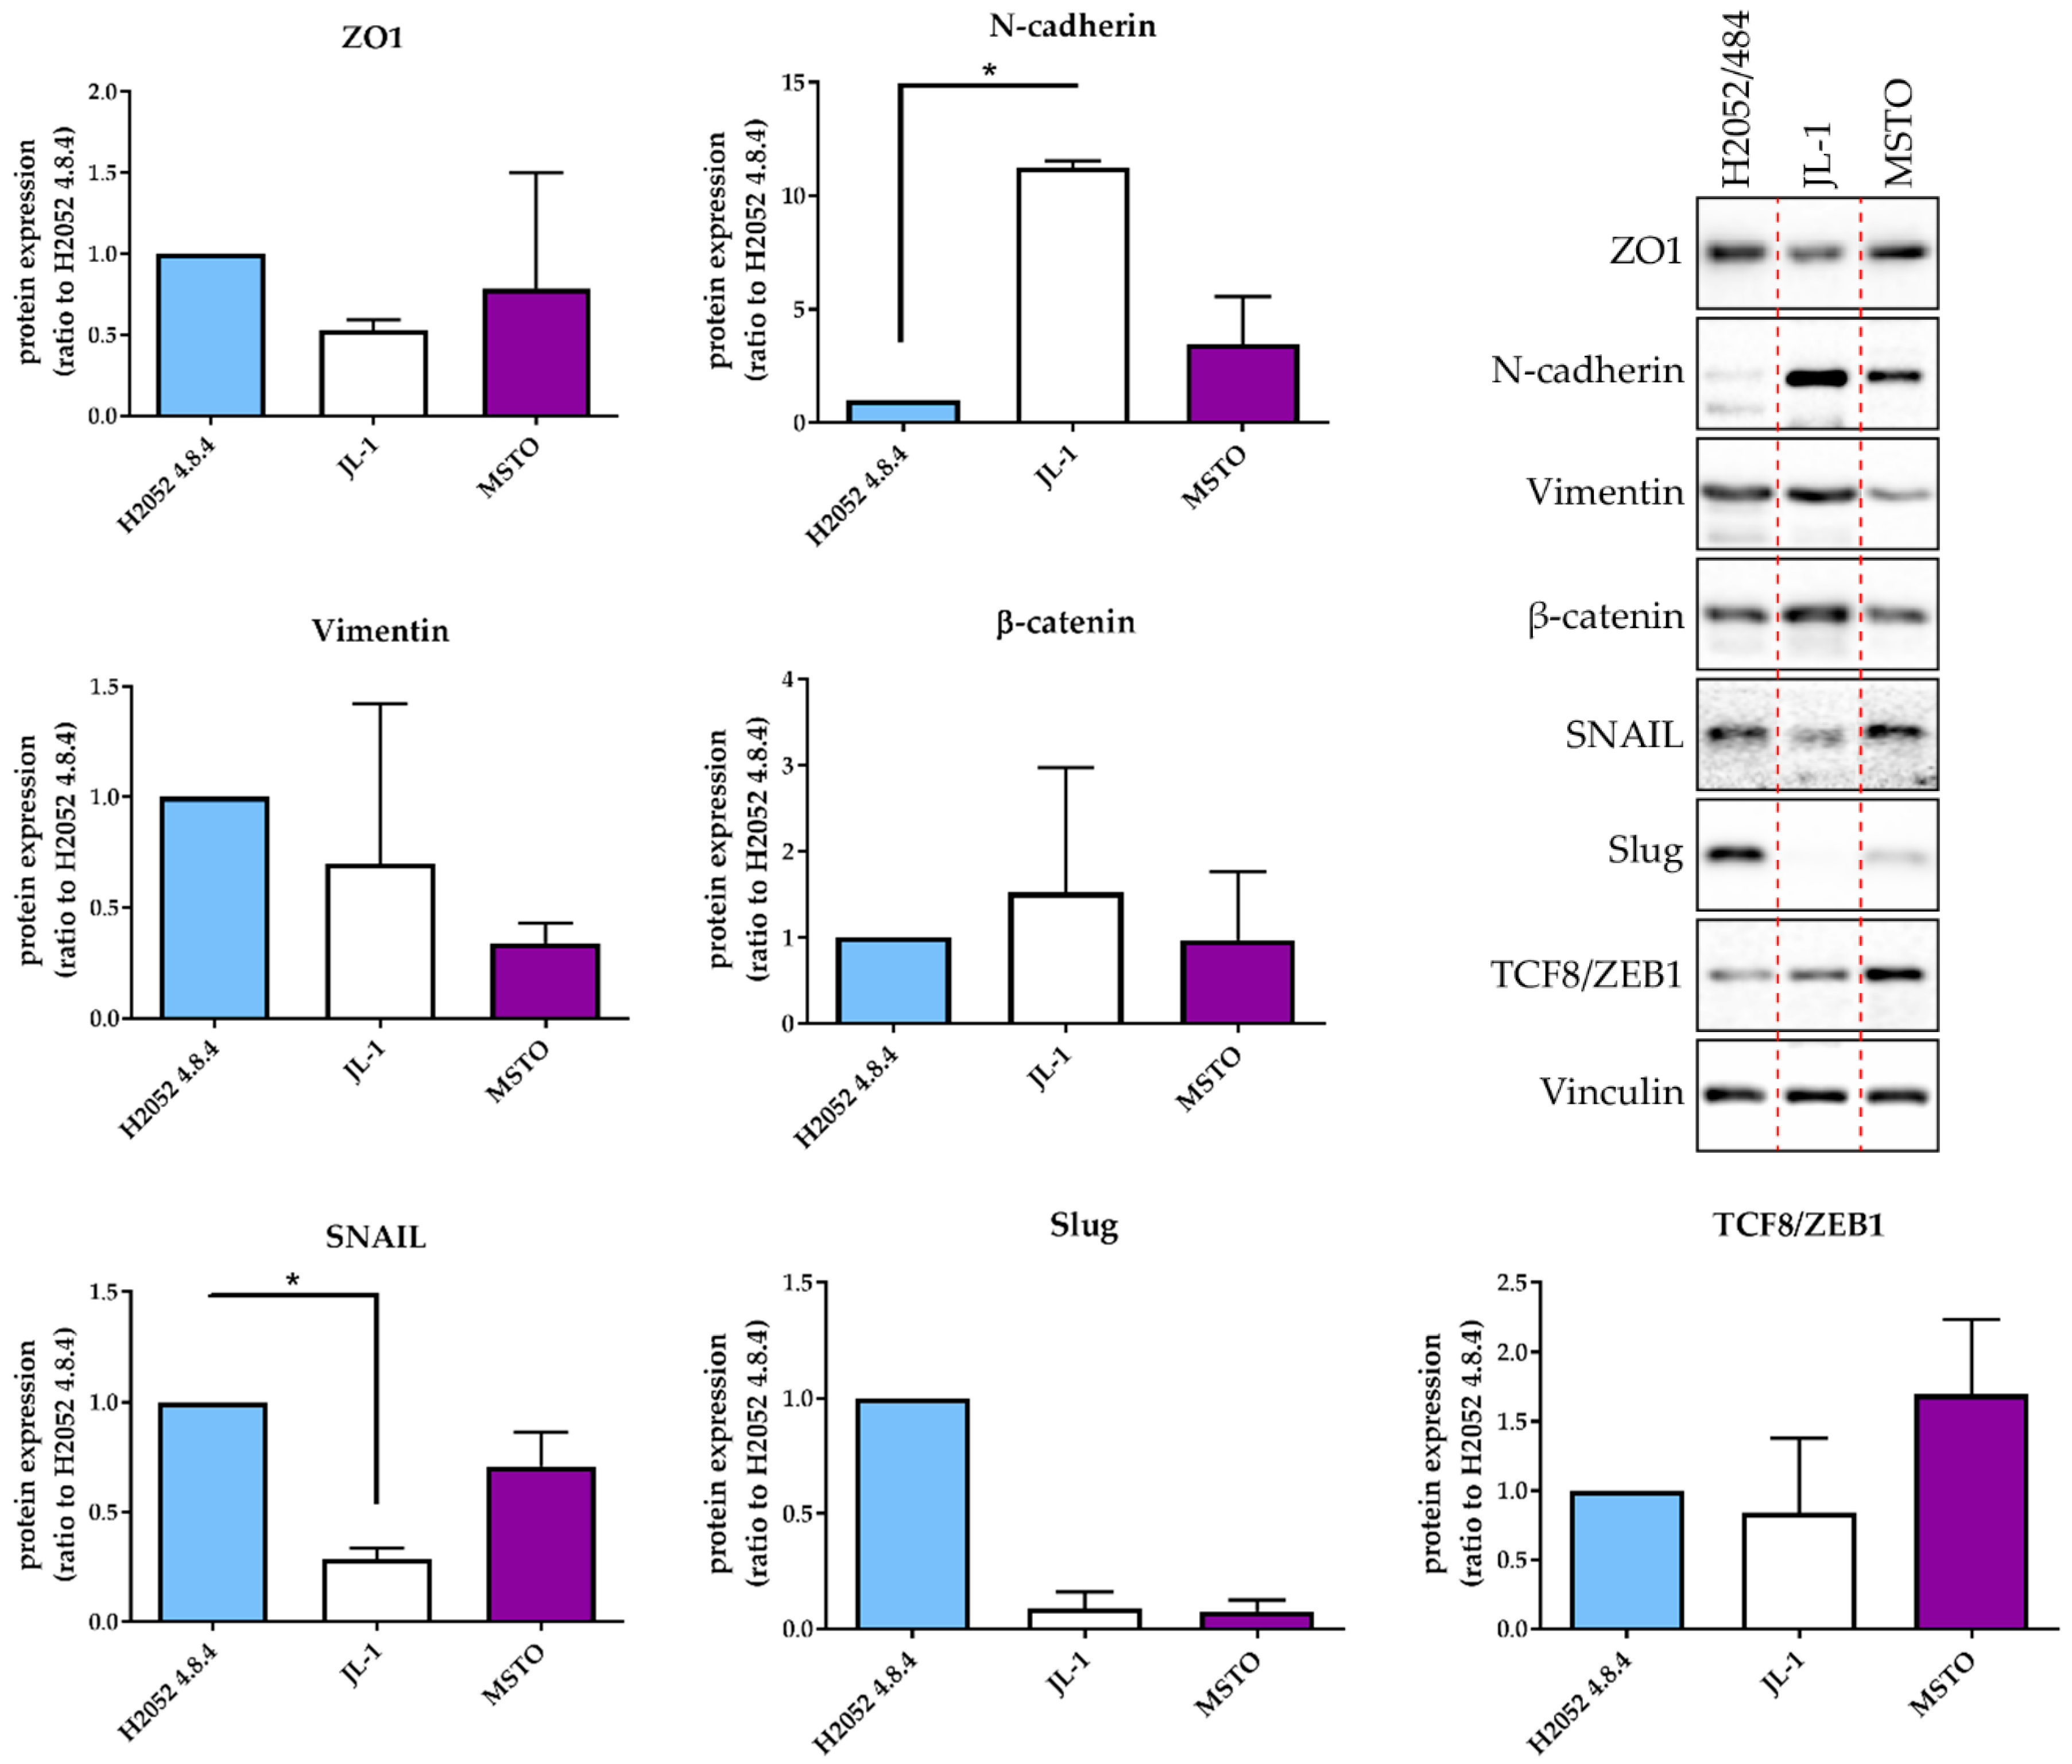
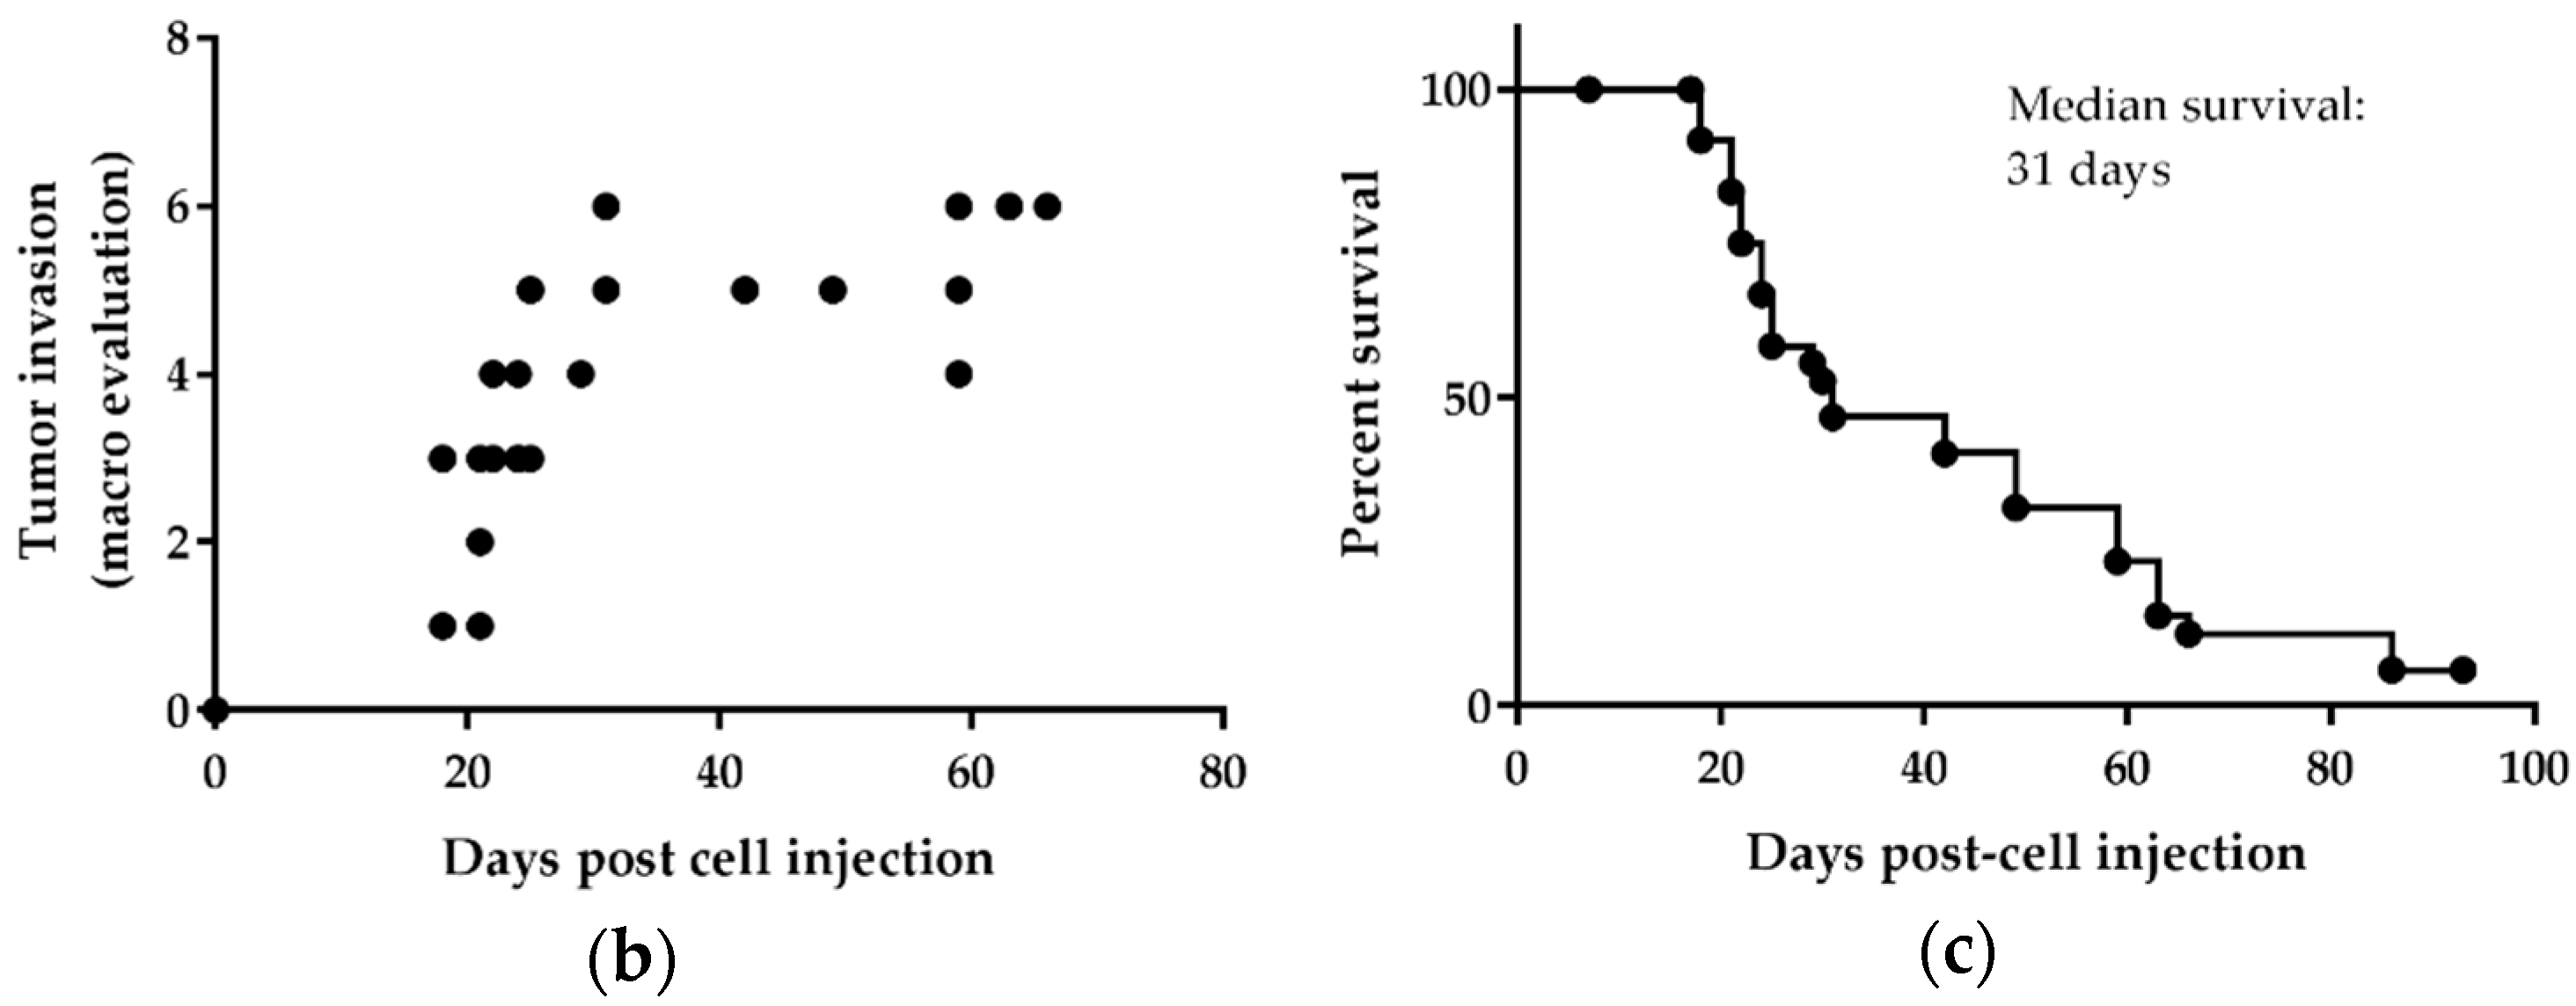
In order to assess the effect of the MIF/CD74 pathway in the development of MPM, we derived a new human MPM cell line expressing MIF, CD74, and CD44 and able to generate orthotopic intra-thoracic tumors. H2052/484 cells were obtained from the dissociation of a pleural tumor obtained after NCI-H2052 cell injection. Furthermore, H2052/484 cells conserved their mesothelioma phenotype and most characteristics of the parental H2052 cells. They demonstrated faster tumor growth than parental H2052 cells after intrathoracic injection in athymic mice. This higher tumor development may be related to higher levels of the EMT transcription factors Snail 2, Zeb1, and Zeb2. The activation of the EMT program is commonly observed in human cancers and is closely related to tumor invasiveness and progression [
7]. H2052/484 cells were modestly virulent in vivo, and the mice were found to tolerate a certain level of tumor burden (1 × 10
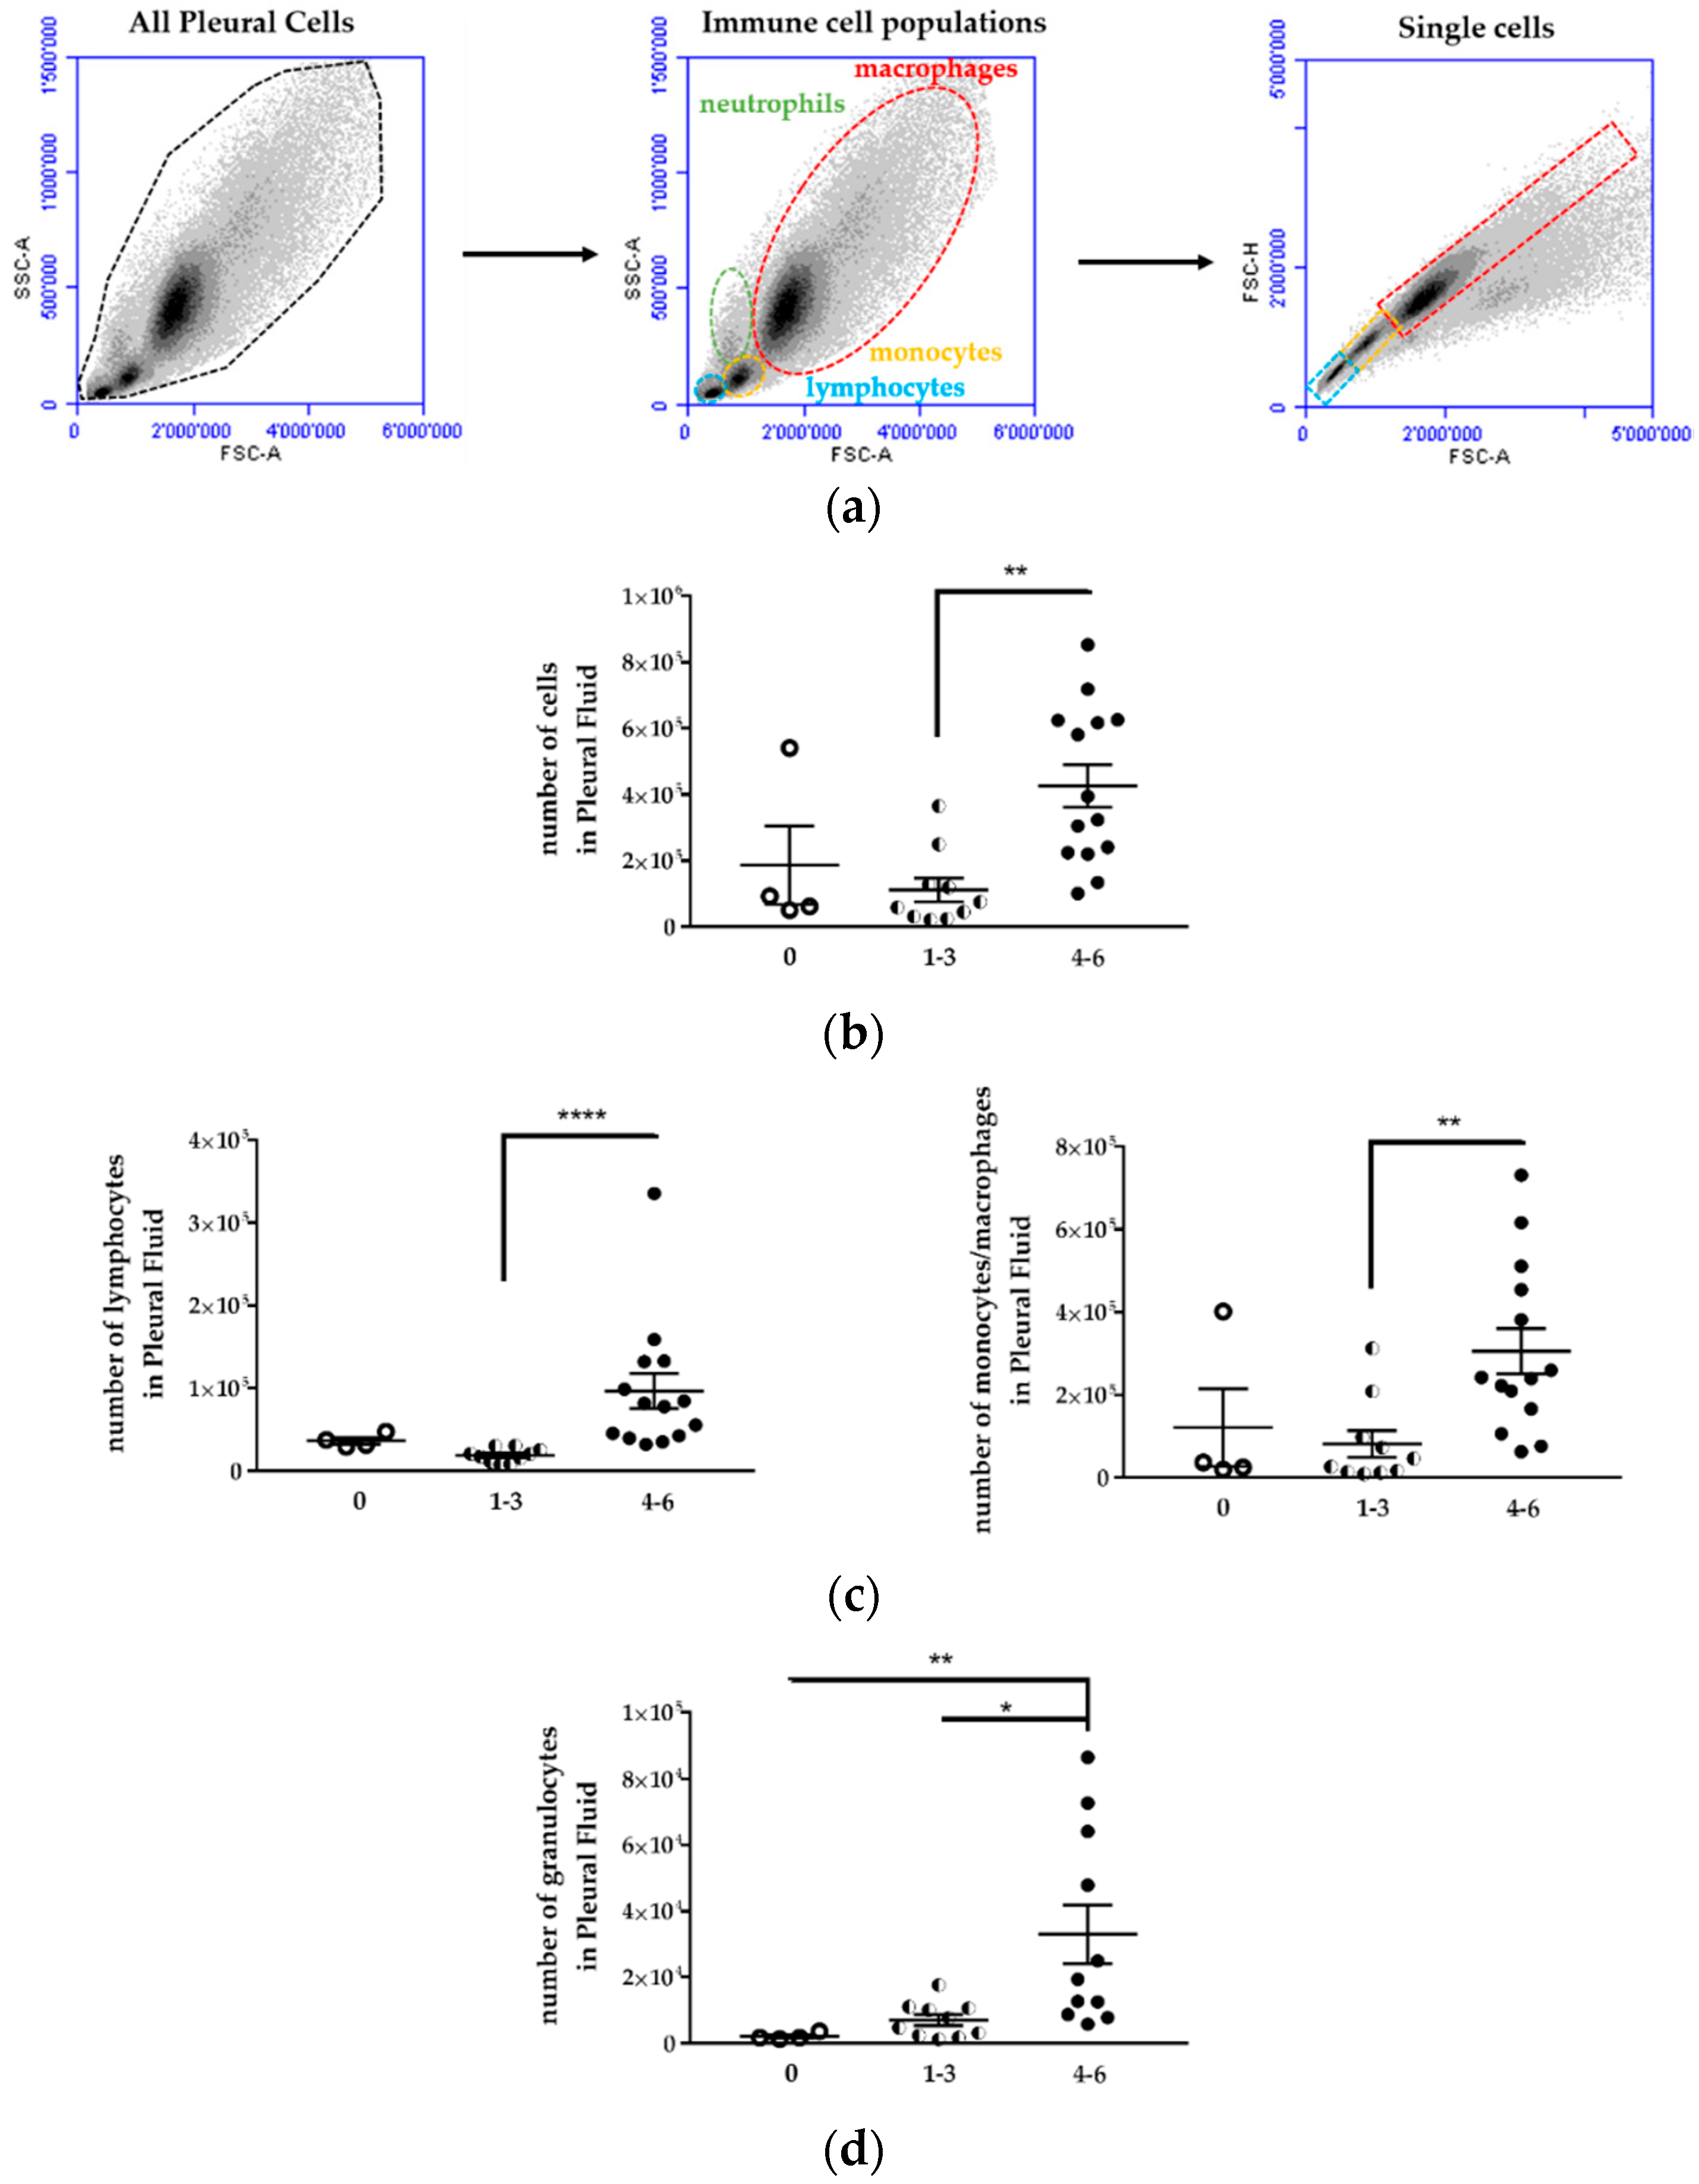
6 cells) over a two-week time course, without euthanasia requirements due to distress. Thus, this model represents a reproducible mean to test new therapies targeting the MIF/CD74 pathway as well as other pathways that promote the growth of MPM. This model provides a large time window to evaluate the anticancer effects of new treatments and possible tumor relapse and resistance due to subpopulations of cells that might escape therapy. We used athymic mice as hosts, given that our study objective was to evaluate the effects of the MIF/CD74 pathway inhibition on human MPM development in vivo. These mice are partially immunodeficient because of the lack of thymus [
8], which leads to a very poor response to thymic-dependent antigens [
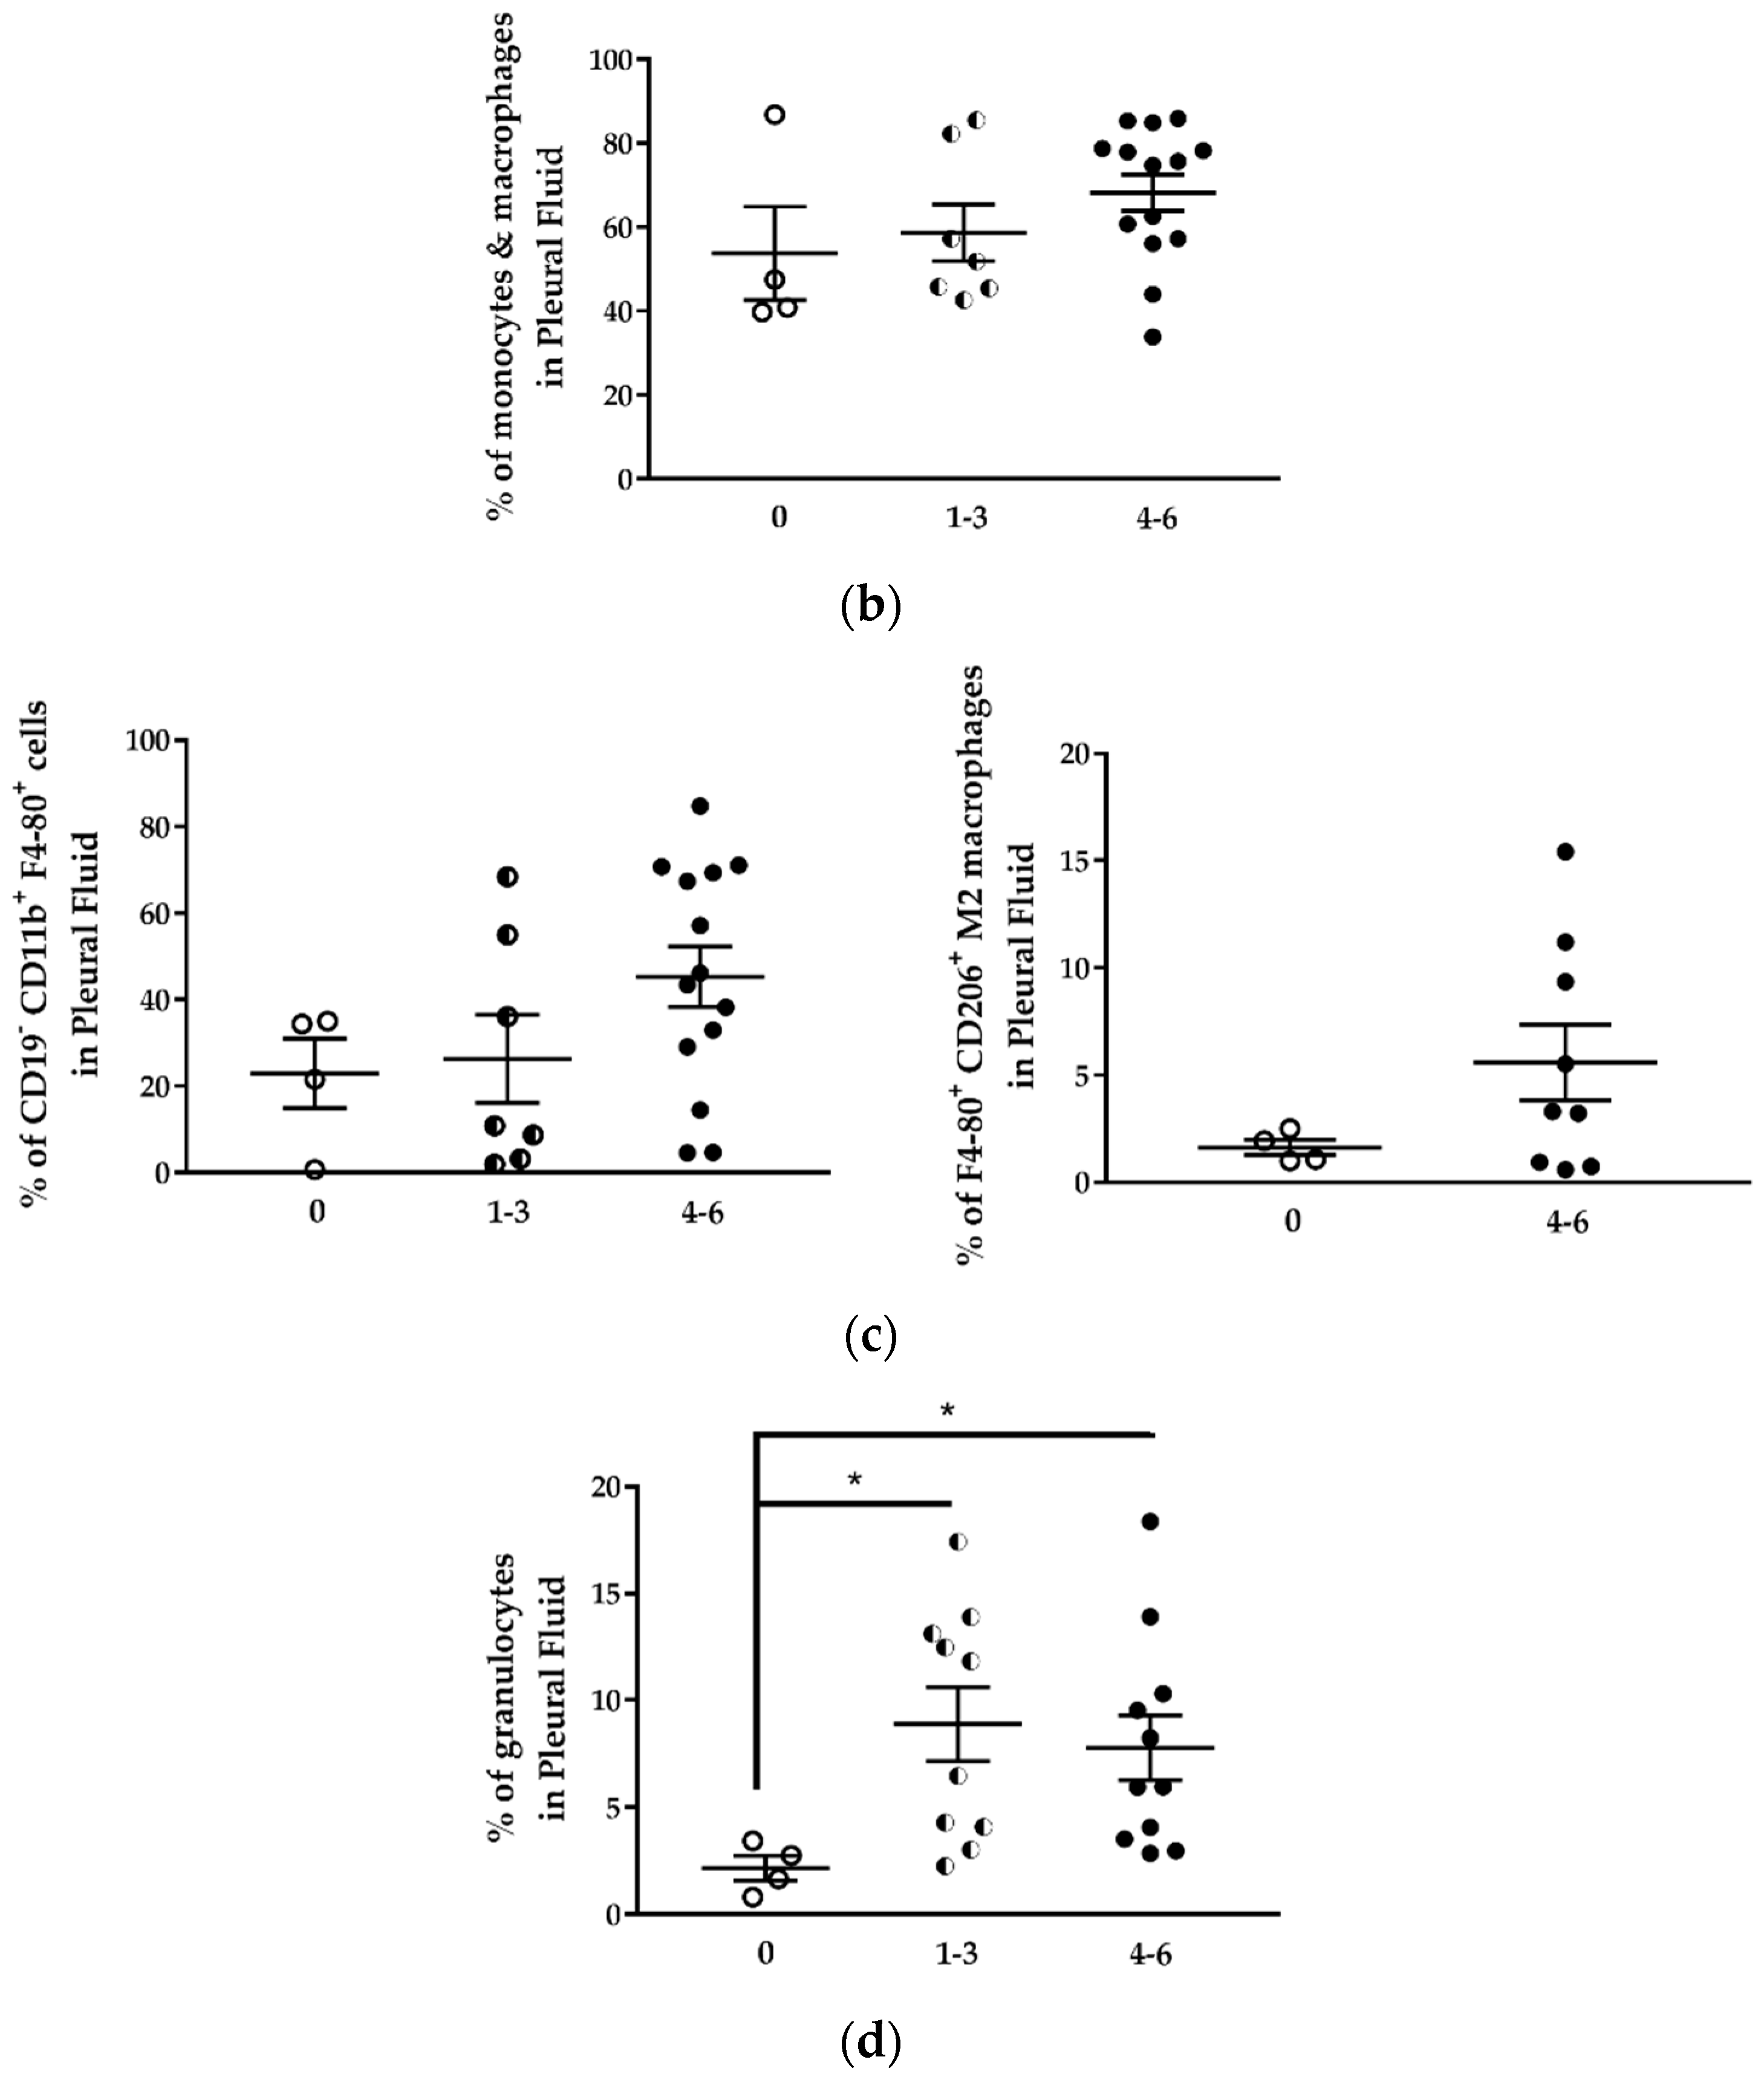
5]. Except for the lack of T lymphocytes, most other immune cell types are present in these mice, and we observed an increase in the immune cell population in the pleural fluid with the increase of tumor development. CD19
+B220
+ B lymphocytes and NK cells (CD49b
+) were identified in the pleural fluid. No expansion of these populations was observed in tumor-bearing mice compared to mice without tumors. Myeloid-derived suppressor cells (CD11
+Gr1
+), monocytes (CD19
−CD11b
+), and macrophages (CD19
−CD11b
+F4/80
+) were also detected in the pleural fluid. Interestingly, MDSC and macrophages (especially CD206
+ M2 macrophages) expanded during MPM development as previously shown in an immunocompetent mouse model of mesothelioma [
6]. The lack of T cells in nude mice is not an obstacle to study the relationship between inflammatory cells and mesothelioma development. Indeed, Jackaman et al. have shown [
6], using an immunocompetent mouse model, that the suppressive role of regulatory T cells is important during the early stages of mesothelioma tumor evolution, but, in advanced-stage mesothelioma, myeloid cells and macrophages are major regulatory cells, as confirmed in our study. Both cell types have been shown to promote tumor growth, recurrence, and tumor burden in multiple ways, including promotion of angiogenesis and immunosuppressive activity [
9,
10]. Several studies reported a role for macrophage migration inhibitory factor (MIF) in promoting MDSC and macrophage accumulation and immunosuppressive activity in several cancers [
11,
12]. We previously showed that human MPM expresses MIF and its receptor CD74 and that this pathway is important for MPM cells proliferation [
3]. In this model, MIF secretion by H2052/484 tumor cells may attract immunosuppressive cells such as MDSC and polarized macrophages toward an immunosuppressive M2 phenotype, thus promoting tumor growth. We plan to evaluate the effect of MIF inhibitors on H2052/484 development. The data obtained on the extent of tumor development and the immune cell types present in the local (pleural) tumor environment should help us to design new therapies. Then, these new agents should be validated on other mouse models such as humanized mouse models. In these models, immunocompromised mice (generally non-obese diabetic (NOD) scid gamma and NOD Rag gamma mice characterized by a great immunodeficiency) are immunologically reconstituted with human immune cells. The effects of MIF inhibitors on the total human immune cell populations could be characterized.
In summary, this study shows that the orthotopic xenotransplantation model of H2052/484 MPM cells in nude mice is a reproducible model to study the functional and mechanistic effects of new treatments for MPM. This model can be used to test the therapeutic effects of MIF inhibition on human MPM development and possibly to develop new therapies for this fatal disease.
4. Materials and Methods
4.1. Isolation of H2052/484 Cells and Cell Culture
The MPM cell lines H28 (NCI-H-28), H2052 (NCI-H2052), and MSTO (MSTO211H) were purchased from American Type Culture Collection (Manassas, Virginie, VA, USA). The MPM cell lines JL-1 was established and characterized in our laboratory from human biopsies [
13]. H2052/484 cells were subcultured after mechanical dissociation of an orthotopic tumor explanted 102 days after an intrapleural implantation of 1 × 10
6 NCI-H2052 cells into an athymic Nude-
Foxn1nu nu/nu. All cells were routinely cultured in RPMI 1640 medium containing 10% (
v/
v) fetal bovine serum (complete RPMI, Life Technologies, Carlsbad, CA, USA). The cultures were grown at 37 °C in 5% CO
2.
4.2. Total RNA Isolation and Real-Time RT-PCR
The expressions of CDH1, CDH2, VIM, TWIST, SNAIL1, SNAIL2, ZEB1, ZEB2, MIF, CD74, GAPDH, GUSB, EEFLA1, and TBP mRNAs were evaluated by quantitative RT-PCR analysis. Total mRNA from each cell lines was extracted by InViTrap® Spin Universal RNA Mini kit (Stratec, Birkenfeld, Germany) according to the manufacturer’s instructions.
Reverse transcription and Real-time RT-PCR was performed at the same time using ONE-step kit Converter (Takyon-Eurogentec UF-RTAD-D0701, Eurogentec, Liège, Belgium) and No ROX SYBR MasterMix blue dTTP (Takyon Eurogentec UF-NSMT-B0101, Eurogentec, Liège, Belgium). Real-time RT-PCR was performed on each sample in duplicate with 50 ng cDNA per condition, using a Biorad CFX Connect Real Time system. SYBR green primer sequences for the targeted human genes are available upon request. The results were normalized to the expression levels of housekeeping genes, including GAPDH, GUSB, EEFLA1, and TBP genes.
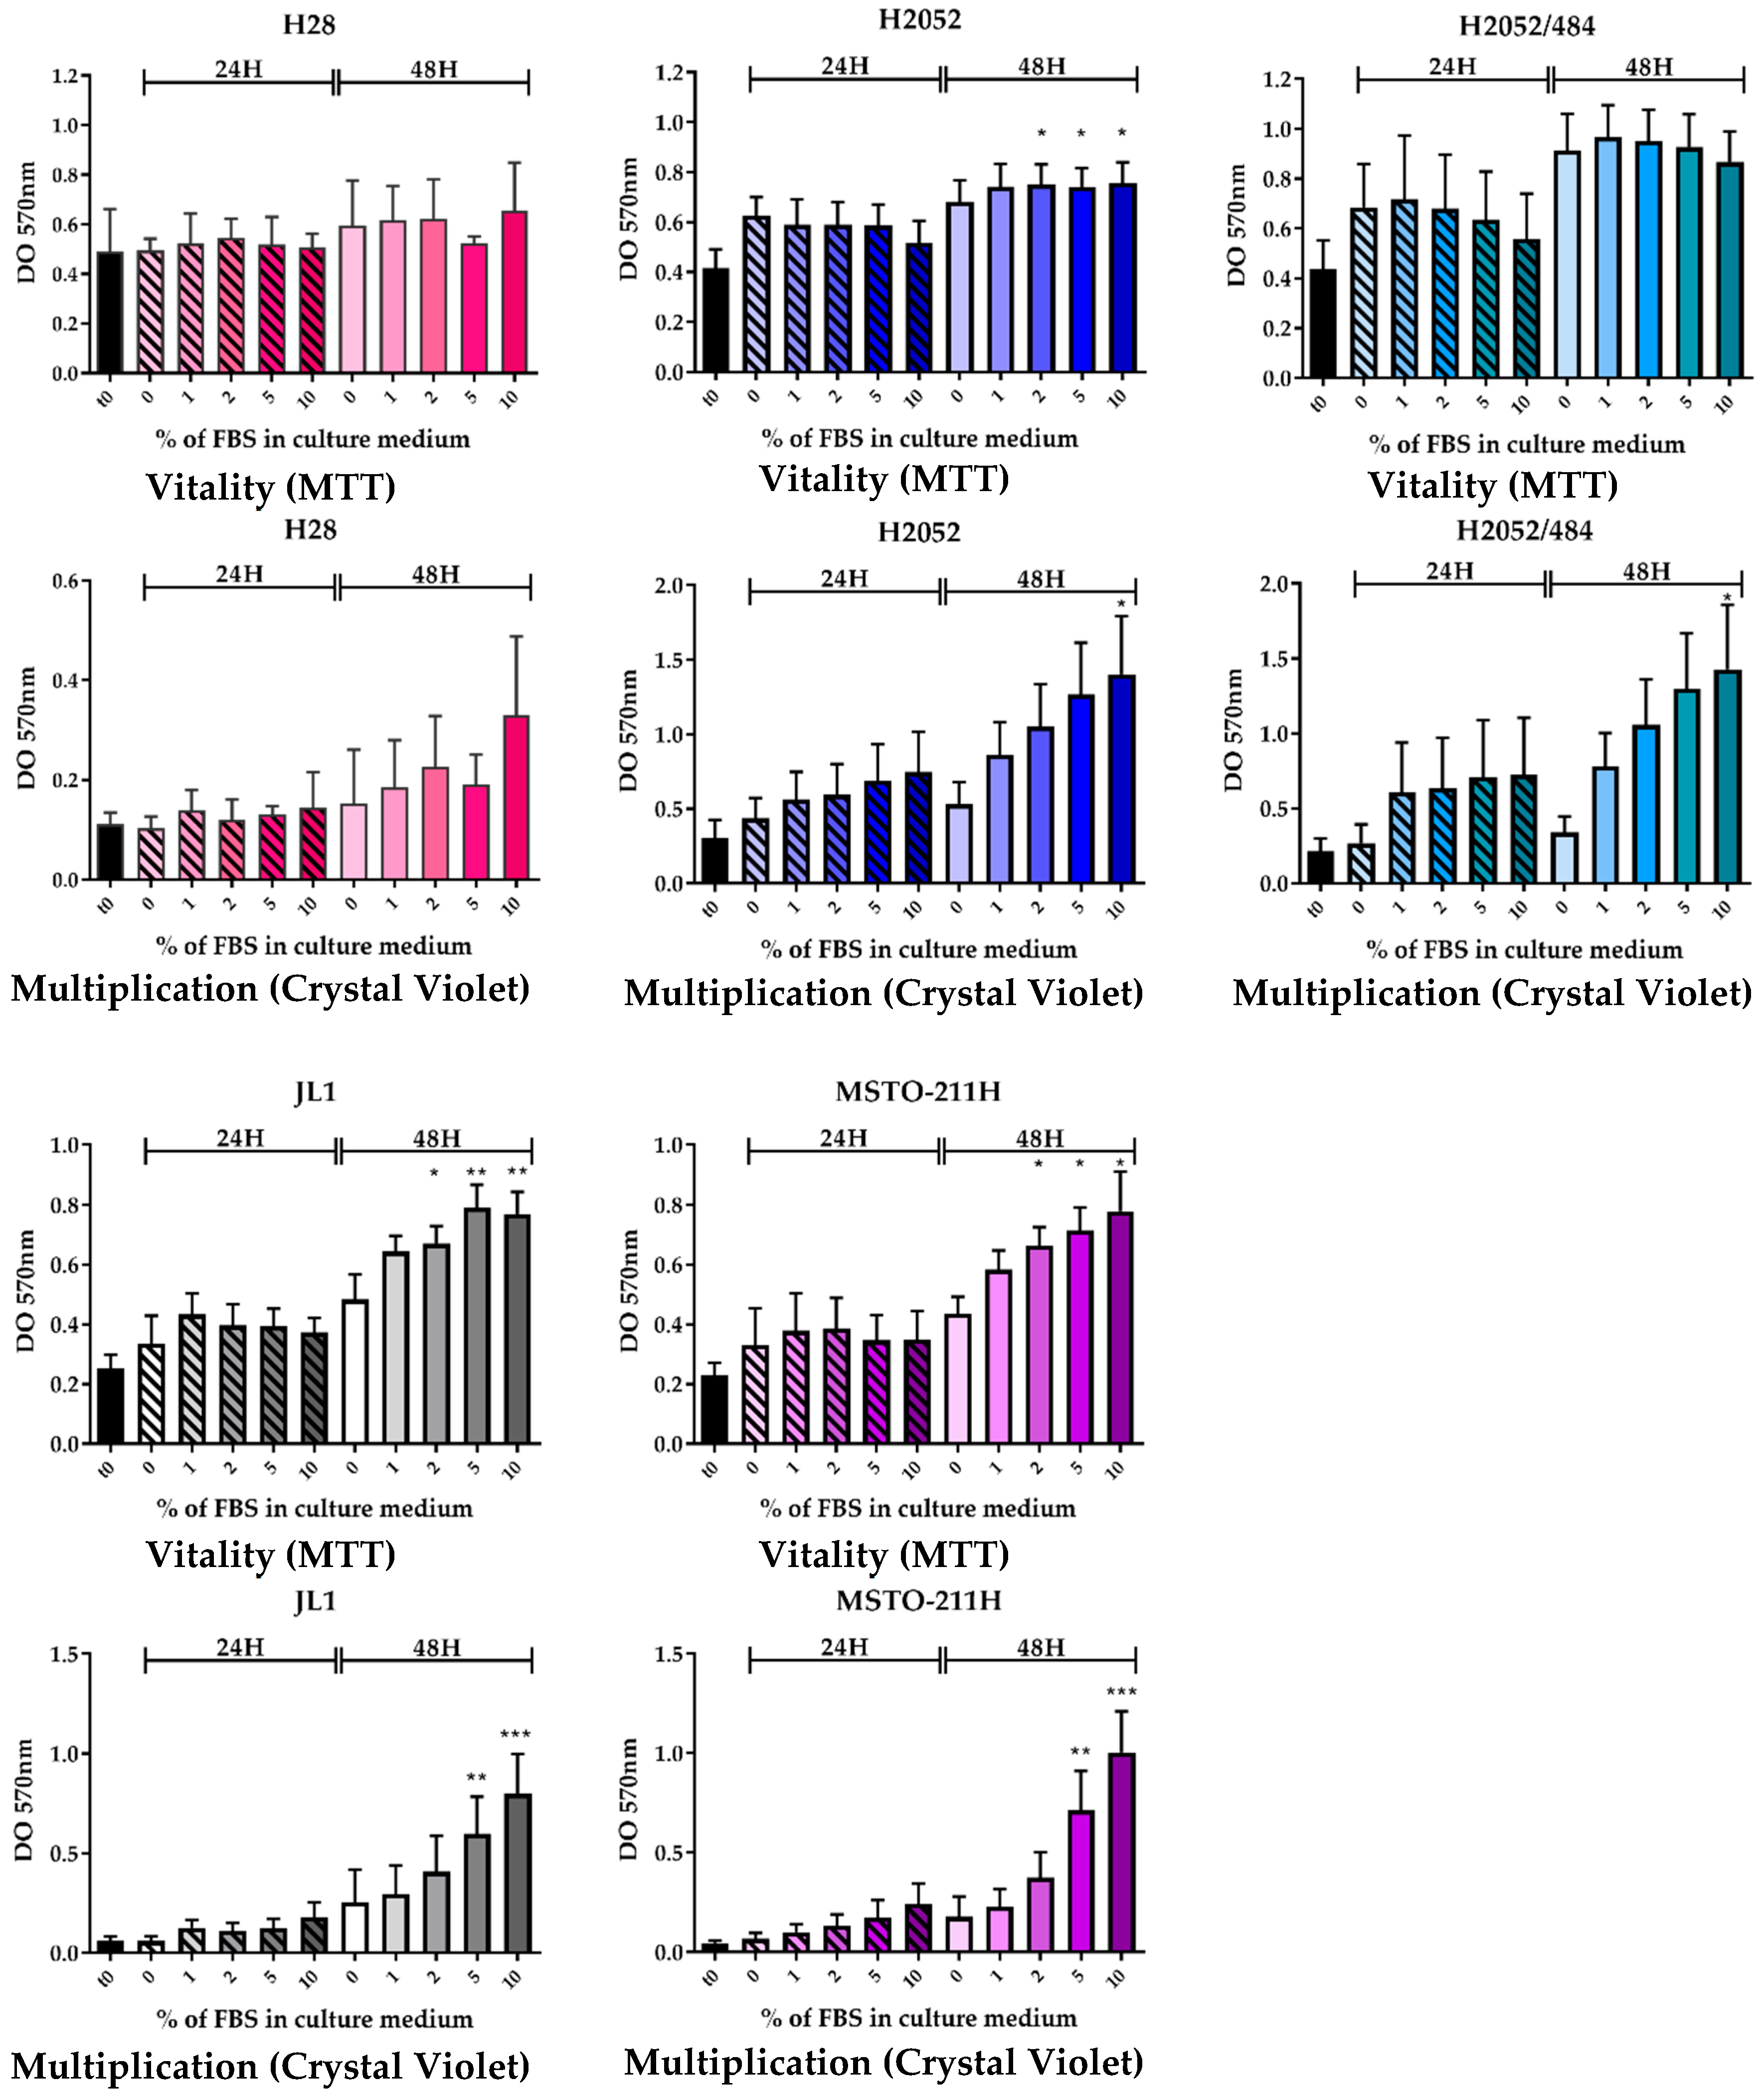
4.3. Cell Growth and Vitality
Five thousand cells per well were cultured into 96-well microplates in complete RPMI. After cell adhesion, the medium was replaced, and the cells were cultured in RPMI without or with increasing concentrations of FBS for 24 h and 48 h at 37 °C. Cell growth was determined by crystal violet staining. Briefly, after fixation with formalin 10%, the cells were stained with 0.1% crystal violet (Sigma-Aldrich Corp., St. Louis, MO, USA) for 30 min at room temperature. The cells were lysed in a 10% acetic acid solution for 30 min at room temperature. The absorbance was read in a spectrophotometer at 570 nm.
Cell vitality was determined by the reduction of 3-(4,5-dimethylthiazol-2-yl)-2,5-diphenyltetrazolium bromide (MTT, Sigma-Aldrich Corp., St. Louis, MO, USA). The MTT solution (500 µg/mL in RPMI) was added for 2 h at 37 °C. The cells were lysed with dimethyl sulfoxide. The absorbance was read in a spectrophotometer at 570 nm.
4.4. Cell Lysis and Western Blotting Analysis
The samples were lysed in RIPA buffer (50 mM Tris, 150 mM NaCl, 0.1% SDS, 0.5% Sodium deoxycholate, 1% Igepal CA630, 2 mM EDTA, 50 mM NaF, pH 8) supplemented with a protease inhibitor cocktail (Roche Molecular Diagnostics, Pleasanton, California, CA, USA) and titrated using the DC Protein Assay (Bio-Rad Laboratories, Hercules, California, CA, USA). Amounts of 5 to 20 μg of proteins were separated by SDS-PAGE and transferred onto nitrocellulose membranes (Amersham, Little Chalfont, UK). The membranes were blocked 1 h at room temperature, incubated overnight at 4 °C with primary antibodies (EMT sampler kit, 9782 Cell signaling (Danvers, Massachusetts, MA, USA) and B-Actin, A2066 Sigma-Aldrich (Sigma-Aldrich Corp., St. Louis, MO, USA), incubated for 1 h with secondary antibodies (Bio-Rad Laboratories, Hercules, California, CA, USA), and developed using a standard ECL protocol. The quantifications were performed by using a ChemiDoc MP and the Image Lab software (Bio-Rad Laboratories, Hercules, California, CA, USA).
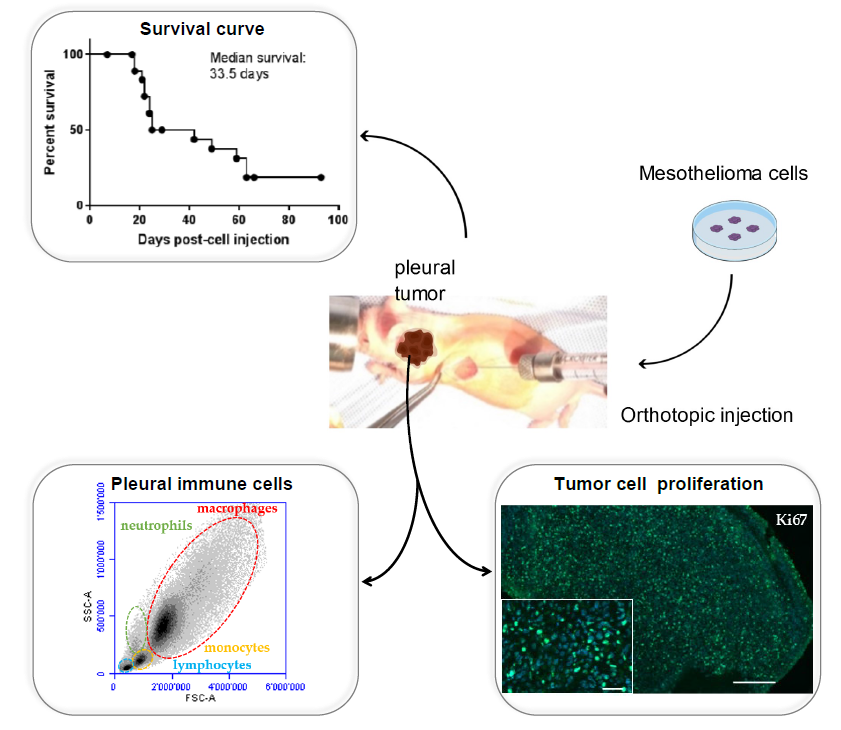
4.5. In Vivo Development of H2052/484 MPM Cells in Nude Mice
The mice were anaesthetized with isoflurane. Buprenorphin (analgesic) was injected subcutaneously. (0.05 mg/kg). MPM H2052/484 cells were injected into the left pleural cavity (1 × 10⁶ tumor cells suspended in 50 µL of RPMI) of 19-week-old athymic female nude mice nu/nu (Envigo, Huntingdon, UK) (n = 28). Briefly, the mouse was placed on the left side (left lateral decubitus). A 0.5 to 1 cm incision of the skin was made to expose the ribs. An amount of 50 µL of cell suspension was slowly injected into the intercostal space on the right dorsal mid-axyllary line just below the inferior border of the scapula. The wound was closed with three to four absorbable sutures. Anesthesia was stopped. The mouse was placed under a heat lamp until awake.
2-deoxy-2-[18F]fluoro-d-glucose ([18F]FDG)-PET/computed tomography (CT) scans were used to follow the intrapleural tumor growth. PET/CT was performed using a Triumph PET/SPECT/CT system (Trifoil, Chatsworth, CA, USA) on mice fasted for 12 h. An amount of 5–6 MBq of [18F]FDG was i.v. injected retro-orbitally on anesthetized mice. The mice were then left awake at RT during an uptake time of 60 min. Subsequently, 700 μL of 132 mg/mL meglumine ioxitalamate (Telebrix, 6% m/v iodide, Guerbet AG, Zürich, Switzerland) was injected intraperitoneally in mice to delineate the abdominal region, and the mice were subjected to CT scans. Images were obtained at 80 kVp, 160 μA, and 1024 projections were acquired during the 360° rotation, with a field of view of 71.3 mm (1.7× magnification). Sixty min after the [18F]FDG injection, PET scans were started for a duration of 20 min. PET scans were reconstructed with the built-in LabPET software (Triumph-Adler, Nuremberg, Germany), using an OSEM3D (20 iterations) algorithm, and the images were calibrated in Bq/mL by scanning a phantom cylinder. Reconstruction of the CT scans was performed with the Triumph XO software (Triumph-Adler, Nuremberg, Germany) that uses a matrix of 512 and a voxel size of 0.135 mm. CT scans and PET scans were co-registered using the plugin Vivid (Trifoil) for Amira (FEI, Hillsboro, OR, USA) and exported as dicom files. The software Osirix (Pixmeo, Bernex, Switzerland) was used to quantitatively analyse the datasets and generate pictures.
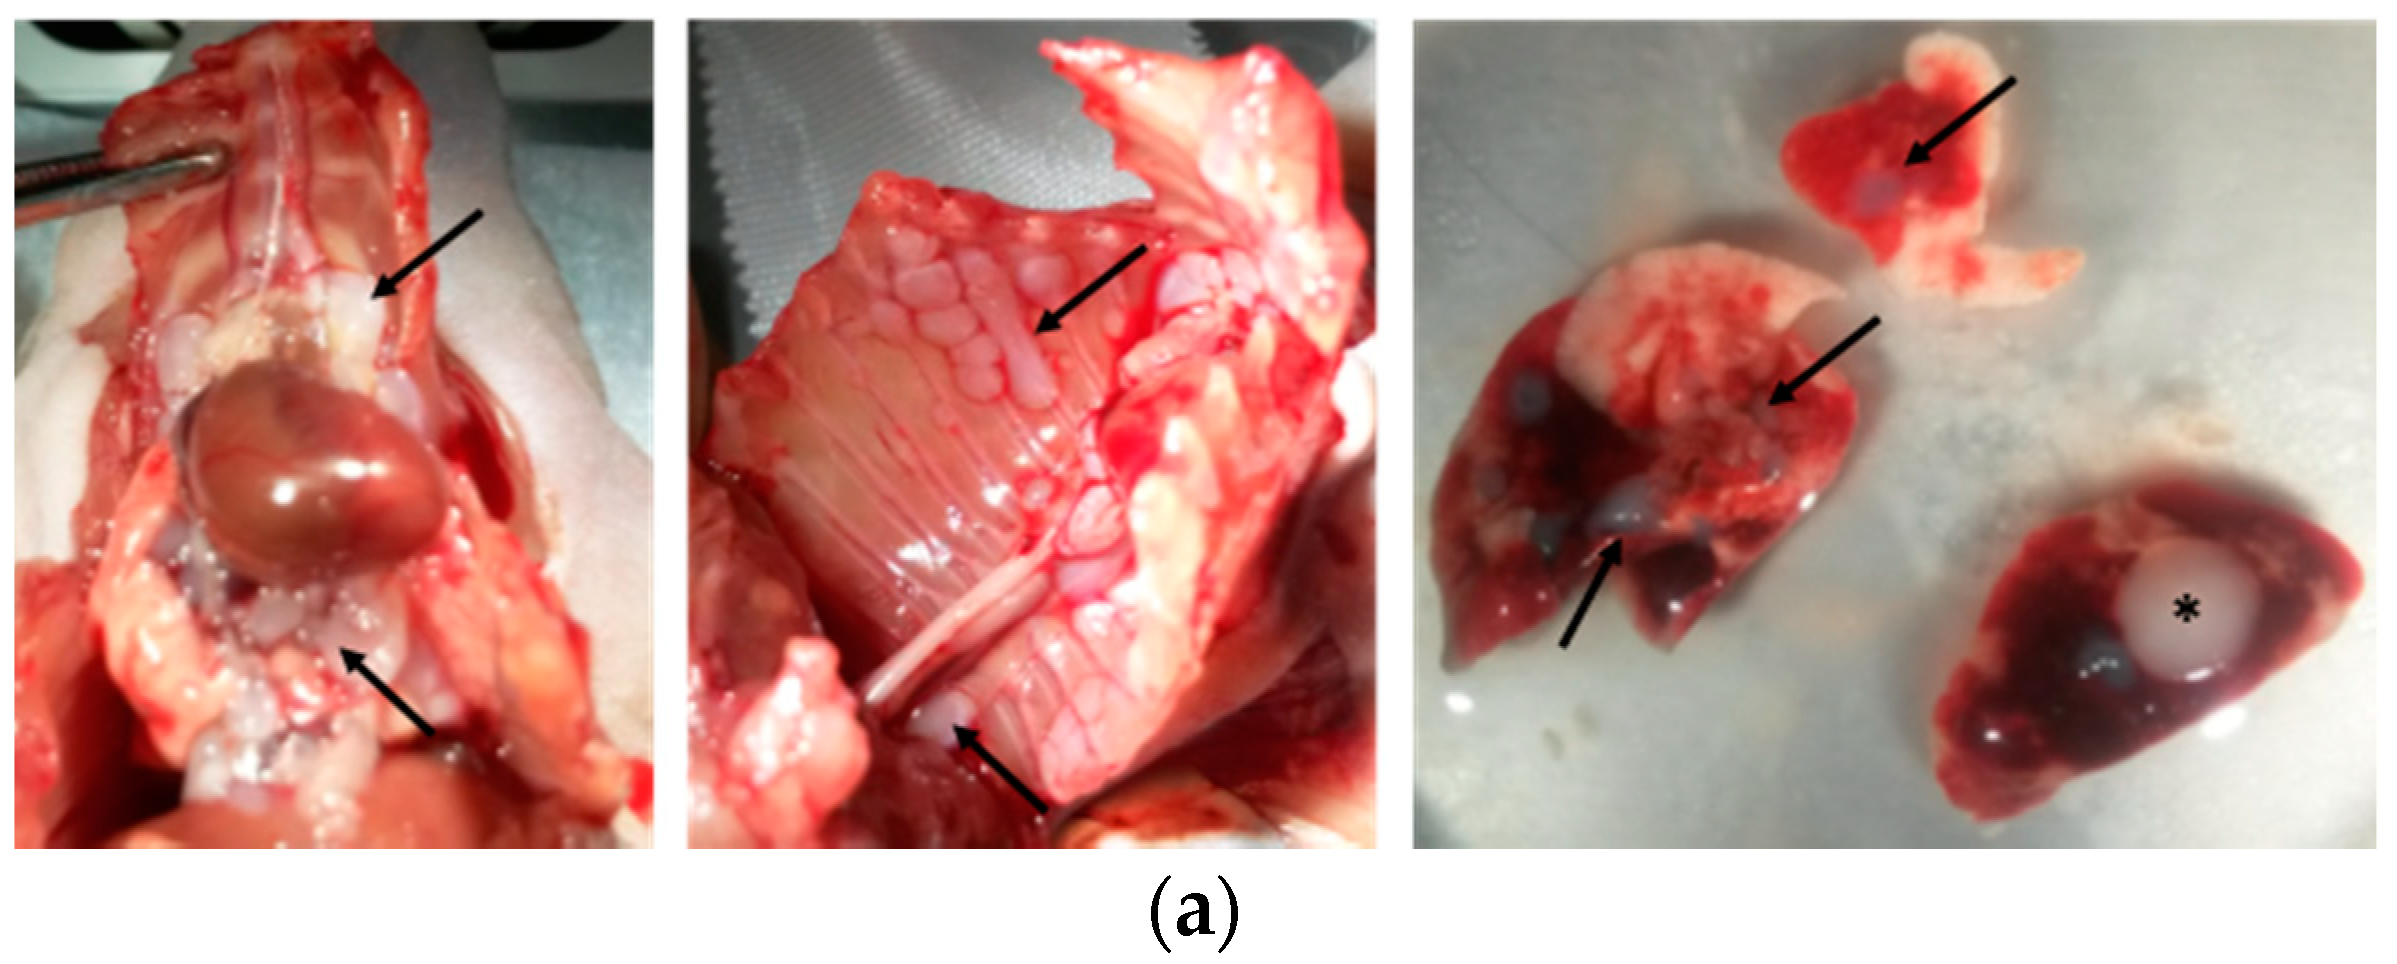
Two weeks after cell injection, the mice were checked every other day by observers for signs of morbidity. Euthanasia endpoints were chosen to minimize the distress of the transplanted mice. They were defined in a previous pilot study in which body weight, body condition scoring, appearance, and behavioral assessments were used to evaluate morbidity in this orthotopic mouse model of mesothelioma. The following criteria were determined: significant tumor growth and/or malignant pleural effusion in the thoracic cavity (detected by PET/CT imaging), labored breathing, abnormal posture, dehydration, and weight loss of 15% within a few days. This study was conducted under protocols revised and approved by the institutional animal care and use committee and by Geneva’s veterinarian state office.
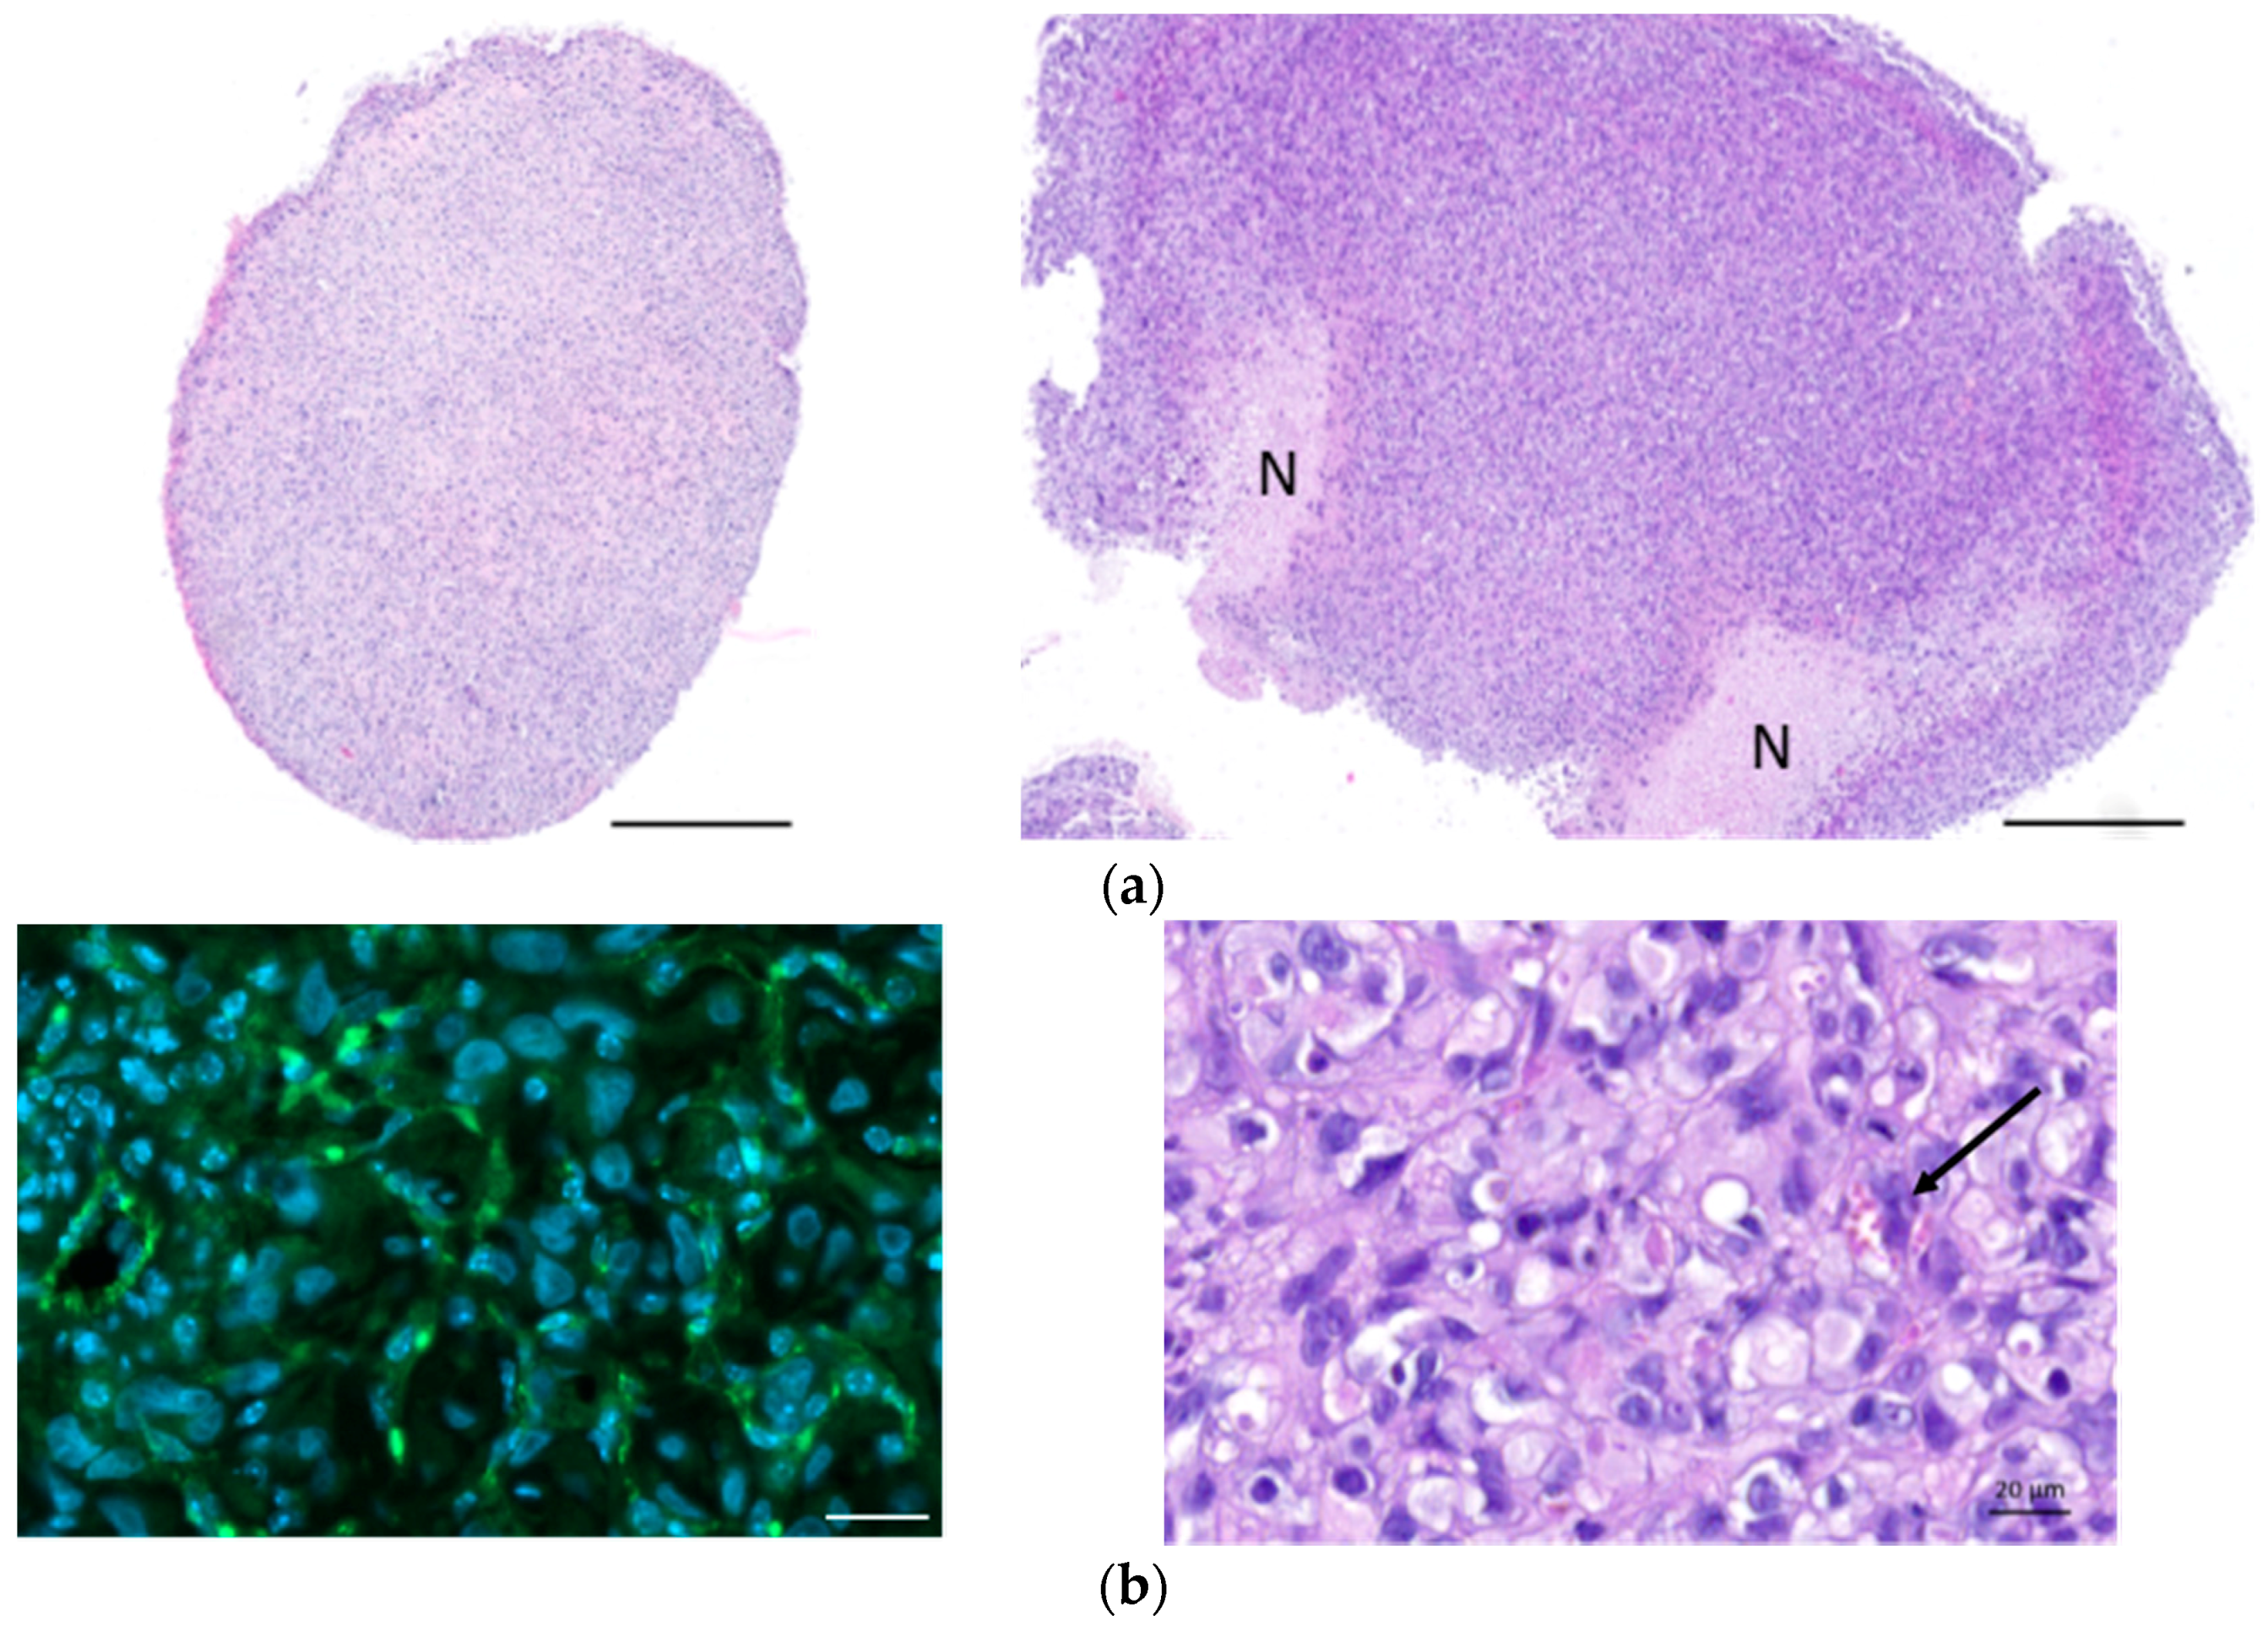
When committee-approved endpoints (authorization GE/106/16 approved by the “Direction Générale de la Santé”, Republic of Geneva, 19 July 2016, 25291) were achieved, the mice were euthanized and closely examined for the presence of thoracic tumors. For each euthanized mouse, blood was drawn from the heart. For histology, spleen, lung, and tumors were explanted and fixed in 10% neutral buffered formalin.
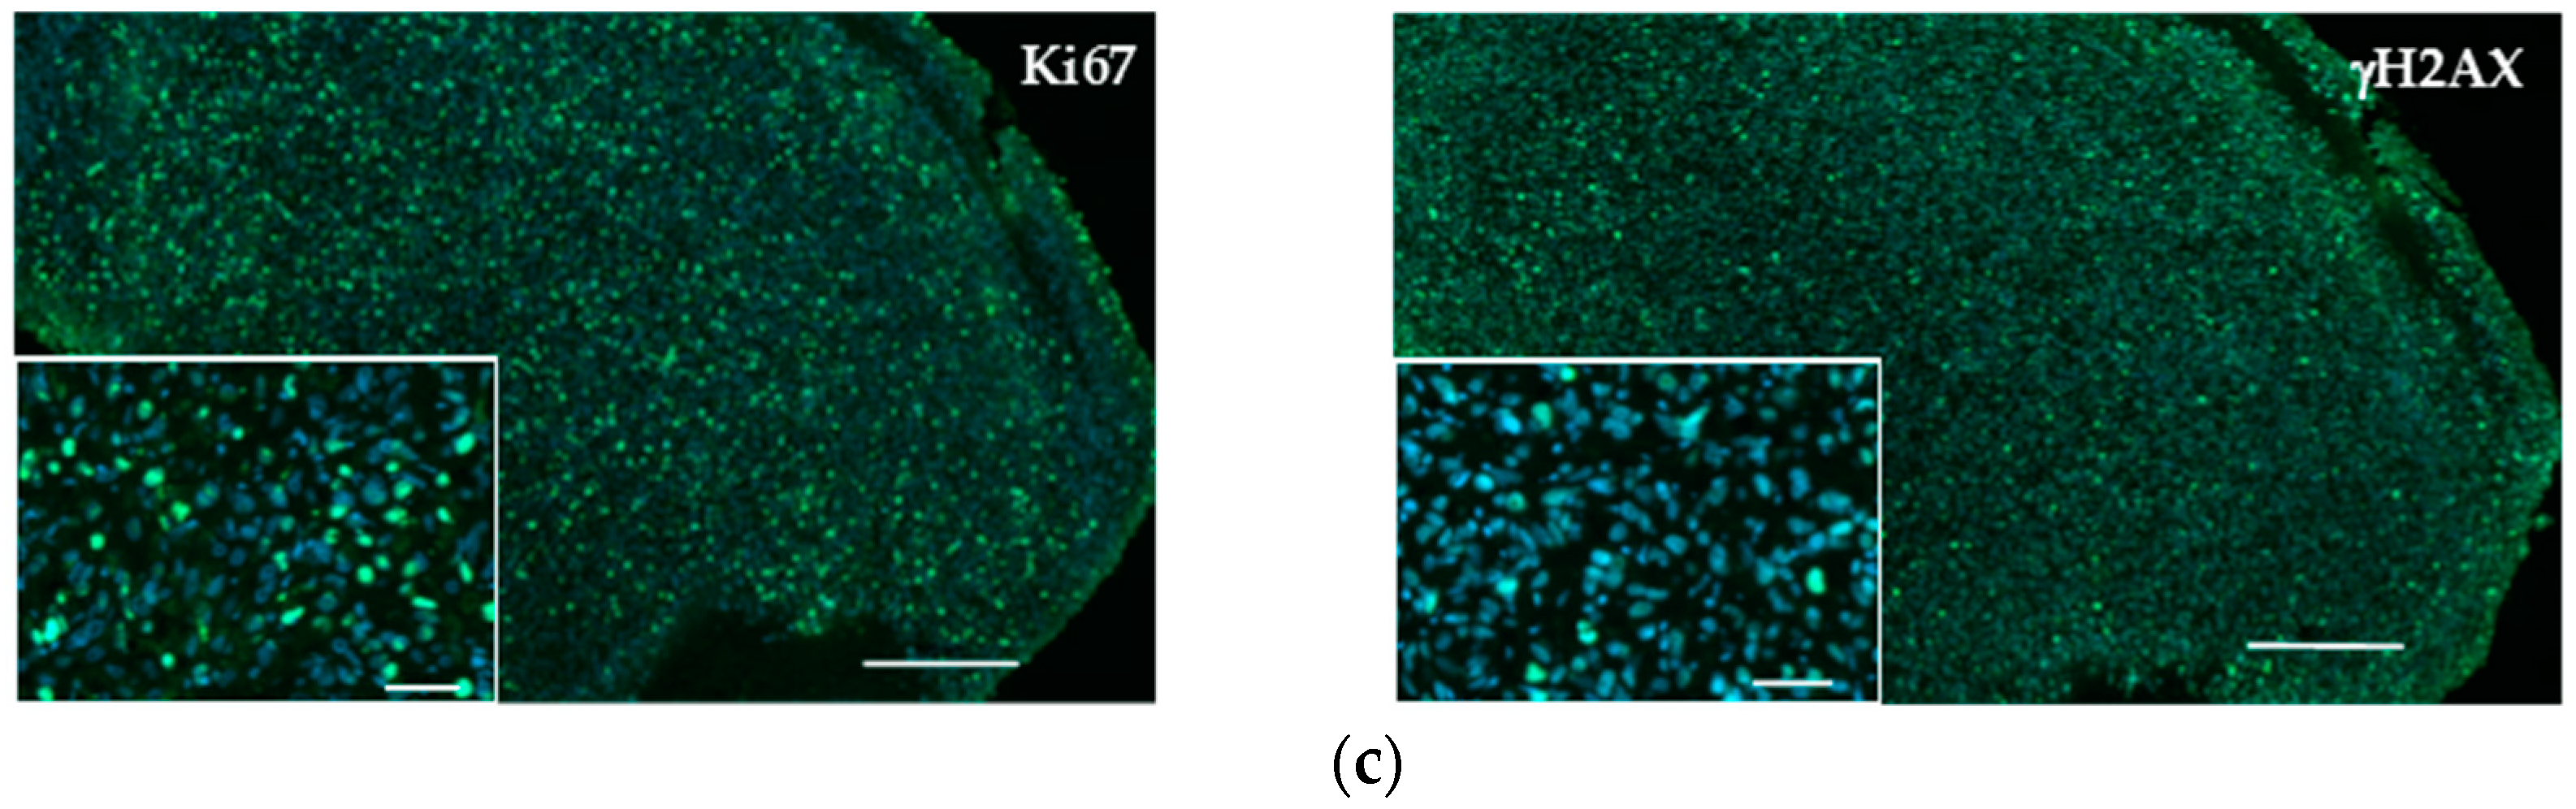
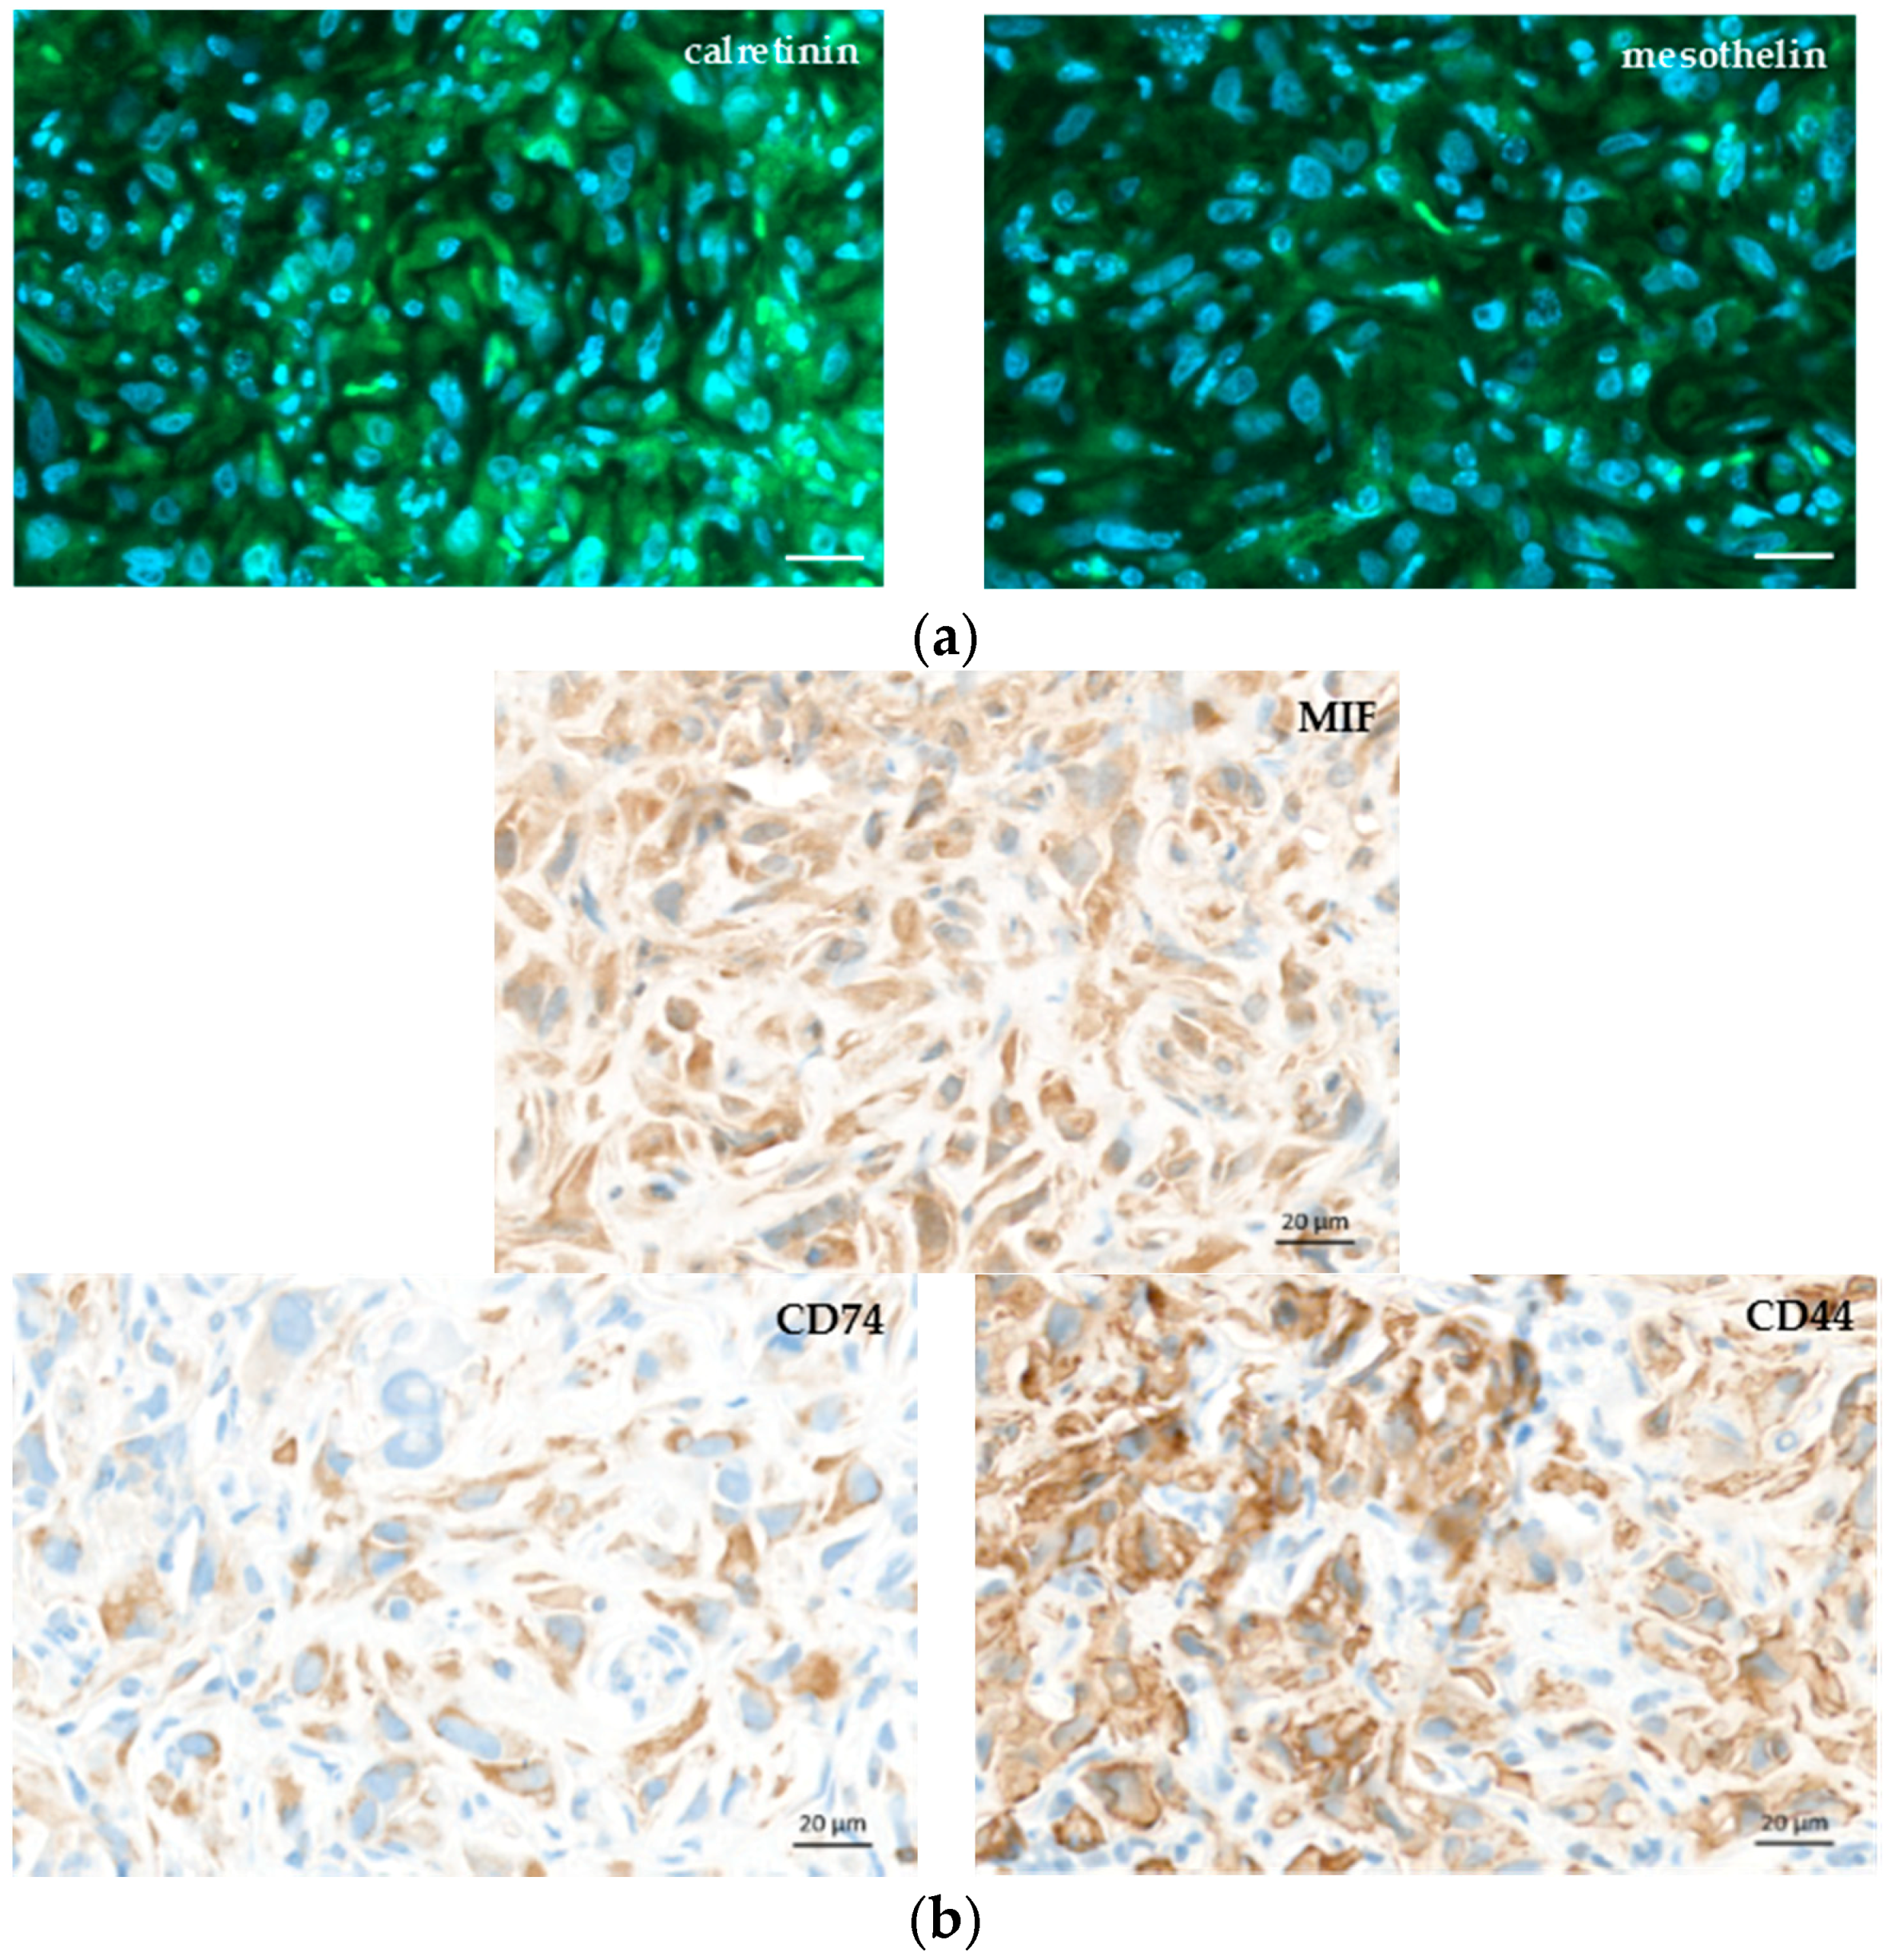
4.6. Immunohistochemistry Analysis
The MPM samples fixed in formalin were embedded in paraffin. Four-μm-thick MPM tumor sections were cut and stained with haematoxilin-eosin (HE) or analyzed by immunohistochemistry. Labeling with anti-MIF (gift of Thierry Roger, Lausanne, Switzerland), anti-CD74 (HPA010592, Sigma-Aldrich Corp., St. Louis, MO, USA), and anti-CD44 antibodies (HPA005785, Sigma-Aldrich Corp., St. Louis, MO, USA) was performed using the Ventana Discovery automated staining system (Ventana Medical Systems, Tucson, AZ, USA). Ventana reagents for the entire procedure were used. Antigen retrieval was performed by heating the slides in CC1 cell conditioning solution for 20 min (EDTA antigen retrieval solution pH 8.4; 20 min for CD74 and CD44, 36 min for MIF). The slides were incubated 30 min at 37 °C with primary antibodies diluted at 1/300 (MIF), 1/1000 (CD74), and 1/500 (CD44) in an antibody diluent from Dako (S2022, Agilent technology, Santa Clara, CA, USA). Anti-MIF, anti-CD74, and anti-CD44 labeling was detected using the rabbit OmniMap kit (760-149). Immunostaining with anti-Ki67 (9027, Cell signaling technology, Danvers, MA, USA), γ-H2AX (sc-101696, Santa Cruz Biotechnology, Dallas, TX, USA), CD31 (ab28364, Abcam, Cambridge, UK), calretinin (18-0211, Invitrogen, Carlsbad, CA, USA), and mesothelin (HPA017172, Sigma-Aldrich Corp., St. Louis, MO, USA) was performed after EDTA antigen retrieval for 15 min. After a 20 min blocking step in PBS 0.2%/Triton X100 (PBST), the sections were incubated with primary antibodies in blocking buffer overnight at 4 °C (Ki67, 1/500; γ-H2AX, 1/500; CD31, 1/50; calretinin, 1/80; mesothelin, 1/80). The sections were washed with PBST and incubated for 1 h with DAPI 0.4 μg/mL and secondary A488-conjugated anti-rabbit antibodies in blocking buffer (A21206, Molecular Probes, ThermoFisher Scientific, Waltham, MA, USA). The slides were washed and mounted in fluorescence mounting medium (Dako, Agilent technology, Santa Clara, CA, USA). The slides were scanned with an Axioscan.Z1 and analyzed with Zen (Zen 2.3, Carl Zeiss, Oberkochen, Germany). Specific binding of all antibodies was previously checked by running controls without primary antibodies (see
Supplementary Materials figure).
4.7. Collection of Pleural Fluid and Flow Cytometry Staining
Following euthanization, the thoracic cavity of each mice was opened and washed with 1 mL of cold sterile PBS supplemented with 3% FBS. The pleural fluid (PF) was aspirated and placed on ice before centrifugation at 300× g for 5 min. The supernatant was removed and stored at −80 °C. The cell pellet was washed with 10 mL of PBS/3% FBS, resuspended in 2 mL PBS/3% FBS, and carefully layered upon 2 mL of Ficoll-Paque Plus separation medium (GE Healthcare, Munich, Germany). The Ficoll gradient was centrifuged for 20 min at 400× g without brake. The mononuclear cells were collected, washed in PBS/3% FBS, and resuspended in 400 μL of PBS-3% FBS-1mM EDTA (FACS buffer). The cells were incubated with Fc-blocking reagent (TrueStain, Biolegend, San Diego, CA, USA) for 5 min and subsequently stained for 30 min at 4 °C with the relevant antibody. The lymphocytes were characterized with APC anti-CD19 (6D5) and FITC anti-CD45R/B220 (RA3-6B2). The antibodies used to analyze monocytes, macrophages, and MDSC were PE anti-CD11b (M1/70), PE/Cy7 anti-F4-80 (BM8), APC anti-CD206 (C068C2), and FITC anti-Gr1 (RB6-8C5). NK cells were characterized with PE anti-CD49b (DX5) (BioLegend, San Diego, CA, USA). The controls received equivalent concentrations of isotype-matched IgG. All samples were acquired with a BD Accuri C6 flow cytometer and analyzed with BD Accuri C6 and FlowJo software (FlowJo V10-CL, Tree Star Inc., Ashland, OR, USA) Monocytes/macrophages, lymphocytes, and granulocytes were first gated according to a SSC-A vs. FSC-A scatter plot, and doublets were excluded using a pulse geometry gate FSC-H × FSC-A plot.
4.8. Statistics
The results are presented as means ± SEM or SD as indicated. Kruskal–Wallis test was used to examine statistical differences among three or more groups. Differences between pairs of groups were examined for statistical significance using the unpaired Mann–Whitney U test. A p value < 0.05 was considered statistically significant.

 and
and 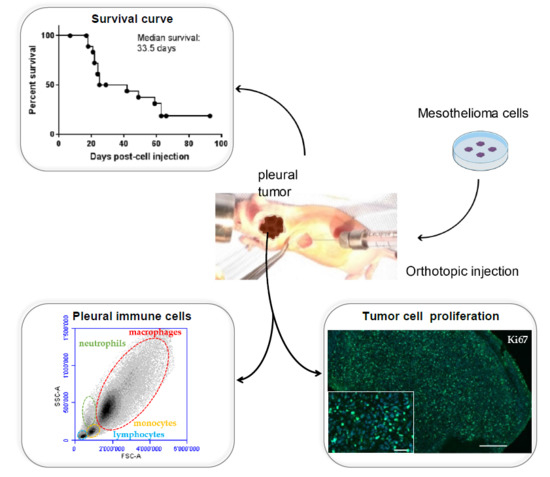


