Article

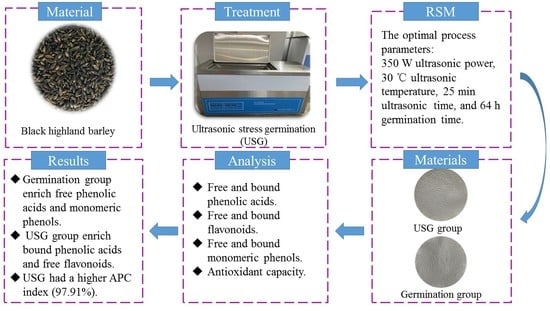
Enhancement of Polyphenols and Antioxidant Activity in Germinated Black Highland Barley by Ultrasonication

1
Academy of Agriculture and Forestry Sciences, Qinghai University, Xining 810016, China
2
Qinghai Tibetan Plateau Key Laboratory of Agricultural Product Processing, Qinghai Academy of Agriculture and Forestry Sciences, Xining 810016, China
3
Laboratory for Research and Utilization of Qinghai Tibet Plateau Germplasm Resources, Qinghai Academy of Agriculture and Forestry Sciences, Xining 810016, China
*
Authors to whom correspondence should be addressed.
These authors contributed equally to this work.
Molecules 2023, 28(9), 3679; https://doi.org/10.3390/molecules28093679
Submission received: 24 March 2023 / Revised: 21 April 2023 / Accepted: 22 April 2023 / Published: 24 April 2023
(This article belongs to the Special Issue Analyses and Applications of Phenolic Compounds in Food)

Abstract

:
The aim of this study was to investigate the effect of ultrasonic stress germination (USG) on total phenolic contents (TPC), total flavonoid contents (TFC), the phenolic compositions, and antioxidant activities of black highland barley (BHB). The USG processing parameters, polyphenol profile, phenolic compositions, and antioxidant activities were explored after USG. Results showed that the optimal USG parameters were as follows: 350 W ultrasonic pretreatment power, 30 °C ultrasonication temperature, 25 min ultrasonication time, and 64 h germination time. Under these conditions, the total phenolic content (688.84 ± 5.30 mg/100 g) and total flavonoid content (59.23 ± 0.45 mg/100 g) of BHB were increased by 28.55% and 10.15%, respectively, compared to the untreated samples. In addition, the USG treatment could more effectively enrich bound phenolic acids and free flavonoids, among which the content of catechin was significantly increased by USG and was the main characteristic substance. Moreover, the USG treatment could improve the antioxidant activity and had a higher antioxidant potency composite index (APC index) (97.91%) of BHB. These results indicate that USG might be an effective method to enrich polyphenols and improve antioxidant activity in BHB.

Graphical Abstract

1. Introduction

Highland barley is a special crop grown on the Tibetan plateau, which is mainly distributed in alpine regions at altitudes of 4200~4500 m. The crop is characterized by cold tolerance, early maturity, wide adaptability, and stable yield [1]. Black highland barley (BHB), a valuable germplasm resource [2], is rich in β-glucan, dietary fibers, resistant starch, and polyphenols [3,4], with glucose- and lipid-lowering, anticancer, and antioxidant properties [5]. Recent studies and applications of active substances in barley have focused on β-glucan, dietary fibers, and polyphenols. Polyphenols have an aromatic structure, including either one or more hydroxyl groups and which were classified into different subclasses based upon the number of phenol ring systems that they contain, saturation, and length of the carbon chain that bind the rings to one another. They contain both small molecular weight phenolic acids and large molecular weight tannins. A large number of studies have confirmed polyphenols have good antioxidant, anticancer, anti-inflammatory, and antibacterial activities. In addition, polyphenols and their associated metabolites affect intestinal health and the balance of intestinal microbiota by stimulating the growth of beneficial bacteria and inhibiting the proliferation of pathogens [6]. Several studies have shown that phenolic resources are abundant in colored barley and show high bioactivity [7]. However, polyphenols exist primarily in the bound form in cereals and are mainly (about 95%) bound to the cell wall polysaccharides [8]. Therefore, only a few compounds effectively exert their functional activity; owing to low bioavailability, exploiting their value in practical applications remains difficult. Therefore, to improve the utilization of cereal polyphenols, enrichment techniques to enhance the content and bioactivity of cereal polyphenols are effective. This may have implications for the development and utilization of BHB and its phenolic substances.
Germination is an effective way to improve and enhance the tissue structure, nutritional properties, and functional characteristics of plants [9,10]. It enhances the enzymatic activities of α-amylase and protease in grains and increases the content of total phenolic content and antioxidant activity, such as that reported in chickpea [11], buckwheat [12], and oat [13]. Epidemiological studies have revealed that germinated whole grains have antidiabetic, antihypercholesterolemic, and anticancer properties and can also improve the intestinal microbiota [14,15].
To efficiently exploit the advantages of germination technology and improve the biological activity of whole grains, germination pretreatment of whole grains has been emphasized in recent years. Whole grain pretreatment is primarily based on ultrasonic, soaking, high hydrostatic pressure, enzyme, and low-temperature plasma treatment [16]. Different pre-germination treatments have differential effects on the quality of whole grains. Non-thermal processing pretreatment exerts positive effects on organoleptic, nutritional, and processing qualities of germinated whole grains relative to normal soaking [17,18]. However, high levels of chemical and metal ion stress can lead to residual metal ions in grain and contaminate the environment. The cold and heat shock stress, mechanical damage, and drought stress cause irreversible damage to grain [19].
Ultrasonic treatment, a safe and efficient physical stimulation, not only enhances the nutritional value of raw materials but also maximizes the flavor retention of raw materials, and therefore is now widely used for the pretreatment of seeds and grains, including soybeans [20], brown rice [21], wheat [22], and red rice [23], to increase the nutritional value and secondary metabolites, such as GABA and phenolic compounds, in germinating seeds and shoots. Ding shows that ultrasonic treatment for 5 min significantly increases the content of total phenolic, avenanthramides, and γ-aminobutyric acid in germinated oat [24]. A previous study on sorghum shoots treated with sonication (sonication at 40% amplitude for 5 min) showed superior phytochemical composition, radical scavenging activity and phenolic profile after germination [25]. The current study on the effects of germination on the nutritional and functional components of barley only reported the differences in basic nutrients and polyphenol composition of highland barley under normal germination conditions [26] and the improvement of functional nutrients, sensory quality, and physicochemical properties of highland barley after germination under anoxic stress [19]. In this study, ultrasonic pretreatment was chosen to improve the polyphenol of sprouted BHB, because of the limited efficiencies of sprouting in inducing biotransformation [27] and the high cost of anoxic stress. However, little is known about the effect of ultrasonic stimulation on the polyphenols of germinated BHB. In addition, it is reported that excessive ultrasonic treatment can cause damage to seeds, resulting in decreased degradation of phenolic substances [28].
This study aimed to explore an optimum USG condition of BHB in order to obtain germinated BHB with high nutritional value. Meanwhile, total phenolic content (TPC), total flavonoid content (TFC), the phenolic compositions (phenolic acid, flavonoids, and monomeric phenols) and antioxidant activities (DPPH· scavenging ability, FRAP reducing power, and ABTS+· scavenging ability) were also evaluated. The findings may provide an economic, green, and efficient method for the production of polyphenols- enriched functional food and improve the utilization of BHB.

2. Results and Discussion

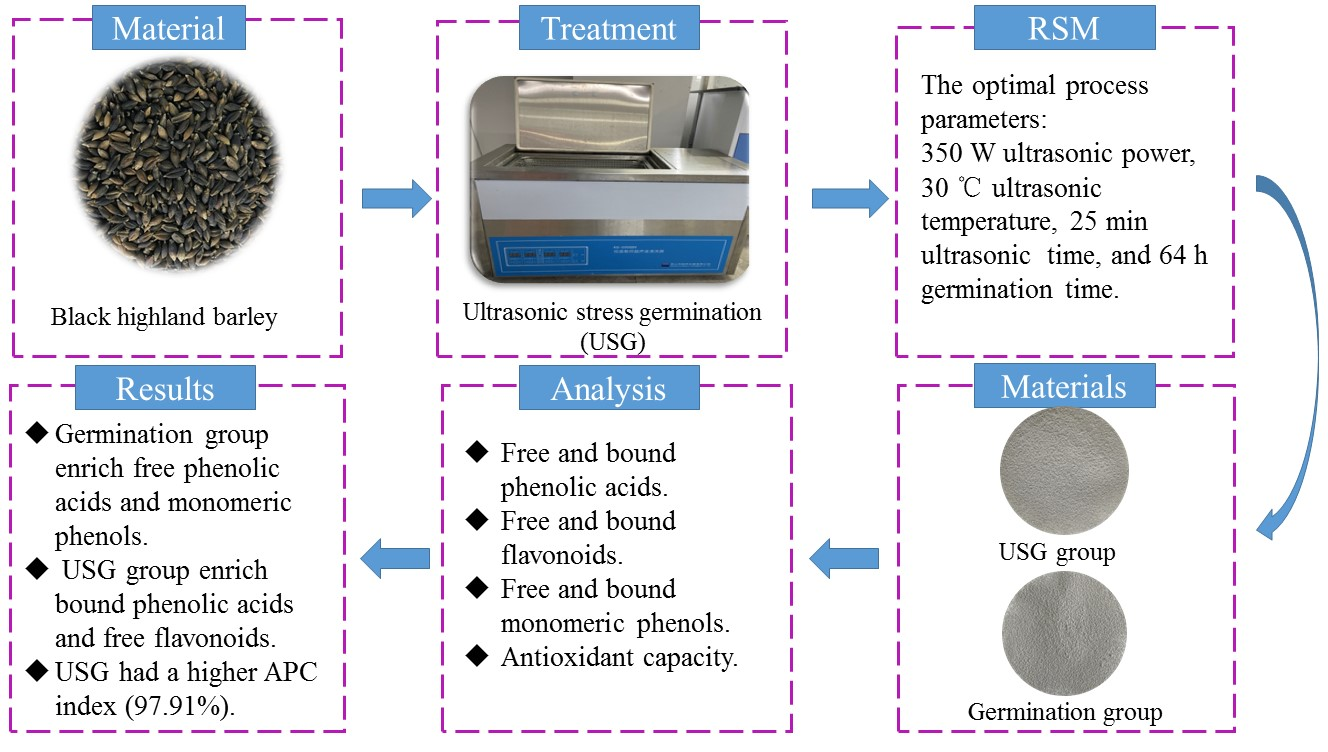
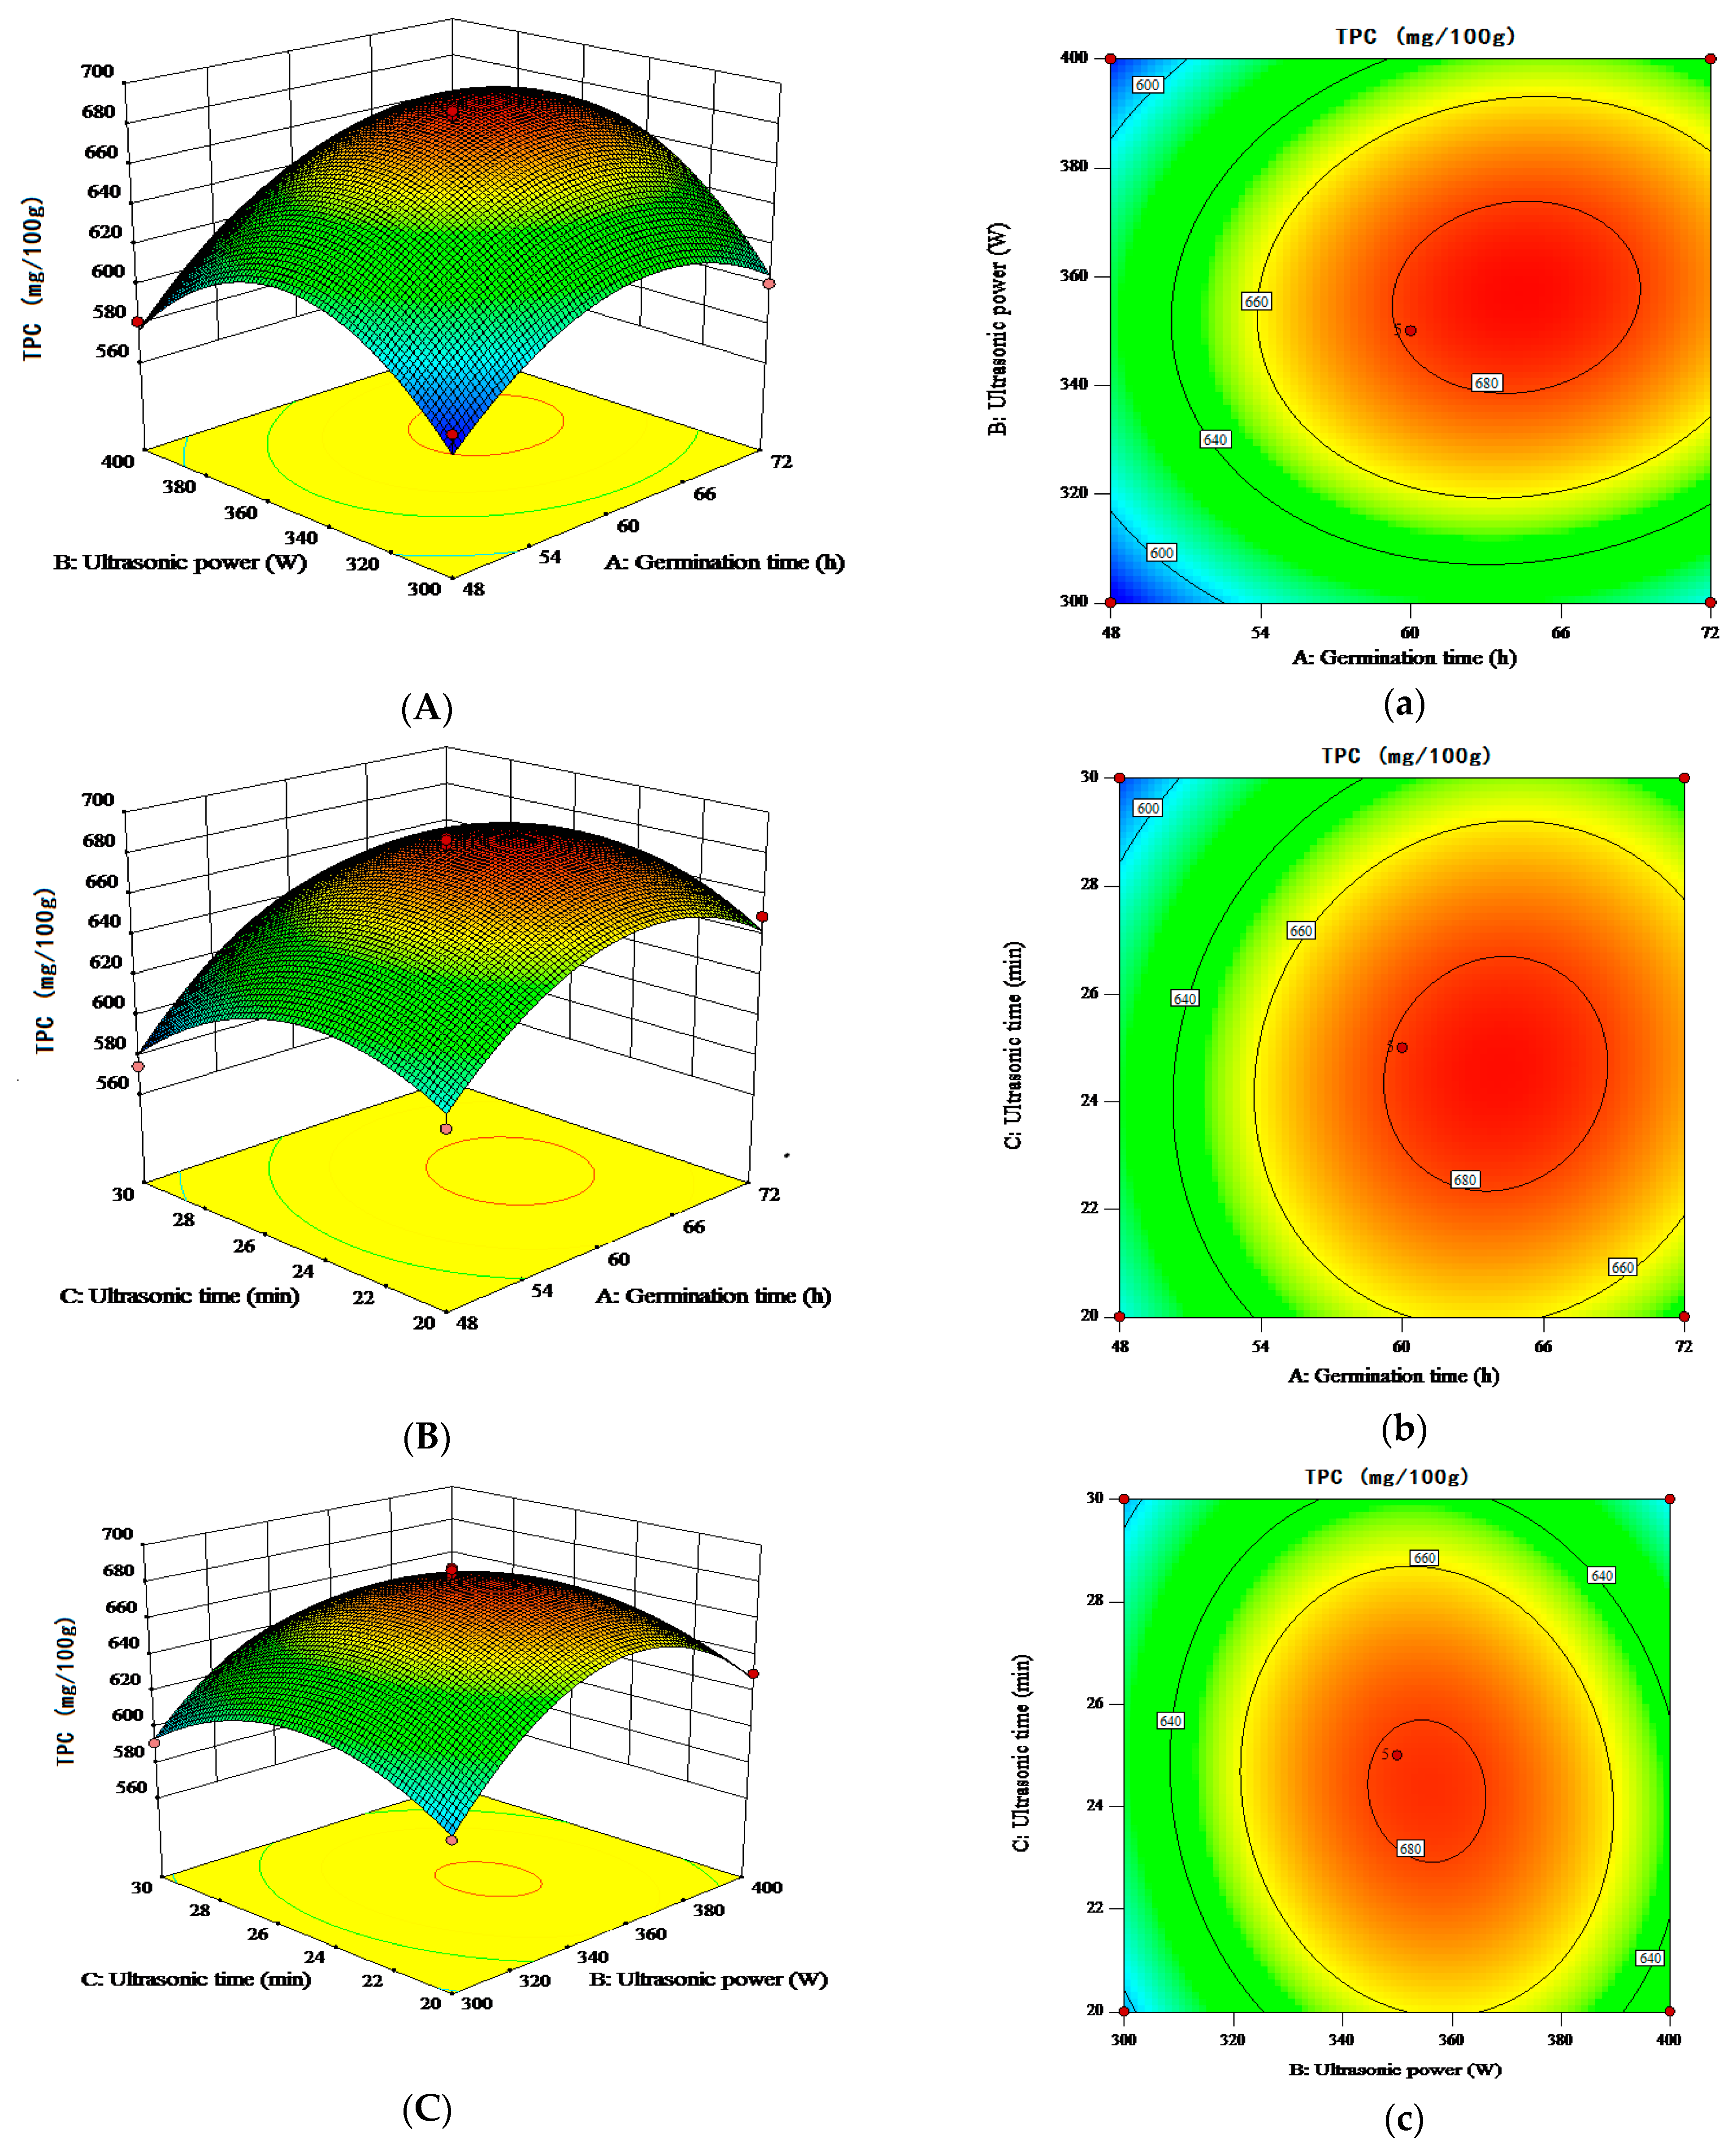
2.1. Response Surface Test

The Box–Behnken RSM was used to optimize the processing parameters for enriching polyphenols in BHB by USG based on TPC (Y1) and TFC (Y2) as response values. The independent variables were germination time (X1), ultrasound power (X2), and ultrasound time (X3). The results are shown in Table 1 and Table 2.
Fitting was performed by quadratic multiple regression using the Design Expert 10.0.1 software to obtain the following equations for TPC (Y1) and TFC (Y2), correspondingly, for the independent variables X1, X2, and X3, respectively:
Y1 (TPC) = 681.22 + 23.63 X1 + 9.44 X2 − 7.33 X3 + 7.23 X1 X2 + 5.23 X1 X3 − 6.65 X2 X3 − 35.03 X12 − 47.97 X22 − 29.11 X32
Y2 (TFC) = 58.85 + 5.13 X1 + 0.27 X2 − 1.13 X3 − 0.43 X1 X2 + 0.80 X1 X3 − 0.39 X2 X3 − 4.51 X12 − 2.53 X22 − 1.71 X32
The results of the analysis of variance in Table 2 suggest that the fitted models for TPC and TFC were both highly significant (p < 0.0001), while the lack of fit was not significant (p-values: 0.2161 and 0.3343, respectively), indicating a good fitness for the models. Thus, the above regression equations could be used to analyze the experimental results instead of the experimental true points. The correlation coefficient, R2, of the two models was 0.9755 and 0.9978, respectively, and the adjustment coefficient, R2adj, was 0.9441 and 0.9950, respectively, indicating a good fit between the predicted and actual values. Therefore, the model could well characterize the dynamic relationship between the variables and the response values. Therefore, the model could be used to analyze and predict the optimal process parameters for enriching TPC and TFC from BHB by USG.
The response surface test plots and contour plots for different factors on TPC and TFC are shown in Figure 1 and Figure 2. As shown in Figure 1, the contour lines of the interactions are all circular and these are not significant. As shown in Figure 2, the contours lines of the interaction terms X1X3 and X1X2 are elliptical and there is a maxima for each response value. When ultrasonic pretreatment power was 356.57 W for 24.45 min, and germination time was 64.11 h, the predicted value of TPC was 686.30 mg/100 g. When ultrasonic pretreatment power was 351.11 W for 23.97 min, and germination time was 66.58 h, the predicted value of TFC was 60.38 mg/100 g. The predicted values were validated based on the optimal process parameters to examine the reliability of these results. However, considering the limitation of the instrument and energy consumption, the optimal process parameters were adjusted to 64 h germination time, 350 W ultrasound power, and 25 min ultrasound time. Three parallel tests were conducted under these conditions. The average TPC and TFC of the USG sample were 688.84 ± 5.30 mg/100 g and 59.23 ± 0.45 mg/100 g, respectively, which were significantly higher than those in the untreated sample (535.84 mg/100 g and 53.77 mg/100 g, respectively). In addition, USG treatment was able to significantly increase the TPC compared to the germination treatment (Figure 3). The actual values of TPC and TFC obtained from parallel tests conducted under the optimal conditions predicted using the regression model were close to those predicted by the model. Therefore, the obtained regression model indicates the feasibility of process optimization and may have implications for its utility.

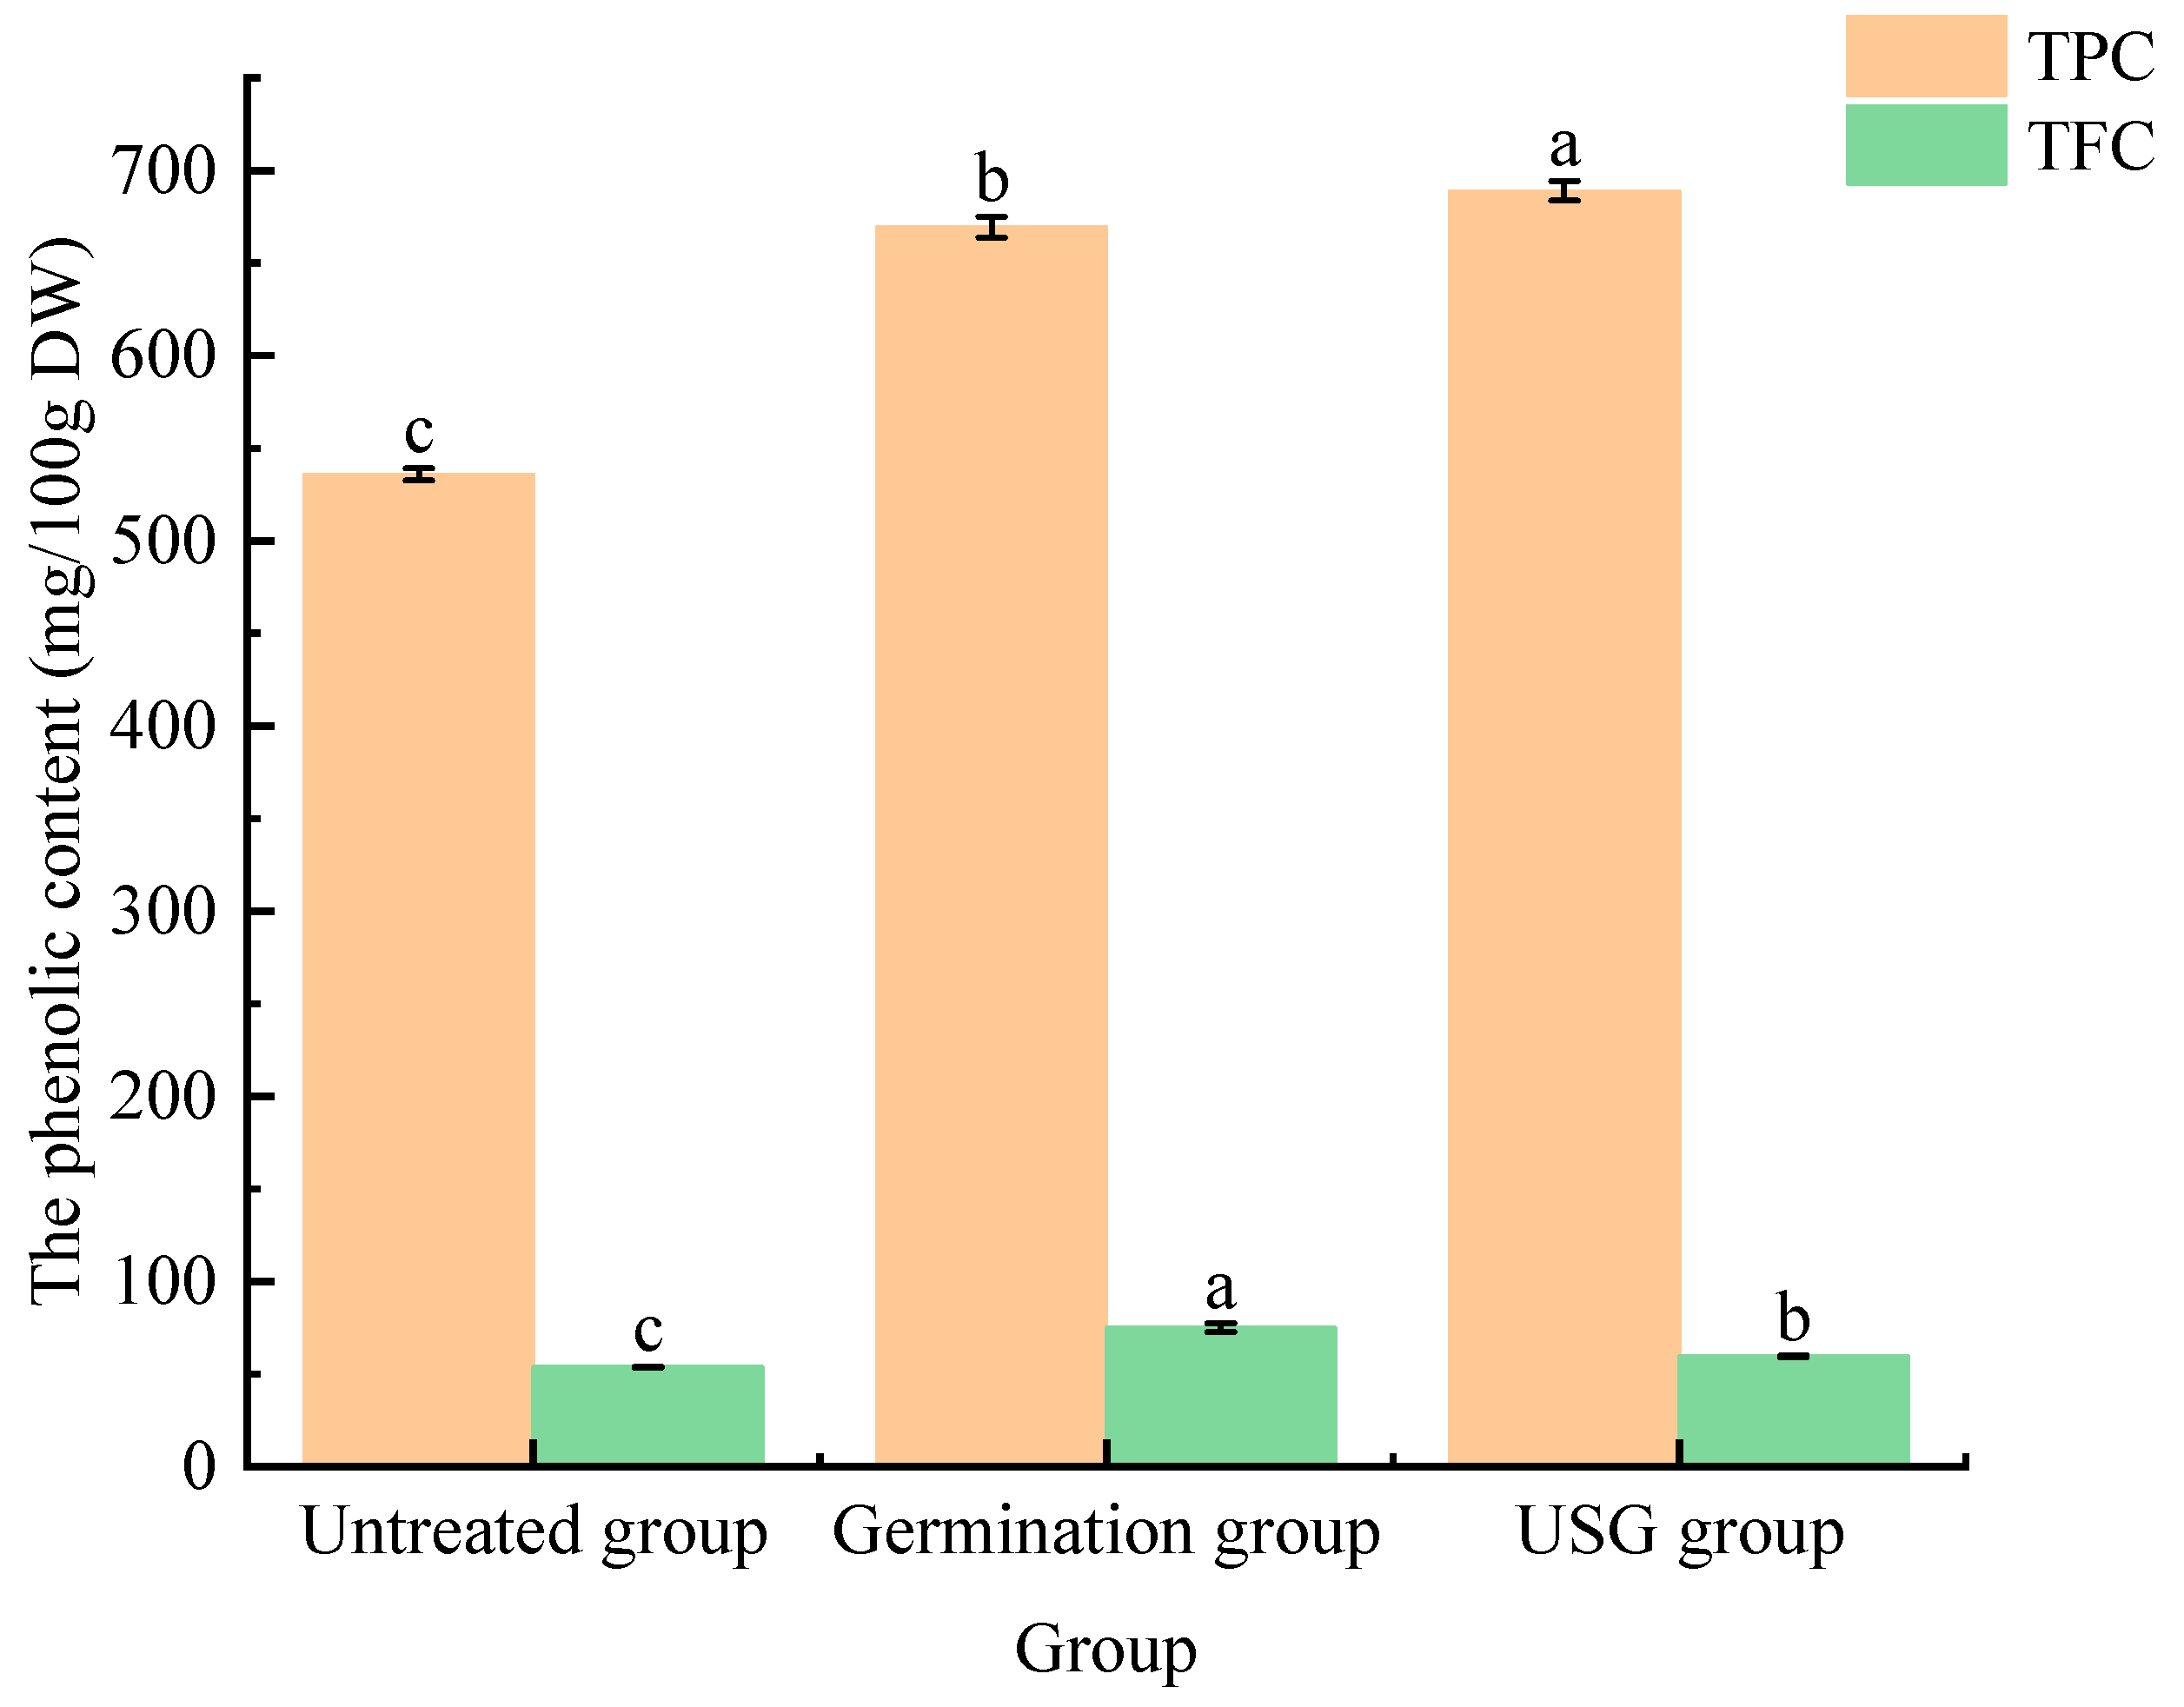
2.2. Effects of USG on the Phenolic Compounds in BHB

Figure 4 shows chromatogram for 31 phenolic compounds standards. Table 3 showed that the phenolic compounds were identified and quantified by germination and USG treatment in the BHB (free fraction and bound fraction). In total, 27 free and 21 bound phenolic compounds were detected in the untreated sample. In addition, 26 free and 19 bound phenolic compounds were detected in germination, while 27 and 20 bound phenolic compounds were detected in USG. Compared with the untreated sample, germination reduced the types of free and bound phenolic compounds in BHB, while USG reduced only the types of bound phenolic compounds. However, both germination treatment and USG treatment significantly increased the total phenolic and free phenolic content of BHB, with the USG showing a higher enrichment effect. Total free phenolic, total bound phenolic, and total phenolic in USG were the highest, with 1.11, 1.31, and 1.17 times higher than those of germination extract, respectively. Among them, bound phenolic acids (242.06 ± 2.44 mg/100 g), free flavonoids (522.18 ± 8.54 mg/100 g), and total flavonoids (530.09 ± 2.73 mg/100 g) showed a marked increase among the primary phenolic substances, which were 1.44, 1.46, and 1.45 times relative to those in germination samples, respectively. Furthermore, USG decreased the total amount of free phenolic acids (80.25 ± 0.95 mg/100 g), bound flavonoids (7.95 ± 0.46 mg/100 g), total monomeric phenols (98.89 ± 1.55 mg/100 g), free monomeric phenols (64.97 ± 1.67 mg/100 g), and bound monomeric phenols (33.92 ± 0.87 mg/100 g) compared to the germination sample. It can be attributed to the mechanical and chemical effects of sound waves that destroy the structure of some phenolic compounds during the ultrasonic treatment [29], causing their decomposition to reduce their content.
In addition, the germination treatment had a significant increase in 83.33% of free phenolic acids, 33.33% of bound phenolic acids, 37.50% of free flavonoids, 25.00% of bound flavonoids, 75.00% of free monomeric phenols, and 80.00% of bound monomeric phenols, while the USG treatment had a significant increase in 66.67% of free phenolic acids, 33.33% of bound phenolic acids, 43.75% of free flavonoids, 55.56% of bound flavonoids, 60.00% of free monomeric phenols, and 40.00% of bound monomeric phenols. It indicates that the germination and USG have certain enrichment effects on the phenolic substances in BHB, among which the germination could effectively increase the free phenolic acids and monomeric phenols substances (free and bound forms) in BHB while the USG could more effectively increase the bound phenolic acids and free flavonoids. The total amount of phenolic substances in BHB was significantly higher in the USG sample (951.29 ± 2.62 mg/100 g DW) than in the germination (816.03 ± 3.38 mg/100 g DW).
It had been reported that the phenylalanine pathway was believed to be the most important and common metabolic pathway for synthesis of phenolic substances, and phenylalanine ammonia lyase (PAL), the major rate-limiting enzyme for synthesis of plant polyphenols, was generally activated by germination [30]. In addition, the recovery of relevant enzyme activity or synthesis of necessary enzymes after germination allows the release of phenolic substances bound to the cell wall, thus increasing phenolic and flavonoid contents. Therefore, germination can promote the release of phenolic substances, and this conclusion is consistent with the finding that the total phenolic content of BHB treated with germination increased by 24.70% compared with untreated samples in this paper. It had been reported that brown rice [31], oats [32], and canary seeds [33] after germination treatment show an increasing trend. However, the phenolic content was significantly higher using the USG treatment than the results of the germination treatment, probably because ultrasonic makes the seed shell and accelerates the hydration process [34,35], leading to changes in the molecular structure and catalysis of enzymes, triggering the defense reaction systems, and enhancing the production of secondary metabolites such as the polyphenols [36]. The cavitation and mechanical effects of ultrasonic enhance the permeability of cell membranes and promote diffusion and transmembrane transport of ions and metabolites [37]. According to Wang’s report [38], the flavonoid content of mung bean seeds was significantly increased after ultrasonic treatment and germination for 48 h and was significantly higher than that of the samples germinated alone, which is consistent with the results of this study.
Comparing the changes of different phenolic substances in BHB after germination and USG (Table 3), the main phenolic substances in germination sample, i.e., free protocatechuic acid, free p-hydroxybenzoic acid, free p-coumaric acid, free epicatechin, free 4-hydroxybenzaldehyde, bound 4-hydroxybenzaldehyde, free catechin, and free phlorogucinol increased remarkably, which were 14.51, 4.74, 11.49, 3.99, 2.71, 2.28, 1.81, and 1.61 times higher than those in the untreated group, respectively, among which protocatechuic acid, p-coumaric acid, catechin, and phlorogucinol were the main characteristic phenolic substances in germination, and their content accounted for 70.53% of the total free phenolic content. The contents of bound ferulic acid, free kaempferol, free luteolin, free diosmetin, and free catechin increased remarkably, which were 1.13, 68.92, 2.30, 2.10, and 2.08 times higher than those in the untreated group, respectively, among which ferulic acid, kaempferol, diosmetin, and catechin were the main characteristic phenolic substances in USG, and their content accounted for 65.48% of the total free phenolic content. The results indicated that germination and USG had certain selectivity for increasing the content of phenolic substances in BHB. Among them, catechin is a characteristic flavonoid in BHB, and its content can be significantly increased by germination and USG, and which is significantly higher than that of blue highland barley (37.91–47.98 mg/100 g DW) [39]. Unlike buckwheat where the main flavonoid is rutin (14.65–40.63 mg/100 g) and oats where the main flavonoid is quercetin (3.10–8.90 mg/100 g) [40], the catechin content can subsequently be used as a basis for evaluation of polyphenol-enriched product development in BHB. In addition, compared with the main phenolic substances in untreated samples, the bound geranin in the germination sample and bound diosmetin in the USG sample were not detected, which may be explained by the susceptibility of some phenolic monomers to oxidation and degradation during germination, or interactions and complexations between phenolic compounds [41]. Other phenolic substances were not analyzed in detail due to their relatively low content.

2.3. Effects of USG on the In Vitro Antioxidant Activity of BHB

The changes of antioxidant activity of BHB before and after USG are shown in Table 4. Relative to the untreated group, DPPH· scavenging ability, FRAP reducing power, and ABTS+ scavenging ability of BHB by germination and USG were significantly higher than those in the untreated sample. Compared to the untreated, the germination sample showed higher FRAP reduction power (4883.24 ± 12.56 umol/100 g DW), while the USG sample had higher DPPH· scavenging ability (6976.23 ± 47.19 umol/100 g DW), which increased by 51.77% and 21.55% higher, respectively, similar to findings of Tang’s study [26]. It used the synthetic index method to evaluate the antioxidant activity of BHB before and after treatment (Table 4). APC index from largest to smallest was USG sample (97.91%) > germination sample (97.27%) > untreated sample (76.52%). Therefore, USG was superior in improving the content of phenolic substances and their antioxidant activities in BHB.

2.4. Correlations between Antioxidant Capacity and Phenolic Compounds

In order to clarify the relationship between the contents of the free, bound, and total phenolic compounds and their antioxidant activities in BHB, the characteristic phenolic monomers of BHB under different treatments and the monomers with more significant changes between treatments were selected for correlation analysis, and the analysis results are shown in Table 5. TPC showed an extremely significant positive correlation with the DPPH· scavenging ability and ABTS+· scavenging ability and the FRAP reducing power (p < 0.01). This result is consistent with Boubakri’s study [42], which was a strong correlation between the content of total phenolic and DPPH· scavenging ability, ABTS+· scavenging ability, and FRAP reducing power of Tunisian barley. In addition, TFC showed a significant positive correlation with the FRAP and ABTS+· scavenging ability, in which catechin and isovitexin were the main contributors. Additionally, Zhao [43] also mentioned that DPPH· scavenging ability and ABTS+· scavenging ability were high correlations with TPC and some individual phenolic contents, especially with the amount of catechin.
In addition, free phenolic content and free flavonoid content were highly significantly and positively correlated with ABTS+· scavenging ability and FRAP reducing power (p < 0.01), but significantly and positively correlated with DPPH· scavenging ability (p < 0.05) or not. Free kaempferol, free catechin, and free homogentisic acid were highly significantly and positively correlated with DPPH· scavenging ability. However, the findings of this paper differ from the results reported by Abdel-Aal [44] that free p-coumaric acid has a significant positive correlation on DPPH· scavenging ability, which could result from different varieties studied, growth environments, and different phenolic enrichment methods. Free catechin, free isovitexin, free homogentisic acid, free p-hydroxybenzoic acid, free p-coumaric acid, and free 4-hydroxybenzaldehyde showed highly significant positive correlations with FRAP reducing power and ABTS+· scavenging ability. These results indicated that the content of free phenolic in BHB significantly related to their antioxidant capacity. Free kaempferol, free catechin, and free homogentisic acid were the main contributors to the DPPH· scavenging ability. Free catechin, free isovitexin, free homogentisic acid, free p-hydroxybenzoic acid, free p-coumaric acid, and free 4-hydroxybenzaldehyde were the major contributors to FRAP reducing power and ABTS+· scavenging ability. In contrast, free diosmin and procyanidin B2 were significantly and negatively correlated with FRAP reducing power and ABTS+· scavenging ability.
The content of bound phenolic compounds was highly significantly and positively correlated with DPPH· scavenging ability and FRAP reducing power. This means that the bound phenolic extract of BHB contains a greater number of phenolic substances scavenging DPPH-radicals and FRAP. Bound p-coumaric acid, bound homogentisic acid showed highly significant and significant positive correlation with DPPH· scavenging ability, and bound p-coumaric acid, bound 4-hydroxybenzaldehyde showed highly significant and significant positive correlations with FRAP reducing power. This implies that bound p-coumaric acid, bound homogentisic acid may be the main contributor to DPPH· scavenging ability and bound p-coumaric acid, bound 4-hydroxybenzaldehyde may be the main contributor to FRAP reducing power. This signifies that different kinds of monomer phenols exhibit selectivity for different antioxidant activity evaluation methods [45]. In the present study, the reason for the differences in the main contribution of monomeric polyphenols in the various antioxidant systems may have been that the composition and content of polyphenols differed due to the different species and growth environment, in addition to being closely related to the way in which polyphenols were enriched in this study. In the present study, it was found that the content of total phenolic compounds was positively correlated with all three antioxidant activities; therefore, the effective increase of TPC has some application value for improving the antioxidant activity of BHB.

3. Materials and Methods

3.1. Materials and Reagents

Kunlun 20, a highland barley variety bred by the Institute of Crop Breeding and Cultivation, Qinghai Academy of Agricultural and Forestry Sciences, was planted and cultivated at its experimental site (Xining, Qinghai) in 2019 (altitude of 2300 m; 36°67′ N 101°77′ E). The 31 kinds of polyphenol standards including 6 kinds of phenolic acids (homogentisic acid, vanillic acid, protocatechuic acid, p-hydroxybenzoic acid, p-coumaric acid, ferulic acid), 20 kinds of flavonoids (sesamol, kaempferol, luteolin, maltol, taxifolin, rutin, diosmin, kaempferol-3-O-rutinoside, myricetin, quercetin, diosmetin, catechin, epicatechin, puerarin, homoorientin, vitexin, isovitexin, naringin, procyanidine A2, procyanidine B2), and 5 kinds of monomeric phenols (phlorogucinol, pyrogallol, 4-hydroxybenzaldehyde, 6-gingerol, vanillin) with purity ≥ 98% were procured from Shanghai Yuanye Bio-Technology Co., Ltd. (Shanghai, China). Folin-Ciocalteu reagent (GR) was provided by Beijing Solarbio Science & Technology Co., Ltd. (Beijing, China). The 1,1-diphenyl-2-picrylhydrazylradical (DPPH), 2,4,6-tripyridyl-s-triazine (TPTZ), 2,20-azinobis-(3-ethylbenzthiazoline-6-sulfonate) (ABTS), and 6-hydroxy-2,5,7,8-tetramethylchroman-2-carboxylic acid (Trolox) with BR level were provided by Sigma Co. (St. Louis, MO, USA). All of the other chemicals and reagents used in the experiments were domestic analytical pure reagents.

3.2. Sample Preparation

Untreated sample: highland barley was crushed using a portable universal grinder (HK-04A, Shanghai Keheng Industrial Development Co., Ltd., Shanghai, China).
The germination sample: Highland barley was soaked in 1% sodium hypochlorite solution for 20 min and then drained and soaked for 12 h at 20 °C. Subsequently, the soaked barley was placed in Petri dishes lined with double-layer filter paper and germinated at 28 °C for 60 h in a humidified incubator (HWS-250F, Ningbo, Jiangsu, China), where distilled water was sprayed every 4 h to keep the seeds moist.
The USG sample: Highland barley was soaked in 1% sodium hypochlorite solution for 20 min and then drained and soaked for 12 h at 20 °C. According to ultrasonic power and ultrasonic time in the test, the barley was subjected to stress using an ultrasonic bath (KQ-5000DE, Kunshan, Jiangsu, China) and the temperature was held constant by circulating water through a water jacket (ordinary water flow: from 5 to 7 mL/s). After ultrasound pretreatment, the seeds germinated at 28 °C for certain hours under the same conditions as the germination sample. All of the samples were crushed and filtered through an 80-mesh sieve for subsequent use.

3.3. Research Procedures

3.3.1. Extraction of Free and Bound Phenols

The extraction of free and bound phenolic compounds from BHB was performed according to the method of Jin [46]. Free phenolic extraction was performed as follows: to 25 mL of acetone solution (80% v/v), 1.0 g of whole barley powder was added, shaken, and ultrasonicated for 20 min at 20 °C, followed by centrifugation at 3000× g for 15 min (at 4 °C) (TGL-20M, Xiangyi, Changsha, China) to collect the supernatant. The residue was also treated as described above to collect the supernatant. After collecting the supernatant, the residue was subjected to the above treatment two times using the same method. The supernatant obtained in the three procedures were combined and spun at 45 °C using a rotary evaporator (Retavapor R-215, Buchi, Switzerland) to dry the mixture. The residue volume was made to 10 mL with anhydrous methanol and after conventional filtration (0.45 µm organic membrane filters) to obtain free phenol extract. This was stored at −20 °C in the dark.
Bound phenolic extraction was performed as follows: to the residue after the extraction of free phenols, 20 mL of n-hexane was added. The mixture was shaken and centrifuged at 3000 r/min for 5 min; the supernatant was discarded, following which, 17 mL of 11% hydrochloric acid-methanol solution was added to the precipitate, shaken well, and extracted twice using 20 mL of ethyl acetate following incubation in a water bath at 70 °C for 1 h. The extracts were mixed, rotor-evaporated at 45 °C, and fixed to 10 mL with anhydrous methanol after conventional filtration (0.45 µm organic membrane filters) to obtain barley-bound phenol extract. This was stored in the dark at −20 °C.

3.3.2. Determination of Total Phenolic Contents (TPC) and Total Flavonoid Contents (TFC)

The TPC and TFC were measured following Yang’s method [39]. Polyphenol content determination was performed as follows: 125 µL of extraction was aspirated into a test tube, followed by the addition of 125 µL of foline-phenol and 500 µL of distilled water; the samples were shaken well. After incubation for 6 min, 1.25 mL of 7% Na2CO3 solution was added, followed by the addition of 1 mL of distilled water. After 1.5 h of incubation at room temperature (in dark), the absorbance was measured twice using a UV-vis spectrophotometer (N4S, Yidian, Shanghai, China) at 765 nm. All samples and measurements were performed in triplicates. Gallic acid was used as the standard, the TPC was calculated according to the standard curve (Y = 0.0042X + 0.0124 [0–300 µg/mL, R2 = 0.9996]), and the TPC was expressed as mg gallic acid equivalents (GAE)/100 g DW. Flavonoid content determination was as follows: 100 µL of extraction was aspirated into a test tube, followed by the addition of 200 µL of 5% NaNO2 solution; the samples were shaken well. After incubation for 6 min, 200 µL of 10% Al(NO3)3 solution was added and shaken well. After 6 min, 2 mL of 4% NaOH solution was added, followed by the addition of 2.5 mL of distilled water. After 15 min of incubation at room temperature (in dark), the absorbance was measured twice at 510 nm. All samples and measurements were performed in triplicates. The TFC was calculated according to the standard curve (Y = 0.0055X − 0.0047 [0–80 µg/mL, R2 = 0.9947]), and the TFC were expressed as mg rutin equivalents (GAE)/100 g DW.

3.3.3. Determination of In Vitro Antioxidant Activity of Black Barley Polyphenol Extracts

The antioxidant capacities for the samples were determined using three different assays: FRAP reducing power, DPPH· scavenging ability, and ABTS+· scavenging ability. The antioxidant activity was determined following Yang’s method [39]. FRAP reducing power was determined as follows: The FRAP working solution was composed of 300 mmol/L pH 3.6 sodium acetate buffer solution, 20 mmol/L FeCl3 solution, and 10 mmol/L TPTZ solution (10:1:1, v/v/v). Typically, 1 mL of polyphenol extract and 4.5 mL of FRAP working solution were mixed in a test tube, and the absorbance was detected at 593 nm after 30 min of incubation in the dark. The FRAP reducing power was calculated according to the standard curve (Y = 0.0072X − 0.0012 [0–300 µmol/L, R2 = 0.9992]), and the results were expressed in µmol Trolox in 100 g of sample (dry weight). DPPH· scavenging ability was assessed as follows: 1 mL of polyphenol extract and 4 mL of 0.1 mmol/L DPPH· methanol solution were mixed in a test tube and the absorbance was detected at 517 nm after 30 min of incubation in the dark. The DPPH· scavenging ability of the extract was calculated according to the standard curve (Y = 0.0042X + 0.9163 [0–140 µmol/L, R2 = 0.9928]), and the results were expressed in µmol Trolox in 100 g of sample (dry weight). ABTS+· scavenging ability was estimated as follows: the ABTS+· working solution was prepared by mixing 5 mL 7 mmol/L ABTS solution with 88 µL 140 mmol/L potassium persulfate solution and was then kept in the dark for 12–16 h. The stock solution was diluted to a UV–Vis absorbance of 0.7 ± 0.02 using anhydrous methanol (1:100, v/v) before use. In most cases, 200 μL of polyphenol extract and 4 mL of the ABTS+· scavenging working solution were mixed in a test tube, and the absorbance was estimated at 734 nm after 30 min of incubation in the dark. The ABTS+· scavenging ability of the extract was calculated according to the standard curve (Y = −0.001X + 0.6242 [0–300 µmol/L, R2 = 0.9907]), and the results were expressed in µmol Trolox in 100 g of sample (dry weight).

3.3.4. Response Surface Test

According to the findings of previous multivariate analyses, the Box–Behnken RSM was employed to design a test using germination time (X1), ultrasound power(X2), and ultrasound time (X3) as the significant influencing factors and TPC (Y1) and TFC (Y2) as the response values. The experimental design is presented in Table 6.

3.3.5. Composition of Phenolic Substances

The composition of the phenolic compounds was determined based on the literature [47] using a Hypersil GOLD aQ column (100 mm × 2.1 mm) and the UPLC-Q-Orbitrap MS (Q-Exactive, Dionex Ultimate 3000 RSLC, ThermoFisher, USA). Mobile phase: 0.9% acetic acid-water solution (phase A) and methanol (phase B); flow rate, 0.3 mL/min; and sample size, 1 μL. Scan mode: Full MS; electrospray ionization (ESI); carrier gas, high-purity nitrogen (purity > 99.5%); spray voltage: 2.80 kV; capillary temperature: 300 °C; auxiliary gas heat source temperature: 300 °C, and positive/negative ion scanning mode. All samples and measurements were performed in triplicates.

3.3.6. Antioxidant Potency Composite Index (APC index)

The antioxidant activity was compared in different treatments of BHB using the APC index method [48]. Antioxidant index score/% = sample score/best score × 100. The sample score means the sample measurement value of the method and the best score means the maximum value measured by this method. The average of all tests for each treatment was then taken for the antioxidant potency composite (APC) index.

3.3.7. Statistical Analysis

Excel 2003 (Microsoft, Redmond, WA, USA) and SPSS 26 (SPSS Inc., Chicago, IL, USA) were used for data organization and analysis. Data were expressed as the mean ± standard deviation (mean ± SD) of the results of three experimental replicates. Duncan’s method was used for the analysis of the significance of the differences among multiple samples. Design Expert 10.0.1 software was used for central composition design.

4. Conclusions

In summary, Box–Behnken RSM was used to optimize the processing parameters for enriching polyphenols in BHB by USG. The optimal process parameters were obtained with ultrasonic pre-treatment power 350 W at 30 °C for 25 min, and a germination time of 64 h. Under these conditions, TPC, TFC, and APC index indices in BHB were increased significantly by 28.55%, 10.15%, and 27.95% respectively, compared to the untreated sample. HPLC–MS/MS analysis demonstrated that USG significantly increased total phenolic and antioxidant activity of BHB compared to germination, making it an effective method for enriching polyphenols. Germination could effectively enrich free phenolic acids and monomeric phenols, while USG could more effectively enrich bound phenolic acids and free flavonoids, where catechin is a characteristic substance in BHB, which was significantly increased in germination and USG, and which could subsequently be used as a basis for evaluation of polyphenol-enriched product development in BHB. Our findings may provide a reference for further improving the utilization of BHB.

Author Contributions

Conceptualization, J.Z. and X.Y.; methodology, J.Z., X.Y. and B.D.; validation, W.Z. (Wengang Zhang), W.Z. (Wancai Zheng) and B.D.; formal analysis, J.Z. and J.G.; investigation, W.Z. (Wengang Zhang); resources, J.G.; data curation, J.Z., W.Z. (Wengang Zhang) and B.D.; writing—original draft preparation, J.G., X.Y. and J.Z.; writing—review and editing, W.Z. (Wengang Zhang), W.Z. (Wancai Zheng) and B.D.; visualization, W.Z. (Wancai Zheng); supervision, X.Y.; project administration, J.Z. and B.D.; funding acquisition, X.Y. All authors have read and agreed to the published version of the manuscript.

Funding

This research was funded by Qinghai Special Agricultural Products Quality Evaluation and Product R&D Innovation Service Platform Project (2022-ZJ-T04) and Applied Basic Research of Qinghai Academy of Agriculture and Forestry Sciences Special Research Project (2021-NKY-01).

Institutional Review Board Statement

Not applicable.

Informed Consent Statement

Not applicable.

Data Availability Statement

The data presented in this study are available within the article.

Acknowledgments

We thank the anonymous reviewers for invaluable comments on this manuscript.

Conflicts of Interest

The authors declare no conflict of interest.

Sample Availability

Samples of the compounds are not available from the authors.

References

  1. Obadi, M.; Sun, J.; Xu, B. Highland barley: Chemical composition, bioactive compounds, health effects, and applications. Food Res. Int. 2021, 140, 110065. [Google Scholar] [CrossRef]
  2. Liu, Z.F.; Yao, Z.J.; Yu, C.Q.; Zhong, Z.M. Assessing crop water demand and deficit for the growth of spring highland barley in Tibet China. J. Integr. Agric. 2013, 12, 541–551. [Google Scholar] [CrossRef]
  3. Guo, T.L.; Horvath, C.; Chen, L.; Chen, J.; Zheng, B. Understanding the nutrient composition and nutritional functions of highland barley (qingke): A review. Trends Food Sci. Technol. 2020, 103, 109–117. [Google Scholar] [CrossRef]
  4. Liu, K.; Zhang, B.J.; Chen, L.; Li, X.; Zheng, B. Hierarchical structure and physicochemical properties of highland barley starch following heat moisture treatment. Food Chem. 2019, 271, 102–108. [Google Scholar] [CrossRef] [PubMed]
  5. Liu, K.; Zhang, B.J.; Chen, L.; Li, X.X.; Zheng, B. In vitro and in vivo antioxidant activity of polyphenols extracted from black highland barley. Food Chem. 2016, 194, 1003–1012. [Google Scholar]
  6. Zhang, X.P.; Shao, J.J.; Cui, Q.H.; Ni, W.T.; Yang, Y.; Yan, B.B. Bioactivities of dietary polyphenols and their effects on intestinal microbiota. Mini-Rev. Med. Chem. 2023, 23, 361–377. [Google Scholar]
  7. Lin, S.; Guo, H.; Gong, J.D.B.; Lu, M.; Lu, M.Y.; Wang, L.; Zhang, Q.; Qin, W.; Wu, D.T. Phenolic profiles, β-glucan contents, and antioxidant capacities of colored Qingke (Tibetan hulless barley) cultivars. J. Cereal Sci. 2018, 81, 69–75. [Google Scholar] [CrossRef]
  8. Li, J.X.; Zhang, H.; Yang, X.J.; Zhu, L.; Wu, G.C.; Qi, X.G.; Zhang, H. Trapping of reactive carbonyl species by fiber-bound polyphenols from whole grains under simulated physiological conditions. Food Res. Int. 2022, 156, 111142. [Google Scholar] [CrossRef]
  9. Xu, L.; Wang, P.; Ali, B.; Yang, N.; Chen, Y.S.; Wu, F.F.; Xu, X.M. Changes of the phenolic compounds and antioxidant activities in germinated adlay seeds. J. Sci. Food Agric. 2017, 97, 4227–4234. [Google Scholar] [CrossRef]
  10. Khang, D.T.; Dung, T.N.; Elzaawely, A.A.; Xuan, T.D. Phenolic profiles and antioxidant activity of germinated legumes. Foods 2016, 5, 27. [Google Scholar] [CrossRef]
  11. Domínguez-Arispuro, D.M.; Cuevas-Rodríguez, E.O.; Milán-Carrillo, J.; León-López, L.; Gutiérrez-Dorado, R.; Reyes-Moreno, C. Optimal germination condition impacts on the antioxidant activity and phenolic acids profile in pigmented desi chickpea (Cicer arietinum L.) seeds. J. Food Sci. Technol. 2018, 55, 638–647. [Google Scholar] [CrossRef]
  12. Živković, A.; Polak, T.; Cigić, B.; Požrl, T. Germinated buckwheat: Effects of dehulling on phenolics profile and antioxidant activity of buckwheat seeds. Foods 2021, 10, 740. [Google Scholar] [CrossRef] [PubMed]
  13. Tang, S.Y.; Mao, G.; Yuan, Y.; Weng, Y.D.; Zhu, R.Y.; Cai, C.G.; Mao, J.W. Optimization of oat seed steeping and germination temperatures to maximize nutrient content and antioxidant activity. J. Food Process. Preserv. 2020, 44, e14683. [Google Scholar] [CrossRef]
  14. Gong, L.X.; Wen, T.T.; Wang, J. The role of the microbiome in mediating health effects of dietary components. J. Agric. Food Chem. 2020, 68, 1280–12835. [Google Scholar] [CrossRef]
  15. Yao, F.; Zhang, J.Y.; Xiao, X.; Dong, Y.; Zhou, X.H. Antitumor activities and apoptosis-regulated mechanisms of fermented barley extract in the transplantation tumor model of human HT-29 cells in nude mice. Biomed. Environ. Sci. 2017, 30, 10–21. [Google Scholar] [PubMed]
  16. Li, R.; Li, Z.J.; Wu, N.N.; Tan, B. Effect of pre-treatment on the functional properties of germinated whole grains: A review. Cereal Chem. 2022, 99, 253–269. [Google Scholar] [CrossRef]
  17. Sharma, N.; Goyal, S.K.; Alam, T.; Fatma, S.; Chaoruangrit, A.; Niranjan, K. Effect of high pressure soaking on water absorption, gelatinization, and biochemical properties of germinated and non-germinated foxtail millet grains. J. Cereal Sci. 2018, 83, 162–170. [Google Scholar] [CrossRef]
  18. Xia, Q.; Li, Y.F. Mild high hydrostatic pressure pretreatments applied before soaking process to modulate wholegrain brown rice germination: An examination on embryo growth and physicochemical properties. Food Res. Int. 2018, 106, 817–824. [Google Scholar] [CrossRef] [PubMed]
  19. Du, Y.; Chen, Z.X.; Liang, F.; Zhou, W.J.; Li, T.Y.; Tu, Z.X.; Tan, Y.J.; Li, J. Effects of hypoxia stress germination on nutrients, physicochemical properties and cooking characteristics of highland barley. J. Cereal Sci. 2022, 103, 103411. [Google Scholar] [CrossRef]
  20. Alfalahi, A.O.; Alobaidy, B.S.; Almarie, A.A.; Dhanoon, O.M.; Qasem, J.R.; Almehemdi, A.F.; Najda, A. Ultrasonic treatment enhances germination and affects antioxidant gene expression in soybean (Glycine max L. Merr). Agronomy 2022, 12, 2446. [Google Scholar] [CrossRef]
  21. Xia, Q.; Tao, H.; Li, Y.F.; Pan, D.D.; Cao, J.X.; Liu, L.L.; Zhou, X.W.; Barba, F.J. Characterizing physicochemical, nutritional and quality attributes of wholegrain Oryza sativa L. subjected to high intensity ultrasound-stimulated pre-germination. Food Control 2020, 108, 106827. [Google Scholar] [CrossRef]
  22. Naumenko, N.; Potoroko, I.; Kalinina, I. Stimulation of antioxidant activity and γ-aminobutyric acid synthesis in germinated wheat grain Triticum aestivum L. by ultrasound: Increasing the nutritional value of the product. Ultrason. Sonochem. 2022, 86, 106000. [Google Scholar] [CrossRef] [PubMed]
  23. Ding, J.Z.; Ulanov, A.V.; Dong, M.Y.; Yang, T.W.; Nemzer, B.V.; Xiong, S.B.; Zhao, S.M.; Feng, H. Enhancement of gama-aminobutyric acid (GABA) and other health-related metabolites in germinated red rice (Oryza sativa L.) by ultrasonication. Ultrason. Sonochem. 2018, 40, 791–797. [Google Scholar] [CrossRef] [PubMed]
  24. Ding, J.Z.; Johnson, J.; Chu, Y.F.; Feng, H. Enhancement of γ- aminobutyric acid, avenanthramides, and other health-promoting metabolites in germinating oats (Avena sativa L.) treated with and without power ultrasound. Food Chem. 2019, 283, 239–247. [Google Scholar] [CrossRef] [PubMed]
  25. Hassan, S.; Imran, M.; Ahmad, M.H.; Khan, M.I.; Xu, C.M.; Khan, M.K.; Muhammad, N. Phytochemical characterization of ultrasound-processed sorghum sprouts for the use in functional foods. Int. J. Food Prop. 2020, 23, 853–863. [Google Scholar] [CrossRef]
  26. Tang, Y.; Xiao, L.; Wu, X.Y.; Li, W.L.; Wu, T.; Zhang, P. Impact of germination pretreatment on the polyphenol profile, antioxidant activities, and physicochemical properties of three color cultivars of highland barley. J. Cereal Sci. 2021, 97, 103152. [Google Scholar] [CrossRef]
  27. Yang, R.Q.; Guo, Y.X.; Wang, S.F.; Gu, Z.X. Ca2+ and aminoguanidine on γ-aminobutyric acid accumulation in germinating soybean under hypoxia–NaCl stress. J. Food Drug Anal. 2015, 23, 287–293. [Google Scholar] [CrossRef]
  28. López-Ribera, I.; Vicient, C.M. Use of ultrasonication to increase germination rates of Arabidopsis seeds. Plant Methods 2017, 13, 31. [Google Scholar] [CrossRef]
  29. Oreopoulou, A.; Tsimogiannis, D.; Oreopoulou, V. Extraction of polyphenols from aromatic and medicinal plants: An overview of the methods and the effect of extraction parameters. In Polyphenols in Plants; Academic Press: London, UK, 2019; pp. 243–259. [Google Scholar]
  30. Xiang, J.L.; Yuan, Y.; Du, L.; Zhang, Y.Y.; Li, C.Q.; Beta, T. Modification on phenolic profiles and enhancement of antioxidant activity of proso millets during germination. Food Chem. X 2023, 18, 100628. [Google Scholar] [CrossRef]
  31. Ti, H.H.; Zhang, R.F.; Zhang, M.W.; Li, Q.; Wei, Z.C.; Zhang, Y.; Tang, X.J.; Deng, Y.Y.; Liu, L.; Ma, Y.X. Dynamic changes in the free and bound phenolic compounds and antioxidant activity of brown rice at different germination stages. Food Chem. 2014, 161, 337–344. [Google Scholar] [CrossRef]
  32. Xu, J.G.; Tian, C.R.; Hu, Q.P.; Luo, J.Y.; Wang, X.D.; Tian, X.D. Dynamic changes in phenolic compounds and antioxidant activity in oats (Avena nuda L.) during steeping and germination. J. Agric. Food Chem. 2009, 57, 10392–10398. [Google Scholar] [CrossRef]
  33. Chen, Z.J.; Yu, L.L.; Wang, X.K.; Gu, Z.X.; Beta, T. Changes of phenolic profiles and antioxidant activity in canaryseed (Phalaris canariensis L.) during germination. Food Chem. 2016, 194, 608–618. [Google Scholar] [CrossRef]
  34. Estivi, L.; Brandolini, A.; Condezo-Hoyos, L.; Hidalgo, A. Impact of low-frequency ultrasound technology on physical, chemical and technological properties of cereals and pseudocereals. Ultrason. Sonochem. 2022, 86, 106044. [Google Scholar] [CrossRef]
  35. Kalita, D.; Jain, S.; Srivastava, B.; Goud, V.V. Sono-hydro priming process (ultrasound modulated hydration): Modelling hydration kinetic during paddy germination. Ultrason. Sonochem. 2021, 70, 105321. [Google Scholar] [CrossRef]
  36. Miano, A.C.; Pereira, J.D.; Costa, C.N.; Augusto, P.E.D. Enhancing mung bean hydration using the ultrasound technology: Description of mechanisms and impact on its germination and main components. Sci. Rep. 2016, 6, 38996. [Google Scholar] [CrossRef]
  37. Kentish, S.; Feng, H. Applications of power ultrasound in food processing. Annu. Rev. Food Sci. Technol. 2014, 5, 263–284. [Google Scholar] [CrossRef]
  38. Wang, L.D.; Li, X.Q.; Gao, F.; Liu, Y.; Lang, S.J.; Wang, C.Y.; Zhang, D.J. Effect of ultrasound combined with exogenous GABA treatment on polyphenolic metabolites and antioxidant activity of mung bean during germination. Ultrason. Sono-Chem. 2023, 94, 106311. [Google Scholar] [CrossRef]
  39. Yang, X.J.; Dang, B.; Fan, M.T. Free and bound phenolic compound content and antioxidant activity of different cultivated blue highland barley varieties from the Qinghai-Tibet Plateau. Molecules 2018, 23, 879. [Google Scholar] [CrossRef]
  40. Keriene, I.; Mankeviciene, A.; Bliznikas, S.; Jablonskyte-Rasce, D.; Maiksteniene, S.; Cesnuleviciene, R. Biologically active phenolic compounds in buckwheat, oats and winter spelt wheat. Zemdirbyste 2015, 102, 289–296. [Google Scholar] [CrossRef]
  41. Ge, X.Z.; Saleh, A.S.M.; Jing, L.Z.; Zhao, K.; Su, C.Y.; Zhang, B.; Zhang, Q.; Li, W.H. Germination and drying induced changes in the composition and content of phenolic compounds in naked barley. J. Food Compos. Anal. 2021, 95, 103594. [Google Scholar] [CrossRef]
  42. Boubakri, H.; Jdey, A.; Taamalli, A.; Taamalli, W.; Jebara, M.; Brini, F.; Riciputi, Y.; Pasini, F.; Christian, M.; Verardo, V. Phenolic composition as measured by liquid chromatography/mass spectrometry and biological properties of Tunisian barley. Int. J. Food Prop. 2017, 20, 1783–1797. [Google Scholar] [CrossRef]
  43. Zhao, H.F.; Dong, J.J.; Lu, J.; Chen, J.; Li, Y.; Shan, L.; Lin, Y.; Fen, W.; Gu, G.X. Effects of Extraction solvent mixtures on antioxidant activity evaluation and their extraction capacity and selectivity for free phenolic compounds in barley (Hordeum vulgare L.). J. Agric. Food Chem. 2006, 54, 7277–7286. [Google Scholar] [CrossRef] [PubMed]
  44. Abdel-Aal, E.S.M.; Choo, T.M.; Dhillon, S.; Rabalski, I. Free and bound phenolic acids and total phenolics in black, blue, and yellow barley and their contribution to free radical scavenging capacity. Cereal Chem. 2012, 89, 198–204. [Google Scholar] [CrossRef]
  45. Zhang, W.G.; Lan, Y.L.; Dang, B.; Zhang, J.; Zheng, W.C.; Du, Y.; Yang, X.J.; Li, Z.H. Polyphenol profile and in vitro antioxi-dant and enzyme inhibitory activities of different solvent extracts of highland barley bran. Molecules 2023, 28, 1665. [Google Scholar] [CrossRef] [PubMed]
  46. Jin, H.M.; Dang, B.; Zhang, W.G.; Zheng, W.C.; Yang, X.J. Polyphenol and anthocyanin composition and activity of highland barley with different colors. Molecules 2022, 27, 3411. [Google Scholar] [CrossRef] [PubMed]
  47. Guo, W.W.; Beta, T. Phenolic acid composition and antioxidant potential of insoluble and soluble dietary fibre extracts derived from select whole-grain cereals. Food Res. Int. 2013, 51, 518–525. [Google Scholar] [CrossRef]
  48. Seeram, N.P.; Aviram, M.; Zhang, Y.J.; Henning, S.M.; Feng, L.; Dreher, M.; Heber, D. Comparison of antioxidant potency of commonly consumed polyphenol-rich beverages in the United States. J. Agric. Food Chem. 2008, 56, 1415–1422. [Google Scholar] [CrossRef]
Figure 1. Response surface and contour maps of the interactions between two factors on TPC. (A,a) germination time and ultrasound power; (B,b) germination time and ultrasound time; (C,c) ultrasound power and ultrasound time.
Molecules 28 03679 g001
Figure 2. Response surface and contour maps of the interactions between two factors on TFC. (A,a) germination time and ultrasound power; (B,b) germination time and ultrasound time; (C,c) ultrasound power and ultrasound time.
Molecules 28 03679 g002
Figure 3. The TPC and TFC in different treatment of BHB. Lower-case letters in the figure respectively indicate significant differences among different treatment of BHB about TPC and TFC (p < 0.05).
Molecules 28 03679 g003
Figure 4. Extraction ion current chromatogram for 31 phenolic compound standard samples. 1: homogentisic acid; 2: vanillic acid; 3: protocatechuic acid; 4: p-hydroxybenzoic acid; 5: sesamol; 6: p-coumaric acid; 7: ferulic acid; 8: kaempferol; 9: luteolin; 10: phlorogucinol; 11: pyrogallol; 12: maltol; 13: taxifolin; 14: rutin; 15: diosmin; 16: kaempferol-3-O-rutinoside; 17: myricetin; 18: quercetin; 19: diosmetin; 20: catechin; 21: epicatechin; 22: puerarin; 23: homoorientin; 24: vitexin; 25: isovitexin; 26: naringin; 27: procyanidine A2; 28: procyanidine B2; 29: 4-hydroxybenzaldehyde; 30: 6-gingerol; 31: vanillin.
Molecules 28 03679 g004
Table 1. Design and results of the Box–Behnken test.
NumberX1: Germination Time (h)X2: Ultrasound Power (W)X3: Ultrasound Time (min)TPC
(mg/100 g DW)
TFC
(mg/100 g DW)
1−1−10581.66 ± 3.6946.06 ± 0.45
21−10600.74 ± 3.3056.78 ± 0.31
3−110581.23 ± 1.1747.69 ± 0.15
4110629.25 ± 3.3656.70 ± 1.33
5−10−1598.94 ± 0.9749.28 ± 1.48
610−1649.46 ± 4.2058.32 ± 0.56
7−101574.25 ± 4.8745.34 ± 0.53
8101645.70 ± 4.0257.60 ± 0.39
90−1−1593.19 ± 2.3355.17 ± 1.84
1001−1630.20 ± 3.5256.26 ± 0.81
110−11591.37 ± 7.7853.75 ± 1.13
12011601.80 ± 4.5653.27 ± 0.29
13000684.17 ± 6.1158.47 ± 1.72
14000687.60 ± 2.0959.12 ± 1.47
15000668.43 ± 8.7859.17 ± 0.64
16000679.51 ± 3.3758.63 ± 1.34
17000686.39 ± 9.5458.88 ± 1.19
Table 2. Analysis of variance based on the regression model for TPC and TFC.
Source of VariationTPCTFC
F-Valuep-ValueSignificanceF-Valuep-ValueSignificance
Model31.01<0.0001**354.08<0.0001**
X146.950.0002**1852.18<0.0001**
X27.490.0290*5.130.0578
X34.520.0711 90.51<0.0001**
X1 X22.200.1816 6.430.0389*
X1 X31.150.3190 22.820.0020**
X2 X31.860.2153 5.420.0527
X1254.280.0002**754.47<0.0001**
X22101.82<0.0001**238.06<0.0001**
X3237.480.0005**107.99<0.0001**
Lack of fit2.330.2161 1.540.3343
R2 0.9755 0.9978
Adjusted R2 (R2adj) 0.9441 0.9950
* and ** indicate a significant (p < 0.05) and a highly significant difference (p < 0.01), respectively.
Table 3. Composition and content of phenolic compounds in BHB before and after USG treatment (mg/100 g DW).
Untreated GroupGermination GroupUSG Group
FreeBoundTotalFreeBoundTotalFreeBoundTotal
Flavonoids
Kaempferol0.36 ± 0.05 b0.87 ± 0.14 b1.22 ± 0.19 b0.47 ± 0.02 bND0.47 ± 0.02 c24.81 ± 0.80 a2.40 ± 0.08 a27.22 ± 0.81 a
Maltol3.35 ± 1.31 a1.74 ± 0.11 b5.09 ± 1.38 a3.22 ± 0.94 a2.24 ± 0.24 b5.47 ± 0.61 a2.09 ± 0.33 b3.10 ± 0.54 a5.19 ± 0.28 a
Taxifolin0.29 ± 0.01 a0.58 ± 0.05 a0.87 ± 0.06 a0.21 ± 0.05 b0.50 ± 0.08 a0.70 ± 0.06 b0.15 ± 0.01 b0.30 ± 0.04 b0.45 ± 0.05 c
Rutin0.51 ± 0.03 a0.57 ± 0.02 a1.09 ± 0.03 a0.48 ± 0.05 aND0.48 ± 0.05 b0.47 ± 0.01 aND0.47 ± 0.01 b
Diosmin36.94 ± 0.84 a1.30 ± 0.27 a38.24 ± 1.11 a16.74 ± 0.48 c0.45 ± 0.24 b17.19 ± 0.36 c19.87 ± 1.27 b0.47 ± 0.01 b20.34 ± 1.26 b
Kaempferol-3-O-rutinoside0.42 ± 0.05 aND0.51 ± 0.06 b0.28 ± 0.03 b0.20 ± 0.10 a0.48 ± 0.09 b0.37 ± 0.03 a0.32 ± 0.05 a0.69 ± 0.03 a
Myricetin0.12 ± 0.01 b0.21 ± 0.04 a0.33 ± 0.02 a0.22 ± 0.01 aND0.22 ± 0.01 b0.13 ± 0.00 bND0.13 ± 0.00 c
Quercetin0.25 ± 0.05 a0.69 ± 0.05 a0.95 ± 0.04 aND0.19 ± 0.05 b0.19 ± 0.05 c0.13 ± 0.00 b0.26 ± 0.06 b0.38 ± 0.06 b
Luteolin5.70 ± 0.00 bND5.74 ± 0.01 bNDNDND13.11 ± 0.58 aND13.11 ± 0.58 a
Diosmetin60.07 ± 0.69 b5.52 ± 0.26 a65.58 ± 0.95 b26.53 ± 0.47 c4.89 ± 0.07 b31.42 ± 0.47 c125.98 ± 2.66 aND125.98 ± 2.66 a
Catechin132.59 ± 2.40 cND132.59 ± 2.40 c239.58 ± 4.05 bND239.58 ± 4.05 b276.06 ± 2.30 aND276.06 ± 2.30 a
Epicatechin4.58 ± 0.19 bND4.58 ± 0.24 b18.28 ± 0.50 a0.13 ± 0.09 a18.41 ± 0.44 a3.22 ± 0.03 cND3.22 ± 0.03 c
PuerarinNDNDND0.24 ± 0.11 aND0.24 ± 0.11 aNDNDND
Homoorientin3.72 ± 0.06 b0.59 ± 0.06 b4.30 ± 0.08 b1.40 ± 0.02 c0.54 ± 0.02 b1.94 ± 0.02 c4.12 ± 0.10 a0.82 ± 0.03 a4.95 ± 0.10 a
Vitexin0.46 ± 0.01 bND0.50 ± 0.02 a0.35 ± 0.01 cND0.35 ± 0.01 b0.48 ± 0.01 aND0.48 ± 0.01 a
NaringinND0.16 ± 0.10 a0.25 ± 0.10 aNDNDNDND0.14 ± 0.07 a0.14 ± 0.07 a
Isovitexin4.12 ± 0.06 cND4.22 ± 0.06 c9.80 ± 0.03 aND9.80 ± 0.03 a7.49 ± 0.10 b0.14 ± 0.02 a7.62 ± 0.12 b
Procyanidin A2NDNDND0.32 ± 0.02 aND0.32 ± 0.02 aNDNDND
Procyanidin B252.32 ± 0.74 aND52.32 ± 0.74 a41.05 ± 0.17 cND41.05 ± 0.17 c43.71 ± 1.06 bND43.71 ± 1.06 b
Total flavonoids305.79 ± 3.73 c12.23 ± 0.38 a318.09 ± 3.81 c357.62 ± 2.86 b9.13 ± 0.16 b366.32 ± 3.44 b522.14 ± 3.14 a7.95 ± 0.46 c530.09 ± 2.73 a
Phenolic acids
Ferulic acid20.46 ± 0.34 a179.21 ± 5.56 b199.67 ± 5.25 a12.56 ± 0.06 b141.58 ± 1.97 c154.13 ± 1.97 b10.17 ± 0.78 b202.69 ± 1.85 a212.86 ± 2.05 a
Protocatechuic acid2.40 ± 0.06 b5.52 ± 0.09 b7.92 ± 0.10 b34.83 ± 1.49 a8.49 ± 0.48 a43.31 ± 1.01 a1.46 ± 0.21 b5.86 ± 0.07 b7.32 ± 0.18 b
p-Hydroxybenzoic acid2.87 ± 0.14 c1.29 ± 0.55 a4.17 ± 0.64 c13.61 ± 0.15 a1.28 ± 0.21 a14.88 ± 0.30 a8.35 ± 0.19 b0.94 ± 0.23 a9.39 ± 0.19 b
Homogentisic acid3.16 ± 0.10 c0.39 ± 0.20 b3.55 ± 0.29 c4.11 ± 0.18 b0.58 ± 0.49 b4.68 ± 0.65 b4.42 ± 0.15 a15.26 ± 0.49 a19.68 ± 0.60 a
p-Coumaric acid5.76 ± 0.39 c8.55 ± 0.22 c14.31 ± 0.25 c66.16 ± 0.36 a12.64 ± 0.41 b78.80 ± 0.58 a40.56 ± 0.70 b13.71 ± 0.37 a54.28 ± 0.71 b
Vanillic acid12.51 ± 0.41 c4.65 ± 0.45 a17.15 ± 0.26 b20.87 ± 1. 78 a3.53 ± 0.37 b24.39 ± 1.83 a15.30 ± 0.39 b3.60 ± 0.45 b18.90 ± 0.31 b
Total phenolic acids47.16 ± 1.05 c199.62 ± 11.42 b246.78.11 ± 5.14 b155.12 ± 3.17 a168.08 ± 1.04 c320.20 ± 3.29 a80.25 ± 0.95 b242.06 ± 2.44 a322.32 ± 2.53 a
Monomeric phenols
Phlorogucinol51.34 ± 1.07 c9.78 ± 0.70 b61.12 ± 1.72 c82.73 ± 0.58 a13.41 ± 0.27 a96.14 ± 0.67 a57.55 ± 1.10 b9.29 ± 0.33 b66.85 ± 0.89 b
Pyrogallol0.16 ± 0.02 a2.60 ± 0.36 b2.76 ± 0.33 bND3.63 ± 0.29 a3.63 ± 0.29 a0.41 ± 0.18 a1.58 ± 0.15 c1.99 ± 0.24 c
4-Hydroxybenzaldehyde2.01 ± 0.11 c2.45 ± 0.17 c4.47 ± 0.14 c5.45 ± 0.04 a5.59 ± 0.08 a11.04 ± 0.06 a3.65 ± 0.46 b2.80 ± 0.15 b6.45 ± 0.31 b
Sesamol0.15 ± 0.02 b0.17 ± 0.09 a0.32 ± 0.11 a0.35 ± 0.12 aND0.35 ± 0.12 aND0.20 ± 0.04 a0.20 ± 0.04 b
6-GingerolNDNDNDND0.36 ± 0.00 a0.36 ± 0.00 b0.51 ± 0.06 aND0.51 ± 0.06 a
Vanillin4.53 ± 0.17 a16.34 ± 1.38 b20.87 ± 1.22 b1.90 ± 0.12 c16.08 ± 0.66 b17.99 ± 0.56 c2.85 ± 0.39 b20.05 ± 0.51 a22.90 ± 0.85 a
Total monomeric phenols58.20 ± 1.30 c31.33 ± 1.97 b89.53 ± 2.73 c90.43 ± 0.74 a39.08 ± 1.07 a129.51 ± 1.12 a64.97 ± 1.67 b33.92 ± 0.87 b98.89 ± 1.55 b
Total phenolic acids+ total flavonoids+ total monomeric phenols411.15 ± 4.14 c243.18 ± 4.75 b654.40 ± 2.08 c600.18 ± 1.93 b216.29 ± 2.18 c816.03 ± 3.38 b667.37 ± 4.08 a283.93 ± 2.34 a951.29 ± 2.62 a
ND, not detected. Lower-case letters in the table indicate significant differences among different treatment of BHB in free, bound, and total fraction. (p < 0.05).
Table 4. Changes in total phenolic and in vitro antioxidant capacity in barley before and after USG treatment.
GroupFRAP Reducing Power (umol/100 g DW)ABTS+· Scavenging Ability (umol/100 g DW)DPPH·Scavenging Ability (umol/100 g DW)APC Index (%)
Untreated group3217.53 ± 30.82 c3663.47 ± 43.15 b5739.32 ± 28.23 c76.52 (3)
Germination group4883.24 ± 12.56 a4501.00 ± 24.44 a6408.69 ± 73.11 b97.29 (2)
USG group4632.18 ± 19.86 b4449.89 ± 42.47 a6976.23 ± 47.19 a97.91 (1)
Lower-case letters in the table indicate significant differences among different treatment of BHB in FRAP reducing power, and ABTS+ scavenging ability and DPPH· scavenging ability. (p < 0.05).
Table 5. Pearson correlation coefficients between antioxidant capacity and phenolic compounds.
Free Phenolic ExactionBound Phenolic ExactionTotal Phenols
DPPHFRAPABTSDPPHFRAPABTSDPPHFRAPABTS
Phenolic content0.759 *0.974 **0.979 **0.906 **0.963 **−0.2780.935 **0.965 **0.981 **
Flavonoid content0.1370.863 **0.845 **0.1140.6420.3050.3040.794 *0.743 *
Kaempferol0.959 **0.4280.4630.503−0.068−0.4450.825 **0.3510.43
Diosmin−0.548−0.996 **−0.987 **−0.828 **−0.912 **−0.011−0.809 **−0.998 **−0.989 **
Catechin0.817 **0.945 **0.952 ** 0.969 **0.925 **0.949 **
Isovitexin 0.3210.943 **0.930 ** 0.6460.968 **0.942 **
Procyanidin B2−0.485−0.983 **−0.978 ** −0.754 *−0.989 **−0.979 **
Homogentisic acid0.827 **0.919 **0.941 **0.783 *0.302-0.4490.868 **0.4310.506
p-Hydroxybenzoic acid0.2280.908 **0.890 **−0.405−0.1890.0780.5120.914 **0.873 **
p-Coumaric acid0.2990.938 **0.922 **0.977 **0.904 **−0.3370.6490.970 **0.942 **
4-Hydroxybenzaldehyde0.2120.877 **0.869 **0.2490.746*0.1540.340.818 **0.766 *
Note: * and ** indicate a significant (p < 0.05) and a highly significant difference (p < 0.01), respectively. Phenolic content and flavonoid content detected by chemical method, respectively.
Table 6. Factors and levels in the response surface test.
LevelX1: Germination Time (h)X2: Ultrasound Power (W)X3: Ultrasound Time (min)
−14830020
06035025
17240030
Disclaimer/Publisher’s Note: The statements, opinions and data contained in all publications are solely those of the individual author(s) and contributor(s) and not of MDPI and/or the editor(s). MDPI and/or the editor(s) disclaim responsibility for any injury to people or property resulting from any ideas, methods, instructions or products referred to in the content.

