Abstract
This study aims to explore the potential use of low-cost ultraviolet-visible-near infrared (UV-Vis-NIR) spectroscopy to quantify adulteration content of soybean, rapeseed, corn and peanut oils in Camellia oil. To attain this aim, test oil samples were firstly prepared with different adulterant ratios ranging from 1% to 90% at varying intervals, and their spectra were collected by an in-house built experimental platform. Next, the spectra were preprocessed using Savitzky–Golay (SG)–Continuous Wavelet Transform (CWT) and the feature wavelengths were extracted using four different algorithms. Finally, Support Vector Regression (SVR) and Random Forest (RF) models were developed to rapidly predict adulteration content. The results indicated that SG–CWT with decomposition scale of 25 and the Iterative Variable Subset Optimization (IVSO) algorithm can effectively improve the accuracy of the models. Furthermore, the SVR model performed best for predicting adulteration of camellia oil with soybean oil, while the RF models were optimal for camellia oil adulterated with rapeseed, corn, or peanut oil. Additionally, we verified the models’ robustness by examining the correlation between the absorbance and adulteration content at certain feature wavelengths screened by IVSO. This study demonstrates the feasibility of using low-cost UV-Vis-NIR spectroscopy for the authentication of Camellia oil.
1. Introduction
Camellia oil, as one of the most valuable edible oils [1,2], is highly sought after by consumers because of its great potential in the health care, medical, beauty, and chemical fields [3,4]. The superior physicochemical properties possessed by Camellia oil result in its price being significantly higher (5–10 times) than that of common edible oils (such as soybean and rapeseed oils) [5]. Due to the high demand, several fraudulent practices have emerged in the Camellia oil industry. These involve illegal traders who blend low-priced oils, such as soybean, corn, and rapeseed oils, into the genuine Camellia oil, as well as falsely label their product to make illicit profits [6]. Such practices are serious violations of regulations such as Chinese standard GB 2716-2018. It is therefore critical to develop a rapid, effective and robust method for quantifying adulteration content in Camellia oil.
Traditional methods for detecting adulteration in Camellia oil based on visual or odor assessments are often subjective, leading to unreliable results [7]. Recently, primary methods for detecting edible oil adulteration have included chromatography [8], nuclear magnetic resonance [9], electronic nose [10], and spectroscopy [11]. Among them, chromatography, nuclear magnetic resonance, and the electronic nose method have certain drawbacks. For example, gas chromatography and liquid chromatography require complex chemical pretreatment, thus leading to extended detection periods [8,11]. Moreover, nuclear magnetic resonance needs expensive equipment and complex operation [9,12], while electronic nose often faces the issue of unstable data acquisition [10]. Various spectroscopy techniques have been applied to authenticate adulterated Camellia oil thanks to their direct and non-destructive characteristics [13,14,15]. However, most studies in this field typically involve the use of expensive near-infrared (NIR) spectrometers to acquire the data [5,11,16]. Moreover, the majority of studies have been performed by either using the entire spectrum bands or solely relying on the feature wavelength bands [17,18]. Therefore, these have led to issues such as high detection costs and a lack of ability to merge the rapidity and robustness of model authentication.
Studies that examine the authentication of edible oil using UV-Vis spectroscopy, which has significant cost advantages compared with NIR spectroscopy, have recently been increasing. Su et al. [19] utilized an in-house built acquisition platform to collect reflectance spectra of 110 samples of sesame and rapeseed oils adulterated with soybean oil, and developed the optimal models to predict their adulteration content. However, the developed models were not effective for low percentage adulteration content (i.e., less than 10%) [19]. Wu et al. [20] utilized UV-Vis spectroscopy (350–800 nm) to create binary and ternary quantitative models with weighted multiscale support vector regression (EMD-SVR) for soybean, peanut, and sesame oils. This study demonstrates that UV-Vis spectroscopy could be employed for efficient authentication of edible oils. Gong et al. [21] investigated the qualitative detection of adulterated Camellia oil by utilizing UV-Vis-NIR transmission spectroscopy (200–1100 nm). They established an XGBoost model, which can identify Camellia oil adulterated with sunflower, corn and peanut oils, respectively, with high accuracy (98.18%), sensitivity (97.62%), and specificity (100%). Although the abovementioned study elucidated that UV-Vis-NIR spectroscopy can be utilized for the authentication of edible oils, quantitative detection of adulteration content in Camellia oil through this technique has not yet been reported.
To fill this gap, this paper presented a study on quantitative evaluation of adulteration content in Camellia oil using UV-Vis-NIR transmission spectroscopy (200–1100 nm). The study involved the comparison of various spectrum preprocessing, feature wavelength selection, and machine learning modeling methods to establish rapid and robust models for quantifying the adulteration content of soybean, rapeseed, corn, and peanut oils, respectively, in Camellia oil. In addition, the rationality of the obtained feature wavelengths was verified through Poisson correlation analysis, further proving the reliability of the established models. Consequently, this study lays a foundation to develop a low-cost, rapid and robust quantification device for the authentication of Camellia oil.
2. Results and Discussion
2.1. Spectrum of the Oil Samples
The raw spectrum profiles of the prepared samples were presented in Figure 1. As shown in Figure 1a, there were five absorption peaks in the 244 spectrum curves at around 250 nm (UV band), 430 and 660 nm (Vis band), and 930 and 1050 nm (NIR band), respectively. Figure 1b illustrated that there were differences between the spectrum curves of the five pure oils, particularly in some bands where Camellia oil differed from the four lower-priced oils. Specifically, at the characteristic peak band near 430 nm, the largest magnitude differences between Camellia oil and rapeseed, corn, and soybean oils were observed. Additionally, a significant magnitude difference existed between Camellia oil and peanut oil at the characteristic peak band around 660 nm. The observed differences between the collected pure oil spectrum provided evidence of utilizing UV-Vis-NIR transmission spectroscopy (200–1100 nm) as a feasible method to estimate adulterated content. However, due to the similarity between spectra curves, it is necessary to employ chemometrics and machine learning techniques to further analyze the data.
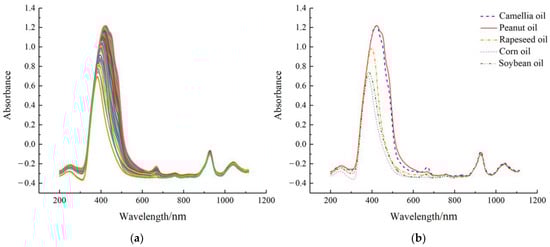
Figure 1.
Raw spectra of the samples: (a) all samples; (b) representative pure oil samples.
2.2. Spectrum Preprocessing Results
The raw spectra were preprocessed with SG, SG-1st, SG-2nd, and SG-CWT with 9 decomposition scales (i.e., L1–L9), respectively (Figure 2).
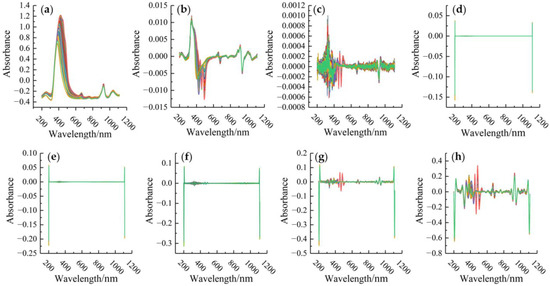
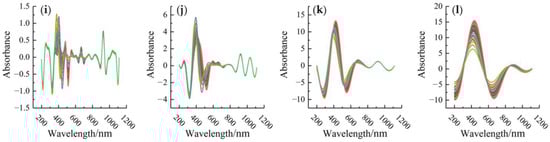
Figure 2.
Spectra pre-processing results. (a) SG; (b) SG-1st; (c) SG-2nd; (d–l) multi-decomposition scale SG–CWT from L1 to L9, respectively.
To determine the optimal preprocessing method, the SVR models were developed using the full preprocessed spectral dataset, and then R2 and RMSE were evaluated. As shown in Table 1, the optimal method was SG–CWT (L5) with an of 0.9998 and RMSE of 0.0059. Moreover, compared to SG-2nd that was the second-best method, SG–CWT (L5) can improve RMSE by 21.33% and R2 by 0.02%. In addition, the results verified that SG–CWT (L1−L9) was able to gradually amplify the insignificant characteristic peaks and valleys in the spectral curves at low decomposition scales, thus highlighting the local differences (Figure 2). However, increasing decomposition scale led to too smooth spectral curves, and hence, some inconspicuous feature peaks and valleys were gradually removed, which increased the difficulty of capturing spectral feature information. It was demonstrated that CWT can effectively smooth the data and reduce noise at low decomposition scales. Therefore, SG–CWT (L5) was adopted to preprocess spectra for the following parts.

Table 1.
Evaluation indicators of pre-processing results.
2.3. Feature Wavelength Screening Results
Four kinds of wavelength screening methods, including CARS, SPA, BOSS, and IVSO, were used to select the feature wavelengths from the full spectrum with SG–CWT (L5) preprocessing. As a result, CARS, SPA, BOSS, and IVSO screened 27, 28, 30, and 48 feature wavelengths, respectively, effectively reducing the number of wavelengths to 1.31%, 1.35%, 1.45%, and 2.32% of the full spectrum (2068 wavelengths).
To determine the optimal feature wavelength screening method, the SVR and RF-based models were established using full spectrum (FS) and the feature wavelengths screened by CARS, SPA, BOSS and IVSO, respectively. Then, the evaluation criteria of different models were compared in Figure 3. The results demonstrated that the IVSO method was the most appropriate for feature wavelength screening, trailed by BOSS and CARS, while SPA was the least suitable. Furthermore, the results indicated that the use of IVSO-RF provided the optimal performance for quantifying the percentage of adulterant in Camellia oil adulterated with corn, peanut, or rapeseed oils. However, for Camellia oil adulterated with soybean oil, the best performance was achieved using the IVSO-SVR combination.
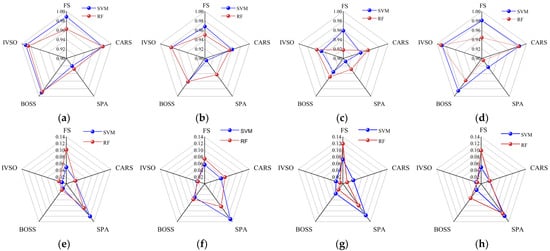
Figure 3.
Comparison of evaluation criteria for different feature wavelength screening methods. (a–d): the of Camellia oil adulterated with soybean, corn, peanut, and rapeseed oils, respectively; (e–h): the of Camellia oil adulterated with soybean, corn, peanut, and rapeseed oils, respectively.
To further clarify the advantages of IVSO compared to other methods, the distribution characteristics of the screened wavelengths were analyzed (Figure 4). The wavelengths extracted by CARS, BOSS, and IVSO were predominantly in the Vis band, while SPA had comparable numbers of wavelengths among the UV, Vis and NIR bands. Specifically, CARS, BOSS, and IVSO concentrated the feature wavelengths on two characteristic peak and valley positions at approximately 510 nm and 660 nm. In contrast, the feature wavelengths generated by SPA were primarily concentrated at both ends of the spectrum, where excessive noise interference could render SPA a distinct disadvantage over the other methods. In addition, IVSO showed better clustering characteristics than CARS and BOSS in the Vis band.
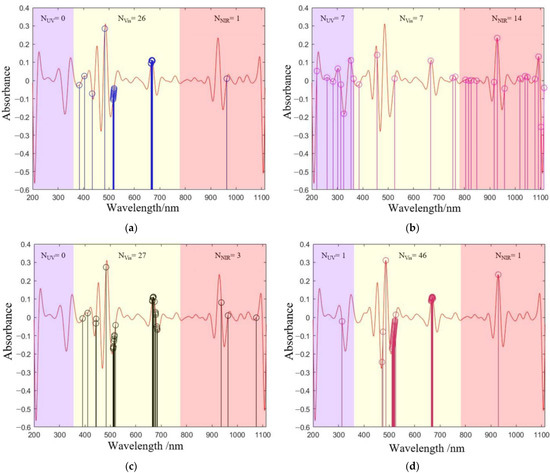
Figure 4.
Distribution of feature wavelengths screened by (a) CARS, (b) SPA, (c) BOSS and (d) IVSO.
2.4. Model Development
In this study, we developed an SVR model to predict the adulteration content of soybean oil mixed with Camellia oil, and three RF models to measure adulteration with corn, peanut, and rapeseed oils, respectively, according to the results shown in Figure 3.
Moreover, to further enhance the prediction ability of the proposed models, the main parameters in SVR and RF models, as presented in Table 2, were optimized. Specifically, the SVR model determined the optimal penalty factor c and the kernel function γ by the grid search method that minimized 10-fold cross-validation error. Moreover, the RF models attained the optimal number of decision trees n by using the particle swarm optimization algorithm, which was run with a particle dimension of 2, population size of 30, and maximum 100 iterations. The performance of both SVR and RF models were also shown in Table 2.
Table 2.
The optimal parameters and evaluation criteria for SVR and RF models.
As presented in Table 2, it was apparent that the parameter-optimized models significantly outperformed their unoptimized counterparts (Figure 3). Additionally, the SVR and RF models demonstrated no signs of underfitting or overfitting.
Next, a detailed analysis of each of the four models was presented. The analysis utilized the evaluation criteria for prediction sets and provided insight into each model’s performance. The values indicated that the parameter-optimized models performed better in each of the four types of adulterated oils. Specifically, in the case of Camellia oil adulterated with soybean oil, the parameter-optimized IVSO-SVR model achieved a higher of 0.9925 (an improvement of 0.13%), and a lower of 0.0325 (a decrease of 8.96%) compared to the unoptimized IVSO-SVR model (0.9912 and 0.0357, respectively). The same trend held true for the parameter-optimized IVSO-RF model in the other three types of adulterated oils, exhibiting an increase in of 0.92% to 0.19% and a decrease in of 10.14% to 18.94% when compared to unoptimized models.
Figure 5 illustrates that the predicted adulteration content of soybean, corn, peanut and rapeseed oils all agreed well with actual ones in terms of prediction sets. Therefore, these results strongly indicated that the developed models can greatly assist in quantifying the adulteration content in Camellia oil with high precision and reliability. Furthermore, the performance of the developed models was compared with that of other spectroscopic quantitative techniques including Vis-NIR [19], Fourier transform infrared (FTIR) [22] and UV-Vis [15] (Table 3). It was observed that our models demonstrated comparable predictive capabilities, while providing a broader range for adulteration ratios.
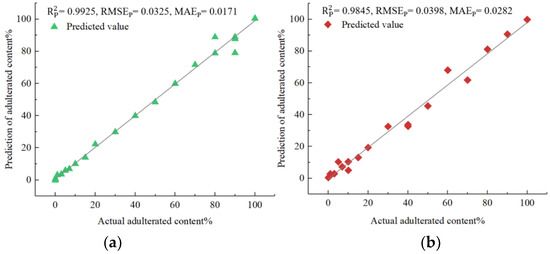
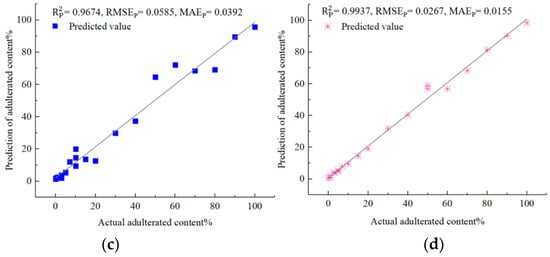
Figure 5.
Comparison of predicted and actual adulteration content for (a) Camellia oil adulterated with soybean oil; (b) Camellia oil adulterated with corn oil; (c) Camellia oil adulterated with peanut oil; (d) Camellia oil adulterated with rapeseed oil.
Table 3.
Comparison with relevant previous research results.
2.5. Wavelength Characteristics Study
In order to further emphasize the applicability of the models established in this study and the rationality of the selected feature wavelengths, three representative wavelengths among the feature wavelengths proposed by IVSO were analyzed by significance test and Pearson correlation coefficient. They were 313.759 nm in the UV band, 486.401 nm in the Vis band, and 929.144 nm in the NIR band. The significance coefficients for these three wavelengths were all less than 0.05, and therefore, possessed the significance of Pearson correlation analysis for the study [23].
We compared the Pearson correlation coefficients across three bands for Camellia oil adulterated with four oils (Figure 6). It was found that the absolute values of coefficients were all greater than 0.5. This suggested there were some correlations between the absorbance and adulteration content. Furthermore, Figure 6 displays the Pearson correlation coefficient of absorbance and adulteration content in decreasing order of strength from Vis, NIR, and UV. This supports the possibility that the inadequate number of Vis wavelengths may have an adverse effect on the predictive capability of the SPA algorithm.
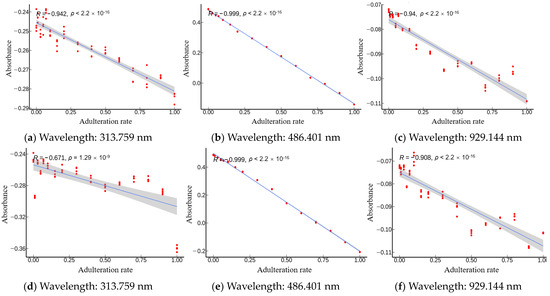
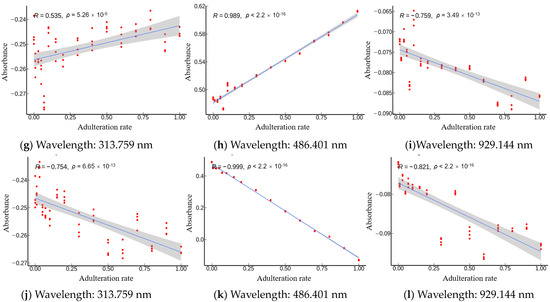
Figure 6.
Pearson correlation analysis between the absorbance (at the wavelengths of 313.759 nm, 486.401 nm and 929.144 nm) and adulteration content of (a–c) soybean oil; (d–f) corn oil; (g–i) peanut oil; (j–l) rapeseed oil.
Specifically, Camellia oil that is adulterated with soybean oil (Figure 6a–c) exhibited negative correlation across all three wavelengths with an R value less than −0.94. This implied that accurate prediction of the adulteration content of soybean oil can be made in the wavelength bands of 200–1100 nm. Next, the Camellia oil adulterated with corn oil (Figure 6d–f) displayed negative correlation in all three bands. The Vis and NIR bands showed a high level of correlation (with R value less than −0.90), whereas the UV band demonstrated a moderate correlation with an R value of −0.671. This indicated that the Vis and NIR bands contained more feature information than the UV band. In addition, the adulteration of Camellia oil with peanut oil (Figure 6g–i) displayed positive correlation for the UV and Vis wavelengths, but showed negative correlation in the NIR band. R values of 0.989 (very strong correlation), −0.759 (strong correlation), and 0.535 (moderate correlation) were obtained for the Vis, NIR, and UV bands, respectively. This indicated that the Vis wavelength contained more sensitive information in the adulteration of peanut oil. Last, in the instance of Camellia oil that is adulterated with rapeseed oil (Figure 6j–l), negative correlation was observed across all three bands, with Vis and NIR bands exhibiting very strong correlation (R values less than −0.82), while a strong correlation (R value of 0.754) was exhibited by the UV band. This demonstrated that the prediction ability of the Vis and NIR bands was stronger than that of the UV band in the case of rapeseed oil adulteration. In summary, the IVSO-based feature extraction method was demonstrated to be robust.
3. Materials and Methods
The overall research process diagram is shown in Figure S1 of Supplementary Material.
3.1. Samples Preparation
Five different types of oils were purchased from the local supermarkets in Changsha, China, including Camellia, soybean, rapeseed, corn, and peanut oils. All oils used during the test were within the shelf life.
Soybean, rapeseed, corn and peanut oils were blended into Camellia oil at different blend ratios to prepare adulterated samples. The proportion of blend was 1%, 3%, 5%, 7%, 10%, 15%, 20%, 30%, 40%, 50%, 60%, 70%, 80%, 90% respectively. Four samples were prepared for both each blend ratio of the adulterated samples and five kinds of pure oils. Consequently, the number of test samples in each set of adulterated oil samples reached 64, while the total number of samples in this study was 256. For preparation, the mixed oil samples were placed in a magnetic mixer and stirred at 35 °C for 1 h, followed by a low temperature resting period of 24 h.
3.2. Experimental Platform
An experimental platform (Figure 7) for collecting transmission spectra was composed of a dark box, a cuvette holder, two probe holders, two optical fibers, a spectrometer (OceanView Maya2000 pro, OceanView Company of the United States, Phoenix, AZ, USA), and a light source (HL1000 tungsten halogen lamp, Wen Yi Optoelectronics Technology Co., Shanghai, China). The spectra were collected by OceanView spectroscopy software.
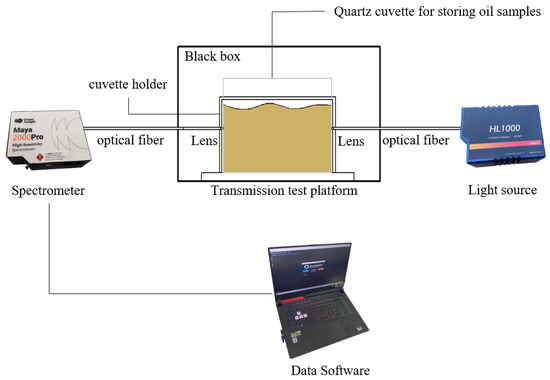
Figure 7.
Transmission measurement platform.
The spectrometer has a spectrum scan range of 200–1100 nm, and was configured to the spectrum integration time of 32 ms and a number of scans of 100. Prior to the experiment, the spectrometer was preheated for 40 min. The mean value was obtained by measuring the same sample three times and calculating the average. The absorbance of the samples was calculated by Equation (1).
where is the absorbance, is the intensity of the collected sample spectrum, is the background intensity of the dark spectrum, and is the intensity of the empty cuvette reference spectrum.
3.3. Spectrum Preprocessing
The spectrum acquisition process is highly susceptible to interference from the external environment or its own internal instability, thus causing confusion and loss of valid information in the spectrum data. To improve the model accuracy, Savitzky–Golay (SG), SG-1st, SG-2nd, and SG-multi-decomposition scale Continuous Wavelet Transform (CWT) were used to preprocess the raw spectra in this study. SG smoothing can effectively improve the signal-to-noise ratio and also has a significant effect on reducing random noise. In this study, the window size for the SG was set to 15 and the polynomial degree was set to 2. Setting the window size too large would lead to excessive smoothing of the spectrum curve, while setting it too small would result in ineffective noise removal [24]. First-order and second-order derivative processing are effective methods for resolving overlapping peaks and eliminating background noise [24]. CWT has the property of refining weak information to highlight localization and can effectively enhance spectrum feature information, and has been applied in noise reduction, de-contextualization, and compression of spectrum data [25,26]. The decomposition scales in CWT were set to 2, , , , , , , , and , which were chosen as the mother wavelet functions for the identification of the dopant content spectra. For simplification, the nine decomposition scales were designated as L1–L9, respectively [25,26].
The preprocessed spectra were brought into the SVR prediction model, and then the optimal preprocessing method was selected by comparing the evaluation criteria of coefficient of determination (R2) and root mean square error (RMSE).
3.4. Feature Wavelength Selection Method
The full spectrum has 2068 wavelengths, and the number of redundant wavelengths affects the accuracy and speed of model predictions. To simplify the prediction model, the feature wavelengths of the preprocessed data were selected by Competitive Adaptive Reweighted Sampling (CARS), Successive Projections Algorithm (SPA), Bootstrapping Soft Shrinkage (BOSS), and Iteratively Variable Subset Optimization (IVSO), respectively.
CARS screens the subset of wavelengths with the smallest root mean square error of cross-validation (RMSECV) as the feature wavelength set with a 10-fold interaction validation cycle [27]. The number of Monte Carlo runs was set to 100 in this study, and 80% of the samples were taken each time as the calibration set.
SPA minimizes the spectrum data dimensionality by reducing the number of input features [28]. The range of the number of wavelengths after setting the SPA downscaling in this study was from 1 to 40.
BOSS continuously adjusts the weights of each wavelength by weighted autonomous sampling (WBS), which can achieve optimal shrinkage of wavelength space [29]. The number of bootstrap samples was set to 1000 in this study.
IVSO simulates the competitive process by weighted binary matrix sampling (WBMS) and sequential addition to progressively reduce the number of useless and interfering information wavelengths [30]. The number of WBMS samples was set to 1000 in this study.
3.5. Models
Support Vector Regression (SVR) and Random Forest (RF) algorithms were utilized to develop the rapid quantitative model of adulterated Camellia oil based on extracted feature wavelengths. Before constructing models, the Kennard–Stone (K–S) algorithm [31] was used to divide the datasets into two segments in a 2:1 ratio, resulting in 43 samples in calibration set and 21 samples in prediction set for each type of adulterated oil samples. Furthermore, the model’s performance was improved through the use of a parameter search method.
SVR constructs the optimal hyperplane to solve the optimal solution by selecting different kernel functions so that the features are mapped to the high-dimensional space. The radial basis function in the kernel function is a nonlinear projection that can cope better with the nonlinear relationship between the label and the predictor variables [32]. In this study, the radial basis function was chosen as the kernel function to develop the SVR model for the fast prediction of adulteration content within Camellia oil. The penalty factor c and kernel function γ within the SVR model were optimized using the grid search method [33] to improve its ability to predict adulteration content within Camellia oil.
RF is an ensemble learning method that utilizes decision trees to make a collective decision, where the majority vote determines the final results [34]. The number of decision trees is a crucial parameter that influences the accuracy of RF. To improve the performance of RF model in predicting the adulterated content of Camellia oil, a particle swarm optimization algorithm [35] was utilized to determine the optimal number of decision trees.
3.6. Model Evaluation
This study evaluated the performance of the developed models by using the coefficient of determination (R2), mean absolute error (MAE), and root mean square error (RMSE) [36], which were defined as Equations (2)–(4), respectively. The accuracy of the models was measured by R2, which ranges from 0 to 1. A lower value of RMSE indicates a better agreement between the predicted and actual adulteration content. Moreover, MAE is a better measure than RMSE for evaluating model accuracy in the presence of outliers. In addition, the calibration set results in the evaluation criteria are expressed as , , , respectively, while the prediction set results are expressed as , , , respectively.
where, y and denote real and predicted adulteration content, respectively; denotes the corresponding average value.
In addition, to investigate the robustness of the extracted feature wavelengths, Pearson correlation coefficient (R), defined as Equation (5) [37], was adopted to analyze the relationships between the absorbance and adulteration content under certain feature wavelengths. Herein, Pearson correlation coefficients ranging from −1 to 0 indicate a negative correlation between adulteration content and absorbance, while the values from 0 to 1 denote a positive correlation. Moreover, the coefficients closer to 1 or −1 demonstrate a strong correlation.
where x and y are the absorbance and adulteration content, respectively; and are the corresponding average values.
4. Conclusions
This study used UV-Vis-NIR transmission spectroscopy to quantitatively predict the content of soybean, rapeseed, peanut, and corn oils blended into Camellia oil. A transmission spectroscopic test platform was built to collect the spectra of oil samples that consisted of Camellia oil mixed with four different edible oils at varying ratios. First, we compared the preprocessing results produced by SG–CWT at different decomposition scales (L1–L9) and obtained SG–CWT (L5) as the best preprocessing method. After preprocessing the full spectra, we used CARS, SPA, BOSS, and IVSO algorithms to obtain the feature wavelengths. Out of these, the IVSO algorithm extracted the most helpful feature wavelengths in improving the model’s prediction accuracy. Notably, the Vis band had the largest number of these feature wavelengths. Next, four distinct quantitative models using SVR or RF models were established, respectively, for predicting the adulteration content of soybean, corn, peanut and rapeseed oils in Camellia oil. The results showed that SVR model was most suitable for Camellia oil mixed with soybean oil, while RF models were appropriate for Camellia oil adulterated with corn, peanut and rapeseed oils, respectively. Specifically, the SVR model for soybean oil adulteration had of 0.9925, RMSEp of 0.0324 and MAEp of 0.0171. Similarly, the RF models had of 0.9845, RMSEp of 0.0398 and MAEp of 0.0282 for corn oil adulteration, of 0.9674, RMSEp of 0.0585 and MAEp of 0.0267 for peanut oil adulteration, and of 0.9937, RMSEp of 0.0267 and MAEp of 0.0155 for rapeseed oil adulteration. Finally, the feature wavelengths proposed by IVSO were subjected to both a significance test and Pearson correlation analysis. The results showed that the correlation between adulteration content and absorbance was strongest for the Vis wavelength, followed by the NIR wavelength and then the UV wavelength. This order of correlation strength indicates that the feature wavelengths extracted by IVSO are reliable. Overall, this study provides valuable references for the development of a low-cost spectroscopic quantification device for adulterated Camellia oil.
Supplementary Materials
The following supporting information can be downloaded at: https://www.mdpi.com/article/10.3390/molecules28165943/s1, Figure S1: Research flowchart.
Author Contributions
Conceptualization, Q.L. and D.L.; methodology, Q.L. and D.L.; software, Q.L.; formal analysis, Q.L. and D.L.; investigation, Q.L. and J.G.; resources, Z.G. and D.L.; writing—original draft preparation, Q.L.; writing—review and editing, D.L. and T.W.; visualization, Q.L. and W.Z.; supervision, Z.G. and D.L.; project administration, T.W.; funding acquisition, T.W. and D.L. All authors have read and agreed to the published version of the manuscript.
Funding
This research was funded by the Key Research and Development Program of Hunan Province, China (2022NK2048), the Natural Science Foundation for Distinguished Young Scholars of Hunan Province (2023JJ10099), Hunan Forestry Science and Technology Project for Distinguished Young Scholars (XLK202108-7), and Key Scientific Research Project of Education Department of Hunan Province, China (22A0187, 20A515).
Institutional Review Board Statement
Not applicable.
Informed Consent Statement
Not applicable.
Data Availability Statement
The data presented in this study are available on request from the corresponding author.
Conflicts of Interest
The authors declare no conflict of interest.
Sample Availability
Not applicable.
References
- Yu, J.; Yan, H.; Wu, Y.; Wang, Y.; Xia, P. Quality evaluation of the oil of Camellia spp. Foods 2022, 11, 2221. [Google Scholar] [CrossRef] [PubMed]
- Li, X.; Tan, Y.; Ma, G.; Bai, X.; Cao, J. Advance in research and application of camellia oil. J. Chin. Cereals Oils Assoc. 2017, 32, 191–196. [Google Scholar]
- Wang, J.; Tang, X.; Chu, Q.; Zhang, M.; Zhang, Y. Characterization of the volatile compounds in Camellia oleifera seed oil from different geographic origins. Molecules 2022, 27, 308. [Google Scholar] [CrossRef]
- Teixeira, A.M.; Sousa, C. A review on the biological activity of Camellia species. Molecules 2021, 26, 2178. [Google Scholar] [CrossRef] [PubMed]
- Guo, W.; Zhu, D.; Zhang, Q.; Du, R. Detection on adulterated oil-tea camellia seed oil based on near-infrared spectroscopy. Trans. Chin. Soc. Agric. Mach. 2020, 51, 350–357. [Google Scholar]
- Zhang, D.; Jin, Q.; Xue, Y.; Zhang, D.; Wang, X. Nutritional value and adulteration identification of oil-tea camellia seed oil. China Oils Fats 2013, 38, 47–50. [Google Scholar]
- Yu, Y.; Zhen, X. Study on Detection of Adulteration Sesame Oil and Oil Tea Seed Oil by Near Infrared Spectrometry. Master’s Thesis, Wuhan Polytechnic University, Wuhan, China, 2018. [Google Scholar]
- Kakouri, E.; Revelou, P.-K.; Kanakis, C.; Daferera, D.; Pappas, C.S.; Tarantilis, P.A. Authentication of the botanical and geographical origin and detection of adulteration of olive oil using gas chromatography, Infrared and Ra-man spectroscopy techniques: A review. Foods 2021, 10, 1565. [Google Scholar] [CrossRef] [PubMed]
- María, A.-S.R.; Ángel, B.L.; Beatriz, Q.-C.; Stefania, V.; Alba, T.; Isabel, C.M.; Carlos, A.-R.; Elena, V.G.; Ayelen, P.A.; Enrico, V.; et al. Stepwise strategy based on 1H-NMR fingerprinting in combination with chemometrics to determine the content of vegetable oils in olive oil mixtures. Food Chem. 2022, 366, 130588. [Google Scholar]
- Rodrigues, N.; Silva, K.; Veloso, A.C.A.; Pereira, J.A.; Peres, A.M. The use of electronic nose as alternative non-destructive technique to discriminate flavored and unflavored olive oils. Foods 2021, 10, 2886. [Google Scholar] [CrossRef]
- Mousa, M.A.; Wang, Y.; Antora, S.A.; Al-Qurashi, A.D.; Ibrahim, O.H.; He, H.J.; Liu, S.; Kamruzzamanh, M. An overview of recent advances and applications of FT-IR spectroscopy for quality, authenticity, and adulteration detection in edible oils. Crit. Rev. Food Sci. Nutr. 2021, 62, 8009–8027. [Google Scholar] [CrossRef]
- Xing, M.; Wang, S.; Lin, J.; Xia, F.; Feng, J.; Shen, G. Composition profiling and authenticity assessment of camellia oil using high field and low field 1H NMR. Molecules 2021, 26, 4738. [Google Scholar] [CrossRef]
- Rohman, A.; Ghazali, M.A.I.B.; Windarsih, A.; Irnawati; Sugeng, R.; Farahwahida, M.Y.; Shuhaimi, M. Comprehensive review on application of FTIR spectroscopy coupled with chemometrics for authentication analysis of fats and oils in the food products. Molecules 2020, 25, 5485. [Google Scholar] [CrossRef] [PubMed]
- Karabagias, I.K. Advances of spectrometric techniques in food analysis and food authentication implemented with chemometrics. Foods 2020, 9, 1550. [Google Scholar] [CrossRef]
- Malavi, D.; Nikkhah, A.; Raes, K.; Van Haute, S. Hyperspectral imaging and chemometrics for authentication of extra virgin olive oil: A comparative approach with FTIR, UV-VIS, Raman, and GC-MS. Foods 2023, 12, 429. [Google Scholar] [CrossRef]
- Zhang, H.; Hu, X.; Liu, L.; Wei, J.; Bian, X. Near infrared spectroscopy combined with chemometrics for quantitative analysis of corn oil in edible blend oil. Spectrochim. Acta Part A Mol. Biomol. Spectrosc. 2022, 270, 120841. [Google Scholar] [CrossRef]
- Du, Q.; Zhu, M.; Shi, T.; Luo, X.; Gan, B.; Tang, L.; Chen, Y. Adulteration detection of corn oil, rapeseed oil and sunflower oil in camellia oil by in situ diffuse reflectance near-Infrared spectroscopy and chemometrics. Food Control. 2021, 121, 107577. [Google Scholar] [CrossRef]
- Melendreras, C.; Soldado, A.; Costa-Fernández, J.M.; López, A.; Valledor, M.; Campo, J.C.; Ferrero, F. An affordable NIR spectroscopic system for fraud detection in olive oil. Sensors 2023, 23, 1728. [Google Scholar] [CrossRef] [PubMed]
- Su, N.; Weng, S.; Wang, L.; Xu, T. Reflectance spectroscopy with multivariate methods for non-destructive discrimination of edible oil adulteration. Biosensors 2021, 11, 492. [Google Scholar] [CrossRef]
- Wu, X.; Bian, X.; Lin, E.; Wang, H.; Guo, Y.; Tan, X. Weighted multiscale support vector regression for fast quantification of vegetable oils in edible blend oil by ultraviolet-visible spectroscopy. Food Chem. 2020, 342, 128245. [Google Scholar] [CrossRef]
- Gong, Z.; Liu, Q.; Li, D.; Wen, T.; Guan, J.; Yi, Z.; Shen, P. Spectral authentication model of adulterated camellia oil based on XGBoost. J. Chin. Cereals Oils Assoc. 2023, 1–10. [Google Scholar] [CrossRef]
- Han, J.; Sun, R.; Zeng, X.; Zhang, J.; Xing, R.; Sun, C.; Chen, Y. Rapid Classification and Quantification of Camellia (Camellia oleifera Abel.) Oil Blended with Rapeseed Oil Using FTIR-ATR Spectroscopy. Molecules 2020, 25, 2036. [Google Scholar] [CrossRef]
- Liu, X.S. A probabilistic explanation of Pearson’s Correlation. Teach. Stat. 2019, 41, 115–117. [Google Scholar] [CrossRef]
- Chu, L.; Yuan, H.; Lu, W. Progress and Application of spectral data pretreatment and wavelength selection methods in NIR analytical technique. Prog. Chem. 2004, 16, 528–542. [Google Scholar]
- Zhang, B.; Guo, B.; Zou, B.; Wei, W.; Lei, Y.; Li, T. Retrieving soil heavy metals concentrations based on GaoFen-5 hyperspectral satellite image at an opencast coal mine, Inner Mongolia, China. Environ. Pollut. 2022, 300, 118981. [Google Scholar] [CrossRef] [PubMed]
- Li, L.; Geng, S.; Lin, D.; Su, G.; Zhang, Y.; Chang, L.; Ji, Y.; Wang, Y.; Wang, L. Accurate modeling of vertical leaf nitrogen distribution in summer maize using in situ leaf spectroscopy via CWT and PLS-Based approaches. Eur. J. Agron. 2022, 140, 126607. [Google Scholar] [CrossRef]
- Li, H.; Liang, Y.; Xu, Q.; Cao, D. Key Wavelengths Screening Using Competitive Adaptive Reweighted Sampling Method for Multivariate Calibration. Anal. Chim. Acta 2009, 648, 77–84. [Google Scholar] [CrossRef]
- Araújo, M.C.U.; Saldanha, T.C.B.; Galvão, R.K.H.; Yoneyama, T.; Chame, H.C.; Visani, V. The successive projec-tions algorithm for variable selection in spectroscopic multicomponent analysis. Chemom. Intell. Lab. Syst. 2001, 57, 65–73. [Google Scholar] [CrossRef]
- Deng, B.; Yun, Y.; Cao, D.; Yin, Y.; Wang, W.; Lu, H.; Luo, Q.; Liang, Y. A bootstrapping soft shrinkage approach for variable selection in chemical modeling. Anal. Chim. Acta 2016, 908, 63–74. [Google Scholar] [CrossRef]
- Wang, W.; Yun, Y.; Deng, B. Iteratively variable subset optimization for multivariate calibration. RSC Adv. 2015, 5, 95771–95780. [Google Scholar] [CrossRef]
- Hartigan, J.; Wong, M. Algorithm AS 136: A K-Means Clustering Algorithm. J. R. Stat. Soc. C-Appl. 1979, 28, 100–108. [Google Scholar] [CrossRef]
- Sun, T.; Meng, T.; Liu, Y. CAMELYON 17 challenge: A comparison of traditional machine learning (SVM) with the deep learning method. Wirel. Commun. Mob. Com. 2022, 2022, 9910471. [Google Scholar] [CrossRef]
- Wang, L.; Li, Z. Identifying the parameters of the kernel function in Support Vector Machines based on the Grid-search method. Period. Ocean Univ. China 2005, 35, 859–862. [Google Scholar]
- Breiman, L. Random Forests. Mach. Learn. 2001, 45, 5–32. [Google Scholar] [CrossRef]
- Wang, D.; Tan, D.; Liu, L. Particle swarm optimization algorithm: An overview. Soft. Comput. 2018, 22, 387–408. [Google Scholar] [CrossRef]
- Zhang, L.; Wu, Z. Evaluation of the chemometrics quantitative analysis model and its application. Chin. J. Anal. Chem. 1996, 24, 97–100. [Google Scholar]
- Oliveira, T.P.; Moral, R.A.; Zocchi, S.S. Icc: An R package to estimate the concordance correlation, Pearson Correlation and accuracy over time. PeerJ 2020, 8, e9850. [Google Scholar] [CrossRef]
Disclaimer/Publisher’s Note: The statements, opinions and data contained in all publications are solely those of the individual author(s) and contributor(s) and not of MDPI and/or the editor(s). MDPI and/or the editor(s) disclaim responsibility for any injury to people or property resulting from any ideas, methods, instructions or products referred to in the content. |
© 2023 by the authors. Licensee MDPI, Basel, Switzerland. This article is an open access article distributed under the terms and conditions of the Creative Commons Attribution (CC BY) license (https://creativecommons.org/licenses/by/4.0/).