Abstract
Nuclear magnetic resonance (NMR) techniques are widely used to identify pure substances and probe protein dynamics. Edible oil is a complex mixture composed of hydrocarbons, which have a wide range of molecular size distribution. In this research, low-field NMR (LF-NMR) relaxation characteristic data from various sample oils were analyzed. We also suggest a new method for predicting the size of edible oil molecules using LF-NMR relaxation time. According to the relative molecular mass, the carbon chain length and the transverse relaxation time of different sample oils, combined with oil viscosity and other factors, the relationship between carbon chain length and transverse relaxation time rate was analyzed. Various oils and fats in the mixed fluid were displayed, reflecting the composition information of different oils. We further studied the correlation between the rotation correlation time and the molecular information of oil molecules. The molecular composition of the resulting fluid determines its properties, such as viscosity and phase behavior. The results show that low-field NMR can obtain information on the composition, macromolecular aggregation and molecular dynamics of complex fluids. The measurements of grease in the free-fluid state show that the relaxation time can reflect the intrinsic properties of the fluid. It is shown that the composition characteristics and states of complex fluids can be measured using low-field nuclear magnetic resonance.
1. Introduction
Fat plays an irreplaceable role in human diet; it gives food a unique flavor and color. The quality of edible oil is also a big issue related to the dietary health of consumers all over the world and may also endanger the health of consumers. Therefore, it is of profound significance to evaluate the quality change of edible oil during use and storage. Using traditional physical and chemical methods to evaluate the quality of edible oil is time-consuming, laborious and has large errors. Compared with traditional detection methods, nuclear magnetic resonance (NMR) is a non-destructive detection method that can maintain the integrity of samples. NMR is a powerful tool for qualitative and quantitative analysis of organic and inorganic substances. Low-field nuclear magnetic resonance (LF-NMR) technology is a new technical means to observe and analyze the physical parameters of samples that has been gradually developed in recent years. At the same time, it symbolizes the research direction of medical detection technology, and complex high-end molecular and chemical materials are being developed for applications in a wider range of industrial and agricultural fields. NMR technology can be used to observe and analyze the characteristics of a material without damaging the sample, with the advantages of being fast, accurate and non-invasive, with no pollution, no radiation and so on. High-field NMR equipment has high sensitivity, high resolution and a high signal-to-noise ratio, but it has high requirements for sample uniformity. Liquids need to be deionized and solids need to be powdered. In addition, the instrument is expensive, and the cost of subsequent maintenance equipment is extremely high. LF-NMR devices, however, use permanent magnets, making them small and cheap. They are thus ideal for online process inspection, industrial quality control and quality inspection. Compared with high-field NMR, LF-NMR is both inexpensive and rapid. Low-field NMR instruments can be made portable. Testing can be done on site rather than in a fixed laboratory [1].
Mixed porous media composed of water and oil are present in most food materials, and the relaxation rate of samples is affected by the pore size. Therefore, the measurement of pore distribution and the distinction between oil and water can be determined and analyzed using LF-NMR. This can also play an important role in the quality control of food safety, such as edible oil [2,3,4,5], yellow croaker [6], prawn [7,8], etc. The transverse relaxation decay curve of LF-NMR can not only be used to monitor the quality of frying oil based on the prediction of physicochemical indices, such as viscosity, acid value and carbonyl value [9], but also to elucidate the correlation between the biophysical state of pure water and the structural properties in dried fermented meat products [10]. What is more, the analysis of transverse relaxation decay curves also plays an important role in food quality control. It has been widely used in the analytical detection of food products such as edible oil incorporation, artifact detection [11], soybean variety discrimination [12] and meat quality analysis [13].
1H NMR spectroscopy has been widely used in the analysis of oil to determine vegetable oil bio-sources [14] and vegetable oil fatty acid profiles [15]. Techniques based on 1H NMR spectroscopy have been intensively developed to characterize bio-oil composition, monitor the bio-oil production process and evaluate the bio-oil concentration in bio-oils and their mixtures [16]. The determination of carbon chain length is critical for liquid fuels because it is one of the key parameters determining their quality and performance [17,18]. Additionally, it strongly influences other quality parameters, such as the viscosity of liquid fuels, thermal values and hexadecane values. The correlation of experimentally obtained T2 relaxation times with viscosity and other physical parameters of different kinds of vegetable oil and other oils is empirically described in most studies. NMR relaxation is used to explain the T2 dependence on the viscosity of alkanes, considering the shape of spherical molecules [19].
In this work, we applied low-field NMR to study the molecular structures of fatty acids and glycerides. The correlation between relaxation rates and the carbon chain lengths of fatty acids and organic fluids suggests that low-field NMR has the potential to serve as a method for rapidly measuring the properties of oily moieties.
2. NMR Theory
Molecular motion determines the relaxation time and available information about molecular components. The spin dynamics of a fluid are characterized by the longitudinal relaxation time T1, transverse relaxation time T2 of the spin system and the diffusion coefficient D of the whole molecule. Among relatively complex fluid mixtures, small molecules diffuse more rapidly than large ones due to their molecular volume. Thus, the diffusion coefficient of a particular hydrocarbon molecule is related to its size or chain length, and the overall fluid environment can affect molecular diffusion. For any relatively complex compound molecule, the relaxation time is determined by intramolecular nuclear dipole interactions, which are influenced by molecular motions. The longitudinal relaxation time T1 is related to the overall molecular rotational tumbling in a solution because the frequency of tumbling must be matched with the frequency of spin transitions required for spin lattice energy transfer. Transverse relaxation explains the rapid phase dispersion of XY magnetization at a rate of 1/T2 induced by an intramolecular dynamic process in the XY plane. During this process, the longitudinal relaxation time T1 is longer than or equal to the transverse relaxation time T2. The rotational correlation time represents the time T it takes for the particle to complete one rotation arc in the solution. It is determined by the size and shape of the particles. The rate of molecular trigger was estimated using the Stokes–Einstein equation (Eq.) [20,21]:
According to this formula, 1/τc is the trigger rate, rg is the radius of gyration, η is the viscosity of the solvent, K is the Boltzmann constant and T is the temperature in Kelvin. The theoretical model, which is a model considering both the Brownian motion of the molecule and the NMR relaxation time, was built on the basis of Bloembergen’s theory. The relaxation rate of the protons within a sample as a function of the rotational correlation time of the molecule τc is shown below:
In these formulae, ℏ is the rationalized Planck constant, which is the Planck constant divided by 2π. γ is the permeability as the ratio of magnetic induction strength B to magnetic field strength h in a magnetic medium. M0 is the permeability over free space, where f is the 1H Larmor precession frequency, indicating ω0 = 2πf. is the distance between two adjacent hydrogen nuclei located on the same compound molecule.
According to Equations (3) and (4), the downfield NMR relaxation times, T1 and T2, differ if the oil contains macromolecular structures. For rapidly moving molecules, both T1 and T2 relaxation times decrease with increasing t. For slow-moving molecules, the T2 relaxation times decrease with increasing τc, T1 relaxation times increase with increasing τc and T1 relaxation times are longer than T2 relaxation times. The size of the molecular aggregates and macromolecules is larger than that of isolated molecules. The reason why T1 relaxation times are longer than T2 relaxation times may be that the trigger rotation rates of these structures are low. Both relaxation time T1 or relaxation time T2 are determined by the rotational correlation time. Thus, NMR relaxation reflects molecular motion: small molecules diffuse more rapidly than large molecules. Thereby, spins on the same molecule in similar solvents have comparable relaxation times.
The viscosity of a fluid sample is jointly determined by all the components in that fluid. It can be analyzed according to Equations (2) and (3), considering that the longitudinal relaxation time is equal to the transverse relaxation time at low magnetic field strength for a fluid of lower viscosity. If the T1 relaxation time is not equal to the T2 relaxation time, this indicates the presence of slower motions compared to molecular-size-related motions, which generally occurs in the presence of larger aggregated polymeric molecules in the fluid. Figure 1 demonstrates that molecular motion is accelerated (for the Larmor frequency of atoms) when ω0 τc < 1, while for a given value, both T1 relaxation times and T2 relaxation times decrease as τc increases. However, when the rate of molecular motion is gradually slowed, the T2 relaxation time will continue to decrease, while the T1 relaxation time will start to increase. This is most likely caused by supramolecular structures or intramolecular aggregation.
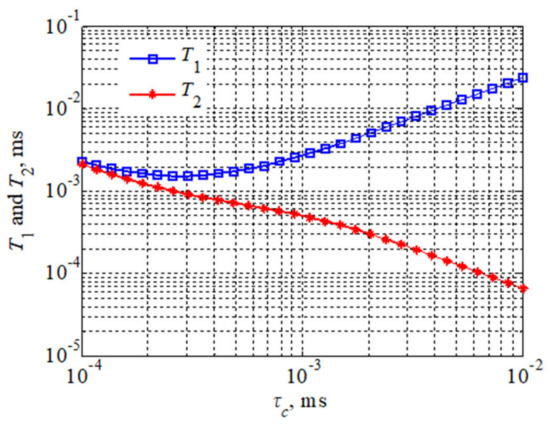
Figure 1.
Theoretical plots of T1 and T2 relaxation times versus Larmor frequency and correlation times.
3. Data Analysis
Because oils have differing viscosity, the longer the carbon chain length of the oil, the higher the saturation degree, and the greater the viscosity. On the contrary, the shorter the carbon chain length of the oil, the lower the saturation degree of the oil, and the lower the viscosity of the oil. Figure 2 and Figure 3 show the measurement results for the T1-T2 distribution of eight different oils. The first type of oil was characterized by high saturation, high viscosity and a shorter relaxation time lasting under 10 ms, such as glycerin, diglycerin, etc.; the second type was resin. The T1 relaxation time of resin-containing grease was longer than the T2 relaxation time. Close interaction with other oil molecules slowed down the rotation of maltene molecules. This reaction resulted in a shorter relaxation time, such as that seen for terpineol. These results indicate that the distribution of T1-T2 is related to the physical properties and the chemical composition of oils. Therefore, the T1-T2 distribution shape can be used to identify different grease properties, as shown in Figure 2 and Figure 3.
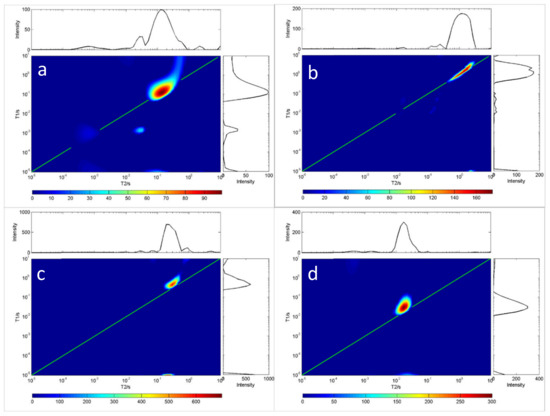
Figure 2.
T1-T2 distribution of four oil samples at room temperature (20 °C). In each chart, the green line indicates the T1 = T2 line. (a) C18H34O2, (b) C24H38O4, (c) C12H20O2, (d) C3H8O3.
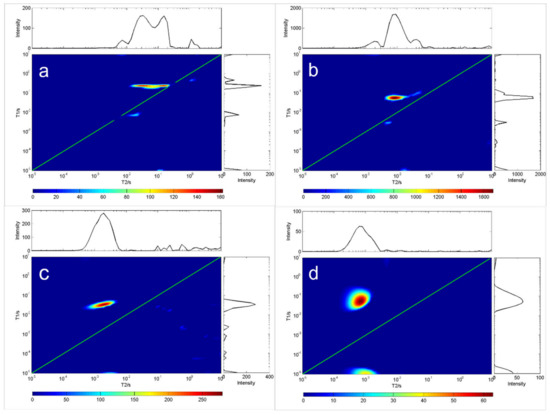
Figure 3.
T1-T2 distribution of four oil samples at room temperature (20 °C). In each chart, the green line indicates the T1 = T2 line. (a) C21H42O4, (b) C24H47NO4, (c) C6H14O5, (d) C30H62O21.
As the oil temperature reached that what is needed for solidification, the crystals emerged, and the sample became solid (Figure 3). The gel formed a rigid network that stopped the oil from flowing. The network consisted of a fraction of the weight of the sample; at the molecular level, most oil molecules remain in the fluid state. T2 was unchanged and T1 was increased, indicating that the rotation of most oil molecules was not affected by the formation of rigid networks. Note that in this case, oil viscosity cannot be predicted from relaxation measurements alone.
The theoretical relationship between the distribution and T1, T2 and T1/T2 can be obtained from Equation (4). The results were analyzed to reveal the movement differences of each type and size of molecules in the fluid. Molecular dynamics reflects fluid. The distribution of rotation correlation time also reflects the rotation correlation time of all molecules, which can be used to analyze the molecular dynamics of complex fluids.
Therefore, oils with similar viscosity and molecular structure were selected for data analysis and processing (Table 1).

Table 1.
Experimental values of carbon chain length and spin–spin relaxation rate of oils.
In the experiment, the transverse relaxation time rate R2 depends on the composition of different oil molecules in the sample. The Bloembergen–Purcell–Pound (BPP) method is usually used to describe the spin–spin NMR relaxation in liquids. According to the BPP theory, the spin–spin relaxation time T2 or the relaxation rate R2 (R2 = 1/T2) depends on the molecular rotation rate expressed by the rotation correlation time τc (Figure 1), which is a characteristic parameter of the molecular rotation rate. The liquid sample ω0τc ≪ 1 (the resonance frequency of the nuclear magnetic resonance device) and R2 increase linearly with an increase in the relevant time, as shown below:
In this equation, M2 is the value of the second-order matrix, which is determined by the intensity of dipole–dipole interaction between adjacent atomic nuclei. The rotation correlation time in the BPP equation can be described by the Stokes–Einstein–Debye equation:
where V is the effective volume of the molecule, η is the viscosity, T is the Kelvin temperature, K is the Boltzmann constant and is determined by experiments and Cr is the fitting parameter. The Stokes–Einstein–Debye equation is usually used for homogeneous fluid in its modified form, and its molecules are described as spheres with hydrodynamics or a Stokes radius, rather than molecules.
Rotation-related motion contributes the most to the NMR relaxation spectrum, while the frequency range of the translation motion contributes less. The measurement of NMR relaxation does not consider that vibration may be due to high-amplitude frequency. The rotation correlation time of different molecular motions is a time parameter in a specific correlation function. Complex modeling is required to describe them separately. On the other hand, the rotational correlation time of molecules can be calculated by the known corresponding diffusion coefficient, which is described by the Stokes–Einstein equation:
where Dr is the rotational diffusion coefficient, K is the Boltzmann constant, T is the temperature, η is the viscosity and R is the Stokes molecular radius. When describing the rotational motion of molecules, it is often thought that molecules have a spherically shaped hydrodynamic radius. Considering that the effective volume of the molecule is equal to:
The combination of Equations (5)–(7) gives the following results:
Therefore, it is clear that the rotation correlation time depends on the corresponding diffusion coefficient (Equation (10)). Equation (10) is a widely used ratio for calculating the NMR relaxation correlation time, because the rotational molecular motion is the main contributor to NMR relaxation. In general, molecules with different shapes can be characterized by hydrodynamic radii. In order to correlate the rotational diffusion coefficient with the molecular weight, known ratios can be used to describe the self-diffusion and self-behavior of the untwisted polymer chain. For molecules, there is a direct dependency between these two parameters:
where Mwc is the entanglement coupling molecular weight, and α is the coefficient, equal to 1. By combining Equations (6), (10), and (12), we can clearly see the linear relationship between R2 and molecular weight.
It is easy to assume that in the case of unbranched hydrocarbons with similar chemical organization, the molecular weight is proportional to the molecular size, which can be evaluated by CL. Considering the dependence of R2 on the molecular weight Mw (Equation (13)), we can assume that R2 is linearly dependent on CL:
The decay of the CPMG pulse-echo sequence of all oil samples was measured, and then the spin–spin relaxation rate R2 was determined using single-exponential function fitting. The obtained R2 values are provided in Table 1. The carbon chain length CL is plotted as a function of the relaxation rate in Figure 4, showing a linear relationship. By applying a linear fit to the dataset, the model can be calculated as follows:
where a = −52.998 and b = −1.5597.
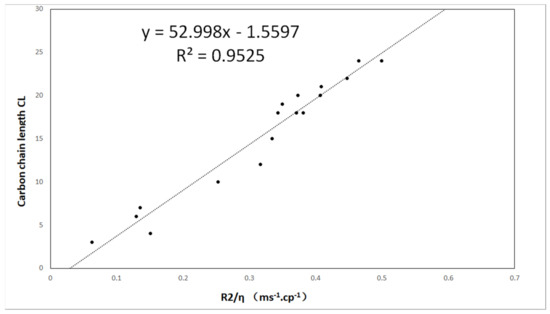
Figure 4.
The carbon chain length CL is plotted as a function of R2/η. The dotted line is fitted by the linear model.
In this study, the correlation between carbon chain length and relaxation rates was obtained, showing good consistency with previous results. We can use this to obtain the carbon chain length by using LF-NMR. Grease was selected due to its properties, including a temperature lower than room temperature. However, in addition to the main components, oils can have higher carbon chain lengths (more than 20). Therefore, the carbon chain length of general vegetable oils is generally longer than that used in this study. From Equation (13) and our experimental results, it can be seen that the relaxation rate of oil molecules has a linear relationship with the length of the carbon chain. It is clear that this relationship applies to longer molecules.
4. Experiment
The oil samples used in this experiment were various vegetable oils mainly composed of glycerides and fatty acids. Oil samples kept at a constant temperature were loaded into the test tubes and labeled. These were capped and sealed to avoid volatilization of the light hydrocarbon components during NMR relaxometry, which ensured accurate, effective and error-free relaxation time measurement. Oil and fat samples with different carbon chain lengths were prepared by Shanghai Macklin Biochemical Technology Co. (Shanghai, China) The oils and fats in this study were selected based on their properties, and they were maintained at a temperature below their melting point, 25 °C, for measurement at room temperature. Their properties (molecular weight, state and molecular carbon chain length) are given in Table 2. The viscosity of the samples was measured at 20 °C.
Table 2.
Oils and fats used for sample preparation.
Table 1 was calculated using the hard-pulse CPMG (Carr–Parcell–Meiboom–Gill) sequence, and the echo time and number of echoes were set. The instrument used for relaxometry measurements in this experiment was MicroMR from the Niumag company, with a main frequency of 23 MHz. In this experiment, 16 repeated scans were carried out because the signal intensity of oil was relatively strong compared to the moisture signal. The sampling frequency setting was set to approximately 250 kHz to obtain more effective signals in grease. The parameters used are as follows: repetitive sampling latency TR, 10 s; echo time TE, 0.3 ms; the number of echoes was around 1000 and main value SF of the RF signal frequency, 23 MHz. Measurements for all experiments were performed at room temperature (25 °C).
5. Conclusions
We used NMR relaxation to measure vegetable oil, collected and analyzed NMR signals of more than 20 different kinds of vegetable oil and essential oil samples, obtained the oil samples’ transverse relaxation times and the rate of oil samples and determined the possible interaction of these molecules by inferring and analyzing the relationship between the length of the oil carbon chain and the transverse relaxation time rate. NMR relaxation reflects molecular motion. Small molecules diffuse farther and rotate faster than large molecules, indicating that all spins on the same molecule in similar solvents have a considerable relaxation time. The results of this study show that the rotation-related time distribution is directly related to the molecular size distribution and molecular dynamics in oil solutions. The rotation correlation time of oil also reflects the interaction between molecules and the viscosity of the oil solution. We obtained the correlation between the NMR results and the molecular carbon chain length, which can be used to determine the carbon chain length.
Author Contributions
Conceptualization, Z.J. and C.L.; data curation, Z.J.; writing—original draft preparation, Z.J.; writing—review and editing, C.L. All authors have read and agreed to the published version of the manuscript.
Funding
This research was supported by the National Natural Science Foundation of China (NSFC China 81773482, 42004105); the Natural Science General Program of the Higher Education Institutions of Jiangsu Province (Grant No. 20KJD430002); the Key Scientific and Technological Projects of Science and Technology Commission of Shanghai Municipality (18142201200); the Development of Major Scientific Instruments and Equipment of the State (2013YQ17046303) and the Shanghai Key Laboratory of Molecular Imaging (18DZ2260400).
Conflicts of Interest
The authors declare no conflict of interest.
Sample Availability
Samples of the compounds are not available from authors.
References
- Blümich, B. Low-field and benchtop NMR. J. Magn. Reson. 2019, 306, 27–35. [Google Scholar] [CrossRef] [PubMed]
- Zhao, T.T.; Wang, X.; Lu, H.Y.; Liu, B.L. The Quality Assessment of Edible Oils and Fats by LF-NMR Coupled with PCA. Mod. Food Sci. Technol. 2014, 30, 179–185. [Google Scholar]
- Zhu, W.; Wang, X.; Chen, L. Rapid detection of peanut oil adulteration using low-field nuclear magnetic resonance and chemometrics. Food Chem. 2017, 216, 268–274. [Google Scholar] [CrossRef] [PubMed]
- Santos, P.M.; Kock, F.V.C.; Santos, M.S.; Lobo, C.; Carvalho, A.S.; Colnago, L.A. Non-invasive detection of adulterated olive oil in full bottles using time-domain NMR relaxometry. J. Braz. Chem. Soc. 2017, 28, 385–390. [Google Scholar] [CrossRef]
- Wu, J.; Li, Y.; Gao, X. Simultaneous determination of oil and water in soybean by LF-NMR relaxometry and chemometrics. Chem. Res. Chin. Univ. 2016, 32, 731–735. [Google Scholar] [CrossRef]
- Zang, X.; Lin, Z.; Zhang, T.; Wang, H.; Cong, S.; Song, Y.; Li, Y.; Cheng, S.; Tan, M. Non-destructive measurement of water and fat contents, water dynamics during drying and adulteration detection of intact small yellow croaker by low field NMR. J. Food Meas. Charact. 2017, 11, 1550–1558. [Google Scholar] [CrossRef]
- Li, M.; Li, B.; Zhang, W. Rapid and non-invasive detection and imaging of the hydrocolloid-injected prawns with low-field NMR and MRI. Food Chem. 2018, 242, 16–21. [Google Scholar] [CrossRef]
- Wang, H.; Wang, R.; Song, Y.; Kamal, T.; Lv, Y.; Zhu, B.; Tao, X.; Tan, M. A fast and non-destructive LF-NMR and MRI method to discriminate adulterated shrimp. J. Food Meas. Charact. 2018, 12, 1340–1349. [Google Scholar] [CrossRef]
- Sun, Y.; Zhang, M.; Fan, D. Effect of ultrasonic on deterioration of oil in microwave vacuum frying and prediction of frying oil quality based on low field nuclear magnetic resonance (LF-NMR). Ultrason. Sonochemistry 2019, 51, 77–89. [Google Scholar] [CrossRef]
- García, A.B.G.; Rodríguez, M.; de Ávila Hidalgo, M.; Bertram, H.C. Water mobility and distribution during dry-fermented sausages “Spanish type” manufacturing and its relationship with physicochemical and textural properties: A low-field NMR study. Eur. Food Res. Technol. 2017, 243, 455–466. [Google Scholar] [CrossRef]
- Wang, X.; Wang, G.; Hou, X.; Nie, S. A Rapid Screening Approach for Authentication of Olive Oil and Classification of Binary Blends of Olive Oils Using Low-Field Nuclear Magnetic Resonance Spectra and Support Vector Machine. Food Anal. Methods 2020, 13, 1894–1905. [Google Scholar] [CrossRef]
- Jiang, C.; Han, J. Rapid identification of rice varieties based on low-field NMR technology. Sci. Technol. Food Ind. 2012, 33, 64–66. [Google Scholar]
- Gai, S.; Zhang, Z.; Zou, Y.; Liu, D. Rapid and non-destructive detection of water-injected pork using low-field nuclear magnetic resonance (LF-NMR) and magnetic resonance imaging (MRI). Int. J. Food Eng. 2019, 15, 20180313. [Google Scholar] [CrossRef]
- Fauhl, C.; Reniero, F.; Guillou, C. 1H NMR as a tool for the analysis of mixtures of virgin olive oil with oils of different botanical origin. Magn. Reson. Chem. 2000, 38, 436–443. [Google Scholar] [CrossRef]
- Knothe, G.; Kenar, J.A. Determination of the fatty acid profile by 1H-NMR spectroscopy. Eur. J. Lipid Sci. Technol. 2004, 106, 88–96. [Google Scholar] [CrossRef]
- Monteiro, M.R.; Kugelmeier, C.L.; Pinheiro, R.S.; Batalha, M.O.; da Silva César, A. Glycerol from biodiesel production: Technological paths for sustainability. Renew. Sustain. Energy Rev. 2018, 88, 109–122. [Google Scholar] [CrossRef]
- Knothe, G. Dependence of biodiesel fuel properties on the structure of fatty acid alkyl esters. Fuel Process. Technol. 2005, 86, 1059–1070. [Google Scholar] [CrossRef]
- Ramírez-Verduzco, L.F.; Rodríguez-Rodríguez, J.E.; del Rayo Jaramillo-Jacob, A. Predicting cetane number, kinematic viscosity, density and higher heating value of biodiesel from its fatty acid methyl ester composition. Fuel 2012, 91, 102–111. [Google Scholar] [CrossRef]
- Hürlimann, M.D.; Freed, D.E.; Zielinski, L.J.; Song, Y.Q.; Leu, G.; Straley, C.; Boyd, A.; Minh, C.C. Hydrocarbon composition from NMR diffusion and relaxation data. Petrophysics-SPWLA J. Form. Eval. Reserv. Descr. 2009, 50, SPWLA-2009-v50n2a3. [Google Scholar]
- Einstein, A. On the movement of small particles suspended in stationary liquids required by the molecular-kinetic theory of heat. Annalen. der Physik. 1905, 17, 549–560. [Google Scholar] [CrossRef]
- Bloembergen, N.; Purcell, E.M.; Pound, R.V. Relaxation effects in nuclear magnetic resonance absorption. Phys. Rev. 1948, 73, 679–746. [Google Scholar] [CrossRef]


Disclaimer/Publisher’s Note: The statements, opinions and data contained in all publications are solely those of the individual author(s) and contributor(s) and not of MDPI and/or the editor(s). MDPI and/or the editor(s) disclaim responsibility for any injury to people or property resulting from any ideas, methods, instructions or products referred to in the content. |
© 2022 by the authors. Licensee MDPI, Basel, Switzerland. This article is an open access article distributed under the terms and conditions of the Creative Commons Attribution (CC BY) license (https://creativecommons.org/licenses/by/4.0/).