Abstract
The aim of this work was to determine Fulvic Acids (FAs) in sediments to better know their composition at the molecular level and to propose substructures and structures of organic precursors. The sediment samples were obtained from a priority area for the conservation of ecosystems and biodiversity in Mexico. FAs were extracted and purified using modifications to the International Humic Substances Society method. The characterization was carried out by 1D and 2D nuclear magnetic resonance (NMR) and high-performance liquid chromatography-electrospray ionization-mass spectrometry (HPLC-ESI-MS) in positive (ESI+) and negative (ESI−) modes. Twelve substructures were proposed by the COSY and HSQC experiments, correlating with compounds likely belonging to lignin derivatives obtained from soils as previously reported. The analysis of spectra obtained by HPLC-ESI-MS indicated likely presence of compounds chemically similar to that of the substructures elucidated by NMR. FAs studied are mainly constituted by carboxylic acids, hydroxyl, esters, vinyls, aliphatics, substituted aromatic rings, and amines, presenting structures related to organic precursors, such as lignin derivatives and polysaccharides.
1. Introduction
The natural organic matter (NOM) present in sediments, soil, and water is considered a very complex chemical matrix, constituted by organic compounds from animal and/or plant origin. NOM is divided into non-humic substances (NHS) and humic substances (HS). The HS are classified into fulvic acids (FAs), humic acids (HAs), and humins (HUs), which are mainly constituted by carbon, hydrogen, and oxygen. Likewise, FAs and HAs also include heteroatoms in their structure, such as nitrogen, sulfur, and phosphorus [1,2,3,4].
In natural and polluted environmental compartments, the physicochemical properties of FAs are of special interest, since they are soluble in the aqueous medium at any pH range and could form hydrogen bonds with water and undergo transfer from the sediment to the aqueous medium. The acidic behavior of FAs is provided by a variety of functional groups such as COOH in fatty and aromatic acids, or substituents from amino acids and phenolic OH groups that come from tannin and lignin structures [5,6,7,8].
The characterization of the structures of humic compounds can provide important information about the primary material and the probable formation mechanism. It represents the starting point in evaluating the capacity for interaction with heavy metals [9,10], pesticides [11,12,13], and different classes of organic compounds, such as polycyclic aromatic hydrocarbons (PAHs) [14,15].
The separation of FAs into fractions with different chemical properties to reduce their heterogeneity remains a challenge. At present, various techniques to isolate FAs have been used, including resin techniques XAD-8 resin and diethyl-aminoethyl cellulose, suggested by the International Humic Substances Society (IHSS), which has a large adsorption capacity, and the adsorbed HS are partly recovered by eluting them with basic solutions [16], chromatographic techniques (such as reversed-phase liquid chromatography and high-performance size exclusion chromatography), ultrafiltration, and electrophoresis [17].
Nuclear Magnetic Resonance (NMR) has been widely used in the characterization of the structural units in different types of lignin preparations and HS. The NMR method is non-destructive and provides direct information about the chemical nature of structural components. However, for HS studies, one-dimensional (1D) and two-dimensional (2D) NMR spectra have low resolution [18,19]. The 1D spectra especially exhibit overlapping signals, which makes structural analysis unreliable and the identification of substructures (combinations of functional group) or structures difficult [5,6,7,20,21,22,23,24,25].
The structural elucidation of HS has been also carried out by mass spectrometry (MS) through electrospray ionization (ESI), either in positive (ESI+) or negative (ESI−) ion mode, for characterization of NOM. The ESI− mode is more adequate for acid compounds [26]. On the other hand, ESI+ mode provides better results for aliphatic and carbohydrate compounds [27].
Despite the fact that FAs have an important role in the environment, the molecular composition of these organic compounds in sediments, no studies have yet been conducted in Mexico. Therefore, this work aims to contribute to a better understanding of the chemical structure that constitutes HS in sediment. The analysis involved a process of selective and modified extraction and purification, an improved procedure of conservation of the sample in an inert medium, and a structural characterization by NMR (1D and 2D at 500 MHz) and HPLC-ESI-MS.
2. Results and Discussion
2.1. Optimization of Conditions for a High Spectral Resolution in NMR
Two samples were collected in November 2018—FABC1 and FABC2. Spectral resolution in NMR experiments was improved through the following: (1) DMSO-d6 was chosen as the solvent because it prevents the aggregation of FAs components through intermolecular interactions in solution [21,28,29]; (2) the amount of 3 mg in 600 μL used in the preparation of the FABC1 sample contributed considerably to decreasing signals overlap as the mass quantities in a range of 15 to 99.6 mg in DMSO-d6 showed overlapping of signals or cross peaks in 1D and 2D spectra, respectively [5,6,21,24,25,30]; (3) the increased number of scans in all the experiments compared to that reported in other studies increasing sensitivity [20,21]; (4) the adjustment of acidic to neutral pH in the final eluate decreased selectively the number of signals in the NMR spectra [31].
2.2. Identification of Functional Groups through 1H NMR
The 1H NMR spectrum was used to interpret the chemical characterization of the FAs. The spectrum was grouped from “A” to “F”, according to chemical shifts ranges for HS. Table 1 (Table S1) shows the abundance of each of the groups, predominating the aliphatic region (57%), followed by the intermediate region consisting mainly of methyl and methylene adjacent to carbonyl groups (carboxylic acids, esters) and aromatic rings (19.62%), ethers adjacent to aromatic rings in the lignin structure and polysaccharide rings (14%), and aromatic protons (8.11%).

Table 1.
Specific ranges for signals in 1H NMR spectrum corresponding to the functional groups that constitute fulvic acids. As well as the comparison of the integration percentages obtained from sections “A” to “F” in said spectrum.
2.3. Assignment of Substructures through COSY Spectrum NMR
2.3.1. The Aliphatic and Intermediate Regions
To complement the results obtained with the 1H NMR spectra, a Correlation Spectroscopy (COSY) experiment was carried out. The aliphatic and intermediate regions of the COSY spectrum are located between 0.4 and 5.6 ppm (Figure 1). The analysis showed correlations of the aliphatic protons corresponding to cross peaks 1, 2, 3, and 4, and 1, 2, 3, and 5. The couplings between aliphatic protons and vinyl protons correspond to cross peaks 6, 7, and 8.
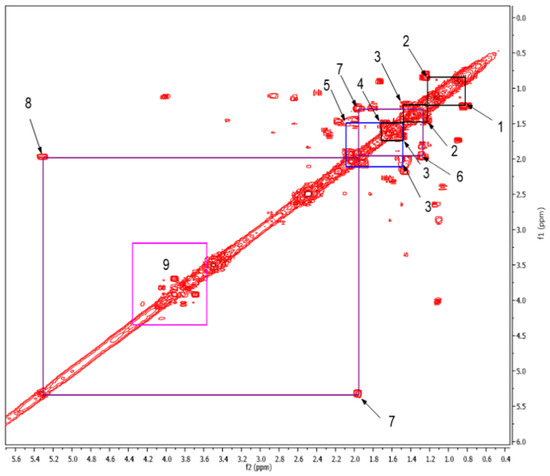
Figure 1.
Expansion of the 2D COSY spectrum from 0.4 to 5.6 ppm, which corresponds to the aliphatic and intermediate regions. The box labelled as 9 corresponds to cross peaks of carbohydrates/polysaccharides in positions 2, 3, 4, 5, and 6 (Table S1).
From the observed correlations, the substructures A, B, and C were proposed (Table 2). Cross peaks 1–2, 2–3, and 3–4 represented couplings between protons in aliphatic chains. It was proposed that the protons corresponding to 3–4 were attached to a carbonyl group because said correlation is the most displaced towards upfield. Comparing this with correlations 3–5 and 7–8 allowed the proposal of substructure “A”. Meanwhile correlations between cross peaks 1–2, 2–3, and 3–5 suggested that the protons corresponding to correlation 3–5 were attached to a more electronegative functional group than a carbonyl group, which could be an ester, shifting them in the downfield direction, giving rise to substructure “B”. Additionally, cross peaks 6–7 showed correlations between aliphatic protons bound to vinyl protons that corresponded to couplings 7–8, and could result in substructure “C”.
Table 2.
Suggested substituents according to the correlations found between aliphatic protons and vinyl protons.
For its part box number 9 corresponds to the carbohydrate/polysaccharide region, which are difficult to identify by NMR, since in this area of the spectrum the signals are overlapped and correlations cannot be established that allow us to know what type of sugars are present in the sample. These results are consistent with that reported by Simpson et al., 2001 [20].
2.3.2. The Aromatic Region
On the other hand, the aromatic region of the COSY spectrum shows 17 sets of cross peaks (Figure 2). Taking into account the chemical shifts of the coupled proton pairs, 12 aromatic substructures were proposed that correlated well with compounds belonging to lignin derivatives obtained from sediments [6,20,32] (Table 3).
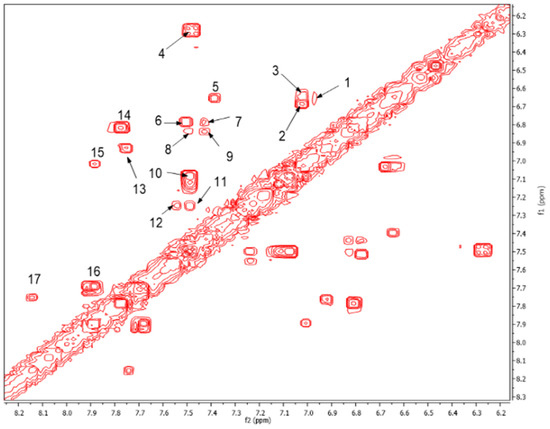
Figure 2.
Expansion of the aromatic region of the COSY spectrum from 6.2 to 8.2 ppm. The chemical shifts of the cross peaks numbered from 1 to 17 and their respective couplings are shown in Table 3.
Table 3.
Suggested aromatic substructures of the FAs corresponding to lignin derivatives, which were obtained by COSY and HSQC experiments.
Each group in Table 3 corresponds to aromatic substructures substituted with electro-donating groups adjacent to H1 or H1* or electro-withdrawing groups adjacent to H2 that can be in ortho, meta, or para positions. Group “A” has an aromatic ring substituted with two electro-donating groups in position para, i.e., adjacent to H1 and H1*, and are the groups OR and R, respectively, where R can be a hydrogen, methoxy, or an aliphatic carbon in a lignin linking group. Consequently, assuming that R is -H or -OCH3 group, these could present a mesomeric effect through the unshared pairs of electrons from oxygen, since they are delocalized towards the ring and its electron density increases, especially in the ortho and para positions, shielding to H1 and H1*. Group “B” shows couplings for vinyl protons where it can be observed that H2* is adjacent to the aromatic ring, both for structure “A” as for “B”. Magnetic anisotropy generates protons adjacent or close to aromatic rings that are particularly less shielded due to the magnetic field induced by the electronic currents of these systems. Besides, the induced field is added to that applied through NMR, producing a shift higher than expected. Therefore, H2* protons are less shielded than H1 and H2 protons, showing a difference of more than 1 ppm between them. Group “C” shows di- and tri-substituted aromatic rings, evidencing the highest number of couplings between H1 and H2 in these organic compounds. These could be adjacent to methoxy or alcohols groups and functional groups such as carboxylic acids, aldehydes, esters, ketones, etc., respectively, showing very similar chemical shifts between them. For group “D” a tetra-substituted aromatic structure is observed with a methoxy group adjacent to H1 and an electro-withdrawing group such as carboxylic acids and/or esters groups adjacent to H2. Finally, group “E” has di-, tri-, and tetra-substituted benzenes. H1 probably is adjacent to -H or -OCH3 group and H2 could be adjacent to the same groups mentioned for group “D”. However, it is observed that the substitution of the rings with two or three electro-withdrawing groups such as COO-R, displaced the chemical shifts toward downfield in the aromatic region due to a negative inductive effect.
2.4. 13C Analysis
The 13C functional groups were determined by the following chemical-shift areas [33,34]: alkyl-13C signals, 0 to 50 ppm; O-alkyl-13C signals, 50 to 90 ppm; vinyl-13C signals, 90 to 130 ppm; aromatic-13C signals, 110 to 165; and carboxyl-13C signals, 165 to 190 ppm [5,20,30] (Table 4) (Table S2). The signal intensities in the respective chemical shift regions are expressed as a percentage of the total spectra area. The proportion obtained for the 13C-alkyl fraction was 26.5%, O-alkyl 28.5%, vinyl 12.8%, aromatic 19.3%, and carboxyl 12.8% (Figure S1).
Table 4.
Specific ranges for signals in 13C corresponding to the functional groups that constitute fulvic acids.
The assignment of signals found in the 13C spectrum, suggests that alkyl-C and O-alkyl-C are the dominant components, which can probably be used by microorganisms during humification processes [35]. Meanwhile the region of aromatic-13C includes phenolic-13C, derived from lignin and tannin and bacterial resynthesized compounds consisting of alkyl-C and carboxyl-C [36,37].
One way to assess the degree of humification of sediments can be done by using the alkyl-C/O-alkyl-C ratio and the aromaticity [38,39]. The alkyl-C/O-alkyl-C ratio calculated in the present study was 0.64, while the aromaticity was 0.22, which indicates that the aliphatic fraction and the one that regulates humification in the studied site.
2.5. Assignment of Functional Groups or Substructures through HSQC Spectrum
Likewise, a 2D HSQC experiment was carried out of the FAs isolated. The results revealed a total of 67 cross peaks. An expanded aromatic region of the HSQC spectrum is shown in Figure 3, observing 12 cross peaks. Thus, according to the chemical shifts established for 1H and 13C of the FAs [5] and organic compounds [32], the correlations contributed to assigning of functional groups or substructures from organic precursors of the FAs (Table 1, Table 3, and Table 4).
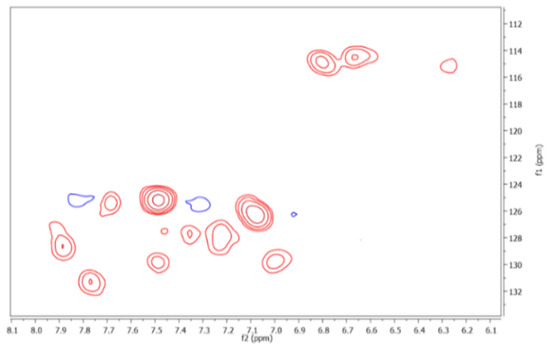
Figure 3.
12 cross peaks are observed in the aromatic region of the HSQC spectrum.
2.6. DOSY Spectrum Analysis
Finally, the DOSY experiment indicated the incidence that diffusivity has on the separation of a complex mixture, supporting the information that the HS are aggregates of small species and high molecular weight non-macromolecules [21]. The signals corresponding to the components of the polysaccharides presented the slowest diffusion coefficients in solution, which were found in an interval of −log(D) = 9.13–10.33. This means that the structures have larger hydrodynamic radii than the rest of the components in the sample solution and, thus, must be polysaccharides instead of only carbohydrate/saccharide units, which is consistent with the results reported by Simpson et al., 2001 [21]. The main aliphatic components show faster diffusivities (−log(D) = 9.34–10.1) than the polysaccharides and have been identified through the spectra of 1H and 13C in Table 1 and Table 4, respectively. The fine signal forms for vinyl and lignin derived aromatics with values of −log(D) = 9.46–9.98 and −log(D) = 9.19–10.12, respectively, in FAs suggest that they are relatively low molecular weight, indicating that they are among those with the fastest diffusion coefficients (Figure 4).
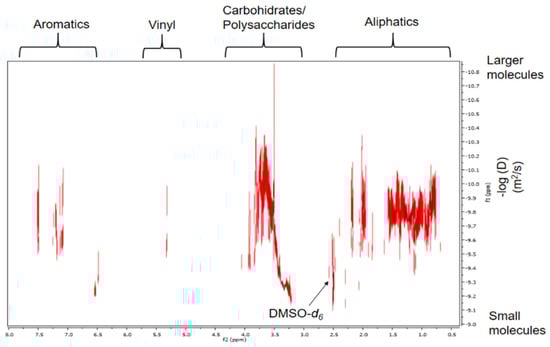
Figure 4.
Spectrum corresponding to the DOSY 2D projection.
We assume that the apparent molecular weights for carbohydrates are greater than 1500 Daltons (Da), because the diffusion coefficient range is greater for these components than that reported in other studies [21,33]. Furthermore, it should be noted that we obtained a high spectral resolution in the DOSY experiment, which is comparable to the high resolution of the 2D DOSY spectrum obtained in 500 MHz equipment with cryoprobe [21]. This was probably due to the selective and modified extraction and purification process for FAs (Section 3.4 and Section 3.4.1). In addition, to improve the sensitivity of the equipment and increase the spectral resolution, zero filling and forward linear prediction were used. Also, we increased by 14 times the number of scans reported by Simpson et al., 2001 [21].
2.7. Assignment of Structures through HPLC-ESI-MS
In order to check the presence of compounds with chemical characteristics similar to those elucidated by NMR, the purified and diluted sediment extract was also analysed by HPLC-ESI-UV and HPLC-ESI-MS. The UV signals indicated chromophore groups in the mixture (Figures S2–S7) (Table 5), since the FAs have functional groups that contain electrons that can present transitions by absorption of specific light. The functional groups responsible for absorption in the ultraviolet region are mainly aromatic rings, which can be substituted in different ways with functional groups, including hydroxyl, carboxylic acids, and aliphatic chains [40]. The 220, 253, and 280 nm wavelengths monitored were chosen according to reported studies [41] (Tables S3 and S4). The absorbances at 280 nm may be indicative of the degree and possible nature of the ring substitution, while the absorption band at 220 and 253 nm has been shown to correlate highly with the degree of aromaticity for HS. Overall, quasi-molecular ions obtained, could be associated with compounds that presented carboxylic acids, aromatic rings, hydroxyls, esters, vinyls, aliphatics, and amines, which is consistent with the groups suggested by the analysis obtained through COSY and HSQC experiments (Table 3).
Table 5.
Suggested molecular formulas from the spectra obtained by HPLC-ESI-MS.
On the other hand, some structures with a neutral charge were searched from the database of the NIST (National Institute of Standards and Technology) which were able to relate to the M.W. of the molecular ions corresponding to the quasi-molecular ions with the highest percentage of relative abundance in the mass spectra (Figures S8–S19). This was done in order to propose structures related to possible organic precursors from FAs. Particularly, the analysis of mass spectra obtained by HPLC-ESI (+)-MS at a wavelength of 220 nm, indicated the presence of the compound with molecular formula (C6H13N, m/z = 99.4), which probably corresponds to 1,1-dimethylamine-1-butene, and can be protonated (m/z = 100.4) (Table 5). Similarly, it was found (C6H11N3, m/z = 125.3), which probably corresponds to 1-(3-aminopropyl) imidazole, pKa = 6.5 [41], thus nitrogen of imidazole ring could be protonated corresponding with m/z = 126.3 [42]. It should be noted that some molecular ions could be related only to one structure in the NIST database. For example, A** and B ** (m/z = 99.4 and m/z = 125.3) in Table 5. However, this does not rule out the possibility that some m/z values corresponding to quasi-molecular ions can be observed at different retention times (tR), suggesting the presence of homologous organic series in the mixture of FAs.
Meanwhile C, D, and E compounds have a molecular formula of CxHyOz and could be ionized in positive mode because these have oxygen atoms rich in electrons [43] (Table 5). In comparison with NMR experiments, the proposed structure of 1,2-Benzenedicarboxylic acid, diundecyl ester for D, which has a molecular weight of 474 g/mol (Table 5), likely correspond with a substructure elucidate from the cross peaks at 7.70, 7.92, 7.75, and 8.14 ppm for 1H and 131.28 and 128.64 ppm for 13C. These results are consistent with functional groups reported by a model of the hypothetical path of fragmentation obtained from Suwannee River Fulvic Acid (SRFA) [8], which was derived using electrospray ionization/ion trap multistage tandem mass spectrometry (ESI/MST/MS). In this model, water losses are characteristics of the dehydration of alcohols and the formation of anhydrides. CO2 losses corresponding to decarboxylation and CO losses from esters were also observed. Such a model points to lignin precursors because the final ionic product at 109 m/z was O-dihydroxybenzene and this is indicative of lignin structure [22]. Also, the quasi-molecular ion at 365.1 m/z was obtained by negative ion mode from the sediment sample. The proposed formula for its molecular ion (366.1 m/z) was C17H18O9 (Table 5), which is congruent with the structure suggested by Witt et al., 2009, that showed an ion quasi-molecular weight of 365.088 m/z was obtained from a sample of FAs extracted from dissolved organic matter (DOM) [44].
The α-hydrogens in carbonyl components and hydrogen bound to oxygen are acids, which are easily unprotonables in ESI− mode [27]. Although carbohydrates are preferentially protonated and efficiently ionized in the positive ion mode, the presence of polysaccharides in sediments could be evidenced through 1893.6 m/z obtained by HPLC-ESI(−)-MS, and it has been reported that neutral oligosaccharides can be identified by negative electrospray ionization collision-induced dissociation tandem mass spectrometry (ESI-CID-MS/MS) for the analysis of their sequence with various bonds, linear and branched structures, and with different residues of saccharides [45]. Compounds related to 1894.6 g/mol and 113.7 g/mol, corresponding to J and K, respectively, were not found.
3. Experimental
3.1. Materials and Methods
For sampling, a 25 cm long auger with 2 cm diameter was used, samples were stored in amber glass containers with airtight lids. The samples were processed in an electric grinder and a 2.00 mm sieve was used to sift them. For the extraction and purification process, columns with 2 cm diameter were used. The reagents such as sodium hydroxide (NaOH), hydrochloric acid (HCl), and hydrofluoric acid (HF) were analytical grade and the resins were SupeliteTM XAD-8 and DOWEX® 50W-X8 (hydrogen form, 50-100 mesh, Merck, Gernsheim, Germany). The extracts were filtered using fine-pore filter paper (Science Med, Aldrich, Mexico City, Mexico). For the NMR experiments, anhydrous hexadeuterated dimethylsulfoxide (DMSO-d6, Aldrich, Mexico) and a J. Young valve NMR tube with a diameter of 5 mm (Wilmad, for 500 MHz, S.P. Scientific, Stone Ridge, NY, USA) were used. For the HPLC-ESI-MS experiments, H2O and acetonitrile grade HPLC were used.
3.2. Description of the Site
The sampling site is located within PEUBC which is a priority area for the conservation of ecosystems and biodiversity in the city of Cuernavaca, Morelos, Mexico. This park is crossed by a stream of water, whose tributary comes from the recharges of the underground aquifers of the Chichinautzin Biological Corridor. The study site was selected for the following reasons: (1) this place does not present deforestation, which contributes to the existence of degraded organic compounds that are derived from plants such as Amate prieto (Ficus continifolia), Yellow amate (Ficus petiolaris), Fresno (Fraxinus uhdei), Clavellino (Pseudobombaxellipticum), Pochote (Ceiba aesculifolia), and Ahuehuete (Taxodium mucronatum), which is 250 years old [48]; (2) PEUBC has high values of carbon fixation, which reveal the conversion of inorganic carbon into organic carbon by living organisms, representing an autochthonous source of organic matter [49]; (3) presents an edaphology type Feozem or Phaeozem, thus, it is found normally under a process of accumulation of humus [50]; and (4) has two types of geology; the first is Basalt (Igneous rock), which is the most abundant extrusive rock formed from molten magma, i.e., fine grained and dark coloured rocks, containing 50% feldspar and 50% ferromagnesian minerals (pyroxens and olivine), and the second is sandstone (Sedimentary) which are sedimentary rocks formed from sediments showing different stages of formation: weathering, transportation, deposition or sedimentation, and diagenesis [51].
3.3. Sampling
Two samples were collected on 16 November 2018 (FABC1) and (FABC2) and 1 kg of sediment was collected in each sampling. The sediment core was taken at depths of 10–20 cm using an auger. The samples were immediately stored and transferred to the laboratory in amber glass containers with airtight lids at 25 °C. Subsequently, the samples were dried at room temperature inside the extraction hood for 72 h.
3.4. Fulvic Acids Extraction
Both FABC1 and FABC2 samples were treated in the same way. Initially they were dried at room temperature. For each sample the HS were extracted following the procedure established by IHSS [52], with slight modification. In brief, the sediment sample was crushed in a mortar. Subsequently, to obtain homogeneous particle size, the sample was processed in an electric grinder. Then, the sample was passed through a sieve and stored in an amber container with a tight lid at room temperature. After 24 h, 150 g of sample was placed in an Erlenmeyer flask and deionized water was added to provide a ratio of 1 mL of liquid/0.5 g of dry sample. Later, keeping a constant stirring, the pH was adjusted to 2 by the addition of 1 M HCl.
The solution was then equilibrated with 0.1 M HCl, until a ratio of 10 mL/1 g of dry sample was obtained. After 1 h of stirring, the solution was allowed to stand and after 14 h, supernatant was removed and labelled as “FA1 extract”; later it was stored at 4 °C. This was done with the purpose of extracting FAs, since they are soluble in acidic and basic medium, while HAs are only soluble in basic medium. On the other hand, HUs are not soluble in basic medium or in acid medium. After the extraction of FA1, the sediment that remained in the Erlenmeyer flask was neutralized by the addition of 1M NaOH. Subsequently, 0.1 M NaOH was added under a nitrogen (N2) atmosphere to avoid oxidation of HS during extraction [53], resulting in a final ratio of extractant to sediment of 10:1, obtaining a suspension. This suspension was stirred for 4 h and then allowed to settle. After 16 h, the supernatant was collected and acidified with 6 M HCl to a pH of 1, to decant the HAs. The suspension was allowed to settle until two well-defined phases were observed (after 16 h). The supernatant was collected and labelled as “FA2 extract”. Finally, the FA1 and FA2 extracts were centrifuged at 1000 rpm and passed through filter paper. Thus, both extracts were accumulated and this mix was labelled as FA3.
3.4.1. Fulvic Acids Purification
FA3 was passed through a XAD-8 resin, previously conditioned with 0.1 M NaOH and deionized water, and packed in a column, according to the proposed methodology for Thurman and Malcolm 1981 [52]. These conditions allowed the retention of FAs through hydrophobic interactions. Later, the resin was washed with 16 mL of deionized water to remove some remaining salts. Finally, retained FAs were eluted with 24 mL of 1 M NaOH and 72 mL of deionized water, and immediately acidified to a pH of 1 with 6 M HCl. After acidification, HF was added to obtain a final concentration of 0.3 M HF. The HCl-HF treatment successfully reduced the ash contents of the HS without modifying their chemical composition and structure significantly [35]. Also, the HF treatment has been proposed for removing paramagnetic Fe salts from HS; these paramagnetic Fe salts are the main source of interference in NMR [31]. The solution HCl-HF that contained the FAs was extracted again as FA3. The eluate solution was then passed through 24 mL of the H+ saturated cation exchange resin and subsequently 24 mL of 0.3 M NaOH was added for the extraction of FAs in their protonated form, since the resin has sulfonic acid as an active group in styrene-divinylbenzene, which easily donates its protons. The eluate was lyophilized in a BenchTop Pro-Sp Scientific kit for 24 h at −80 °C and 50mTorr. To give a plus to the extraction and purification method established by the IHSS, the solute was dissolved in a volume of 47 mL of deionized H2O and 3 mL of 0.1 M NaOH to adjust the pH from acidic to neutral in the solution. This was done in order to specifically analyze the aromatic rings of the FAs that contain hydroxyl groups in their structure, since according to potentiometry studies at a pH of 6.4, the FAs present a formation of 50% of these species [53]. Subsequently, the sample was lyophilized again.
3.5. Instrumental Techniques
3.5.1. Nuclear Magnetic Resonance (NMR)
1D and 2D NMR spectra were recorded on a Bruker Avance III-500 MHz spectrometer, Billerica, MA, USA) of a sample containing 3 mg of FABC1 dissolved in 600 µL of DMSO-d6, using a J. Young valve NMR tube within an Argon atmosphere, to avoid degradation of the sample. As a reference for 1H and 13C assignments, DMSO signals were used (2.5 and 39.5 ppm, respectively). For structural analysis, the experiments 1H, 13C, COSY, and 1H-13C HSQC were acquired according to the methodology established by Simpson et al., 2001 [20]. DOSY pulse sequence was LED with bipolar gradient pulse pair, two spoil gradients were acquired, according to the methodology established by Simpson et al., 2007 [21]. In order to improve the spectral resolution in all experiments, the number of scans was increased compared to those previously reported in the literature [20,21]. Additional details for all experiments are shown in Table 6.
Table 6.
Optimized parameters in each of the NMR experiments.
With the intention of preserving the sample, after each NRM experiment the FABC1 sample was refrigerated at a temperature between −10 to −30 °C in an Ar atmosphere. Subsequently, it was placed at room temperature for 24 h before carrying out each of the NMR experiments.
3.5.2. High-Performance Liquid Chromatography-Electrospray Ionization-Mass Spectrometry (HPLC-ESI-MS)
FABC2 sample was used for chromatographic analysis. A liquid chromatography (Agilent Technologies 1260) coupled to mass spectrometry (Agilent 6120 Infinity Technologies was used. The HPLC-ESI-MS analyses were based on Stenson 2008 [54] and Frauendorf and Herzschuh 1998 [55]. Briefly, chromatographic separation was performed on a C18 waters column (250 mm × 4.6 mm, 5 µm) using an isocratic elution with a mobile phase composed of H2O: ACN (50:50) at a flow rate of 0.3 mL·min−1 with a sample injection of 5 µL. In order to increase the ionization efficiency, 0.1% ammonium formate was added prior to negative mode electrospray (pH = 8). For positive ion mode, 0.1% formic acid was used (pH < 6). Chromatograms were acquired at 220, 253, and 280 nm. Then a mass spectrometric analysis was carried out, for each wavelength, with a quadrupole at SCAN mode acquisition (100−2000 m/z). Both positive (FABC2-1) and negative (FABC2-2) electro spray ionization were applied to 1 mg of dissolved extract at water. Quasi-molecular ions M+H for ESI+ and M−H for ESI− were monitored to obtain fragment spectra. The nebulization gas flow rate was set at 12 mL·min−1, the ion spray was set at 3000 V, and the temperature was kept at 350 °C.
4. Conclusions
This work is the first characterization of Fulvic Acids in Mexico through NMR and HPLC-ESI-MS from the PEUBC, a priority area for the conservation of ecosystems and biodiversity. The improvements in the methodology (extraction, purification, and characterization) method proposed by the IHSS for the analysis of these HS was modified reducing signal overlapping and improving signal-to-noise ratio. The improved spectral resolution obtained in the DOSY spectrum obtained in 500 MHz cryoprobe equipment was probably due to the selective and modified extraction and purification processes.
The results obtained in the different NMR experiments allowed us to acquire structural information of the fulvic acids present in the studied area. The humification process in the sediment studied suggests the highest contribution of the alkyl-C fraction.
Supplementary Materials
The following are available online, Figure S1: 1D 13C-NMR spectrum. The DMSO-d6 signal appears at 39.5 ppm, Figure S2: Sample FABC2-1, λ = 220 nm, Figure S3: Sample FABC2-2, λ = 220 nm, Figure S4: Sample FABC2-1, λ = 253 nm, Figure S5: Sample FABC2-2, λ = 253 nm, Figure S6: Sample FABC2-1, λ = 280 nm, Figure S7: Sample FABC2-2, λ = 280 nm, Figure S8: Sample FABC2-1, tR = 5.025 min., Figure S9: Sample FABC2-1, tR = 6.073 min., Figure S10: Sample FABC2-1, tR = 9.208 min., Figure S11: Sample FABC2-1, tR = 13.492 min., Figure S12: Sample FABC2-1, tR = 14.965 min., Figure S13: Sample FABC2-1, tR = 53.136 min., Figure S14: Sample FABC2-2, tR = 5.794 min., Figure S15: Sample FABC2-2, tR = 6.127 min., Figure S16: Sample FABC2-2, tR = 9.148 min., Figure S17: Sample FABC2-2, tR = 10.095 min., Figure S18: Sample FABC2-2, tR = 15.995 min., Figure S19: Sample FABC2-2, tR = 29.053 min., Table S1: Specific ranges for signals in 1H corresponding to the functional groups that constitute fulvic acids, integration percentages obtained from the sections “A” to “F” in said spectrum and possible structures, Table S2: Specific ranges for signals in 13C corresponding to the functional groups that constitute fulvic acids, Table S3: Retention times (tR) corresponding to the wavelengths of 220, 253 and 280 nm for ESI+ mode, Table S4: Retention times (tR) corresponding to the wavelengths of 220, 253 and 280 nm for ESI- mode, Table S5: Peaks from A to E obtained from the mass spectra in SCAN mode (Figures S8–S19) using ESI+ mode. The m/z ratios of A to E, their respective retention times (tR) and the percentage of relative abundance of each peak are shown, Table S6: Peaks from A to L obtained from the mass spectra in SCAN mode (Figures S20–S25) using ESI- mode. The m/z ratios of A to L, their respective retention times (tR) and the percentage of relative abundance of each peak are shown.
Author Contributions
V.G.L.-M. and H.S.-N.; methodology, V.G.L.-M. and J.G.R.-L.; validation, V.G.L.-M., J.E.S.-P., M.A.M.-T.; formal analysis, V.G.L.-M. and J.A.G.-Á.; investigation, V.G.L.-M. and H.S.-N.; writing—original draft preparation, V.G.L.-M., H.S.-N., I.L.-R.; visualization, H.S.-N. All authors have read and agreed to the published version of the manuscript.
Funding
This research received no external funding.
Institutional Review Board Statement
Not applicable.
Informed Consent Statement
Not applicable.
Data Availability Statement
The data presented in this study are available on request from the corresponding author.
Acknowledgments
The authors wish to express their gratitude to: Blanca Eda Dominguez Mendoza, Cristina Margarita Rodríguez Narvaez, and Raúl Villamil Ramos for the acquisition of the NMR spectra. Also, thanks to Iris Janet Montoya Balbas for acquiring the chromatograms and mass spectra corresponding to HPLC-ESI-MS and to the Laboratorio Nacional de Estructuras de Macromoléculas (LANEM) of Centro de Investigaciones Químicas (CIQ) Universidad Autónoma del Estado de Morelos (UAEM) for the infrastructure. In addition, we thank to Glga. Jaceli Rivera Barrera, Biol. Cyndi Laura Román Colin and Valentino Sorani Dalbón for preparing the PEUBC maps. The authors thank the National Council for Science and Technology (CONACYT) for the grant awarded to Verónica Gisela López-Martinez.
Conflicts of Interest
The authors declare no conflict of interest.
Sample Availability
The results obtained in the study are available from the authors.
References
- Orsi, M. Molecular dynamics simulation of humic substances. Chem. Biol. Technol. Agric. 2014, 1, 10. [Google Scholar] [CrossRef]
- Thorn, K.A.; Cox, L.G. N-15 NMR spectra of naturally abundant nitrogen in soil and aquatic natural organic matter samples of the International Humic Substances Society. Org. Geochem. 2009, 40, 484–499. [Google Scholar] [CrossRef]
- D’Andrilli, J.; Foreman, C.M.; Marshall, A.G.; Mcknight, D. Characterization of IHSS Pony Lake fulvic acid dissolved organic matter by electrospray ionization Fourier transform ion cyclotron resonance mass spectrometry and fluorescence spectroscopy. Org. Geochem. 2013, 65, 19–28. [Google Scholar] [CrossRef]
- Cook, R.L.; McIntyre, D.D.; Langford, C.H.; Vogel, H.J. A Comprehensive Liquid-State Heteronuclear and Multidimensional NMR Study of Laurentian Fulvic Acid. Environ. Sci. Technol. 2003, 37, 3935–3944. [Google Scholar] [CrossRef]
- Mylotte, R.; Verheyen, V.; Reynolds, A.; Dalton, C.; Patti, A.; Chang, R.R.; Burdon, J.; Hayes, M.H.B. Isolation and characterisation of recalcitrant organic components from an estuarine sediment core. J. Soils Sediments 2015, 15, 211–224. [Google Scholar] [CrossRef]
- Simpson, A.J.; Lefebvre, B.; Moser, A.; Williams, A.; Larin, N.; Kvasha, M.; Kingery, W.L.; Kelleher, B. Identifying residues in natural organic matter through spectral prediction and pattern matching of 2D NMR datasets. Magn. Reson. Chem. 2003, 42, 14–22. [Google Scholar] [CrossRef] [PubMed]
- Leenheer, J.A.; Rostad, C.E. Tannins and Terpenoids as Major Precursors of Suwannee River Fulvic Acid; U.S. Department of the Interior—U.S. Geological Survey: Reston, VA, USA, 2004. [Google Scholar]
- Leenheer, J.A.; Rostad, C.E.; Gates, P.M.; Furlong, E.T.; Ferrer, I. Molecular Resolution and Fragmentation of Fulvic Acid by Electrospray Ionization/Multistage Tandem Mass Spectrometry. Anal. Chem. 2001, 73, 1461–1471. [Google Scholar] [CrossRef] [PubMed]
- Livens, F.R. Chemical reactions of metals with humic material. Environ. Pollut. 1991, 70, 183–208. [Google Scholar] [CrossRef]
- Leenheer, J.A.; Brown, G.K.; MacCarthy, A.P.; Cabaniss, S. Models of Metal Binding Structures in Fulvic Acid from the Suwannee River, Georgia. Environ. Sci. Technol. 1998, 32, 2410–2416. [Google Scholar] [CrossRef]
- Chiou, C.T.; Malcolm, R.L.; Brinton, T.I.; Kile, D.E. Water solubility enhancement of some organic pollutants and pesticides by dissolved humic and fulvic acids. Environ. Sci. Technol. 1986, 20, 502–508. [Google Scholar] [CrossRef] [PubMed]
- Senesi, N. Binding mechanisms of pesticides to soil humic substances. Sci. Total Environ. 1992, 123–124, 63–76. [Google Scholar] [CrossRef]
- Tramonti, V.; Zienius, R.H.; Gamble, D.S. Solution Phase Interaction of Lindane with Fulvic Acid: Effect of Solution pH and Ionic Strength. Int. J. Environ. Anal. Chem. 1986, 24, 203–212. [Google Scholar] [CrossRef]
- Saparpakorn, P.; Kim, J.H.; Hannongbua, S. Investigation on the Binding of Polycyclic AromaticHydrocarbons with Soil Organic Matter: A Theoretical Approach. Molecules 2007, 12, 703–715. [Google Scholar] [CrossRef]
- Bridgham, S.D.; Megonigal, J.P.; Keller, J.K.; Bliss, N.B.; Trettin, C. The carbon balance of North American wetlands. Wetlands 2006, 26, 889. [Google Scholar] [CrossRef]
- International Humic Substances Society. Available online: http://humic-substances.org (accessed on 21 May 2020).
- Janoš, P. Separation methods in the chemistry of humic substances. J. Chromatogr. A 2003, 983, 1–18. [Google Scholar] [CrossRef]
- Bell, N.G.A.; Graham, M.C.; Uhrín, D. Isotope-filtered nD NMR spectroscopy of complex mixtures to unravel the molecular structures of phenolic compounds in tagged soil organic matter. Analyst 2016, 141, 4614–4624. [Google Scholar] [CrossRef]
- Xu, J.; Zhao, B.; Chu, W.; Mao, J.; Zhang, J. Chemical nature of humic substances in two typical Chinese soils (upland vs paddy soil): A comparative advanced solid state NMR study. Sci. Total Environ. 2017, 576, 444–452. [Google Scholar] [CrossRef]
- Simpson, A.J.; Burdon, J.; Graham, C.L.; Hayes, M.H.B.; Spencer, N.; Kingery, W.L. Interpretation of heteronuclear and multidimensional NMR spectroscopy of humic substances. Eur. J. Soil Sci. 2001, 52, 495–509. [Google Scholar] [CrossRef]
- Simpson, A.J.; Kingery, W.L.; Spraul, M.; Humpfer, E.; Dvortsak, P.; Kerssebaum, R. Separation of Structural Components in Soil Organic Matter by Diffusion Ordered Spectroscopy. Environ. Sci. Technol. 2001, 35, 4421–4425. [Google Scholar] [CrossRef] [PubMed]
- Leenheer, J.A. Progression from model structures to molecular structures of natural organic matter components. Ann. Environ. Sci. 2007, 1, 57. [Google Scholar]
- Thorn, K.A.; Folan, D.W.; MacCarthy, P. Characterization of the International Humic Substances Society Standard and Reference Fulvic and Humic Acids by Solution State Carbon-13 (13C) and Hydrogen-1 (1H) Nuclear Magnetic Resonance Spectrometry; Water-Resources Investigations Report 89-4196; U.S. Geological Survey: Reston, VA, USA, 1989. [Google Scholar]
- Simpson, A.J.; Song, G.; Smith, E.; Lam, B.; Novotny, E.H.; Hayes, M.H.B. Unraveling the Structural Components of Soil Humin by Use of Solution-State Nuclear Magnetic Resonance Spectroscopy. Environ. Sci. Technol. 2007, 41, 876–883. [Google Scholar] [CrossRef]
- Tao, Z.-Y.; Zhang, J.; Zhai, J.-J. Characterization and differentiation of humic acids and fulvic acids in soils from various regions of China by nuclear magnetic resonance spectroscopy. Anal. Chim. Acta 1999, 395, 199–203. [Google Scholar] [CrossRef]
- Han, R.; Lv, J.; Luo, L.; Wen, B.; Zhang, S. Molecular-scale investigation of soil fulvic acid and water-extractable organic matter by high-resolution mass spectrometry and 1H NMR spectroscopy. Environ. Chem. 2019, 16, 92. [Google Scholar] [CrossRef]
- Ohno, T.; Sleighter, R.L.; Hatcher, P.G. Comparative study of organic matter chemical characterization using negative and positive mode electrospray ionization ultrahigh-resolution mass spectrometry. Anal. Bioanal. Chem. 2016, 408, 2497–2504. [Google Scholar] [CrossRef]
- Perdue, E.M.; Hertkorn, N.; Kettrup, A. Substitution Patterns in Aromatic Rings by Increment Analysis. Model Development and Application to Natural Organic Matter. Anal. Chem. 2007, 79, 1010–1021. [Google Scholar] [CrossRef]
- Fuentes, M.; Baigorri, R.; González-Gaitano, G.; García-Mina, J.M. The complementary use of 1H NMR, 13C NMR, FTIR and size exclusion chromatography to investigate the principal structural changes associated with composting of organic materials with diverse origin. Org. Geochem. 2007, 38, 2012–2023. [Google Scholar] [CrossRef]
- Lambert, J.B.; Shurvell, H.F.; Lightner, D.A.; Cooks, R.G. Organic Structural Spectroscopy; Prentice Hall: New Jersey, NJ, USA, 1998. [Google Scholar]
- Machado, A.A.; Da Silva, J.C.E.; Da Silva, J.E. Factor analysis of molecular fluorescence data of marine and soil fulvic acids. Chemom. Intell. Lab. Syst. 1993, 19, 155–167. [Google Scholar] [CrossRef]
- Sano, Y.; Yamamoto, S. Mutual Diffusion Coefficient of Aqueous Sugar Solutions. J. Chem. Eng. Jpn. 1993, 26, 633–636. [Google Scholar] [CrossRef]
- Chen, J.S.; Chiu, C.Y. Characterization of soil organic matter in different particle-size fractions in humid subalpine soils by CP/MAS C NMR. Geoderma 2003, 117, 129–141. [Google Scholar] [CrossRef]
- Jien, S.H.; Chen, T.H.; Chiu, C.Y. Effects of afforestation on soil organic matter characteristics under subtropical forests with low elevation. J. For. Res. 2011, 16, 275–283. [Google Scholar] [CrossRef]
- Keeler, C.; Kelly, E.F.; Maciel, G.E. Chemical-structural information from solid-state C-13 NMR studies of a suite of humic materials from a lower montane forest soil, Colorado, USA. Geoderma 2006, 130, 124–140. [Google Scholar] [CrossRef]
- Ussiri, D.A.N.; Johnson, C.E. Characterization of organic matter in a northern hardwood forest soil by 13 C NMR spectroscopy and chemical methods. Geoderma 2003, 111, 123–149. [Google Scholar] [CrossRef]
- López, R.; Gondar, D.; Iglesias, A.; Fiol, S.; Antelo, J.; Arce, F. Acid properties of fulvic and humic acids isolated from two acid forest soils under different vegetation cover and soil depth. Eur. J. Soil Sci. 2008, 59, 892–899. [Google Scholar] [CrossRef]
- Chen, C.R.; Hu, Z.H.; Mathers, N.J. Soil carbon pools in adjacent natural and plantation forests of subtropical Australia. Soil Sci. Soc. Am. J. 2004, 68, 282–291. [Google Scholar] [CrossRef]
- Mueller, C.W. Koegel-Knabner I Soil organic carbon stocks, distribution, and composition affected by historic land use changes on adjacent sites. Biol. Fertil. Soils 2009, 45, 347–359. [Google Scholar] [CrossRef]
- Fuentes, M.; González-Gaitano, G.; García-Mina, J.M.A. The usefulness of UV–visible and fluorescence spectroscopies to study the chemical nature of humic substances from soils and composts. Org. Geochem. 2006, 37, 1949–1959. [Google Scholar] [CrossRef]
- Jin, B.S.; Kang, H.C.; Kim, D.; Lee, K.H.; Bae, Y.H. Synthesis of poly(cystine bisamide)-PEG block copolymers grafted with 1-(3-aminopropyl)imidazole and their phase transition behaviors. Polym. Adv. Technol. 2008, 19, 1558–1565. [Google Scholar] [CrossRef]
- Schuster, I.I.; Roberts, J.D. Nitrogen-15 nuclear magnetic resonance spectroscopy. Effects of hydrogen bonding and protonation on nitrogen chemical shifts in imidazoles. J. Org. Chem. 1979, 44, 3864–3867. [Google Scholar] [CrossRef]
- Hertzog, J.; Carré, V.; Le Brech, Y.; Mackay, C.L.; Dufour, A.; Mašek, O.; Aubriet, F. Combination of electrospray ionization, atmospheric pressure photoionization and laser desorption ionization Fourier transform ion cyclotronic resonance mass spectrometry for the investigation of complex mixtures—Application to the petroleomic analysis of bio-oils. Anal. Chim. Acta 2017, 969, 26–34. [Google Scholar] [CrossRef]
- Witt, M.; Fuchser, J.; Koch, B. Fragmentation Studies of Fulvic Acids Using Collision Induced Dissociation Fourier Transform Ion Cyclotron Resonance Mass Spectrometry. Anal. Chem. 2009, 81, 2688–2694. [Google Scholar] [CrossRef]
- Zhang, Z. Sequence Analysis of Native Oligosaccharides Using Negative ESI Tandem MS. Curr. Anal. Chem. 2009, 5, 225–237. [Google Scholar] [CrossRef] [PubMed][Green Version]
- Santoro, A.L.; Bastviken, D.; Gudasz, C.; Tranvik, L.J.; Enrich-Prast, A. Dark Carbon Fixation: An Important Process in Lake Sediments. PLoS ONE 2013, 8, e65813. [Google Scholar] [CrossRef] [PubMed]
- Sorin, M.; Matei, G.-M.; Monica, D.; Mocanu, V. Differences in organic matter quality, chemical and microbiological characteristics of two Phaeozems under natural and anthropic influence. EuroBiotech J. 2019, 3, 182–189. [Google Scholar] [CrossRef]
- Secretaría de Desarrollo Sustentable. Available online: https://sustentable.morelos.gob.mx/anp/peubch (accessed on 17 November 2020).
- Hartemink, A.E.; Bockheim, J. Soil genesis and classification. Catena 2013, 104, 251–256. [Google Scholar] [CrossRef]
- Swift, R.S. Organic Matter Characterization. In Methods of Soil Analysis Part 3-Chemical Methods 5.3; Wiley and Sons: Hoboken, NJ, USA, 2018; pp. 1011–1069. [Google Scholar]
- Wolfe, A.P.; Kaushal, S.S.; Fulton, J.R.; Mcknight, D. Spectrofluorescence of Sediment Humic Substances and Historical Changes of Lacustrine Organic Matter Provenance in Response to Atmospheric Nutrient Enrichment. Environ. Sci. Technol. 2002, 36, 3217–3223. [Google Scholar] [CrossRef]
- Thurman, E.M.; Malcolm, R.L. Preparative isolation of aquatic humic substances. Environ. Sci. Technol. 1981, 15, 463–466. [Google Scholar] [CrossRef]
- Sánchez-Monedero, M.Á.; Roig, A.; Cegarra, J.; Bernal, M.P.; Paredes, C. Effects of HCl-HF purification treatment on chemical composition and structure of humic acids. Eur. J. Soil Sci. 2002, 53, 375–381. [Google Scholar] [CrossRef]
- Stenson, A.C. Reversed-Phase Chromatography Fractionation Tailored to Mass Spectral Characterization of Humic Substances. Environ. Sci. Technol. 2008, 42, 2060–2065. [Google Scholar] [CrossRef]
- Frauendorf, H.; Herzschuh, R. Application of high-performance liquid chromatography/electrospray mass/spectrometry for identification of carboxylic acids containing several carboxyl groups from aqueous solutions. Eur. J. Mass Spectrom. 1998, 4, 269. [Google Scholar] [CrossRef]


Publisher’s Note: MDPI stays neutral with regard to jurisdictional claims in published maps and institutional affiliations. |
© 2021 by the authors. Licensee MDPI, Basel, Switzerland. This article is an open access article distributed under the terms and conditions of the Creative Commons Attribution (CC BY) license (https://creativecommons.org/licenses/by/4.0/).