Article

Secondary Effects of Hypochlorite Treatment on the Emerging Pollutant Candesartan: The Formation of Degradation Byproducts and Their Toxicological Profiles

1
Department of Chemical Sciences, University of Naples Federico II, 80126 Naples, Italy
2
Department of Biology, University of Naples Federico II, 80126 Naples, Italy
3
Associazione Italiana per la Promozione delle Ricerche su Ambiente e Salute umana, 82030 Dugenta, Italy
*
Author to whom correspondence should be addressed.
Molecules 2021, 26(11), 3422; https://doi.org/10.3390/molecules26113422
Submission received: 21 April 2021 / Revised: 25 May 2021 / Accepted: 29 May 2021 / Published: 5 June 2021
(This article belongs to the Special Issue Applications of Advanced Oxidation Processes for Water Treatment)

Abstract

:
In recent years, many studies have reported the frequent detection of antihypertensive agents such as sartans (olmesartan, valsartan, irbesartan and candesartan) in the influents and effluents of wastewater treatment plants (WWTPs) and in the superficial waters of rivers and lakes in both Europe and North America. In this paper, the degradation pathway for candesartan (CAN) was investigated by simulating the chlorination process that is normally used to reduce microbial contamination in a WWTP. Twelve isolated degradation byproducts (DPs), four of which were isolated for the first time, were separated on a C-18 column by employing a gradient HPLC method, and their structures were identified by combining nuclear magnetic resonance and mass spectrometry and comparing the results with commercial standards. On the basis of these results, a mechanism of formation starting from the parent drug is proposed. The ecotoxicity of CAN and its DPs was studied by conducting a battery of ecotoxicity tests; bioassays were performed using Aliivibrio fischeri (bacterium), Daphnia magna (planktonic crustacean) and Raphidocelis subcapitata (alga). The ecotoxicity results shed new light on the increased toxicity of DPs compared with the parent compound.

Graphical Abstract

1. Introduction

Emerging contaminants (ECs) have long been an object of attention for the scientific community and, more recently, by planning and control organizations at both global and national levels, and new substances or classes of substances are being increasingly identified and added to the lists of ECs [1,2,3,4,5,6]. ECs are chemical compounds that are found in very low concentrations (in the order of nanograms/L or a few micrograms/L at most or, more simply, as much as a sugar cube in a pond) in urban, agricultural and industrial waste and water bodies. Only a few years ago, it was possible to detect and measure them, and the development of increasingly complex and refined analytical tools has made it possible to quantify them, even at very low concentrations. Some examples of these compounds are the residues of pharmaceutical products for human and animal consumption, including drugs [7], pesticides [8], disinfectants [8], hormones and body care products [9]. These contaminants, even in very low quantities, can cause alterations to the endocrine system [3,10] and an increase in microbial resistance to drugs [11,12,13,14]. They can also be adsorbed by plants [15] and bioaccumulate [16] in the food chain. Additional risks are associated with biodiversity loss [10], infertility and cancer [17,18]. However, these ECs are not yet subject to regulatory control, and data relating to their environmental persistence and their chemical transformations in biotic and abiotic conditions are scarce, and even less information is known about their relative toxicology. Traditional wastewater treatment plants (WWTPs) have a limited capacity to remove many of these ECs because they have been designed and operate effectively to remove other types of pollutants (e.g., BOD, ammonia, phosphorus and pathogens) present in concentrations of up to a million times greater. It is not clear whether and which degradation byproducts (DPs) are obtained from the methods traditionally adopted in WWTPs before the waters return to the environment. For ECs whose effects and fate in the environment are still being studied, monitoring and research plans have been in place for several years, involving many institutions and research centers around the world. If these chemical compounds are regulated in the future, managers of integrated water services will have to adapt purification plants to effectively remove ECs and minimize or eliminate DPs.
One class of ECs is sartans (olmesartan, valsartan, irbesartan and candesartan), which are antihypertensive agents that act on the renin–angiotensin system with a different mechanism than ACE inhibitors; the latter reduces the plasma and tissue levels of angiotensin II, while sartans antagonize its action on AT1 receptors [19]. The attention of the scientific community has focused on this category of drugs, which have been detected in the aquatic environment [20]. In particular, candesartan (CAN) was found in Bavarian WWTP effluents at concentrations as high as 1712 ng/L [21]. Moreover, it is ubiquitous in England, where it was discovered at a concentration of 140 ng/L, and has been detected in surface waters at concentrations of up to 46 ng/L in Switzerland and up to 6.3 μg/L in Spain [22].
In this study, the DPs of CAN were investigated under the same conditions as those of the chlorination process normally used to reduce microbial contamination in WWTPs [23,24,25,26]. Two different experiments were performed: one at concentrations comparable to those at which CAN is present in wastewaters, and one at concentrations at least 100 times higher in order to isolate and identify the DPs. The structures of 12 isolated DPs, four of which were isolated for the first time, were determined by combining nuclear magnetic resonance (NMR) and mass spectrometry (MALDI-MS/TOF) data, and a mechanism of formation is proposed to explain the results.
The ecotoxicity of CAN before and after exposure to the chlorination process was evaluated. For this purpose, three living organisms, the bacteria Aliivibrio fischeri, the alga Raphidocelis subcapitata and the small planktonic crustacean Daphnia magna, were used as bioindicators of toxicity. These organisms were chosen because they are highly recommended as representative species for ecological risk assessments of new and existing chemicals [27]. The investigation on the toxicities of CAN and its byproducts is important for future discussions regarding the treatment, control and fate of sartans and their derivatives in the environment.

2. Results and Discussion

2.1. Chlorination Experiments

The CAN chlorination experiments were performed by mimicking the conditions of a typical WWTP. A 10−5 M solution of the drug was treated for 1 h with 10% hypochlorite (CAN:hypochlorite molar ratio of 1:1; concn.) at room temperature [28,29,30,31]. Then, the tests were repeated with the contaminant at concentrations >10−3 M, with a much lower ratio of the CAN:oxidizing agent (1:5 or 1:6) so as to ensure the degradation of the studied contaminant and to isolate sufficient quantities of DPs for their subsequent structural identification. The DPs obtained (Figure 1) were isolated by column chromatography and HPLC and completely characterized using NMR and MS analyses (see Supplementary Materials).
DP1DP12 were isolated in relative percentages of 2.4, 0.84, 0.64, 0.62, 1.62, 1.06, 1.55, 0.80, 0.42, 1.34, 0.62 and 0.86, respectively. The proposed mechanism of their formation from CAN is shown in Figure 2. DP1, DP2, DP4 and DP5 were isolated for the first time. The quantity of CAN recovered after chromatography of the initial extract of the chlorinated solution and its identification by comparison with an authentic commercial sample allowed us to evaluate a percentage of mineralization that is around 35% under the specified conditions, which is doubled with a CAN:hypochlorite molar ratio of 1:2 applied for longer times (3 h), while the formation of DPs is around 13%. The data reported in the literature for other ECs generally foresee longer reaction times, even in the order of hours, and oxidant concentrations are often double that of the pollutant to ensure the complete mineralization of the latter, frequently after a double or triple treatment [30,31,32,33].

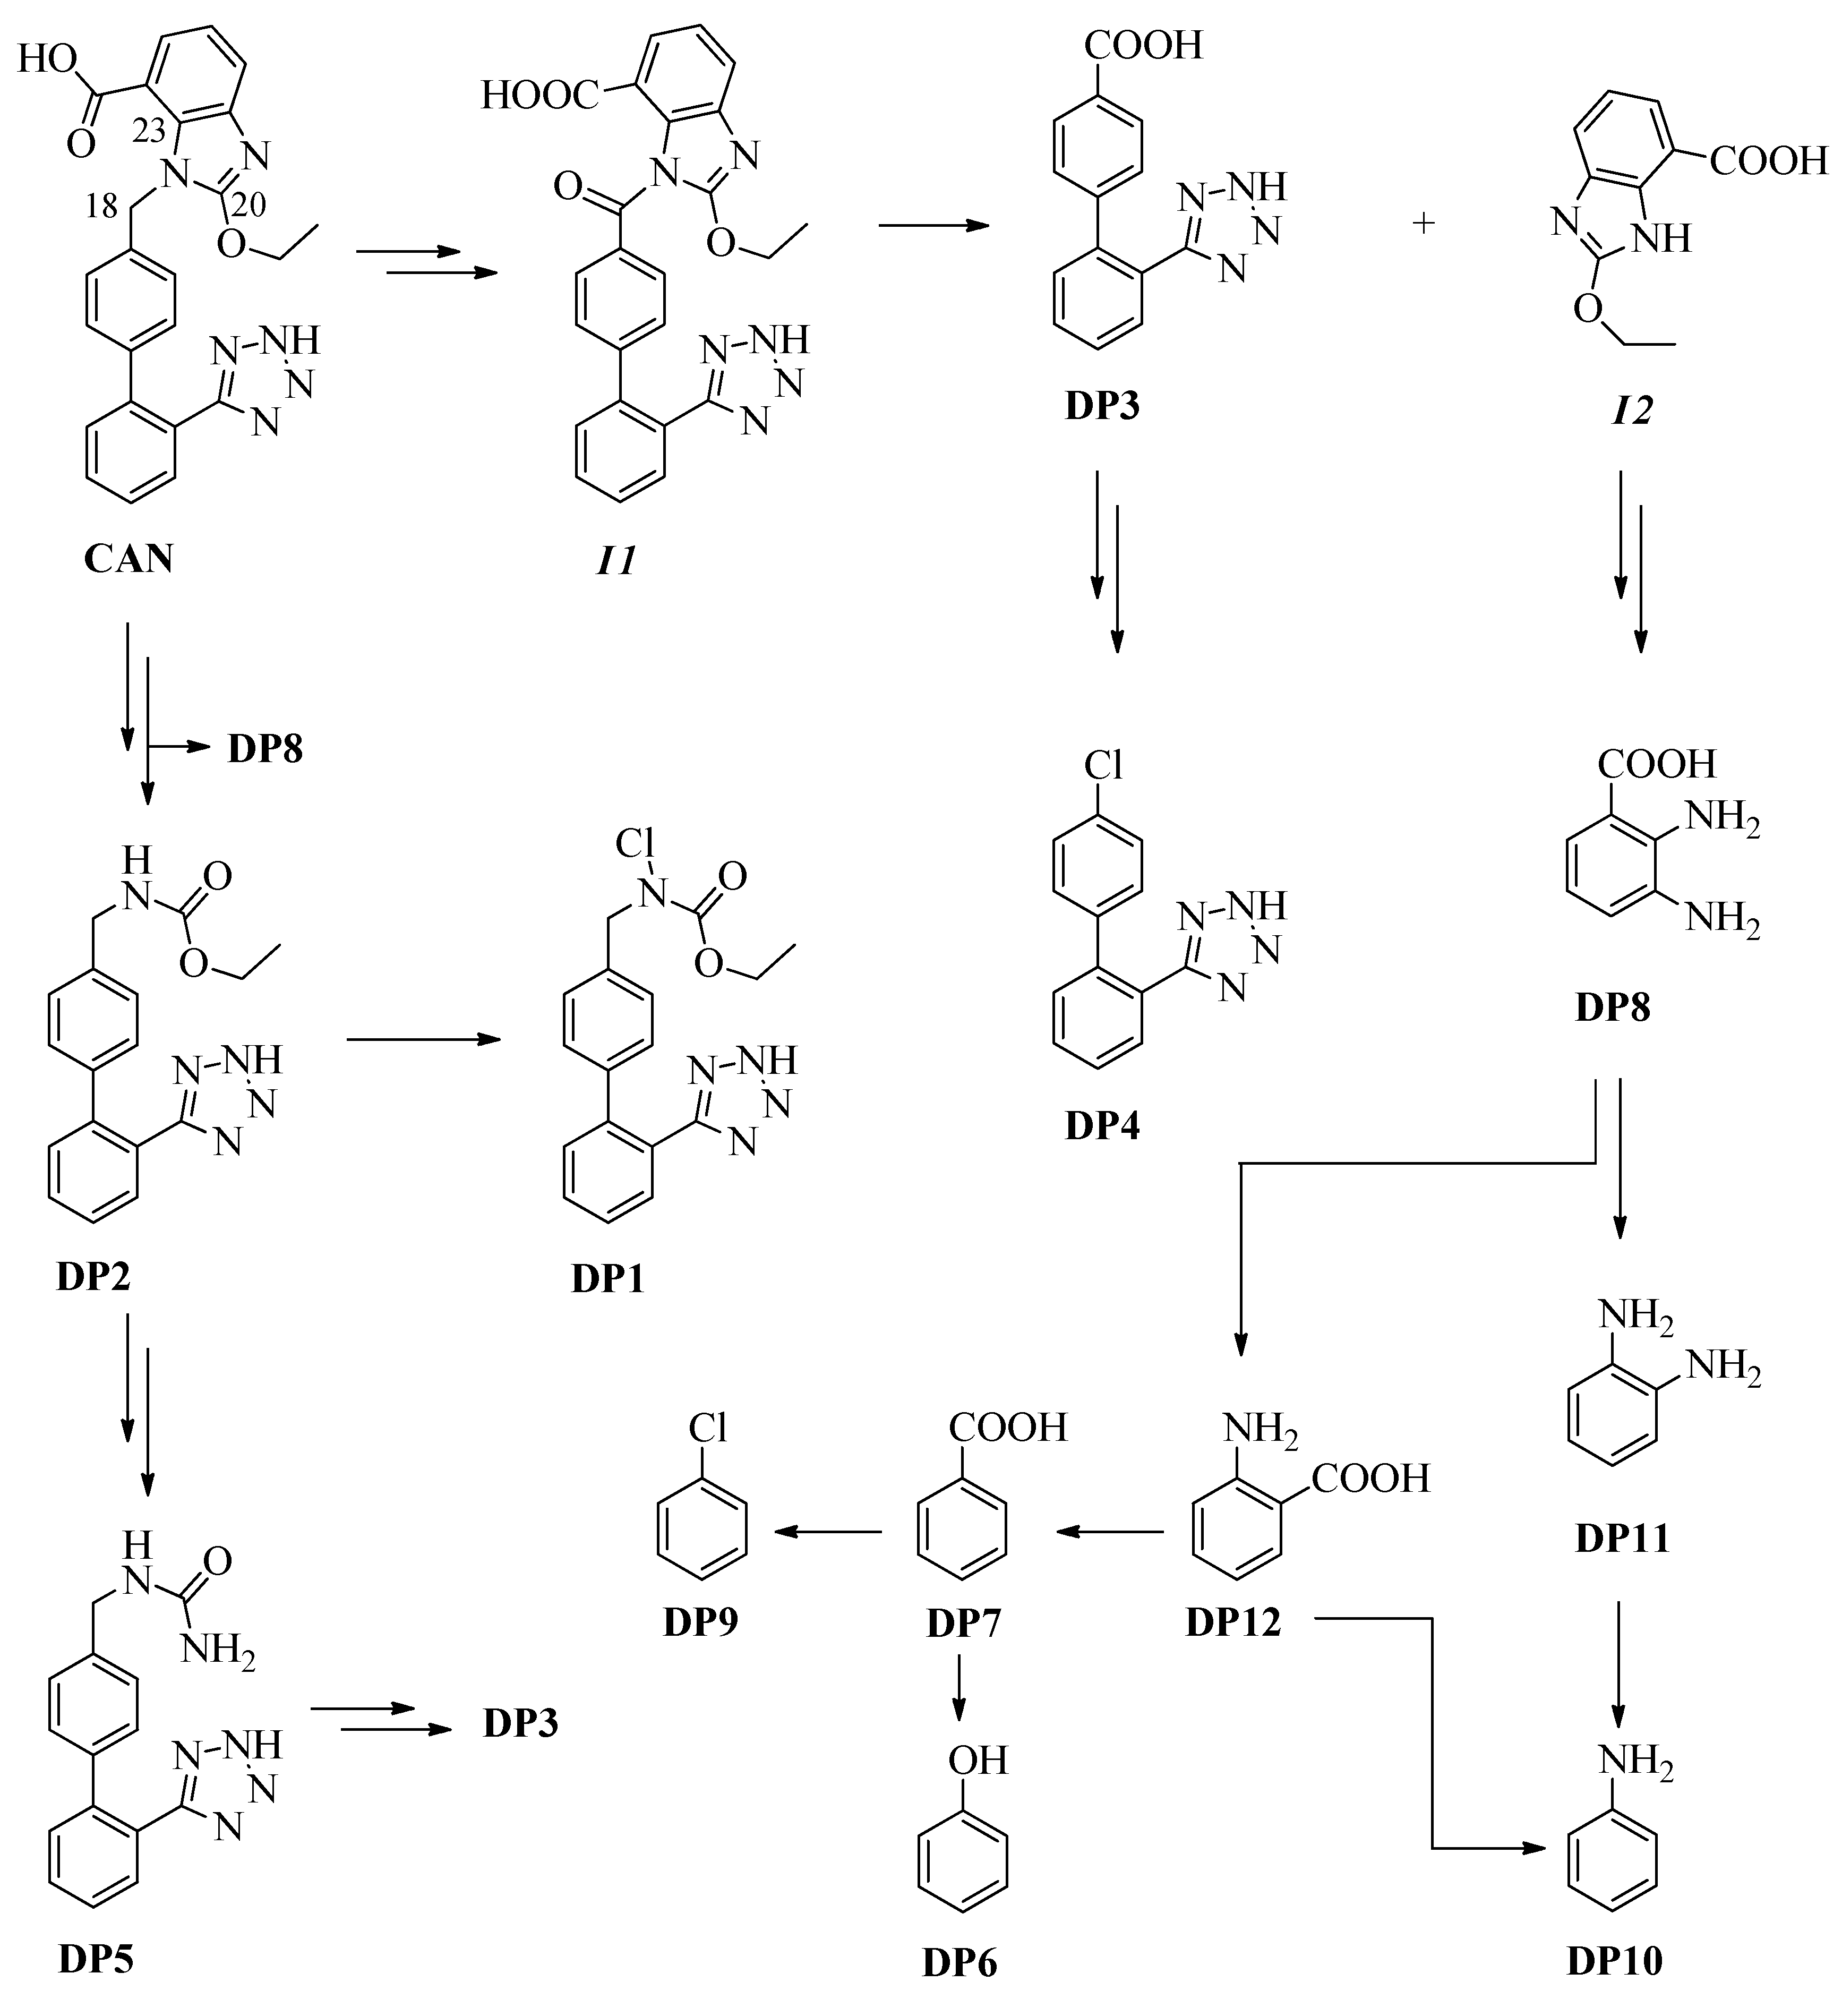
2.2. Structure Elucidation of Degradation Byproducts DP1DP12

In CAN treatment at buffered pH, the changes of the drug were monitored by HPLC. The concentration of DP1DP12 (Figure 1) was at a maximum after 2 h and ranged in the range of 2.40 to 0.42%. They were isolated by chromatographic processes (Scheme 1) and identified by comparing their retention times with those of the standard compounds and by employing NMR and MS analyses. The plausible mechanism of the DPs formation from CAN is shown in Figure 2.
DP1DP5 derive from the loss of the benzo[d]imidazole ring, with the chain linked to carbon C10 chlorinated on N19 (DP1), non-chlorinated (DP2), oxidized to carboxyl (DP3), replaced by a chlorine (DP4) or engaged in the formation of a urethane derivative (DP5). DP6DP12 probably derive just from the degradation of the benzo[d]imidazole ring; in particular, we have three benzoic acids (DP7, DP8 and DP12), aniline (DP10) and its derivative DP11, phenol (DP6) and chlorobenzene (DP9).
Under the conditions used, in accordance with the data reported in the literature [34,35,36,37], it is possible to hypothesize that CAN undergoes a first oxidation at carbon C18 to obtain the intermediate I1. The latter could undergo the hydrolysis of the C18-N19 bond and release the product DP3 and the intermediate I2. DP3 could first undergo a decarboxylation and then a subsequent chlorination to give DP4. Intermediate I2 could undergo the hydrolysis of the N19-C20 and C20-N21 bonds to give DP8, from which DP11 could then be obtained by decarboxylation and DP12 by deamination. DP10 could be obtained by deamination of DP11 or decarboxylation of DP12. DP12 by deamination could provide DP7 and from the latter, by decarboxylation and subsequent oxidation, it could have DP6 or, by decarboxylation and subsequent chlorination, DP9. The starting product for hydrolysis of the N19-C23 and C20-N21 bonds could release DP2, together with DP8, and from this one, obtain DP1 by chlorination on N19. From DP2 by reaction with ammonia, the final product of the complete degradation of the drug, it could produce urethane DP5 and from this, by hydrolysis and subsequent oxidation, the product DP3. A plausible mechanism of the DPs formation from CAN is shown in Figure 2.

2.3. Ecotoxicity Data

Toxicity data were obtained using bioluminescent bacteria (A. fischeri), green algae (R. subcapitata) and crustaceans (D. magna). The results in Figure 3A reveal that both unicellular organisms were less sensitive than the multicellular species (D. magna), which unexpectedly proved to be the least resistant to the target compounds. The acute toxicity measured with aquatic organisms was expressed in toxic units (TU), where TU = 1/EC50. A class weight score (CWS) was calculated for each toxicity class in order to indicate the quantitative importance (weight) of the toxicity in that class [38]. Scores from the battery of toxicity tests performed on pharmaceutical samples were transformed into percentage values and assigned to surface water hazard categories (Figure 3B).
The results indicate that approximately 21.4% of samples (CAN, DP8 and a mixture) are not a significant acute hazard (class I), while 42.9% of samples (DP1, DP2, DP6, DP7, DP9 and DP12) are classified as a slight acute hazard (class II) according to the classification system. Of the remaining samples (DP3, DP4, DP5, DP10 and DP11), 35.7% belong to the acute hazard category (class III) and can definitely pose serious risks to ecosystem integrity. Biostimulation was observed only in three samples (DP7, DP8 and DP9), and the highest contribution was from the bacteria A. fischeri.

3. Materials and Methods

3.1. Drug and Reagents

Candesartan (99.5%) was purchased from Sigma Aldrich (Milan, Italy). All the other chemicals and solvents were purchased from Fluka (Saint-Quentin Fallavier, France) and were of HPLC grade and used as received. For the antimicrobial assessment, tryptic soy broth (TSB, Difco, Becton-Dickenson Labs, Heidelberg, Germany) was used. All chemicals were of analytical grade and supplied by Sigma Aldrich. Double-distilled water (Microtech, Naples, Italy) was used to prepare the dilution water and treatments. The microbial growth was measured with an automatic plate reader (Synergy HTX, BioTek Instruments, Winooski, VT, USA).

3.2. Chlorination Reaction

3.2.1. Apparatus and Equipment

Column chromatography (CC) was carried out with Kieselgel 60 (230–400 mesh, Merck, Darmstadt, Germany). HPLC was performed on a Shimadzu LC-8A system using a Shimadzu SPD-10A VP UV-VIS detector (Shimadzu, Milan, Italy). Preparative HPLC was performed using an RP Gemini C18-110A preparative column (10 μm particle size, 250 mm × 21.2 mm i.d., Phenomenex, Bologna, Italy) with a flow rate of 7.0 mL/min. The 1H- and 13C-NMR spectra were recorded with an NMR spectrometer operated at 400 MHz and 25 °C (Bruker DRX, Bruker Avance, Billica, MA, USA) and referenced in ppm to the residual solvent signals (CDCl3, at δH 7.27 and δC 77.0). The proton-detected heteronuclear correlations were measured using a gradient heteronuclear single-quantum coherence (HSQC) experiment, optimized for 1JHC = 155 Hz, and a gradient heteronuclear multiple bond coherence (HMBC) experiment, optimized for nJHC = 8 Hz. MALDI-TOF mass spectrometric analyses were performed on a Voyager-De Pro MALDI mass spectrometer (PerSeptive Biosystems, Framingham, MA, USA). The UV-VIS spectra were recorded with a Perkin Elmer Lambda 7 spectrophotometer. The IR spectra were recorded with a Jasco FT/IR-430 instrument equipped with a single reflection ATR accessory. A WTW pH 7110 pH meter (Xylem Analytics, Weilheim, Germany) equipped with a WTW SenTix41 electrode with a temperature sensor was used to record pH.

3.2.2. Chlorination Experiments

A 10−5 M CAN solution was treated for 1 h with 10% hypochlorite (molar ratio CAN/HClO 1:1 concentration, spectroscopically determined at λmax = 292 nm and ε 350 = dm3/mol cm) at room temperature [27], simulating the conditions used in a typical WWTP. The presence of CAN was quantified using the UV-VIS spectrophotometer. Absorbance peaks were determined at 230 nm. The absorbance values were converted into concentration using a calibration curve prepared from standard solutions with known CAN concentrations. The pH of the solution, measured and recorded continuously using a pH meter, increased immediately from the initial pH of 8.0 to 10.5, and the pH remained at this value during the reaction. An aliquot of the solution was quenched by excess sodium thiosulfate, filtered and dried by lyophilization. The residue was dissolved in a saturated sodium bicarbonate solution and extracted with ethyl acetate. The course of the reaction was monitored by HPLC. The main degradation byproducts (DP1DP6, DP8DP9 and DP11DP12 for the ethyl acetate fraction and DP7 and DP10 for the aqueous fraction; Scheme 1 and Figure 1) were identified by comparing their retention times with those of commercially available standard compounds or those isolated by performing preparative experiments with a solution of CAN at a concentration higher than 10−3 M treated with 5% hypochlorite (molar ratio CAN/HClO 1:20 concentration) at room temperature for 2 h. The DPs obtained were isolated by column chromatography and HPLC and completely characterized using NMR and MS analyses.

3.2.3. Chlorination Procedure and Product Isolation

Candesartan (0.5 g, 1.14 mmol) was dissolved in phosphate buffer (KH2PO4/K2HPO4 0.1 M, 500 mL), and 5% hypochlorite was added drop by drop (molar ratio CAN/HClO 1:20; concentration spectroscopically determined at λmax = 292 nm, ε = 350 dm3/mol cm) at room temperature [28]. The pH of the solution, monitored with a pH meter, was adjusted by adding a 10% H3PO4 solution, and it remained stable at 6.5 for the entire duration of the experiment. The solution was quenched after 2 h with an excess of sodium thiosulfate, concentrated by lyophilization and extracted with ethyl acetate (EA) and water (W). The crude EA fraction (446 mg) was chromatographed on silica gel CC, eluting with a gradient of methylene chloride:methanol:acetic acid (100:0:0.5 to 70:30:0.5, v/v/v) to yield 18 fractions.
Fraction EA2 (9 mg), eluted with methylene chloride:methanol:acetic acid (100:0:0.5, v/v/v), was analyzed by HPLC using a reversed-phase column (Luna 5 µm 100 Å C18(2); 150 × 4.6 mm) and eluting with water:methanol (20:80, v/v) at a solvent flow rate of 1 mL/min to yield DP9 (tR 7.2 min, 2.1 mg).
Fraction EA3 (47 mg), eluted with methylene chloride:methanol:acetic acid (98:2:0.5, v/v/v), was re-chromatographed on silica gel CC by eluting with a gradient of petrol ether:acetone (100:0 to 50:50, v/v) to yield 6 subfractions. Subfraction EA3.4 (13 mg), eluted with petrol ether:acetone (50:50, v/v), was analyzed by HPLC using a reversed-phase column (Kromasil 10 µm 100 Å C18; 250 × 10 mm) and eluting with a gradient of CH3COONH4 (A, pH 4.0; 10 mM) and methanol (B), starting with 70% B for 1 min and establishing a gradient to obtain 100% B over 20 min at a solvent flow rate of 4 mL/min, in order to yield DP2 (tR 17.9 min, 4.2 mg).
Fraction EA5 (57 mg), eluted with methylene chloride:methanol:acetic acid (90:10:0.5, v/v/v), was separated by semipreparative HPLC using a reversed-phase column (Kromasil 10 µm 100 Å C18; 250 × 10 mm) and eluting with a gradient of CH3COONH4 (A, pH 4.0; 10 mM) and methanol (B), starting with 60% B for 1 min and establishing a gradient to obtain 100% B over 30 min at a solvent flow rate of 4 mL/min, in order to yield 4 subfractions. Subfractions EA5.1 (8 mg) and EA5.2 (5 mg) were re-chromatographed by HPLC using a reversed-phase column (Kinetex 2.6 µm 100 Å C18; 100 × 4.6 mm) and eluting with a gradient of acetic acid:methanol (A, 1:99, v/v) and acetic acid:water (B, 1:99, v/v), starting with 60% B for 5 min and establishing a gradient to obtain 100% A over 35 min and returning to 60% B for 10 min at a solvent flow rate of 0.8 mL/min. They contained DP3 (tR 9.8 min, 3.2 mg) and DP4 (tR 17.3 min, 3.1 mg), respectively.
Fraction EA6 (11 mg), eluted with methylene chloride:methanol:acetic acid (85:15:0.5, v/v/v), was analyzed by HPLC using a reversed-phase column (Luna 5 µm 100 Å C18(2); 150 × 4.6 mm) and eluting with a gradient of CH3COONH4 (A, pH 4.0; 10 mM) and methanol (B), starting with 40% B for 1 min and establishing a gradient to obtain 100% B over 20 min at a solvent flow rate of 1 mL/min, in order to yield DP5 (tR 11.5 min, 8.1 mg).
Fraction EA8 (38 mg), eluted with methylene chloride:methanol:acetic acid (80:20:0.5, v/v/v), was analyzed by HPLC using a reversed phase column and eluting with a gradient of CH3COONH4 (A, pH 4.0; 10 mM) and acetonitrile (B), starting with 20% B for 1 min and establishing a gradient to obtain 90% B over 25 min at a solvent flow rate of 3.5 mL/min, in order to yield DP6 (tR 11.3 min, 5.3 mg) and DP11 (tR 15.0 min, 3.1 mg).
Fraction EA9 (19 mg), eluted with methylene chloride:methanol:acetic acid (75:25:0.5, v/v/v), was analyzed by HPLC using a reversed-phase column (Kromasil 10 µm 100 Å C18; 250 × 10 mm) and eluting with a gradient of water (A) and MeOH (B), starting with 10% A for 1 min and establishing a gradient to obtain 10% A over 30 min at a solvent flow rate of 1 mL/min, in order to yield DP8 (tR 5.3 min, 4.0 mg) and DP12 (tR 7.1 min, 4.3 mg).
Fraction EA10 (203 mg), eluted with methylene chloride:methanol:acetic acid (70:30:0.5, v/v/v), was re-chromatographed on silica gel CC by eluting with a gradient of chloroform:acetone (100:0 to 60:40, v/v) to yield 21 subfractions. Subfraction EA10.9 (73 mg), eluted with chloroform:acetone (70:30, v/v), was analyzed by preparative HPLC using a reversed-phase column (Gemini 10 µm C18 110 Å; 250 × 21 mm) and eluting with a gradient of CH3COONH4 (A, pH 4.0; 10 mM) and methanol (B), starting with 0% B for 1 min and establishing a gradient to obtain 100% B over 20 min at a solvent flow rate of 7.5 mL/min, in order to yield DP1 (tR 18.4 min, 12.0 mg).
The aqueous fraction (W, 3.5 g) was dried by lyophilization, re-dissolved in water and filtered on an RP-18 reversed-phase silica gel for column chromatography (CC) using a gradient of water:methanol (100:0 to 0:100, v/v) to yield 12 fractions. The last fraction, eluted with methanol (165 mg), was dried by a rotary evaporator, re-dissolved in methanol and separated with silica gel CC using a gradient of methylene chloride:methanol (100:0 to 0:100, v/v) to yield 15 fractions.
Fraction W12.13 (29 mg), eluted with methylene chloride:methanol (70:30, v/v), was dried, dissolved in an appropriate volume of methylene chloride (100 μL) and analyzed using a Shimadzu 2010 series GC FID (Shimadzu, Milano, Italy). The gas chromatograph was equipped with an EquityTM-5 capillary column (30 m × 0.25 mm I.D. × 0.5 μm film thickness). The following parameters were set during the experiments: a detector temperature of 325 °C, helium as the carrier gas (25 cm/s) and an injected sample volume of 1.0 μL, introduced into the injector using an AOC-20i autosampler (Shimadzu, Milano, Italy) heated to 280 °C with a split ratio of 100:1. The initial temperature was 40 °C (2 min), which was increased at 50 °C/min to 100 °C, 10 °C/min to 200 °C and 30 °C/min to 325 °C (7.5 min). DP7 (tR 15.9 min, 7.6 mg) and DP10 (tR 21.2 min, 6.7 mg) were identified by comparing the results with data on standard compounds and their relative calibration lines.

3.3. Spectral Data

Candesartan cilexetil: 1-(((cyclohexyloxy)carbonyl)oxy)ethyl 1-((2′-(2H-tetrazol-5- yl)-[1,1′-biphenyl]-4-yl)methyl)-2-ethoxy-1H-benzo[d]imidazole-7-carboxylate. White powder. 1H- and 13C-NMR (see Table S1). MS-TOF (positive ions): m/z calculated for C33H34N6O6 m/z 610.25 [M]+; found 611.65 [M + H]+ (28%).
Candesartan: 1-((2′-(2H-tetrazol-5-yl)-[1,1′-biphenyl]-4-yl)methyl)-2-ethoxy-1H-ben zo[d]imidazole-7-carboxylic acid. White powder. 1H- and 13C-NMR (see Table S2). MS-TOF (positive ions): m/z calculated for C24H20N6O3 m/z 440.16 [M]+; found 441.46 [M + H]+ (40%).
DP1: Ethyl ((2′-(2H-tetrazol-5-yl)-[1,1′-biphenyl]-4-yl)methyl)chlorocarbamate. White powder. 1H- and 13C-NMR (see Table S3). MS-TOF (positive ions): m/z calculated for C17H16N5O2Cl m/z 357.10 [M]+ and 359.11 [M + 2]+; found 357.08 [M]+ (78%); 359.09 [M + 2]+ (37%).
DP2: Ethyl ((2′-(2H-Tetrazol-5-yl)-[1,1′-biphenyl]-4-yl)methyl)carbamate. White powder. 1H- and 13C-NMR (see Table S4). MS-TOF (positive ions): m/z calculated for C17H17N5O2 m/z 323.14 [M]+; found 324.37 [M + H]+ (63%).
DP3: 2′-(2H-Tetrazol-5-yl)-[1,1′-biphenyl]-4-carboxylic acid. White powder. 1H- and 13C-NMR (see Table S5). MS-TOF (positive ions): m/z calculated for C14H10N4O2 m/z 266.08 [M]+; found 267.26 [M + H]+ (58%) [29].
DP4: 5-(4′-Chloro-[1,1′-biphenyl]-2-yl)-2H-tetrazole. White powder. 1H- and 13C-NMR (see Table S6). MS-TOF (positive ions): m/z calculated for C13H9N4Cl m/z 256.05 [M]+ and 258.04 [M + 2]+; found 256.02 [M]+ (94%); 258.04 [M + 2]+ (43%).
DP5: 1-((2′-(2H-Tetrazol-5-yl)-[1,1′-biphenyl]-4-yl)methyl)urea. White powder. 1H- and 13C-NMR (see Table S7). MS-TOF (positive ions): m/z calculated for C15H14N6O m/z 294.12 [M]+; found 295.22 [M + H]+ (45%).
DP6: Phenol. White oil. NMR spectra conform to those recorded for the commercially available standard [39].
DP7: Benzoic acid. Identified by comparison with standard compounds [39].
DP8: 2,3-Diaminobenzoic acid. White powder. NMR spectra conform to those recorded for the commercially available standard [40].
DP9: Chlorobenzene. White oil. NMR spectra conform to those recorded for the commercially available standard [39].
DP10: Aniline. Identified by comparison with an authentic sample [39].
DP11: 1,2-Benzenediamine. White powder. NMR spectra are in accordance with those reported in the literature [39].
DP12: 2-Aminobenzoic acid. White powder. NMR spectra conform to those recorded for the commercially available standard [39].

3.4. Ecotoxicity Tests

The toxicity of candesartan and its DPs was assessed towards three organisms, A. fischeri, R. subcapitata and D. magna.
The acute bioluminescence assay was detected with the A. fischeri (NRRLB-11177) bacterium supplied by MicroBioTest, Gent, Belgium, and activated by rehydration with a reconstitution solution, according to ISO 11348-3:2007 [41]. These toxicity experiments were carried out with a luminometer Microtox (Model 500 analyzer, New Castle, DE, USA), according to the international procedure (ISO 11348-3). To provide the required osmotic pressure for the test organism, the assay was conducted using a saline water solution (2% sodium chloride, NaCl). The bioluminescence intensity of A. fischeri bacteria was measured after 30 min at 490 nm of exposition to the solutions containing CAN and its DPs at 15 °C. The test was performed in triplicate with a control, and pharmaceutical and toxic effect values were expressed as the ratio of the decrease in bacterial light production to the remaining light.
The algal growth inhibition test was performed according to the European standard EN ISO 8692:2012 [42] using R. subcapitata. Algal cells in the exponential growth phase were taken from an exponentially growing pre-culture according to ISO 8692 [37], and it was added to the solution of CAN and its DPs to reach a final algal concentration of 104 cells/mL. Algal toxicity tests were carried out in three replicates and maintained under continuous illumination (white fluorescent light) at 22 ± 4 °C for incubation and were mixed twice a day by hand. The algal growth was measured after 72 h at 670 nm (HachLange DR 5000, Loveland, CO, USA). The difference between the growth rate in the control group and the solutions provided inhibition rate in each samples.
The acute immobilization test with D. magna was performed according to the European Standard EN ISO 6341:2013 [43]. Daphnids (less than 24 h old) obtained from a laboratory culture were used (20 organisms for each pharmaceutical and control). In the acute assay, three parallel replicates of 6-well plates were used, and the number of immobilized organisms was determined under stereomicroscopy (LEICA EZ4-HD) after 24 and 48 h of exposure. Daphnids were considered immobilized if they lost the aptitude to perform vertical swimming after 15 s of observation and after slight agitation of the multiwell plate.
Toxicity of the samples was expressed as Toxic Unit (TU), where TU = 1/EC50. The homoscedasticity (F test, p < 0.05) and normality (Shapiro–Wilk test, p < 0.05) of data were verified using Prism 8 (GraphPad Inc., Version 8.4.2, San Diego, CA, USA). TU data were integrated according to Persoone et al.’s [38] approach for natural water and a class weight score (CWS) was determined by averaging the values corresponding to each microbiotest class normalized to the most sensitive organism (highest score).

4. Conclusions

This study investigated the fate of candesartan by monitoring its degradation using an excess of sodium hypochlorite. After the chlorination treatment, chromatographic techniques were used to isolate 12 degradation byproducts, four of which were isolated for the first time, which were fully characterized by MS and NMR analyses and compared with parental samples. Some byproducts retain the diphenyl base nucleus and the tetrazole ring of the side chain, but undergo the partial degradation (DP1DP2 and DP5) or the loss (DP3 and DP4) of benzimidazole; others have a C6C1 (DP7, DP8 and DP12) or C6C0 (DP6, DP9DP11) skeleton, obviously being the degradation products of the first five. About 35% of the initial quantity of candesartan is estimated to undergo complete mineralization, and about 13% is transformed into degradation byproducts. A possible mechanism for the degradation of candesartan and the formation of its degradation byproducts is proposed. The CWS approach confirmed that 78.6% of the total investigated pharmaceutical samples are able to have some adverse ecotoxicological effects on the aquatic environment and that effluents containing CAN degradation byproducts with pollutant potential could generate negative impacts on water and/or soil equilibrium, as well as human health. It would be interesting in the future to use the waters of a WWTP to consider, for example, the effect of ammonia present (or other pollutants) as well as to compare the byproducts of candesartan obtained by hypochlorite with those that could be obtained by ozonation or other oxidative degradation methods (UV, peracetic acid, …).

Supplementary Materials

The following are available online, 1 H-, 13C- and 2D-NMR data of Candesartan Cilexetil, Candesartan and DP1DP5, Tables S1–S7.

Author Contributions

G.L. (Giovanni Luongo) performed the chlorination experiments; M.G., A.S., G.L. (Giovanni Libralato) and L.S. performed the acute and chronic toxicity tests; A.Z., L.P. and G.D.F. designed the research study and wrote the paper. All authors have read and agreed to the published version of the manuscript.

Funding

This research received no external funding.

Acknowledgments

This research was supported by AIPRAS-Onlus (Associazione Italiana per la Promozione delle Ricerche sull’Ambiente e la Salute umana) for the grants in support of this investigation.

Conflicts of Interest

The authors declare no conflict of financial interests.

Sample Availability

Samples of the compounds DP6DP12 are available from the authors.

References

  1. Gabarrón, S.; Gernjak, W.; Valero, F.; Barceló, A.; Petrovic, M.; Rodríguez-Roda, I. Evaluation of emerging contaminants in a drinking water treatment plant using electrodialysis reversal technology. J. Hazard. Mater. 2016, 309, 192–201. [Google Scholar] [CrossRef]
  2. Gani, K.M.; Hlongwa, N.; Abunama, T.; Kumari, S.; Bux, F. Emerging contaminants in South African water environment-A critical review of their occurrence, sources and ecotoxicological risks. Chemosphere 2020, 128737. [Google Scholar] [CrossRef] [PubMed]
  3. Vieira, W.T.; de Farias, M.B.; Spaolonzi, M.P.; da Silva, M.G.C.; Vieira, M.G.A. Endocrine-disrupting compounds: Occurrence, detection methods, effects and promising treatment pathways–a critical review. J. Environ. Chem. Eng. 2020, 104558. [Google Scholar] [CrossRef]
  4. Valdez-Carrillo, M.; Abrell, L.; Ramírez-Hernández, J.; Reyes-López, J.A.; Carreón-Diazconti, C. Pharmaceuticals as emerging contaminants in the aquatic environment of Latin America: A review. Environ. Sci. Pollut. Res. 2020, 1–29. [Google Scholar] [CrossRef]
  5. Snow, D.D.; Cassada, D.A.; Biswas, S.; Malakar, A.; D’Alessio, M.; Marshall, A.H.; Sallach, J.B. Detection, occurrence, and fate of emerging contaminants in agricultural environments. Water Environ. Res. 2020, 92, 1741–1750. [Google Scholar] [CrossRef] [PubMed]
  6. de Oliveira, M.; Frihling, B.E.F.; Velasques, J.; Magalhães Filho, F.J.C.; Cavalheri, P.S.; Migliolo, L. Pharmaceuticals residues and xenobiotics contaminants: Occurrence, analytical techniques and sustainable alternatives for wastewater treatment. Sci. Total Environ. 2020, 705, 135568. [Google Scholar] [CrossRef]
  7. Castillo-Zacarías, C.; Barocio, M.E.; Hidalgo-Vázquez, E.; Sosa-Hernández, J.E.; Parra-Arroyo, L.; López-Pacheco, I.Y.; Barcelo, D.; Iqbal, H.N.M.; Parra-Saldívar, R. Antidepressant drugs as emerging contaminants: Occurrence in urban and non-urban waters and analytical methods for their detection. Sci. Total Environ. 2020, 757, 143722. [Google Scholar] [CrossRef]
  8. Sauvé, S.; Desrosiers, M. A review of what is an emerging contaminant. Chem. Cent. J. 2014, 8, 1–7. [Google Scholar] [CrossRef] [Green Version]
  9. Montes-Grajales, D.; Fennix-Agudelo, M.; Miranda-Castro, W. Occurrence of personal care products as emerging chemicals of concern in water resources: A review. Sci. Total Environ. 2017, 595, 601–614. [Google Scholar] [CrossRef] [PubMed]
  10. Mills, L.J.; Chichester, C. Review of evidence: Are endocrine-disrupting chemicals in the aquatic environment impacting fish populations? Sci. Total Environ. 2005, 343, 1–34. [Google Scholar] [CrossRef] [Green Version]
  11. Devarajan, N.; Köhler, T.; Sivalingam, P.; Van Delden, C.; Mulaji, C.K.; Mpiana, P.T.; Ibelings, P.T.; Poté, J. Antibiotic resistant Pseudomonas spp. in the aquatic environment: A prevalence study under tropical and temperate climate conditions. Water Res. 2017, 115, 256–265. [Google Scholar] [CrossRef] [Green Version]
  12. Zhou, Y.; Niu, L.; Zhu, S.; Lu, H.; Liu, W. Occurrence, abundance, and distribution of sulfonamide and tetracycline resistance genes in agricultural soils across China. Sci. Total Environ. 2017, 599, 1977–1983. [Google Scholar] [CrossRef]
  13. Li, P.; Wu, Y.; He, Y.; Zhang, B.; Huang, Y.; Yuan, Q.; Chen, Y. Occurrence and fate of antibiotic residues and antibiotic resistance genes in a reservoir with ecological purification facilities for drinking water sources. Sci. Total Environ. 2020, 707, 135276. [Google Scholar] [CrossRef]
  14. Mathew, R.A.; Kanmani, S. A review on emerging contaminants in indian waters and their treatment technologies. Nat. Environ. Pollut. Technol. 2020, 19, 549–562. [Google Scholar] [CrossRef]
  15. Boumendjel, A.; Tawe, G.S.; Bum, E.N.; Chabrol, T.; Beney, C.; Sinniger, V.; Haudecoeur, R.; Marcourt, L.; Challal, S.; Ferreira–Queiroz, E.; et al. Occurrence of the synthetic analgesic tramadol in an African medicinal plant. Angew. Chem. Int. Ed. Engl. 2013, 52, 11780–11784. [Google Scholar] [CrossRef] [PubMed]
  16. Jean, J.; Perrodin, Y.; Pivot, C.; Trepo, D.; Perraud, M.; Droguet, J.; Tissot-Guerraz, F.; Locher, F. Identification and prioritization of bioaccumulable pharmaceutical substances discharged in hospital effluents. J. Environ. Manag. 2012, 103, 113–121. [Google Scholar] [CrossRef] [PubMed]
  17. Fowler, P.A.; Bellingham, M.; Sinclair, K.D.; Evans, N.P.; Pocar, P.; Fischer, B.; Schaedlich, K.; Schmidt, J.-S.; Amezaga, M.R.; Bhattacharya, S.; et al. Impact of endocrine-disrupting compounds (EDCs) on female reproductive health. Mol. Cell. Endocrinol. 2012, 355, 231–239. [Google Scholar] [CrossRef] [PubMed]
  18. Hess-Wilson, J.K.; Knudsen, K.E. Endocrine disrupting compounds and prostate cancer. Cancer Lett. 2006, 241, 1–12. [Google Scholar] [CrossRef]
  19. Ladhari, A.; La Mura, G.; Di Marino, C.; Di Fabio, G.; Zarrelli, A. Sartans: What they are for, how they degrade, where they are found and how they transform. Sustain. Chem. Pharm. 2021, 20, 100409. [Google Scholar] [CrossRef]
  20. Hollender, J.; Rothardt, J.; Radny, D.; Loos, M.; Epting, J.; Huggenberger, P.; Borer, P.; Singer, H. Comprehensive micropollutant screening using LC-HRMS/MS at three riverbank filtration sites to assess natural attenuation and potential implications for human health. Water Res. X 2018, 1, 100007. [Google Scholar] [CrossRef]
  21. Patel, M.; Kumar, R.; Kishor, K.; Mlsna, T.; Pittman Jr, C.U.; Mohan, D. Pharmaceuticals of emerging concern in aquatic systems: Chemistry, occurrence, effects, and removal methods. Chem. Rev. 2019, 119, 351–3673. [Google Scholar] [CrossRef] [Green Version]
  22. Bayer, A.; Asner, R.; Schüssler, W.; Kopf, W.; Weiß, K.; Sengl, M.; Letzel, M. Behavior of sartans (antihypertensive drugs) in wastewater treatment plants, their occurrence and risk for the aquatic environment. Environ. Sci. Pollut. Res. Int. 2014, 21, 10830–10839. [Google Scholar] [CrossRef]
  23. Chusaksri, S.; Sutthivaiyakit, S.; Sedlak, D.L.; Sutthivaiyakit, P. Reactions of phenylurea compounds with aqueous chlorine: Implications for herbicide transformation during drinking water degradation. J. Hazard. Mat. 2012, 209, 484–491. [Google Scholar] [CrossRef]
  24. Sandín-España, P.; Magrans, J.O.; García-Baudín, J.M. Study of clethodim degradation and by-product formation in chlorinated water by HPLC. Chromatographia 2005, 62, 133–137. [Google Scholar] [CrossRef]
  25. Luongo, G.; Previtera, L.; Ladhari, A.; Di Fabio, G.; Zarrelli, A. Peracetic acid vs. sodium hypochlorite: Degradation and transformation of drugs in wastewater. Molecules 2020, 25, 2294. [Google Scholar] [CrossRef] [PubMed]
  26. Luongo, G.; Guida, M.; Siciliano, A.; Libralato, G.; Saviano, L.; Amoresano, A.; Previtera, L.; Di Fabio, G.; Zarrelli, A. Oxidation of diclofenac in water by sodium hypochlorite: Identification of new degradation by-products and their ecotoxicological evaluation. J. Pharm. Biomed. Anal. 2020, 113762. [Google Scholar] [CrossRef] [PubMed]
  27. European Commission Guidance Document on Aquatic Ecotoxicology. Under Council directive 91/414/EEC. SANCO/3268/2001 Rev 4. 2002; (available in the laboratory).
  28. Bedner, M.; MacCrehan, W.A. Transformation of acetaminophen by chlorination produces the toxicants 1,4-benzoquinone and N-acetyl-p-benzoquinone imine. Environ. Sci. Technol. 2006, 40, 516–522. [Google Scholar] [CrossRef]
  29. Kumaraswamy, K.; Gandham, H.B.; Prasad, R.J.; Reddy, B.A.; Kaliyaperumal, M.; Rumalla, C.S. Isolation and characterization of novel degradation products of valsartan by nmr and high resolution mass spectroscopy: Development and validation of valsartan by UPLC. Asian J. Chem. 2020, 32, 1064–1068. [Google Scholar] [CrossRef]
  30. Romanucci, V.; Siciliano, A.; Galdiero, E.; Guida, M.; Luongo, G.; Liguori, R.; Di Fabio, G.; Previtera, L.; Zarrelli, A. Degradation by-products and ecotoxic risk associated with hypochlorite treatment of tramadol. Molecules 2019, 24, 693. [Google Scholar] [CrossRef] [PubMed] [Green Version]
  31. Zarrelli, A.; Della Greca, M.; Parolisi, A.; Iesce, M.R.; Cermola, F.; Isidori, M.; Lavorgna, M.; Passananti, M.; Previtera, L. Chemical fate and genotoxic risk associated with hypochlorite treatment of nicotine. Sci. Total Environ. 2012, 426, 132–138. [Google Scholar] [CrossRef] [Green Version]
  32. Zarrelli, A.; Della Greca, M.; Iesce, M.R.; Lavorgna, M.; Temussi, F.; Schiavone, L.; Criscuolo, E.; Parrella, A.; Previtera, L.; Isidori, M. Ecotoxicological evaluation of caffeine and its derivatives from a simulated chlorination step. Sci. Total Environ. 2014, 470, 453–458. [Google Scholar] [CrossRef] [PubMed] [Green Version]
  33. Trincado, M.; Grützmacher, H.; Vizza, F.; Bianchini, C. Domino rhodium/palladium-catalyzed dehydrogenation reactions of alcohols to acids by hydrogen transfer to inactivated alkenes. Chem. Eur. J. 2010, 16, 2751–2757. [Google Scholar] [CrossRef] [PubMed]
  34. Romanucci, V.; Siciliano, A.; Guida, M.; Libralato, G.; Saviano, L.; Luongo, G.; Previtera, L.; Di Fabio, G.; Zarrelli, A. Disinfection by-products and ecotoxic risk associated with hypochlorite treatment of irbesartan. Sci. Total Environ. 2020, 712, 135625. [Google Scholar] [CrossRef]
  35. Dimitrakopoulou, D.; Rethemiotaki, I.; Frontistis, Z.; Xekoukoulotakis, N.P.; Venieri, D.; Mantzavinos, D. Degradation, mineralization and antibiotic inactivation of amoxicillin by UV-A/TiO2 photocatalysis. J. Environ. Manag. 2012, 98, 168–174. [Google Scholar] [CrossRef]
  36. Siciliano, A.; Guida, M.; Libralato, G.; Saviano, L.; Luongo, G.; Previtera, L.; Di Fabio, G.; Zarrelli, A. Amoxicillin in water: Insights into relative reactivity, byproduct formation, and toxicological interactions during chlorination. Appl. Sci. 2021, 11, 1076. [Google Scholar] [CrossRef]
  37. Luongo, G.; Siciliano, A.; Libralato, G.; Serafini, S.; Saviano, L.; Previtera, L.; Di Fabio, G.; Zarrelli, A. LC and NMR studies for identification and characterization of degradation byproducts of olmesartan acid, elucidation of their degradation pathway and ecotoxicity assessment. Molecules 2021, 26, 1769. [Google Scholar] [CrossRef]
  38. Persoone, G.; Marsalek, B.; Blinova, I.; Törökne, A.; Zarina, D.; Manusadzianas, L.; Kolar, B. A practical and user friendly toxicity classification system with microbiotests for natural waters and wastewaters. Environ. Toxicol. 2012, 18, 395–402. [Google Scholar] [CrossRef] [PubMed]
  39. AIST: Integrated Spectral Database System of Organic Compounds. Available online: https://sdbs.db.aist.go.jp/sdbs/cgi-bin/direct_frame_top.cgi (accessed on 21 April 2021).
  40. Lavigueur, C.; Foster, E.J.; Williams, V.E. Self-assembly of discotic mesogens in solution and in liquid crystalline phases: Effects of substituent position and hydrogen bonding. J. Am. Chem. Soc. 2008, 130, 11791–11800. [Google Scholar] [CrossRef] [PubMed]
  41. ISO. Water Quality–Determination of the Inhibitory Effect of Water Samples on the Light Emission of Aliivibrio fischeri (Luminescent Bacteria Test)–Part 3: Method Using Freeze-Dried Bacteria; 30ISO 11348-3; ISO: Geneva, Switzerland, 2007. [Google Scholar]
  42. ISO. Water Quality–Fresh Water Algal Growth Inhibition Test with Unicellular Green Algae; ISO 8692; ISO: Geneva, Switzerland, 2012. [Google Scholar]
  43. ISO 6341:2012. Water Quality-Determination of the Inhibition of the Mobility of Daphnia Magna Straus (Cladocera, Crustacea)–Acute Toxicity Test; International Organisation for Standardisation: Geneva, Switzerland, 2012; Available online: https://www.iso.org/standard/54614.html (accessed on 21 April 2021).
Figure 1. Chemical structures of Candesartan and its degradation byproducts.
Molecules 26 03422 g001
Figure 2. Plausible mechanism for the formation of DP1DP12.
Molecules 26 03422 g002
Figure 3. Toxic units (TU) for D. magna (Dm), R. subcapitata (Rs) and A. fischeri (Af) exposed to CAN and their DPs (A). Class weight scores (CWS %) for the selected battery tests (B).
Molecules 26 03422 g003
Scheme 1. Isolation of the different identified compounds.
Molecules 26 03422 sch001
Publisher’s Note: MDPI stays neutral with regard to jurisdictional claims in published maps and institutional affiliations.

