Article

Molecular Structure, Thermodynamic and Spectral Characteristics of Metal-Free and Nickel Complex of Tetrakis(1,2,5-thiadiazolo)porphyrazine

Research Institute of Chemistry of Macroheterocyclic Compounds, Ivanovo State University of Chemistry and Technology, Sheremetievskiy av. 7, 153000 Ivanovo, Russia
*
Author to whom correspondence should be addressed.
Molecules 2021, 26(10), 2945; https://doi.org/10.3390/molecules26102945
Submission received: 15 April 2021 / Revised: 6 May 2021 / Accepted: 10 May 2021 / Published: 15 May 2021

Abstract

:
The Knudsen effusion method with mass spectrometric control of the vapor composition was used to study the possibility of a congruent transition to the gas phase and to estimate the enthalpy of sublimation of metal-free tetrakis(1,2,5-thiadiazolo)porphyrazine and its nickel complex (H2TTDPz and NiTTDPz, respectively). The geometrical and electronic structure of H2TTDPz and NiTTDPz in ground and low-lying excited electronic states were determined by DFT calculations. The electronic structure of NiTTDPz was studied by the complete active space (CASSCF) method, following accounting dynamic correlation by multiconfigurational quasi-degenerate second-order perturbation theory (MCQDPT2). A geometrical structure of D2h and D4h symmetry was obtained for H2TTDPz and NiTTDPz, respectively. According to data obtained by the MCQDPT2 method, the nickel complex possesses the ground state 1A1g, and the wave function of the ground state has the form of a single determinant. Electronic absorption and vibrational (IR and resonance Raman) spectra of H2TTDPz and NiTTDPz were studied experimentally and simulated theoretically.

1. Introduction

There is a growing interest in organic materials for application in optoelectronics due to their low-cost, high-throughput film manufacturing by solution-processing techniques, high-flex-stability, easy scaling up and integration in devices [1,2,3]. Compounds based on tetrapyrrole macrocycles have interesting spectral and non-linear optical properties [4] which are practically useful for optical communication, information storage, optical switching and processing of electro-optical signals [5,6,7,8,9,10].
The structural formulas of the molecules discussed here are presented in the Supplementary Materials. The unsubstituted porphyrazine (or tetra-azaporphyrin) and its metallic derivatives, including the Mg(II), Ni(II) and Cu(II) complexes (MPz), were synthesized in 1952 [11]. Their tetrabenzo fused derivatives, known as phthalocyanines are so far most widely studied. Substitution of benzene rings in phthalocyanines by aromatic heterocycles, e.g., by pyrazine [12,13] or 1,2,5-chalcogenadiazole [14], have a strong impact on the electronic properties of the central porphyrazine (Pz) core which is common to these systems.
The presence of a five-membered heterocycle containing nitrogen and sulfur atoms on the periphery of tetrakis(1,2,5-thiadiazolo)porphyrazine (TTDPz) considerably modulates the physico-chemical properties of the macrocycle and its intermolecular interaction as compared to phthalocyanines [14]. Unlike phthalocyanines, or their pyrazine-fused analogues, TTDPz have no H atoms on the periphery and their molecular packing during crystal growth is determined by specific N…S interactions [15]. This is quite important for application of these phthalocyanine-type molecules as building blocks for novel functional materials in various fields [16].
Porphyrazines with fused 1,2,5-chalcogenadiazole rings having strong π-electron-deficiency [12,17], combined with their ability to form 2D layered structures in the solid state [15], can be considered as prospective n-type conducting functional materials for use in organic electronics. Thus, tetra(1,2,5-thiadiazolo)porphyrazine, H2TTDPz and its metal complexes MTTDPz (M = Zn(II), V(IV)O, and Fe(II)) were used as n-type organic semiconductors in prototypes of field-effect transistors and photovoltaic cells [18,19,20,21,22].
A method consisting of the precipitation of products from the thermal decomposition of highly volatile organometallic precursors (MO CVD (Metal-Organic Chemical Vapor Deposition Technique)) on single-crystal substrates has attracted increasing interest amongst methods for forming thin films. Therefore, data on the structure of molecules in the gas phase and the composition of the vapor over the investigated substances are of interest. Despite their long history, information about porphyrazines and 1,2,5-chalocogenadiazole-fused porphyrazines, especially about their structural and thermal stability properties, compared to a plethora of studies of porphyrins and phthalocyanines, is relatively scant. Awaga et al. grew single crystals of tetrakis-(thiadiazol)porphyrazine and the corresponding metal(II) derivatives, MTTDPz (M = H2, Fe, Co, Ni, Cu, and Zn) by sublimation under reduced pressure with continuous N2 gas flow and elucdated their structures by X-ray crystallographic analysis [15]. However, there are no data on the composition of the vapor. Quantum chemistry investigations of structural and optical properties in the case of transition metal complexes are often non-trivial due to the necessity to account for the multireference character of the wavefunction [23].
Theoretical DFT calculations with various basis sets have been used for the investigation of the molecular and electronic structures and spectral properties of H2TTDPz [24,25] and its metal complexes MTTDPz (M = Mg(II) [24,26], Ca(II) [27], Cu(II) [24,28], Fe(II) [23], Co(II) [23], Zn(II) [24,27,29], ClAl(III) and ClGa(III) [30]. Quantum-chemical calculations and interpretation of electronic and vibrational spectra were also carried out for complexes of tetra(1,2,5-thiadiazolo)porphyrazine with rare earth elements Y, La and Lu [31,32].
Vapor composition and thermodynamic and spectral characteristics are necessary to determine the possibility of using substances in the gas-phase technologies of microelectronics. The main objective of the present study is to identify the influence of the metal on the properties of macrocyclic complexes. It is important to compare the thermal stability, vapor composition, molecular structure and spectra of metal-free tetra(1,2,5-thiadiazolo)porphyrazine (H2TTDPz) and its nickel(II) complex (NiTTDPz). The nickel metal complex NiTTDPz is of interest because metalated porphyrazines are considered possible precursors for much sought-after three-dimensional molecular magnets and possible structures with superconducting properties [33]. Moreover, we have studied theoretically the structure of MTTDPz complexes with some transition metals [23,27] and in this work we begin an experimental study of these substances. The possibility of congruent evaporation and enthalpy of sublimation have been determined using the Knudsen effusion method with mass spectrometric control of vapor composition. The lowest excited states were also calculated in order to explain the peculiarities and tendencies observed in the experimental electronic absorption spectra. In addition, the vibrational absorption spectra were analyzed and interpreted.

2. Results and Discussion
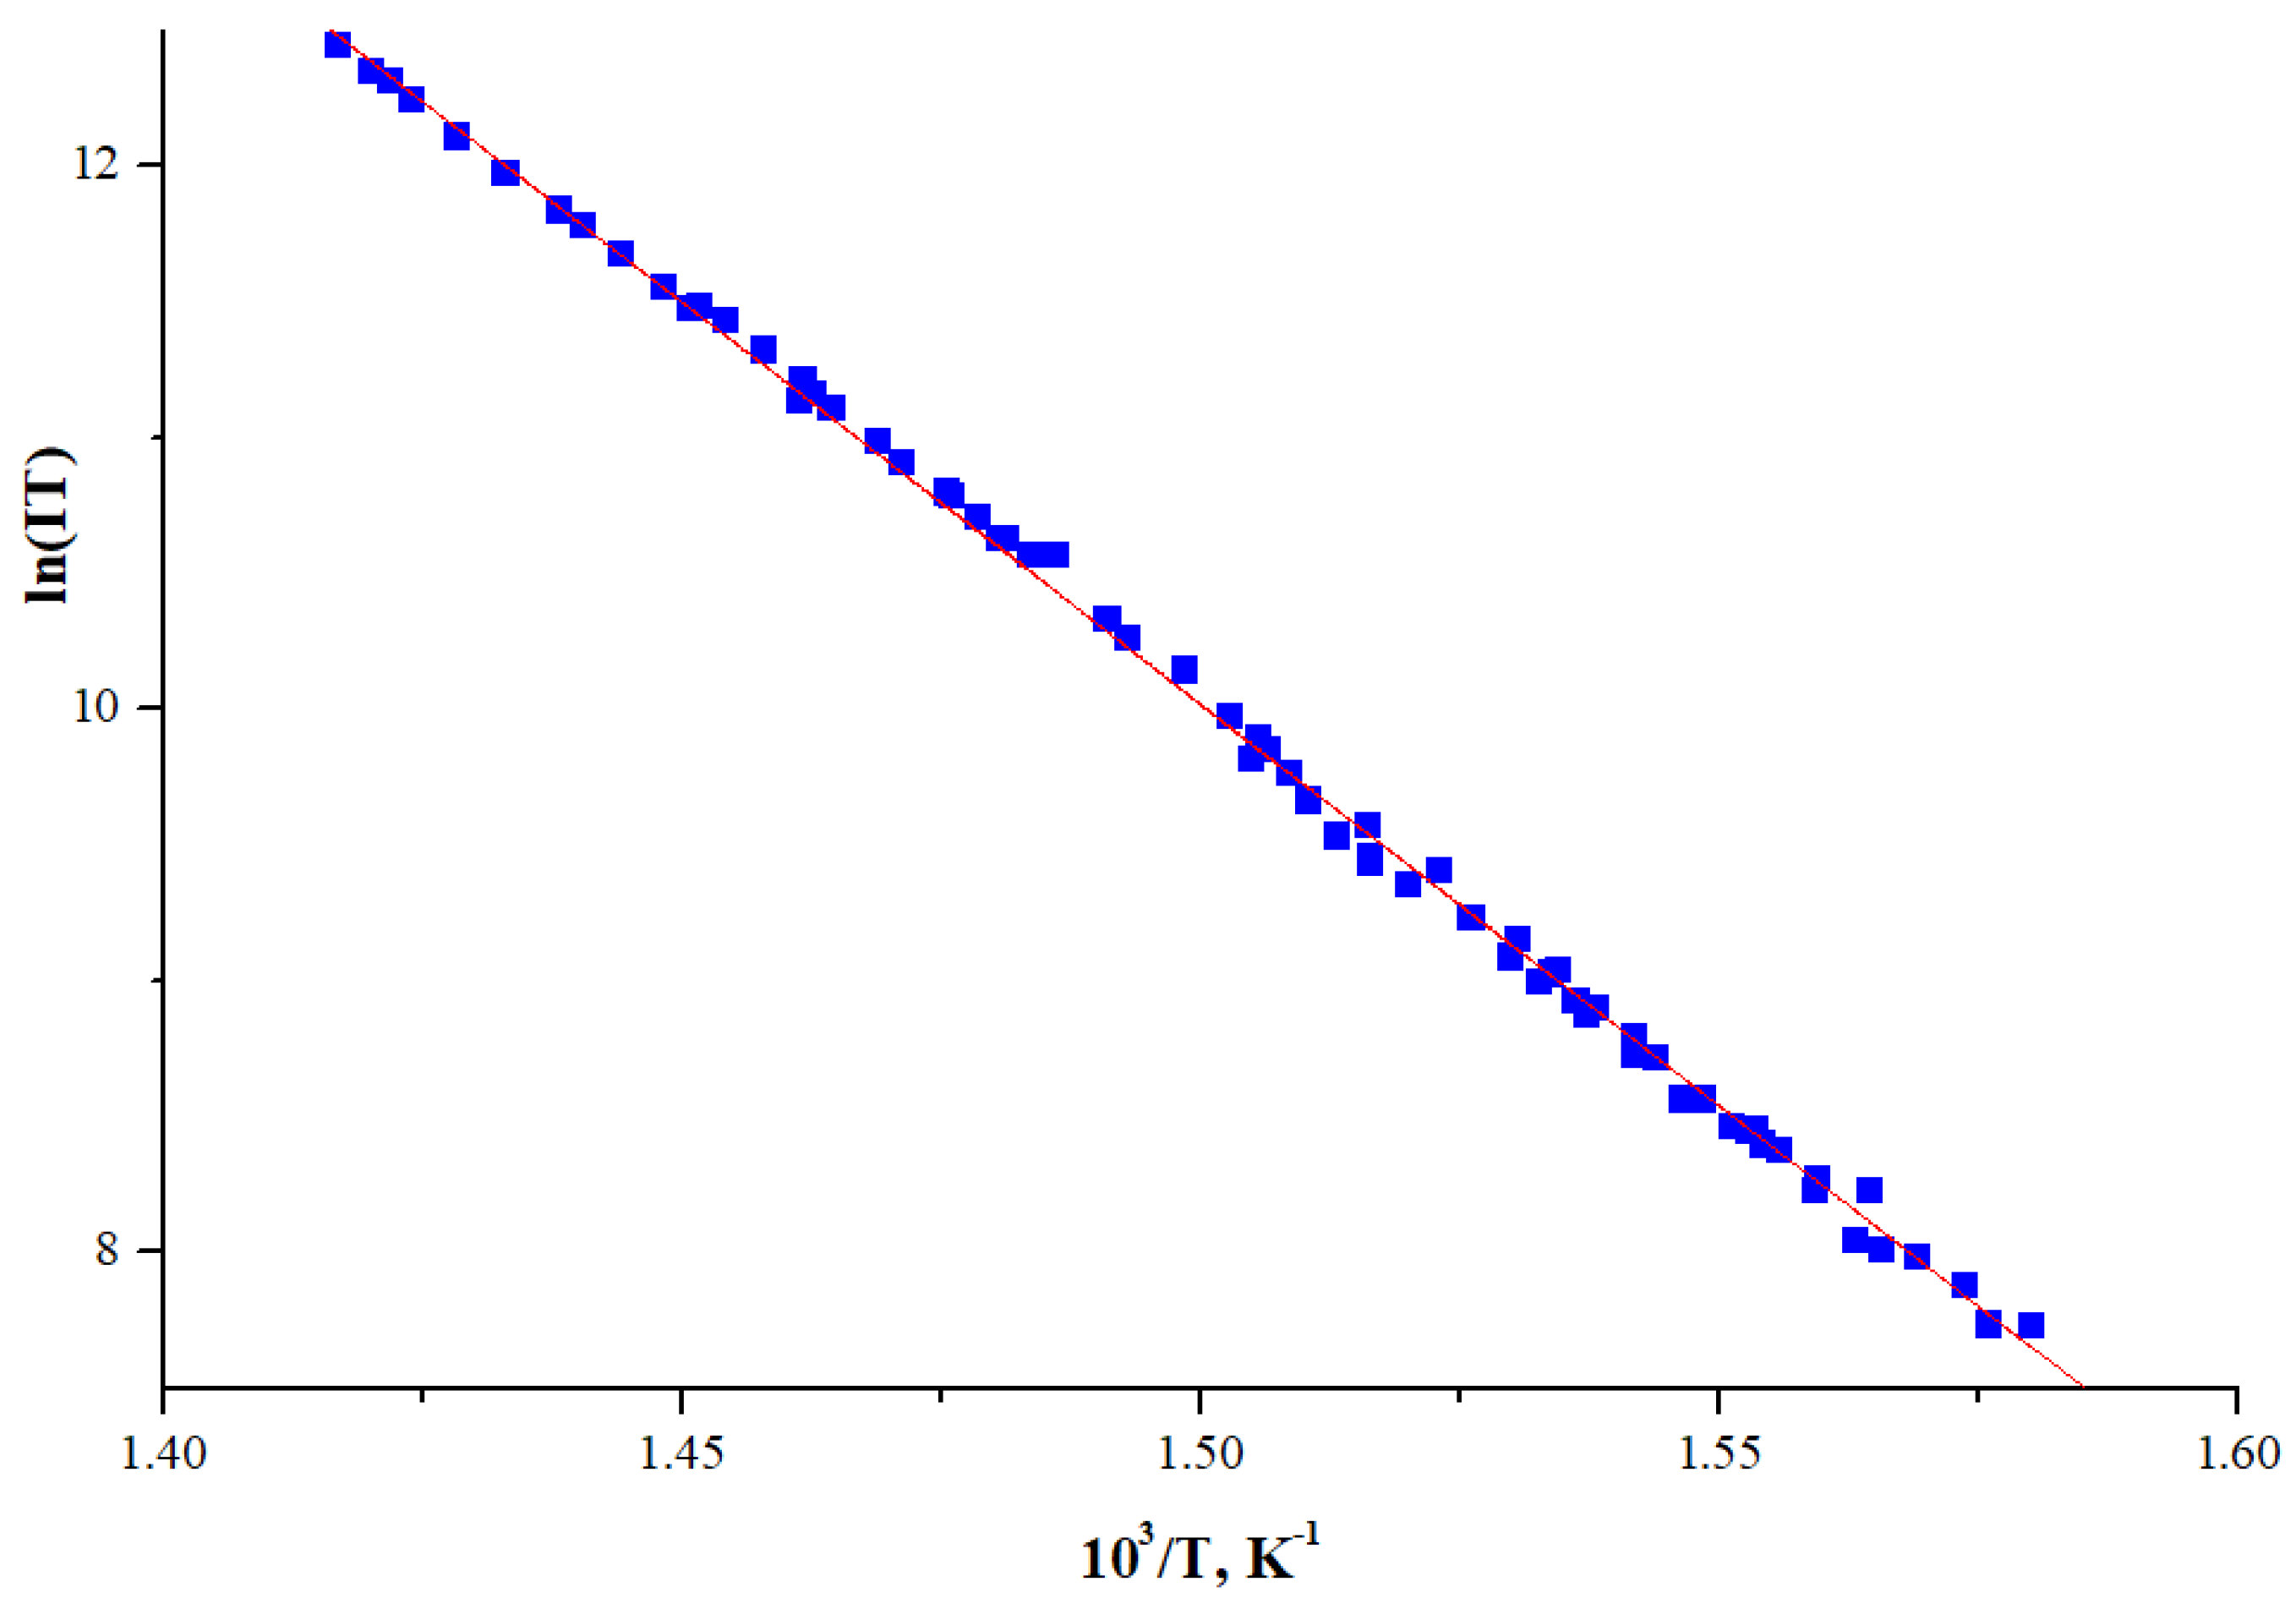
2.1. Sublimation

It was earlier established that MTTDPz (M = H2, Mn, Fe, Co, Ni, Cu, and Zn) can be sublimated under vacuum [15,29], but the thermodynamic characteristics of these processes have not been reported yet.
The electron impact mass spectrum of H2TTDPz recorded at 690 K is shown in Figure 1 and the relative abundance of ions is presented in Table 1. Analyzing the mass spectrum of H2TTDPz, we came to the conclusion that its sublimation is accompanied by partial decomposition. The ion H2TTDPz+ has lower intensity than another heavy ion C4N4S+ at m/z = 136 a.m.u. The C4N4S+ ion corresponds to 1⁄4(TTDPz) and can be assigned to the C4N4S molecular species—1,2,5-thiadiazole-3,4-dicarbonitrile. The relative abundance of ions in mass spectrum of H2TTDPz recorded in the present work is similar to the relative abundance of ions in mass spectrum of ZnTTDPz recorded simultaneously with gas electron diffraction experiment [29]. However, the recording temperature of the ZnTTDPz mass spectrum was 861 K [29], which is 171 K higher than the recording temperature of the H2TTDPz mass spectrum.
Mass-spectrometric studies performed in connection with the sublimation process show that NiTTDPz gives a stable stream of particles at temperatures T = 632–717 K, where a molecular ion (m/z = 602) dominates, followed by several ions of weaker (3–4%) intensity. No ions corresponding to oligomeric species were detected. According to the mass spectra analysis, we are inclined to conclude that saturated vapor consists only of the parent NiTTDPz.
The plot of ln(IT) = f(1000/T) for NiTTDPz+ ion is shown in Figure 2. The set of the points is the result of measurements with a step-by-step increase in temperature, and then with a step-by-step decrease. Each point of the graph corresponds to the ion current measured after its stabilization at a given temperature. One can see that the hysteresis as the temperature increases and decreases is practically absent. This allows us to conclude that points in plots are corresponding to the equilibrium states inside the effusion cell. The dependence ln(IT) = f(1000/T) could be closely approximated by a straight line, usually observed for vaporization in the considered temperature range without change of crystallographic modification of the solid phase and without significant change of the enthalpy of vaporization. The enthalpy of sublimation value ΔHs calculated by linear regression using the Clausius–Clayperon equation Ln ( IT ) = Δ H RT + C was found to be 246(2) kJ·mol−1.

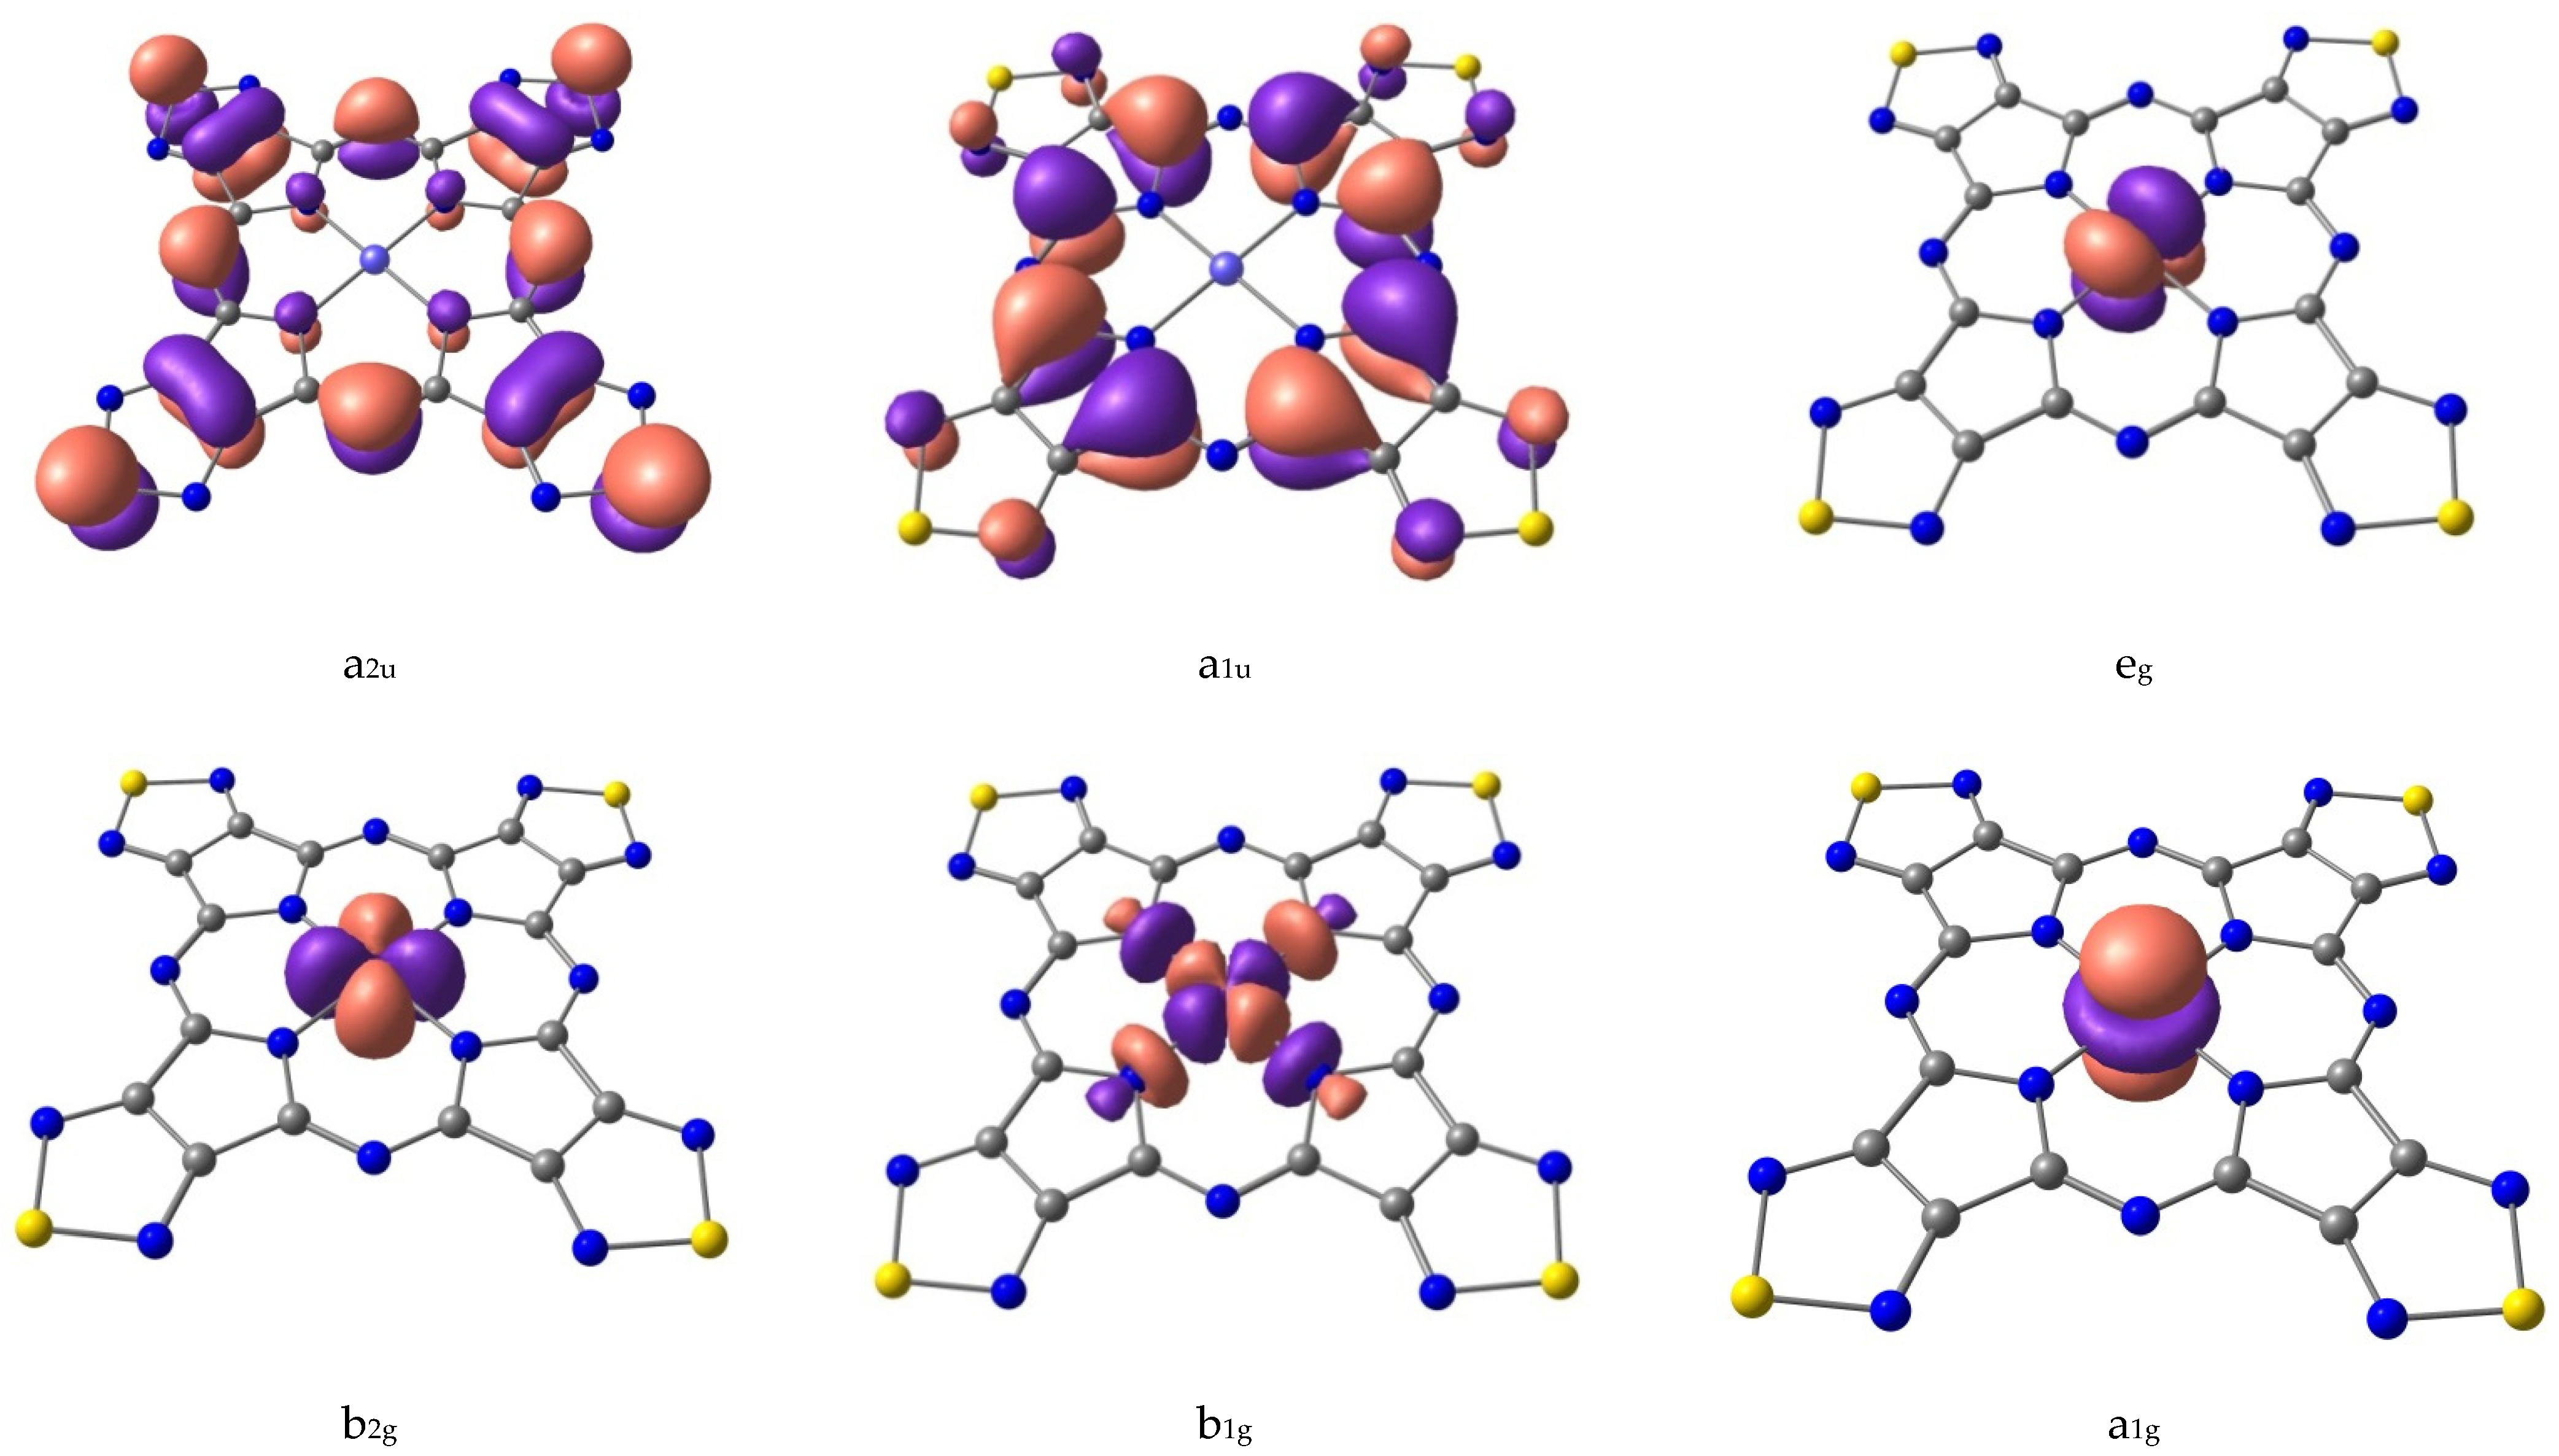
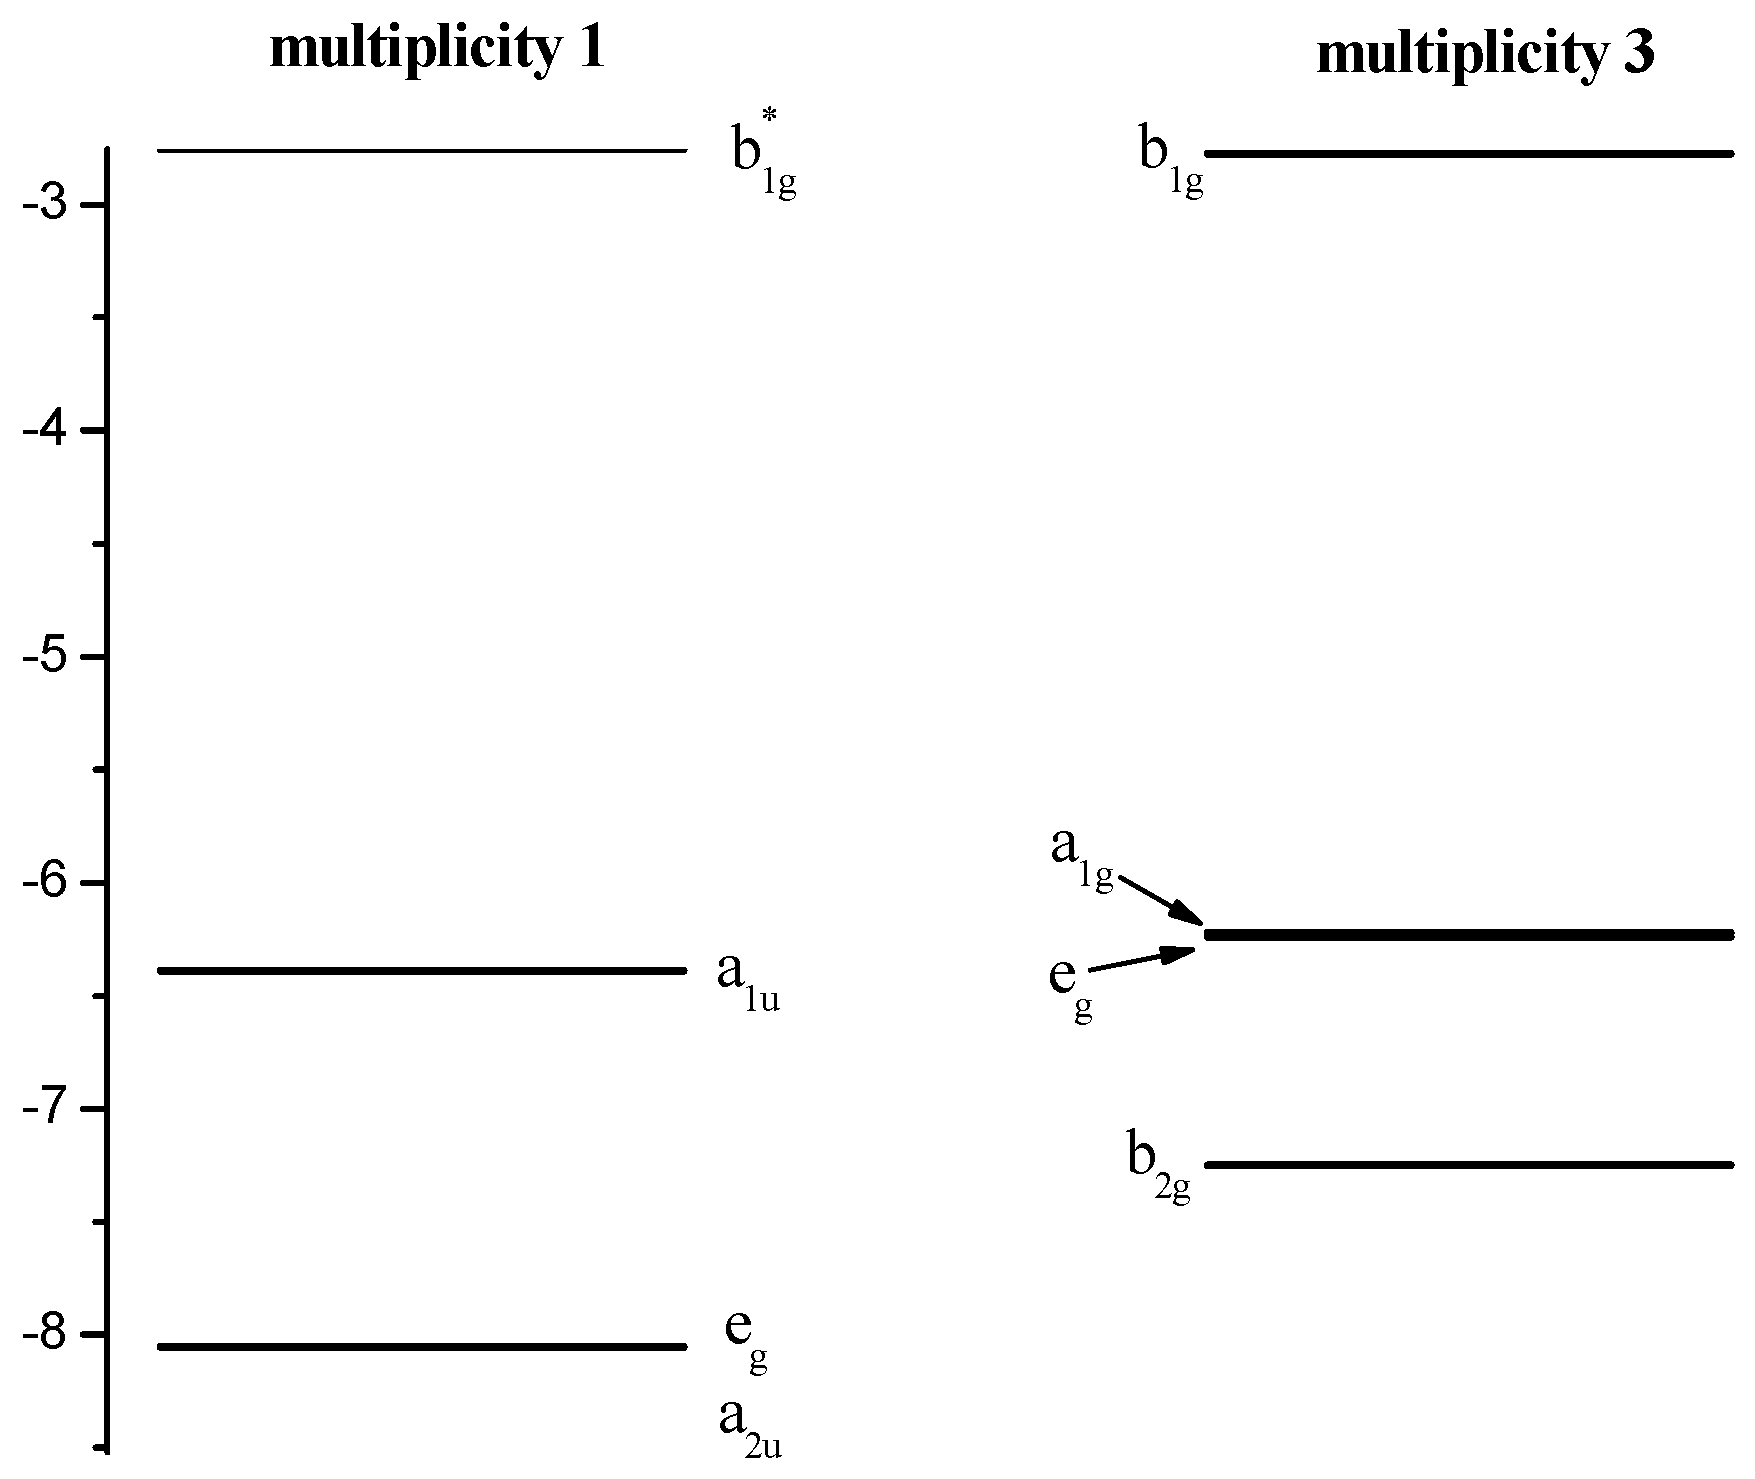
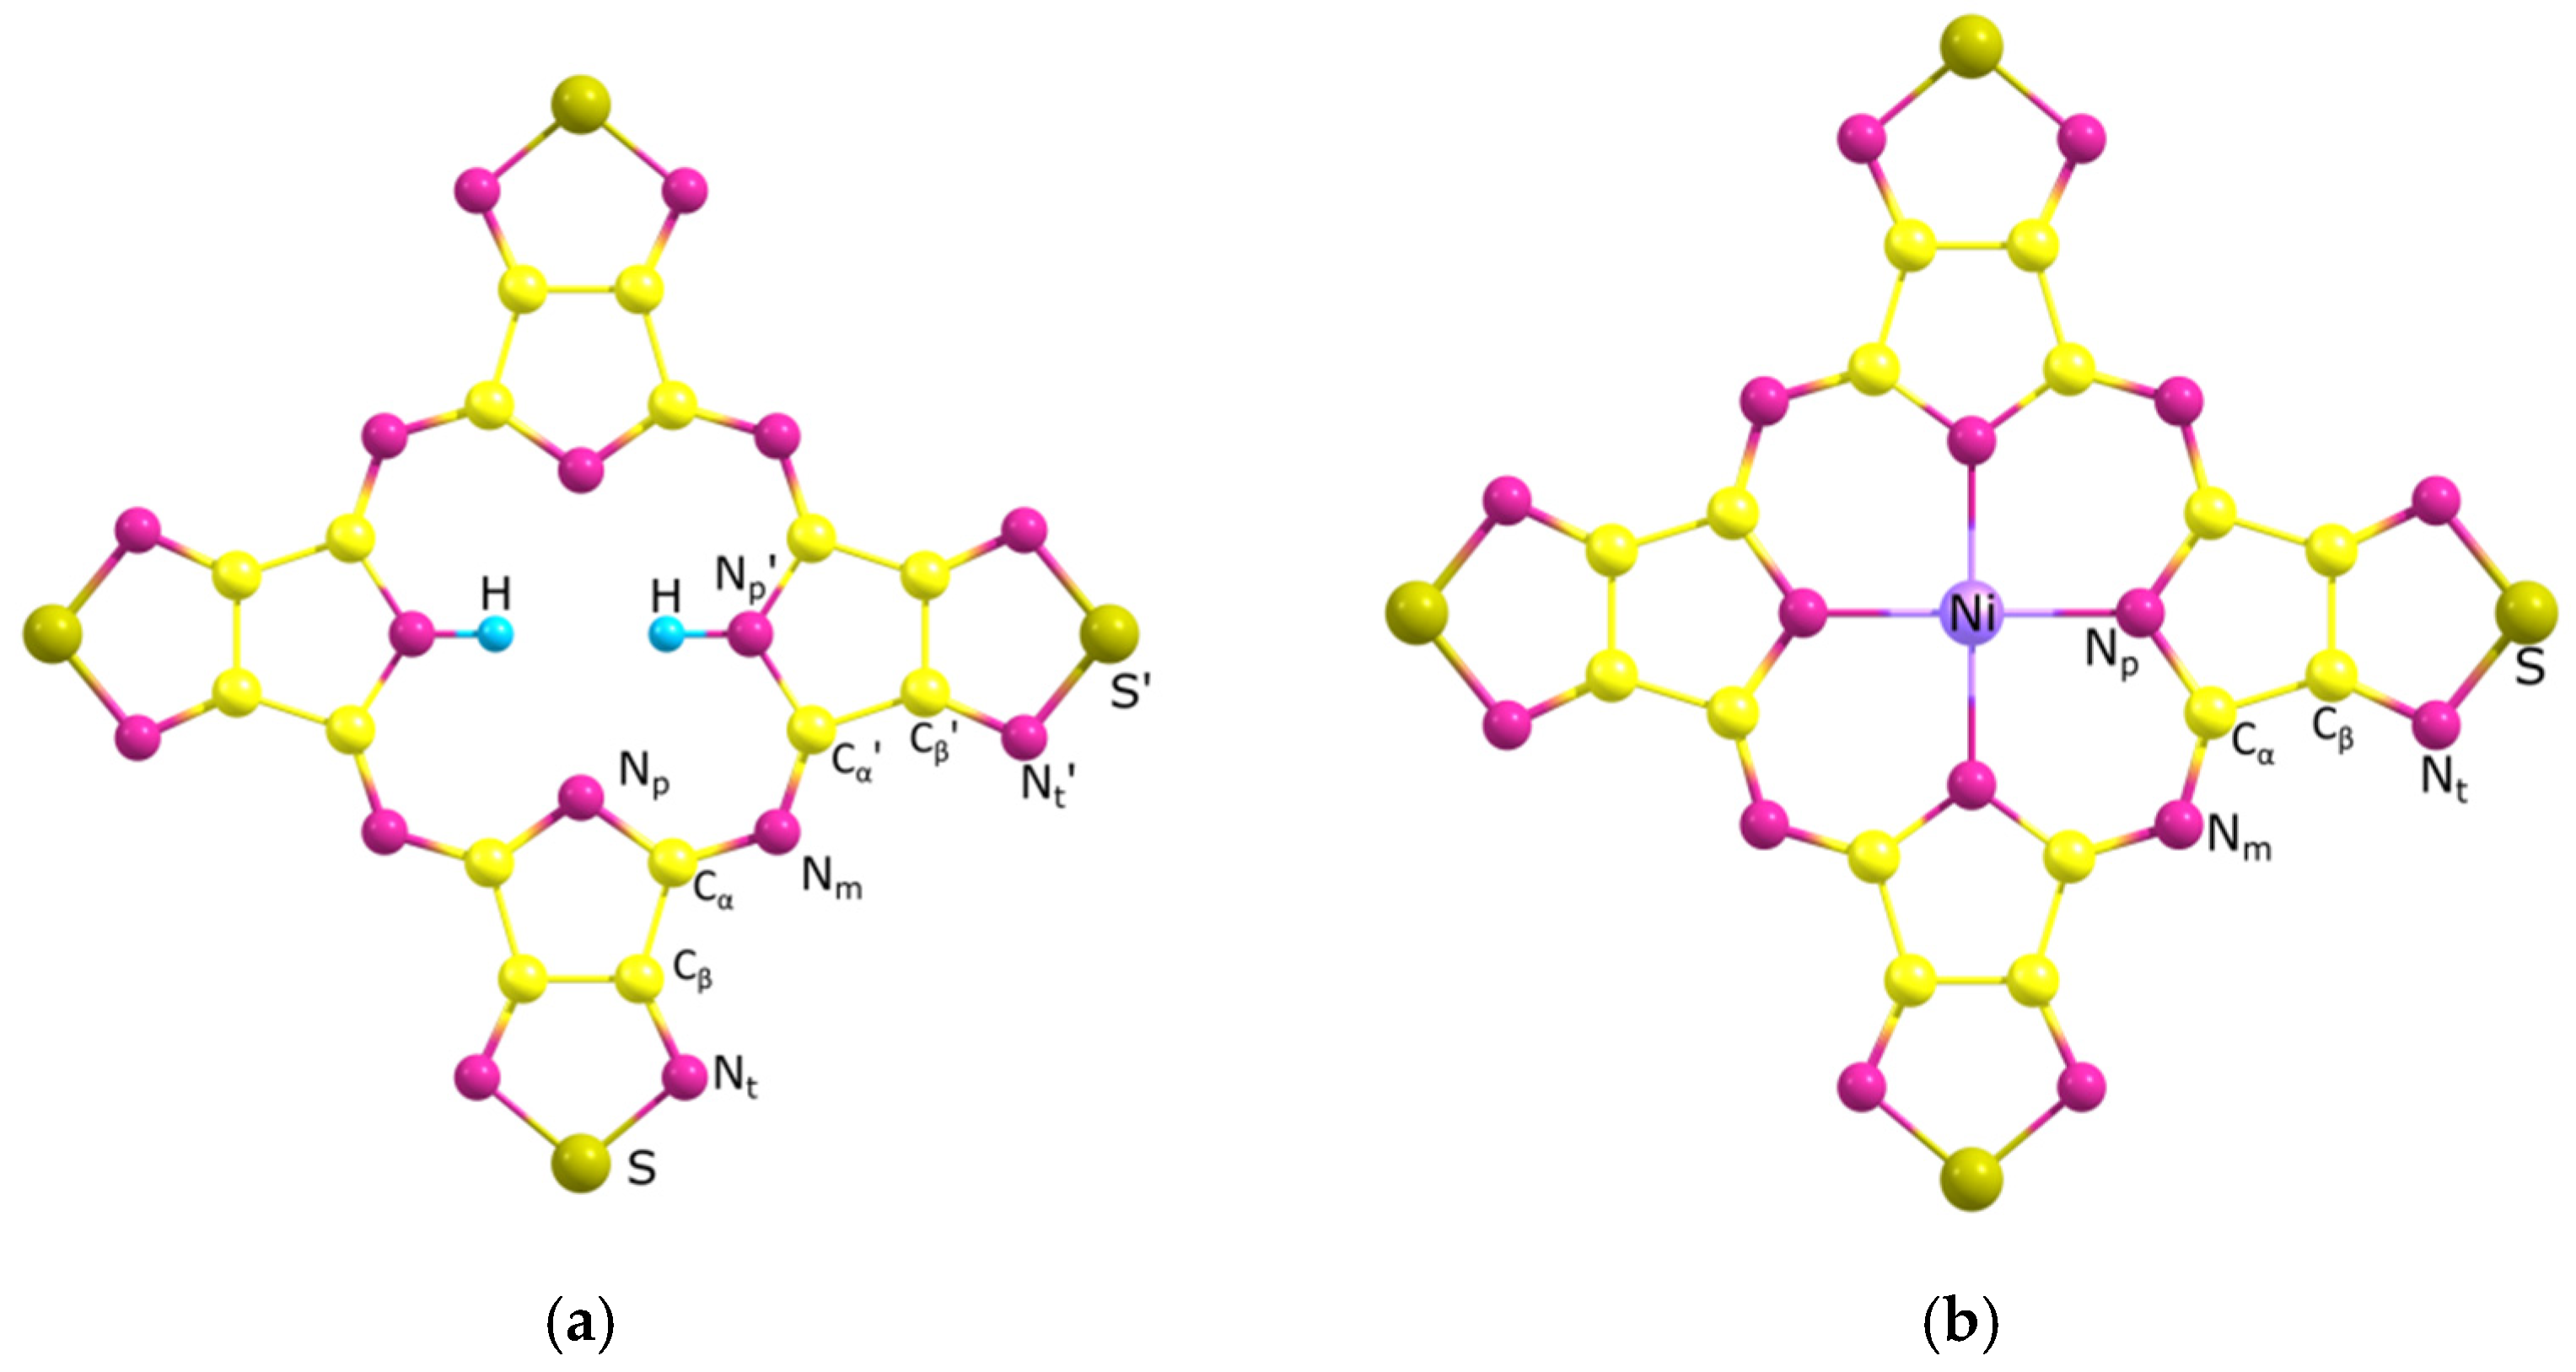
2.2. Molecular Structure

The electronic configuration of Ni(II) is [Ar]3d8, and therefore it can form in ground state as either singlet or triplet complexes. Furthermore, the computational investigations in the case of Ni(II) complexes are often non-trivial due to the necessity to account for the multireference character of the wavefunction.
The electronic structure of NiTTDPz has been studied by the CASSCF method followed by an account of the dynamic electron correlation by multiconfigurational quasi-degenerate second-order perturbation theory (MCQDPT2). The compositions of the wave functions are presented in Table 2 for the low-lying electronic states. According to data obtained by the MCQDPT2 method, the NiTTDPz complex possesses the ground states 1A1g. The low-lying triplet state is higher by 88.4 kJ mol−1 in energy than the corresponding ground state (Table 1). It should be noted that, according to CASSCF calculations, NiTTDPz possesses a triplet ground state. Such contradictory conclusions about the multiplicity of the ground state obtained using the CASSCF and MCQDPT2 methods are apparently due to the fact that the CASSCF calculations with a small active space do not practically take into account the dynamic correlation of electrons. An analysis of the data in Table 2 shows that the wave functions of the ground states and the most low-lying triplet states have the form of a single determinant. Therefore, for the D4h configuration in the electronic state 1A1g, the geometry optimization, calculations of the force field, and vibrational and electronic spectra have been performed using the PBE0/pcseg-2 approach.
In ref [23] it was shown that crystal field theory (CFT) can be used to describe the sequence of electronic states of MPz and MTTDPz (M=Fe, Co) complexes. However, in the case of the singlet state of nickel hemi-porphyrazine [34], it is impossible to describe the sequence of electronic states using the crystal field theory. In the framework of this theory, the most energetically favorable states are those with the least repulsion between the electrons occupying the d-shell of the metal and orbitals of the macrocycle. From this point of view, the occupation of the b2g, eg, and a1g MOs are the most favorable, but not b1g.
The crystal field theory (CFT, [35,36]) can be used to describe the sequence of NiTTDPz electronic states (Table 1) despite the fact that the shapes of two CASSCF active molecular orbitals (a2u and a1u, Figure 3) in the singlet NiTTDPz state comprise atoms of the macrocycle rather than the metal atom. This conclusion is confirmed by the fact that the b1g orbital is unoccupied in the ground state and this orbital has significantly greater energy than the other three orbitals (Figure 4).
Shapes of CASSCF active molecular orbitals (Figure 3) of triplet NiTTDPz state and their composition analysis show that the corresponding components of the d-orbitals of the metal atom make a dominant contribution. The orbitals of the macrocycle atoms are almost not involved in the formation of these molecular orbitals. The orbital of b1g symmetry is an exception, since according to Figure 3 the contribution of the macrocycle orbitals can be visually observed. It should be noted that no noticeable interaction of metal d-orbitals and macrocycle orbitals was found. Thus, the crystal field theory (CFT) can be used to describe the sequence of electronic states. A diagram of the energies of active in the CASSCF calculations molecular orbitals (Figure 4) confirms this conclusion.
According to DFT calculations the molecules under consideration have a planar structure with symmetry D2h and D4h for H2TTDPz and NiTTDPz, respectively (Figure 5). Note that the singlet and triplet states of the NiTTDPz molecule have significant differences in geometric structure (Table 3). In the case of triplet NiTTDPz, a significant (about 0.1 Å) increase in the (Np…Np)opp and, accordingly, in Np-M and (Np…Np)adj bond length (about 0.05 Å) distance is observed. When analyzing the data in Table 3, it can be noted that the smallest size of coordination cavity is observed for the NiTTDPz molecule in the singlet state, and the largest is for the H2TTDPz molecule. This confirms the conclusion of the influence of the metal on the size of the coordination cavity [23,27,32].

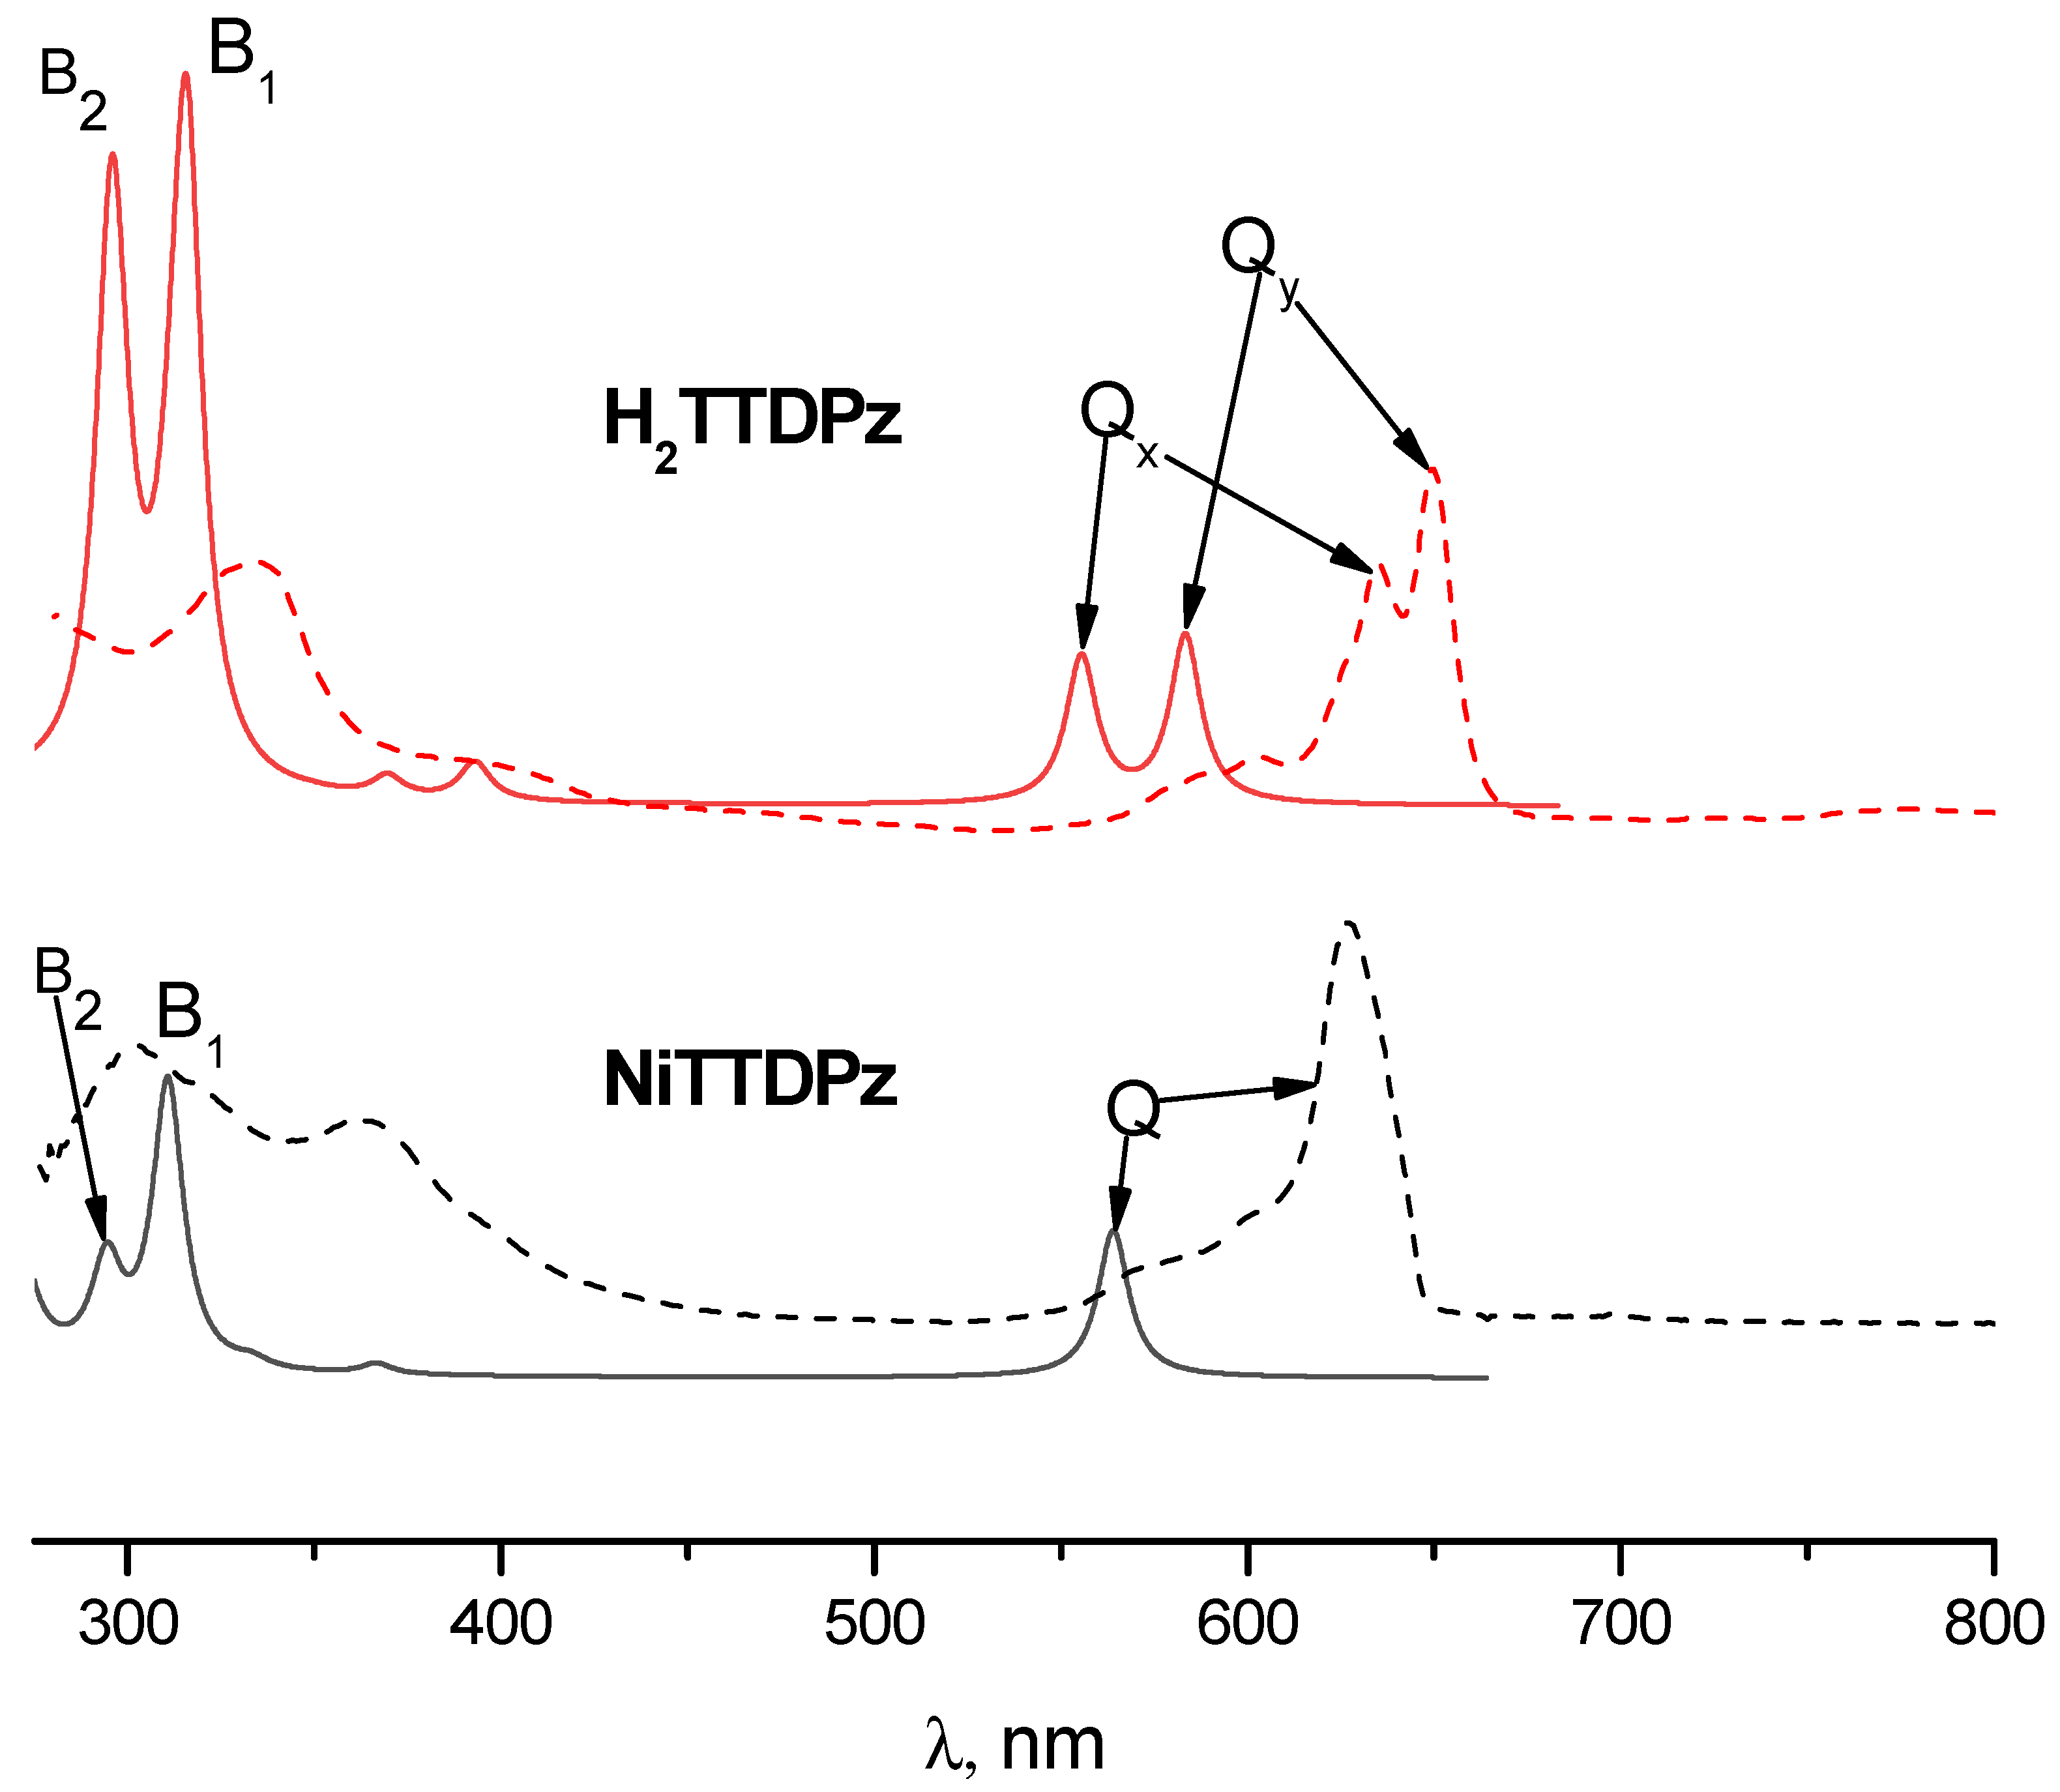
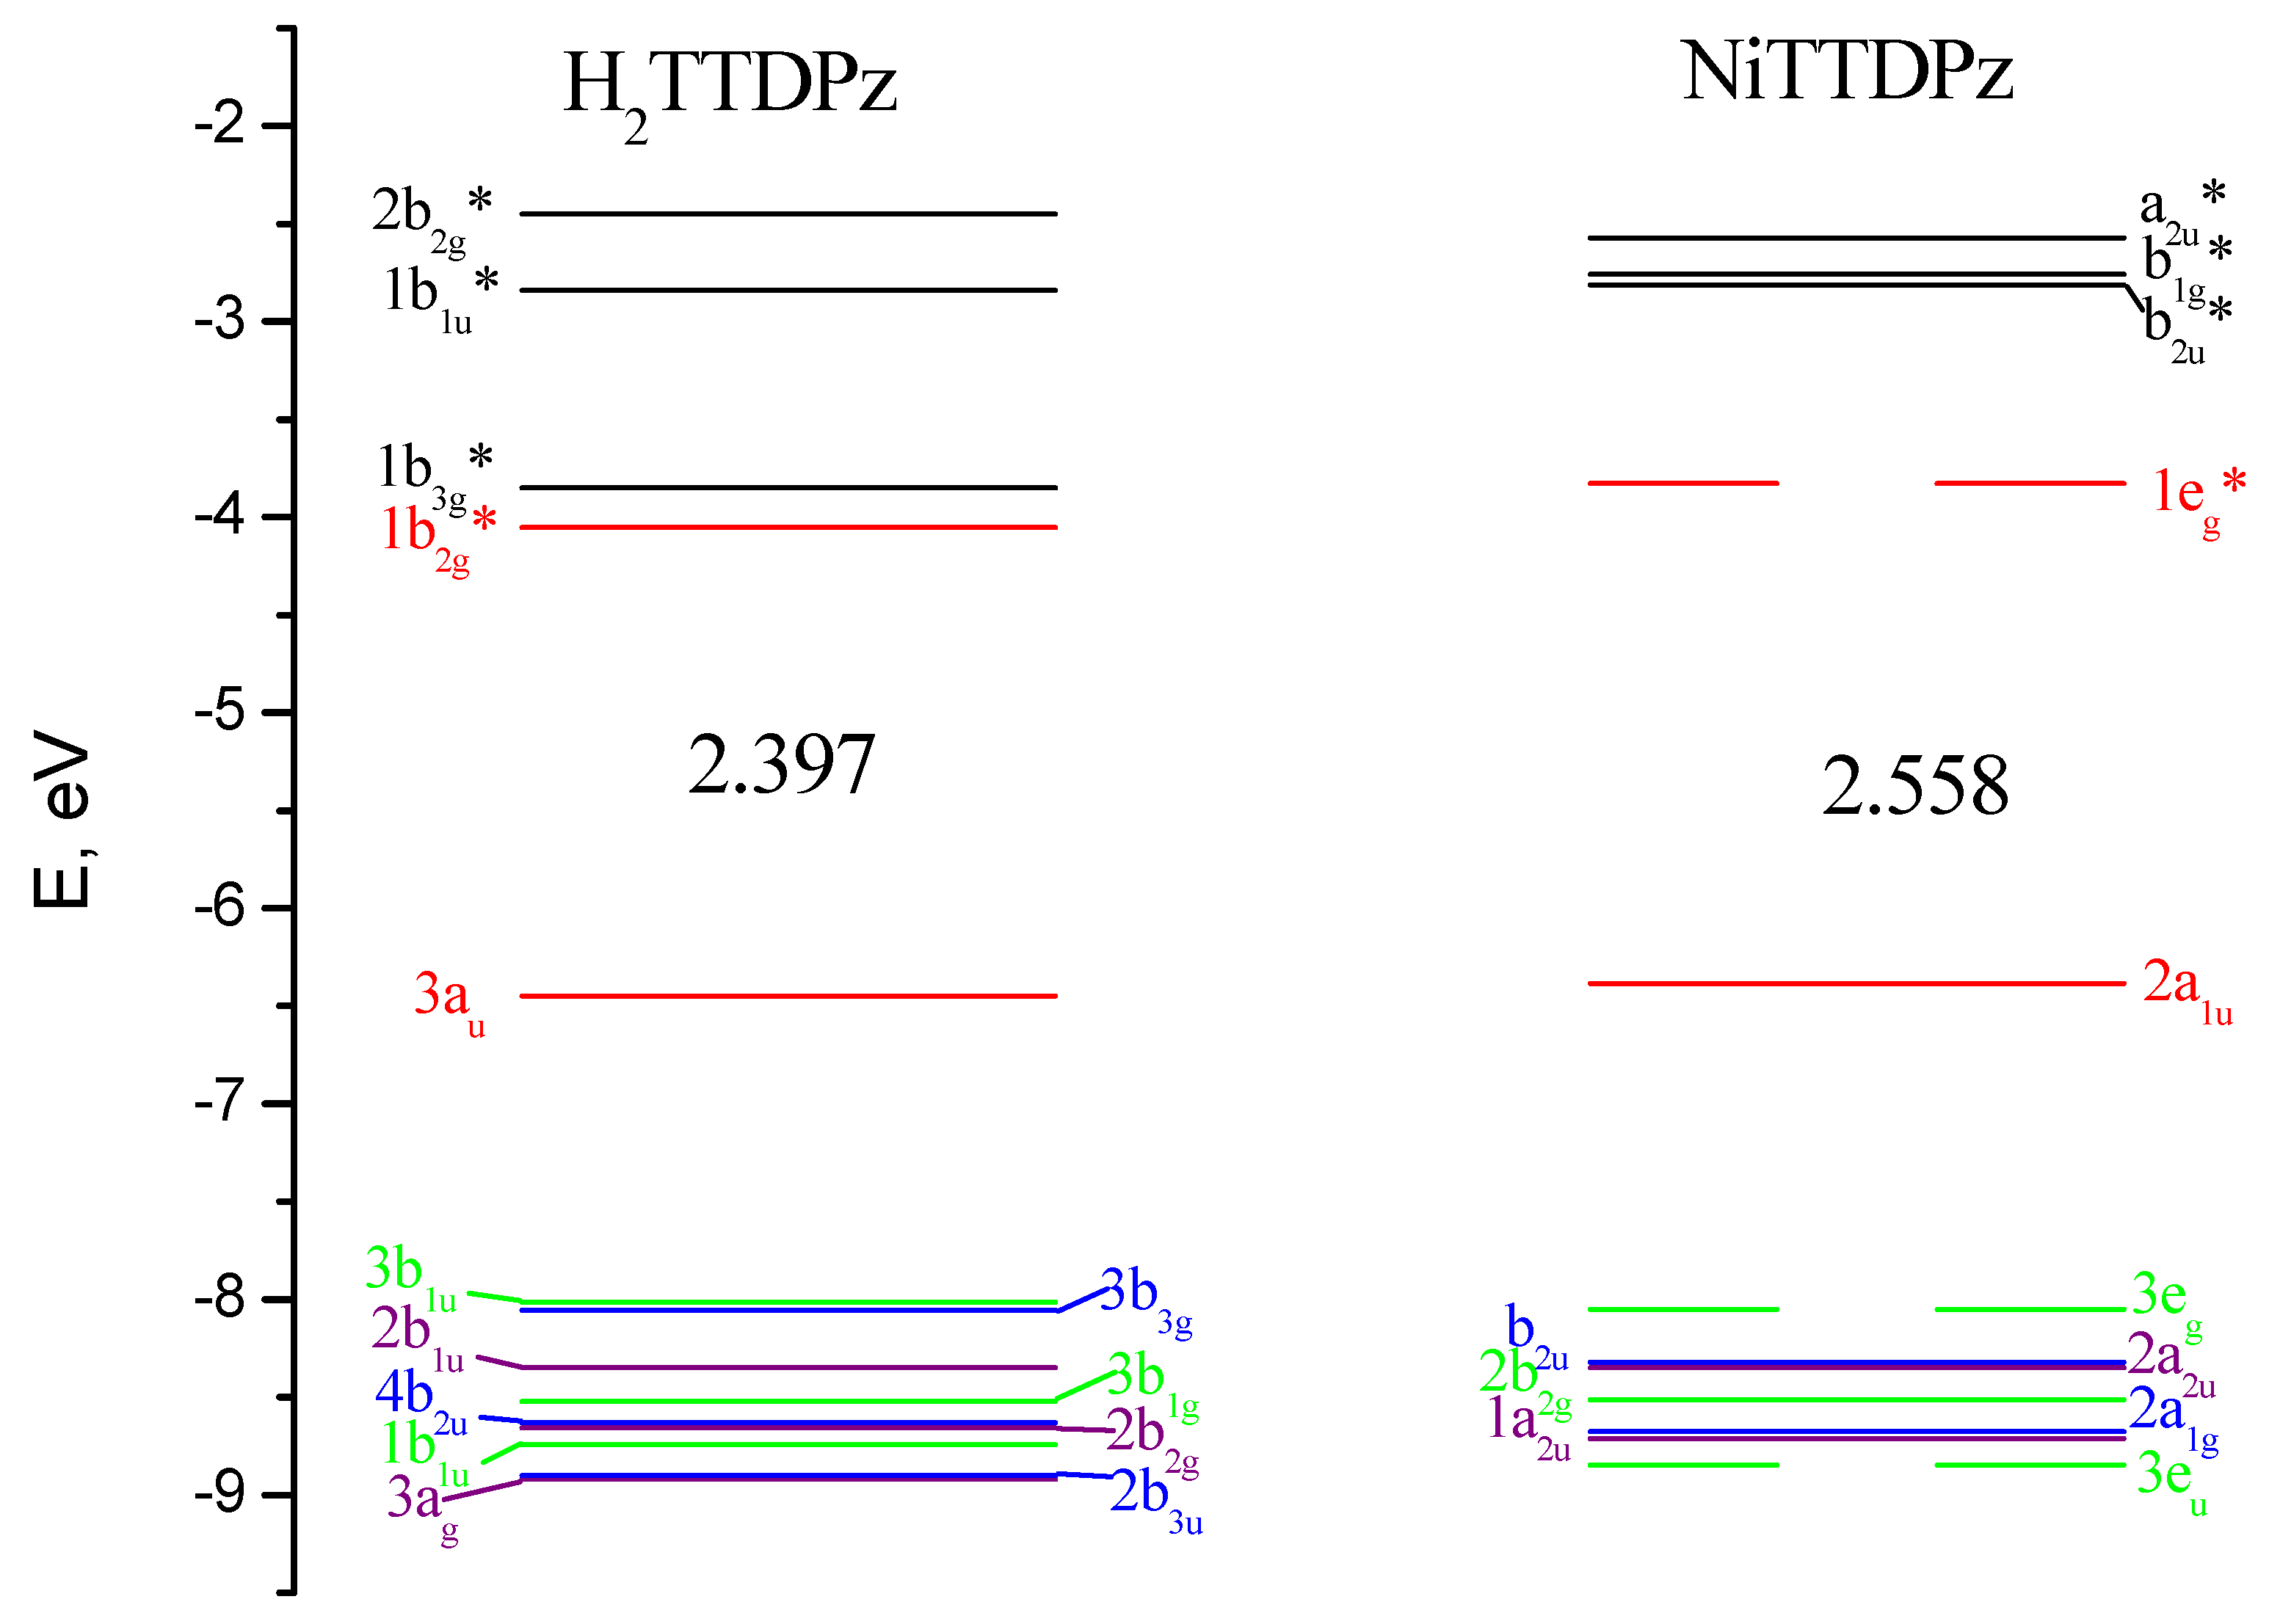
2.3. Electronic Absorption Spectra

Analyzing the electronic absorption spectra of molecules simulated by the TDDFT method, one can notice significant differences (Figure 6). The Q-band is located at about 564 nm in the spectrum of NiTTDPz, while in the spectrum of the H2TTDPz, splitting into two bands, Qy (584 nm) and Qx (554 nm), is observed. In addition to significant changes in the region of the Q-band, one can also observe a change in relative intensities in the region of the B-band (≈300–330 nm). It is clearly seen that the B2-band in the spectrum of NiTTDPz has a lower intensity in comparison with the B1-band. In the case of H2TTDPz, these bands are close in intensity. The obtained spectra of H2TTDPz and NiTTDPz can be described using the four-orbital model of Gouterman [37,38,39]; both spectra in general are quite typical for this class of compounds.
Interpretation of the electronic spectra was carried out on the basis of the results of TDDFT calculations. The calculated oscillator strengths (f) for the lowest excited states along with their composition (in terms of one-electron transitions) are given in Table 4 and Table 5 for H2TTDPz and NiTTDPz, respectively. Analysis of the data in Table 4 and Table 5 demonstrates that, in the case of the NiTTDPz complex, it can be seen that the Q-band corresponds to the transition between the frontier orbitals and the formation of the 11Eu state. The Qy and Qx bands in the H2TTDPz spectrum correspond to transitions from the ground state to the excited electronic states 11B2u and 11B3u, respectively. The 11B3u state is formed due to the HOMO-1→LUMO and HOMO→LUMO+1 transitions and the 11B2u state is formed due to the transition between the frontier orbitals. The excited states with a strong contribution to the electronic transition from the Gouterman type a2u (NiTTDPz) and b1u (H2TTDPz) orbitals, localized mainly on the inner nitrogen atoms of porphyrazine, have the highest intensity in the calculated spectra and are denoted as B band.
The shapes of molecular orbitals (MOs) that participate in electronic transitions with large oscillator strengths are shown in Figure 7 and the energy diagram of molecular orbitals for H2TTDPz and NiTTDPz is shown in the Figure 8. The symmetry of the frontier MOs in the NiTTDPz complex is also typical for metal complexes of porphyrazines and tetrakis(1,2,5-thiadiazolo)porphyzarines—a1u for HOMO and a pair of degenerate orbitals eg* for LUMO [26,27,32,40,41]. The shapes of HOMO orbitals for H2TTDPz and NiTTDPz are similar, despite different types of symmetry. The b2g* orbital (LUMO) of the H2TTDPz molecule is a linear combination of bonding orbitals along the Cα-Cβ and Nm-Cα bonds, as well as antibonding orbitals predominantly belonging to Nt atoms and pairs of Np and S atoms. In the case of NiTTDPz, the shape of the 1eg* orbital can be characterized in the same way, but the contribution of the d-orbital of the nickel atom is noticeable. In addition to the frontier orbitals, HOMO-3 (H2TTDPz), HOMO-4 (NiTTDPz), and HOMO-7 of both compounds are involved in a large number of electronic transitions. Analyzing the composition of the HOMO-3 and HOMO-4 orbitals of the corresponding molecules, one can note the fact that, despite different symmetry (b3u and a2u, respectively), these MOs are practically identical in composition and only slightly differ in the regions of the Np atoms.
The HOMO-LUMO gap is 2.40 eV for H2TTDPz and 2.56 eV for NiTTDPz, respectively. It should be noted that this value is typical for unsubstituted porphyrazines, but falls outside the range of previously studied thiadiazol annulated porphyrazines (2.24–2.29 eV for MTTDPz (M = Mg, Ca, Zn, Y, La, Lu) [26,27,32]).

2.4. Vibrational Spectra

Theoretical results were also used for interpretation of the experimental vibrational spectra of H2TTDPz and NiTTDPz. The IR and Raman spectra were simulated on the basis of the normal mode frequencies and band intensities, which have been calculated by the DFT (PBE0/pcseg-2) method in a harmonic approximation. Description of the main IR active vibrations is presented in Table 6. As can be seen from Figure 9, the simulated IR spectra have fairly good correspondence with the experimental spectra and theoretical data can be used for assignment of the most intense bands.
The IR spectrum of NiTTDPz contains fewer relatively intense peaks compared to H2TTDPz. The latter has bands with similar frequency values, but different intensities, which can be explained by its lower symmetry in contrast to NiTTDPz, where the vibrational transitions are degenerate. Thereby we can conclude that the metal introduction decreases the number of strong and medium-strong bands particularly in the 1000–1500 cm−1 region. Furthermore, these bands are mostly contributed by stretching vibrations in the case of NiTTDPz, while bending predominates in H2TTDPz.
The two most intensive bands, located for NiTTDPz in the 1100–1350 cm−1 region, correspond to skeletal vibrations of the macrocycle with a predominant contribution of the Np-Cα stretching vibrations. For H2TTDPz four intense bands are present in this region and have comparable contribution from the stretching vibrations of the Np-Cα and Cα-Cβ bonds in the pyrrole and pyrrolenine rings and in-plane deformation modes. With increasing frequency, a decrease of the out-of-plane vibrations contribution is observed. The ratio of stretching vibrations at the periphery also increases. One strong band is present for NiTTDPz and three less intense bands for H2TTDPz in the 1500–1650 cm−1 region. These bands make a considerable contribution to the stretching vibrations of the bridging Nm-Cα bonds, Cα-Cβ bonds in pyrrole rings and Cβ-Nt bonds in the fused heterocycle. The out-of-plane deformations of 1,2,5-thiadiazole rings appear as medium-strong bands at 500–550 cm−1. Calculations predict a medium peak of Np-H stretching at 3554 cm−1. In the experimental spectrum, this vibration is observed at lower frequencies 3291 cm−1, evidencing existence of strong intramolecular hydrogen bonding the center of macrocycle.
The resonance Raman spectra of NiTTDPz and H2TTDPz obtained on rotating KBr disks using various excitation wavelengths at 80 K are displayed in Figure 10 and Figure 11 along with the theoretical spectra representing Raman active vibrational modes. The description of the Raman vibrations is presented in Table 7. The calculated spectral patterns are in reasonable agreement with the experimental spectra, although the position of some bands varies by up to 100 cm−1. Nevertheless, the theoretical data on the contribution of the vibrations of different fragments of the macrocycle to the normal modes are quite useful in the assignment of the experimental spectra.
In the Raman spectra of NiTTDPz recording using excitation in the virtual state (λex = 1064 nm), two intense bands are observed at 1572 and 1182 cm−1. They are also dominant in the resonance Raman spectra recorded upon excitation at 454.5 and 647.2 nm, i.e., in the region of the absorption bands of the two lowest electronic ππ* transitions. These depolarized bands can be assigned to the non-totally symmetric B1g and B2g modes which are calculated at 1681 and 1242 cm−1 and involve skeletal vibrations of the central porphyrazine core with strong contribution from the Nm-Cα and Np-Cα bonds formed by meso- and pyrrolic nitrogen atoms, respectively. In the spectrum obtained using excitation between the Soret and Q bands (λex = 514.5 nm), along with these depolarized bands several additional bands are enhanced. The polarized bands at 708, 865 and 1266 cm−1 should originate from totally symmetric modes. Indeed, calculations predict A1g vibrations involving atoms constituting fused 1,2,5-thiadiazole rings at 735, 844 and 1413 cm−1. The appearance of the anomalously polarized band at 1534 cm−1 might indicate the enhancement of the A2g type vibration. Evidently, A1g and A2g vibrations are enhanced due to vibronic coupling with weak electronic transitions 21Eu and 31Eu (Table 5), which should be present near λex = 514.5 nm.
The metal free macrocycle H2TTDPz, due to the presence of two pyrrole and two pyrrolenine type fragments, has lower D2h symmetry and its resonance Raman spectra (see Figure 10) are richer than for NiTTDPz (D4h). It can be seen that intense vibrations of the macrocyclic skeleton appearing as single bands for NiTTDPz are split into two components in the experimental spectra of H2TTDPz (1572 → 1566 and 1555; 1534 → 1532 and 1517; 1182 → 1177 and 1158; 709 → 711 and 697 cm−1). The intensity ratio of the components is dependent on the excitation wavelength. When excitation is shifted from the Q- to Soret band region, the bands containing a considerable contribution from the vibrational modes of the fused 1,2,5-thiadiazole rings are enhanced. This is not surprising since the Q-band transition is mainly localized on the atoms of the central macrocyclic core, while molecules with strong participation from the fused heterocycles participate in the electronic transitions in the Soret band region. Another remarkable feature in the experimental spectra of H2TTDPz is high intensity of the bands at 1430–1440, 1334 and 563 cm−1, especially at the excitation at 454.5 nm.

3. Materials and Methods

3.1. Experimental Details

H2TTDPz was synthesized from the lithium(I) complex Li2TTDPz as described earlier [40]. NiTTDPz was prepared from H2TTDPz and nickel(II) acetate in DMSO at 100 °C following previously published methodology [42].
UV/Vis absorption spectra were recorded on a Cary 60 spectrometer. Resonance Raman spectra were recorded using Dilor XY multi-channel spectrometer and excitation by Ar+ and Kr+ lasers (Spectra Physics) for samples in KBr pellets at 80 K. FT Raman spectra were measured using IFX 66 CS/FRA 107 Bruker interferometer and excitation by NdYAG Atlas laser (Type 300, 1064 nm) at 10 K.
The sublimation of H2TTDPz and NiTTDPz has been investigated by Knudsen method using the MI-1201 commercial magnetic sector mass spectrometer adapted to thermodynamic studies and described in detail in [43,44]. The solid samples were sublimated from a stainless steel effusion cell. The ratio of the cross-sectional square of the cell to the square of the effusion orifice was about 1000, which made it possible to practically eliminate the violation of thermodynamic equilibrium due to the efflux of vapors from the effusion orifice in the experiments performed. The cell temperature was measured by a tungsten-rhenium thermocouple W-Re 5/20. The energy of ionizing electrons was 70 eV, accelerating voltage 5 kV, and cathode emission current Iemis of 0.5 mA.

3.2. Computational Details

The electronic structure of NiTTDPz has been studied by the CASSCF method followed by accounting for dynamic electron correlation by multiconfigurational quasi-degenerate second-order perturbation theory (MCQDPT2). Eight electrons in five molecular orbitals consisting mainly of the 3d orbitals of Ni atom were selected for the active space. The doubly occupied orbitals corresponding to the 1s orbitals of C, N, S, and Ni and the 2s and 2p orbitals of S and Ni were frozen in the MCQDPT2 calculations. The triple-zeta basis sets pcseg-2 [45] from the Basis Set Exchange database [46,47] were used in all calculations.
DFT/PBE0-based investigations of H2TTDPz and NiTTDPz included geometry optimizations followed by computations of harmonic vibrations and TDDFT calculations of the electronic absorption spectra. The number of the calculated excited states was 30. The applicability of PBE0 functional for first row transition metal systems was shown by Jensen et al. [48]. All calculations were performed using the Firefly QC package [49], which is partially based on the GAMESS (US) [50] source code. The molecular models and orbitals demonstrated in the paper were visualized by means of the Chemcraft program [51]. Optimized Cartesian coordinates of H2TTDPz and NiTTDPz are available in the Supplementary Materials.
Description of the vibrational modes is carried out based on the analysis of the distribution of the potential energy of normal vibrations by natural vibrational coordinates. This analysis was performed using the VibModule program [52].

4. Conclusions

Based on mass spectrometric investigations, it was established that NiTTDPz forms a stable stream of particles and enthalpy of sublimation was estimated using the Clausius—Clayperon equation. However, analysis of the mass spectrum showed that sublimation of H2TTDPz is accompanied by partial decomposition.
It has been found that H2TTDPz and NiTTDPz have a planar macrocycle structure of D2h and D4h symmetry, respectively. The complexes of nickel NiTTDPz possess the ground state 1A1g and the wave function has the form of a single determinant. It has been shown that for the studied complex NiTTDPz the crystal field theory (CFT) can be used to describe the sequences of the electronic states.
The effect of the introduction of the metal was studied on the basis of the results of TDDFT calculations. The electronic spectra of investigated molecules can be described by the four-orbital Gouterman model.
It has been shown that the theoretical data on the contribution of the vibrations of different fragments of the macrocycle to the normal modes are useful in the assignment of the experimental IR and Raman spectra.

Supplementary Materials

The following are available online, Figure S1: Structural formulas of porphyrazines and their derivatives, Cartesian coordinates of H2TTDPz optimized PBE0/pcseg-2 level of theory, Cartesian coordinates of singlet NiTTDPz optimized PBE0/pcseg-2 level of theory, Cartesian coordinates of triplet NiTTDPz optimized PBE0/pcseg-2 level of theory.

Author Contributions

Conceptualization, P.A.S., Y.A.Z.; Methodology, P.A.S., Y.A.Z.; Investigation, I.A.K., A.V.E., D.N.F.; Resources, Y.A.Z.; Data Curation, I.V.R., D.N.F.; Writing-Original Draft Preparation, I.V.R., A.V.E., P.A.S. All authors have read and agreed to the published version of the manuscript.

Funding

This work is supported by the Russian Science Foundation (grant No 19-73-00256).

Institutional Review Board Statement

Not applicable.

Informed Consent Statement

Not applicable.

Data Availability Statement

The data presented in this study are available on request from the corresponding author.

Acknowledgments

We are thankful to U. Cornelissen and H. Homborg (Christian-Albrechts University, Kiel, Germany) for their assistance in the resonance Raman measurements.

Conflicts of Interest

The authors declare no conflict of interest.

Sample Availability

Samples of the compounds H2TTDPz and NiTTDPz are available from the authors.

References

  1. Sun, S.-S.; Sariciftci, N.S. Organic Photovoltaics: Mechanisms, Materials, and Devices; CRC Press: Boca Raton, FL, USA, 2017; ISBN 9781420026351. [Google Scholar]
  2. Kippelen, B.; Brédas, J.L. Organic photovoltaics. Energy Environ. Sci. 2009, 2, 251–261. [Google Scholar] [CrossRef]
  3. Mazzio, K.A.; Luscombe, C.K. The future of organic photovoltaics. Chem. Soc. Rev. 2015, 44, 78–90. [Google Scholar] [CrossRef] [PubMed]
  4. Kruk, N.N. Nonlinear optical properties of tetrapyrrole compounds and prospects for their application (a review). J. Appl. Spectrosc. 2008, 75, 461–482. [Google Scholar] [CrossRef]
  5. De la Torre, G.; Vázquez, P.; Agulló-López, F.; Torres, T. Role of structural factors in the nonlinear optical properties of phthalocyanines and related compounds. Chem. Rev. 2004, 104, 3723–3750. [Google Scholar] [CrossRef]
  6. Drobizhev, M.; Makarov, N.S.; Rebane, A.; De La Torre, G.; Torres, T. Strong two-photon absorption in Push—Pull phthalocyanines: Role of resonance enhancement and permanent dipole moment change upon excitation. J. Phys. Chem. C 2008, 112, 848–859. [Google Scholar] [CrossRef]
  7. Senge, M.O.; Fazekas, M.; Notaras, E.G.A.; Blau, W.J.; Zawadzka, M.; Locos, O.B.; Ni Mhuircheartaigh, E.M. Nonlinear Optical Properties of Porphyrins. Adv. Mater. 2007, 19, 2737–2774. [Google Scholar] [CrossRef]
  8. McEwan, K.; Lewis, K.; Yang, G.-Y.; Chng, L.-L.; Lee, Y.-W.; Lau, W.-P.; Lai, K.-S. Synthesis, Characterization, and Nonlinear Optical Study of Metalloporphyrins. Adv. Funct. Mater. 2003, 13, 863–867. [Google Scholar] [CrossRef]
  9. Marder, S.R. Organic nonlinear optical materials: Where we have been and where we are going. Chem. Commun. 2006, 2, 131–134. [Google Scholar] [CrossRef]
  10. Liu, F.; Qin, G.; Li, Z.; Wang, Z.; Peng, M.; Wu, S.; Li, C.; Yang, Y. The design and synthesis of nonlinear optical chromophores containing two short chromophores for an enhanced electro-optic activity †. Cite this Mater. Adv. 2021, 2, 728. [Google Scholar]
  11. Linstead, R.P.; Whalley, M. Conjugated macrocylces. Part XXII. Tetrazaporphin and its metallic derivatives. J. Chem. Soc. 1952, 4839–4846. [Google Scholar] [CrossRef]
  12. Donzello, M.P.; Ercolani, C.; Novakova, V.; Zimcik, P.; Stuzhin, P.A. Tetrapyrazinoporphyrazines and their metal derivatives. Part I: Synthesis and basic structural information. Coord. Chem. Rev. 2016, 309, 107–179. [Google Scholar] [CrossRef]
  13. Novakova, V.; Donzello, M.P.; Ercolani, C.; Zimcik, P.; Stuzhin, P.A. Tetrapyrazinoporphyrazines and their metal derivatives. Part II: Electronic structure, electrochemical, spectral, photophysical and other application related properties. Coord. Chem. Rev. 2018, 361, 1–73. [Google Scholar] [CrossRef]
  14. Donzello, M.P.; Ercolani, C.; Stuzhin, P.A. Novel families of phthalocyanine-like macrocycles-Porphyrazines with annulated strongly electron-withdrawing 1,2,5-thia/selenodiazole rings. Coord. Chem. Rev. 2006, 250, 1530–1561. [Google Scholar] [CrossRef]
  15. Suzuki, Y.; Fujimori, M.; Yoshikawa, H.; Awaga, K. Packing motifs and magneto-structural correlations in crystal structures of metallo-tetrakis(1,2,5-thiadiazole)porphyrazine series, MTTDPz (M=H 2, Fe, Co, Ni, Cu, Zn). Chem. A Eur. J. 2004, 10, 5158–5164. [Google Scholar] [CrossRef] [PubMed]
  16. Koifman, O.I.; Ageeva, T.A.; Beletskaya, I.P.; Averin, A.D.; Yakushev, A.A.; Tomilova, L.G.; Dubinina, T.V.; Tsivadze, A.Y.; Gorbunova, Y.G.; Martynov, A.G.; et al. Macroheterocyclic Compounds—A Key Building Block in New Functional Materials and Molecular Devices. Macroheterocycles 2020, 13, 311–467. [Google Scholar] [CrossRef]
  17. Stuzhin, P.A.; Mikhailov, M.S.; Yurina, E.S.; Bazanov, M.I.; Koifman, O.I.; Pakhomov, G.L.; Travkin, V.V.; Sinelshchikova, A.A. First tellurium-containing phthalocyanine analogues: Strong effect of tellurium on spectral, redox and conductivity properties of porphyrazines with annulated chalcogenodiazole ring(s). Chem. Commun. 2012, 48, 10135–10137. [Google Scholar] [CrossRef] [Green Version]
  18. Miyoshi, Y.; Kubo, M.; Fujinawa, T.; Suzuki, Y.; Yoshikawa, H.; Awaga, K. Electrochromism and stable n-type doping of highly oriented thin films of tetrakis(thiadiazole)porphyrazine. Angew. Chemie Int. Ed. 2007, 46, 5532–5536. [Google Scholar] [CrossRef] [PubMed]
  19. Fujimoto, T.; Miyoshi, Y.; Matsushita, M.M.; Awaga, K. A complementary organic inverter of porphyrazine thin films: Low-voltage operation using ionic liquid gate dielectrics. Chem. Commun. 2011, 47, 5837–5839. [Google Scholar] [CrossRef]
  20. Miyoshi, Y.; Fujimoto, T.; Yoshikawa, H.; Matsushita, M.M.; Awaga, K.; Yamada, T.; Ito, H. Photoconductivity and FET performance of an n-type porphyrazine semiconductor, tetrakis(thiadiazole)porphyrazine. Org. Electron. 2011, 12, 239–243. [Google Scholar] [CrossRef]
  21. Miyoshi, Y.; Takahashi, K.; Fujimoto, T.; Yoshikawa, H.; Matsushita, M.M.; Ouchi, Y.; Kepenekian, M.; Robert, V.; Donzello, M.P.; Ercolani, C.; et al. Crystal structure, spin polarization, solid-state electrochemistry, and high n-type carrier mobility of a paramagnetic semiconductor: Vanadyl tetrakis(thiadiazole)porphyrazine. Inorg. Chem. 2012, 51, 456–462. [Google Scholar] [CrossRef]
  22. Stuzhin, P.; Mikhailov, M.; Travkin, V.; Gudkov, E.; Pakhomov, G. Multilayer Photovoltaic Structures Based on Tetrathiadiazoloporphyrazine/ Subphthalocyanine Heterojunction. Macroheterocycles 2012, 5, 162–165. [Google Scholar] [CrossRef] [Green Version]
  23. Zhabanov, Y.A.; Sliznev, V.V.; Ryzhov, I.V.; Stuzhin, P.A. Peculiarities of electronic structure and chemical bonding in iron and cobalt metal complexes of porphyrazine and tetra(1,2,5-thiadiazole)porphyrazine. J. Porphyr. Phthalocyanines 2020, 24, 1154–1164. [Google Scholar] [CrossRef]
  24. Donzello, M.P.; Ercolani, C.; Kadish, K.M.; Ricciardi, G.; Rosa, A.; Stuzhin, P.A. Tetrakis(thiadiazole)porphyrazines. 5. Electrochemical and DFT/TDDFT studies of the free-base macrocycle and its MgII ZnII, and CuII complexes. Inorg. Chem. 2007, 46, 4145–4157. [Google Scholar] [CrossRef] [PubMed]
  25. Zhang, X.; Liu, Z.; Sheng, N.; Jiang, J. Molecular structure, electronic structure and vibrational spectra of metal-free, N,N′-dideuterio, and magnesium tetrakis(thiadiazole)porphyrazines: Density functional calculations. J. Mol. Struct. THEOCHEM 2005, 755, 179–186. [Google Scholar] [CrossRef]
  26. Zhabanov, Y.A.; Tverdova, N.V.; Giricheva, N.I.; Girichev, G.V.; Stuzhin, P.A. DFT Study of molecular and electronic structure of magnesium (II) tetra(1,2,5-chalcogenadiazolo) porphyrazines, [TXDPzMg] (X = O, S, Se, Te). J. Porphyr. Phthalocyanines 2017, 21, 439–452. [Google Scholar] [CrossRef]
  27. Otlyotov, A.A.; Ryzhov, I.V.; Kuzmin, I.A.; Zhabanov, Y.A.; Mikhailov, M.S.; Stuzhin, P.A. DFT Study of Molecular and Electronic Structure of Ca(II) and Zn(II) Complexes with Porphyrazine and tetrakis(1,2,5-thiadiazole)porphyrazine. Int. J. Mol. Sci. 2020, 21, 2923. [Google Scholar] [CrossRef]
  28. Cai, X.; Zhang, Y.; Zhang, X.; Jiang, J. Structures and properties of metal-free and copper tetrakis(thiadiazole) porphyrazine and metal-free tetrakis(selenodiazole) porphyrazine based on density functional theory calculations. J. Mol. Struct. THEOCHEM 2007, 812, 63–70. [Google Scholar] [CrossRef]
  29. Tverdova, N.V.; Giricheva, N.I.; Savelyev, D.S.; Mikhailov, M.S.; Vogt, N.; Koifman, O.I.; Stuzhin, P.A.; Girichev, G.V. Molecular structure of tetrakis(1,2,5-thiadiazolo)- porphyrazinatozinc(II) in gaseous phase. Macroheterocycles 2017, 10, 27–30. [Google Scholar] [CrossRef] [Green Version]
  30. Strenalyuk, T.; Samdal, S.; Volden, H.V. Molecular structures of chloro(phthalocyaninato)-aluminum(III) and -gallium(III) as determined by gas electron diffraction and quantum chemical calculations: Quantum chemical calculations on fluoro(phthalocyaninato)-aluminum(III) and -gallium(III), chloro(tetrakis(1,2,5-thiadiazole) porphyrazinato)-aluminum(III) and -gallium(III) and comparison with their X-ray structures. J. Phys. Chem. A 2008, 112, 9075–9082. [Google Scholar]
  31. Tarakanova, E.N.; Hamdoush, M.; Eroshin, A.V.; Ryzhov, I.V.; Zhabanov, Y.A.; Stuzhin, P.A. Tetra(1,2,5-thiadiazolo)porphyrazines. 10. Synthesis, spectral characterization and DFT study of complexes with yttrium(III) and lutetium(III). Polyhedron 2021, 193, 114877. [Google Scholar] [CrossRef]
  32. Zhabanov, Y.A.; Ryzhov, I.V.; Kuzmin, I.A.; Eroshin, A.V.; Stuzhin, P.A. DFT Study of Molecular and Electronic Structure of Y, La and Lu Complexes with Porphyrazine and Tetrakis(1,2,5-thiadiazole)porphyrazine. Molecules 2020, 26, 113. [Google Scholar] [CrossRef]
  33. Hochmuth, D.H.; Michel, S.L.J.; White, A.J.P.; Williams, D.J.; Barrett, A.G.M.; Hoffman, B.M. Ci Symmetric and Non-Centrosymmetric Crystalline Complexes of [60]Fullerene with Octakis(dimethylamino)porphyrazinato-Copper(II) and -Nickel(II). Eur. J. Inorg. Chem. 2000, 2000, 593–596. [Google Scholar] [CrossRef]
  34. Eroshin, A.V.; Otlyotov, A.A.; Zhabanov, Y.A.; Veretennikov, V.V.; Islyaikin, M.K. Complexes of Ca(II), Ni(II) and Zn(II) with hemi- and dicarbahemiporphyrazines: Molecular structure and features of metal-ligand bonding. Macroheterocycles 2021. [Google Scholar] [CrossRef]
  35. Bethe, H. Termaufspaltung in Kristallen. Ann. Phys. 1929, 395, 133–208. [Google Scholar] [CrossRef]
  36. Van Vleck, J.H. Theory of the variations in paramagnetic anisotropy among different salts of the iron group. Phys. Rev. 1932, 41, 208–215. [Google Scholar] [CrossRef]
  37. Gouterman, M. Spectra of porphyrins. J. Mol. Spectrosc. 1961, 6, 138–163. [Google Scholar] [CrossRef]
  38. Gouterman, M.; Wagnière, G.H.; Snyder, L.C. Spectra of porphyrins. Part II. Four orbital model. J. Mol. Spectrosc. 1963, 11, 108–127. [Google Scholar] [CrossRef]
  39. Weiss, C.; Kobayashi, H.; Gouterman, M. Spectra of porphyrins. Part III. Self-consistent molecular orbital calculations of porphyrin and related ring systems. J. Mol. Spectrosc. 1965, 16, 415–450. [Google Scholar] [CrossRef]
  40. Stuzhin, P.A.; Ivanova, S.S.; Hamdoush, M.; Kirakosyan, G.A.; Kiselev, A.; Popov, A.; Sliznev, V.; Ercolani, C. Tetrakis(1,2,5-thiadiazolo)porphyrazines. 9. Synthesis and spectral and theoretical studies of the lithium(i) complex and its unusual behaviour in aprotic solvents in the presence of acids. Dalt. Trans. 2019, 48, 14049–14061. [Google Scholar] [CrossRef]
  41. Zhabanov, Y.A.; Zakharov, A.V.; Giricheva, N.I.; Shlykov, S.A.; Koifman, O.I.; Girichev, G. V To the limit of gas-phase electron diffraction: Molecular structure of magnesium octa(m-trifluoromethylphenyl)porphyrazine. J. Mol. Struct. 2015, 1092, 104–112. [Google Scholar] [CrossRef]
  42. Bauer, E.M.; Cardarilli, D.; Ercolani, C.; Stuzhin, P.A.; Russo, U. Tetrakis(thiadiazole)porphyrazines. 2. Metal complexes with Mn(II), Fe(II), Co(II), Ni(II), and Zn(II). Inorg. Chem. 1999, 38, 6114–6120. [Google Scholar] [CrossRef]
  43. Pelipets, O.V. The Thermodynamics of Evaporation of ErCl3, EuBr and EuCl2, and the Molecular Species Structure: High Temperature Mass Spectrometry and Gas-Phase Electron Diffraction (in Russian); Ivanovo State University: Ivanovo, Russia, 2000. [Google Scholar]
  44. Tyunina, V.V.; Krasnov, A.V.; Badelin, V.G.; Girichev, G.V. Enthalpy of sublimation of hydroxyl-containing amino acids: Knudsen’s effusion mass spectrometric study. J. Chem. Thermodyn. 2016, 98, 62–70. [Google Scholar] [CrossRef]
  45. Jensen, F. Unifying general and segmented contracted basis sets. segmented polarization consistent basis sets. J. Chem. Theory Comput. 2014, 10, 1074–1085. [Google Scholar] [CrossRef] [PubMed]
  46. Pritchard, B.P.; Altarawy, D.; Didier, B.; Gibson, T.D.; Windus, T.L. New Basis Set Exchange: An Open, Up-to-Date Resource for the Molecular Sciences Community. J. Chem. Inf. Model. 2019. [Google Scholar] [CrossRef] [PubMed]
  47. Schuchardt, K.L.; Didier, B.T.; Elsethagen, T.; Sun, L.; Gurumoorthi, V.; Chase, J.; Li, J.; Windus, T.L. Basis set exchange: A community database for computational sciences. J. Chem. Inf. Model. 2007, 47, 1045–1052. [Google Scholar] [CrossRef] [Green Version]
  48. Jensen, K.P.; Roos, B.O.; Ryde, U. Performance of density functionals for first row transition metal systems. J. Chem. Phys. 2007, 126, 014103. [Google Scholar] [CrossRef]
  49. Granovsky, A.A. Firefly version 8. Available online: http://classic.chem.msu.su/gran/firefly/index.html (accessed on 15 April 2021).
  50. Schmidt, M.W.; Baldridge, K.K.; Boatz, J.A.; Elbert, S.T.; Gordon, M.S.; Jensen, J.H.; Koseki, S.; Matsunaga, N.; Nguyen, K.A.; Su, S.; et al. General atomic and molecular electronic structure system. J. Comput. Chem. 1993, 14, 1347–1363. [Google Scholar] [CrossRef]
  51. Zhurko, G.A.; Zhurko, D.A. ChemCraft Version 1.6 (Build 312); Version 1.6 (Build 312) Ed. Available online: http://www.chemcraftprog.com/index.html (accessed on 28 December 2020).
  52. Vishnevskiy, Y.V.; Zhabanov, Y.A. New implementation of the first-order perturbation theory for calculation of interatomic vibrational amplitudes and corrections in gas electron diffraction. J. Phys. Conf. Ser. 2015, 633, 12076. [Google Scholar] [CrossRef]
Figure 1. Mass spectrum of H2TTDPz recorded at 690 K.
Molecules 26 02945 g001
Figure 2. Dependence of the molecular ion intensity logarithm of NiTTDPz on temperature.
Molecules 26 02945 g002
Figure 3. Shapes of active CASSCF molecular orbitals of NiTTDPz.
Molecules 26 02945 g003
Figure 4. Diagram of the active energies in the CASSCF calculations of the molecular orbitals of NiTTDPz.
Molecules 26 02945 g004
Figure 5. Models of H2TTDPz (a) and NiTTDPz (b) molecules with atom labeling.
Molecules 26 02945 g005
Figure 6. Calculated TDDFT electronic absorption spectra for H2TTDPz and NiTTDPz molecules (solid lines) and the corresponding experimental spectra in DMSO solutions (dashed lines).
Molecules 26 02945 g006
Figure 7. Shapes of molecular orbitals that participate in electronic transitions with large oscillator strengths.
Molecules 26 02945 g007aMolecules 26 02945 g007b
Figure 8. Molecular orbital (MO) level diagram for H2TTDPz and NiTTDPz molecules. The values of highest occupied molecular orbital–lowest unoccupied molecular orbital (HOMO–LUMO) gaps are given in eV.
Molecules 26 02945 g008
Figure 9. Comparison of the experimental (black lines) and simulated (red lines) IR spectra of H2TTDPz (A) and NiTTDPz (B).
Molecules 26 02945 g009
Figure 10. Resonance Raman spectra of H2TTDPz at different excitations (454.5, 514.5, 568.4, 647.1) and the theoretical spectrum representing Raman active vibrational modes.
Molecules 26 02945 g010
Figure 11. Resonance Raman spectra of NiTTDPz at different excitations (454.5, 514,5, 568.4, 647.1 and 1064 nm) and the theoretical spectrum representing Raman active vibrational modes. Polarized spectra are shown for 514.5 nm.
Molecules 26 02945 g011
Table 1. Relative abundance of ions from H2TTDPz at 690 K.
Ionm/zIntensity, %
H2TTDPz+54611
C4N4S+13638
C2N2S+84100
S2+6432
C2N2+5225
Table 2. The relative energies (kJ/mol) of exited states and contributions (in %) of electronic configurations to the wave functions from MCQDPT2 calculations.
StateContributionsΔE, kJ/mol
1A1g96/(a2u)2(a1u)2(eg)4(b1g)0/0.0
1Eg99/(a2u)2(a1u)2(eg)3(b1g)1/263.0
1Eu97/(a2u)2(a1u)2(eg)2(b1g)2/578.1
1A1g97/(a2u)2(a1u)2(eg)2(b1g)2/581.5
1Eu96/(a2u)2(a1u)2(eg)2(b1g)2/737.2
3B1g100/(b2g)2(eg)4(a1g)1(b1g)1/82.3
3Eg93/(b2g)2(eg)3(a1g)2(b1g)1/92.6
3A2g30/(b2g)2(eg)2(a1g)2(b1g)2/+70/(b2g)1(eg)4(a1g)2(b1g)1/174.8
3Eg32/(b2g)1(eg)3(a1g)2(b1g)2/+47/(b2g)1(eg)3(a1g)2(b1g)2/+16/(b2g)2(eg)3(a1g)1(b1g)2/331.0
3B2g100/(b2g)1(eg)4(a1g)1(b1g)2/338.5
Table 3. Internuclear distances (r, in Å) and valence angles (∠, in deg.) of H2TTDPz and NiTTDPz.
H2TTDPz
PBE0/Pcseg-2
NiTTDPz (1A1g)
PBE0/Pcseg-2
NiTTDPz (3B1g)
PBE0/Pcseg-2
H2TTDPz [15]
X-ray *
NiTTDPz [15]
X-ray *
Np-M/Np’-M2.233/1.0111.9271.9762.281/0.8911.922
Np-Cα/Np’-Cα1.359/1.3751.3741.3641.371/1.3821.385
Cα-Nm/Cα’-Nm1.320/1.3011.3031.3131.331/1.3111.313
Cα-Cβ/Cα’-Cβ1.459/1.4471.4461.4641.464/1.4451.449
Cβ-Cβ/Cβ’-Cβ1.408/1.4161.4011.4071.400/1.4081.396
Cβ-Nt/Cβ’-Nt1.313/1.3171.3171.3101.326/1.3291.326
Nt-S/Nt’-S’1.631/1.6221.6261.6341.646/1.6311.640
(Np…Np)/(Np’…Np’)3.958/4.0923.8543.9523.952/4.0623.844
(Np…Np’)2.8472.7252.7942.8372.718
∠ (MNp’Cα)122.7125.7124.9122.8125.9
∠ (NpCαNm)/(Np’Cα’Nm)128.2/128.8128.4128.2128.1/129.8128.7
∠ (CαNmCα’)125.0122.0123.8123.5120.7
∠ (CαNpCα)/(Cα’NpCα’)109.3/114.7108.7110.2108.7/113.6108.1
∠ (NtSNt)/(Nt’S’Nt’)100.7/101.3101.1100.4100.5/101.3100.6
* X-ray crystallographic data for H2TTDPz and α—NiTTDPz. Because of distortion of the structure in the crystals, the parameters presented in the table are average values.
Table 4. Calculated composition of the lowest excited states and corresponding oscillator strengths for H2TTDPz molecule.
StateComposition (%)λ (nm)fExp λ (nm)
11B2u 3 a u 1 b 2 g * ( 91 ) 5830.32650
11B3u 2 b 1 u 1 b 2 g * ( 7 )
3 a u 1 b 3 g * ( 87 )
5560.28635
21B3u 3 b 1 u 1 b 2 g * ( 90 ) 3930.07
41B3u 1 b 1 u 1 b 2 g * ( 12 )
2 b 1 u 1 b 2 g * ( 65 )
3 a u 1 b 3 g * ( 7 )
3 a u 2 b 3 g * ( 7 )
3161.21335
41B2u 1 b 1 u 1 b 3 g * ( 56 )
2 b 1 u 1 b 3 g * ( 41 )
3120.18
51B3u 1 b 1 u 1 b 2 g * ( 84 )
2 b 1 u 1 b 2 g * ( 7 )
2980.15
51B2u 1 b 1 u 1 b 3 g * ( 37 )
2 b 1 u 1 b 3 g * ( 42 )
3 a u 1 b 2 g * ( 5 )
3 a u 2 b 2 g * ( 6 )
2961.03
81B2u 1 a u 1 b 2 g * ( 10 )
2 a u 1 b 2 g * ( 29 )
2 b 3 g 2 b 1 u * ( 32 )
3 b 1 u 2 b 3 g * ( 27 )
2420.57
81B3u 1 a u 1 b 3 g * ( 14 )
2 a u 1 b 3 g * ( 15 )
1 b 1 u 2 b 2 g * ( 7 )
2 b 2 g 1 b 1 u * ( 61 )
2370.31
91B3u 1 b 1 u 2 b 2 g * ( 5 )
2 b 2 g 1 b 1 u * ( 6 )
2 b 1 u 2 b 2 g * ( 7 )
2340.11
111B3u 1 a u 1 b 3 g * ( 13 )
1 b 1 u 2 b 2 g * ( 41 )
2 b 2 g 1 b 1 u * ( 18 )
2 b 2 g 2 b 1 u * ( 28 )
2150.08
Table 5. Calculated composition of the lowest excited states and corresponding oscillator strengths for NiTTDPz molecule.
StateComposition (%)λ (nm)fExp λ (nm)
11Eu 2 a 1 u 1 e g * (93)5640.28627
21Eu 2 a 1 u 2 e g * (94)3670.02
31Eu 1 a 2 u 1 e g * (7)
b 2 u 1 e g * (86)
3330.02
41Eu 1 a 2 u 1 e g * (8)
2 a 2 u 1 e g * (78)
b 2 u 1 e g * (8)
3110.55362
51Eu 1 a 2 u 1 e g * (76)
2 a 2 u 1 e g * (8)
2940.19
61Eu 3 e g b 2 u * (97)2690.31
71Eu b 1 u 1 e g * (6)
3 e g a 2 u * (89)
2570.26
81Eu b 1 u 1 e g * (5)
3 e u b 1 g * (88)
2440.07
91Eu b 1 u 1 e g * (83)
3 e u b 1 g * (7)
3 e g a 2 u * (7)
2400.34
101Eu 1 a 1 u 1 e g * (16)
b 2 u 1 e g * (69)
2310.05
131Eu 1 a 1 u 1 e g * (13)
2 e g b 2 u * (11)
1 a 2 u 2 e g * (48)
2 a 2 u 2 e g * (10)
b 2 u 2 e g * (5)
3 e g b 1 u * (10)
2170.07
Table 6. Assignment of the IR vibrations of the H2TTDPz and NiTTDPz molecules.
Frequency, cm−1Irel, %SymmetryAssignment *Exp, cm−1
H2TTDPz
535 (ω34)12B3uOPB (Nt-Cα-Cβ-Cβ) (23), θ (Cβ-Nt-S-Nt) (36)518
607 (ω44)14B2ur(Cα-Cβ) (17), r(Nt-S) (11), φ(Cβ-Nt-S) (18), φ(Nt-S-Nt) (19)587
686 (ω44)29B1uφ(Np-Cα-Cβ) (7), φ(Cα-Np’-Cα) (6), φ(Nm-Cα-Cβ) (10), φ(Cα-Cβ-Cβ) (8), φ(Cβ-Cβ-Nt) (8), φ(Cβ-Nt-S) (6)666
687 (ω45)22B2uφ(Cα-Np-Cα) (6), φ(Np-Cα-Cβ) (10), φ(Np’-Cα-Cβ) (8), φ(Nm-Cα-Cβ) (11), φ(Cα-Cβ-Cβ) (10), φ(Cβ-Cβ-Nt) (8), φ(Cβ-Nt-S) (6)666
785 (ω54)10B2ur(Nt-S) (5), φ(Np-Cα-Nm) (5), φ(Np’-Cα-Nm) (13), φ(Cα-Np’-H) (10),φ(Cα-Nm-Cα) (12), φ(Nm-Cα-Cβ) (11),753
817 (ω59)24B3uOPB (H-Cα-Cα-Np’) (24), OPB (Cβ-Np-Nm-Cα) (11),θ (Cα-H-Np-Cα-Nm-Cβ) (24), θ (Cα-Nm-Cα-Np-Cβ) (8), θ (Cα-Nm-Cα-Np’-Cβ) (8)817
1083 (ω75)100B1ur(Np-Cα) (13), r(Nm-Cα) (12), r(Cα-Cβ) (8), φ(Np-Cα-Cβ) (8), φ(Nm-Cα-Cβ) (8), φ(Cα-Cβ-Cβ) (8), φ(Cβ-Cβ-Nt) (6)1019
1171 (ω78)87B2ur(Np’-Cα) (9), r(Nm-Cα) (6), r(Cα-Cβ) (7), φ(Cα-Np’-H) (14), φ(Np’-Cα-Nm) (5), φ(Nm-Cα-Cβ) (8), φ(Cα-Nm-Cα) (6), φ(Cβ-Cβ-Nt) (7), φ(Cβ-Nt-S) (6)1133
1264 (ω81)42B2ur(Np-Cα) (5), r(Np’-Cα) (6), φ(Cα-Np-Cα) (6), φ(Np-Cα-Nm) (8), φ(Cα-Np’-H) (26)1217
1310 (ω85)56B1ur(Np’-Cα) (5), r(Cα-Cβ) (7), r(Cβ-Cβ) (5), φ(Np’-Cα-Nm) (7), φ(Np-Cα-Nm) (7), φ(Cα-Cβ-Nt) (9)1263
1348 (ω86)19B2ur(Np-Cα) (9), φ(Cα-Np-Cα) (5), φ(Np-Cα-Nm) (11), φ(Cα-Np’-H) (28), φ(Nm-Cα-Cβ) (9), φ(Cα-Nm-Cα) (7)1288
1381 (ω88)14B2ur(Cα-Cβ) (7), r(Cβ-Cβ) (7), φ(Cα-Np’-H) (15), φ(Cα-Cβ-Nt) (9), φ(Cβ-Cβ-Nt) (7), φ(Cβ-Nt-S) (6)1340
1577 (ω98)9B1ur(Np-Cα) (5), r(Nm-Cα) (53), r(Cα-Cβ) (9), r(Cβ-Nt) (12)1506
1611 (ω103)12B1ur(Nm-Cα) (5), r(Cα-Cβ) (15), r(Cβ-Nt) (13), φ(Cα-Cβ-Cβ) (14), (Cβ-Cβ-Nt) (14)1532
1637 (ω104)7B2ur(Nm-Cα) (34), r(Cα-Cβ) (23), r(Cβ-Nt) (16), φ(Cα-Np’-H) (6)1566
3554 (ω107)45B1ur(Np’-H) (69), r(Np’-Cα) (5), φ(Cα-Np’-Cα) (6), φ(Cα-Np’-H) (6), φ(Cα-Np’-Nm) (6), φ(Np’-Cα-Cβ) (6)3291
NiTTDPz
533 (ω35)7A2uθ (Nm-Cα-Cβ-Nt) (29), θ (Cβ-Nt-S-Nt) (22), θ(Cα-Nm-Cα-Np-Cβ) (32)511
711 (ω46–ω47)33Eur(Np-Ni) (10), r(Nm-Cα) (12), r(Cα-Cβ) (5), φ(Cα-Np-Cα) (7), φ(Np-Cα-Cβ) (14), φ(Nm-Cα-Cβ) (11), φ(Cα-Cβ-Cβ) (6), φ(Cβ-Cβ-Nt) (6), φ(Cβ-Nt-S) (7)689
788 (ω55)3A2uθ(Cα-Nm-Cα-Np-Cβ) (43), θ (Nm-Cα-Cβ-Nt) (45)741
818 (ω59–ω60)2Eur(Nt-S) (44), φ(Cα-Nm-Cα) (7), φ(Np-Cα-Nm) (8), φ(Np-Cα-Cβ) (8), φ(Nt-S-Nt) (5)763
843 (ω62–ω63)11Eur(Nt-S) (75), φ(Cβ-Cβ-Nt) (5), φ(Cβ-Nt-S) (10)827
921 (ω71–ω72)8Eur(Np-Ni) (5), r(Cβ-Nt) (5), r(Nt-S) (12), φ(Cα-Nm-Cα) (12), φ(Np-Cα-Nm) (8), φ(Nm-Cα-Cβ) (11), φ(Cα-Cβ-Nt) (8), φ(Cβ-Cβ-Nt) (6), φ(Cβ-Nt-S) (9)895
1161 (ω77–ω78)100Eur(Np-Cα) (41), r(Nm-Cα) (14), r(Cα-Cβ) (14), r(Cβ-Nt) (6)1108/1109
1325(ω84–ω85)83Eur(Np-Cα) (25), r(Np-Ni) (5), r(Cα-Cβ) (5), r(Cβ-Cβ) (6), r(Cβ-Nt) (17), φ(Cα-Np-Cα) (6), φ(Np-Cα-Nm) (9), φ(Np-Cα-Cβ) (6)1269
1396 (ω86–ω87)11Eur(Np-Cα) (12), r(Nm-Cα) (15), r(Cα-Cβ) (27), r(Cβ-Cβ) (20)1347
1629 (ω102–ω103)20Eur(Nm-Cα) (33), r(Cα-Cβ) (25), r(Cβ-Nt) (20)1552
* Coordinates are listed provided that their contributions (shown in parentheses) are greater than ~10%. Assignment of vibrational modes based on potential energy distribution. The following designations of the coordinates are used: r—stretching of the bond; φ—bending, a change in the angle; OPB—out-of-plane bending; θ—a change in the dihedral angle.
Table 7. Assignment of the Raman vibrations of the H2TTDPz and NiTTDPz molecules.
Frequency, cm−1Irel, %SymmetryAssignment *Exp, cm−1
H2TTDPz
223 (ω15)5Agr (Nm-Cα) (14), r (Cα-Cβ) (25), φ (Cα-Nm-Cα) (23)223
518 (ω27)5B3gr (Nm-Cα) (10), r(Cβ-Nt) (7), r (Nt-S) (9), φ (Np-Cα-Cβ) (9), φ (Cα-Cβ-Cβ) (24), φ (Cα-Cβ-Nt) (13)576/504
714 (ω47)10Agr (Np-Cα) (12), r (Nm-Cα) (12), φ (Cα-Nm-Cα) (31)697
733 (ω49)10Agr (Nm-Cα) (11), φ (Cα-Np-Cα) (23), φ (Np-Cα-Cβ) (24), φ (Nm-Cα-Cβ) (14)711
855 (ω67)6Agr (Cα-Cβ) (8), r(Cβ-Nt) (9), r(Nt-S) (17), φ(Cβ-Nt-S) (21), φ(Nt-S-Nt) (9)823
1239 (ω80)33B3gr (Np-Cα) (49), r (Cα-Cβ) (18)1177/1158
1293 (ω83)3Agr (Np-Cα) (19), r(Cβ-Cβ) (18), r(Cβ-Nt) (11), φ (Cα-Np-Cα) (10), (Np-Cα-Nm) (10)1254/1237
1400 (ω90)34Agr (Cα-Cβ) (22), r(Cβ-Cβ) (42)1336
1495 (ω93)21Agr (Cα-Cβ) (19), r(Cβ-Nt) (60)1429/1443
1595 (ω99)12Agr (Nm-Cα) (44), r (Cα-Cβ) (30), r(Cβ-Nt) (10)1532
1657 (ω106)100Agr (Nm-Cα) (85)1555
NiTTDPz
253 (ω17)7A1gr (Np-Ni) (30), r (Nm-Cα) (7), r (Cα-Cβ) (26), φ (Cα-Nm-Cα) (12)
735 (ω50)10A1gr (Np-Cα) (7), r (Nm-Cα) (6), r (Nt-S) (9), φ (Cα-Nm-Cα) (20), φ (Np-Cα-Nt) (8), φ(Cβ-Nt-S) (17), φ(Nt-S-Nt) (20)709
755 (ω51)11B1gr (Np-Ni) (13), r (Nm-Cα) (9), r (Cα-Cβ) (6), (Cα-Np-Cα) (20), φ (Np-Cα-Cβ) (9), φ (Nm-Cα-Cβ) (20)800
844 (ω65)13A1gr (Nt-S) (76), φ(Cβ-Nt-S) (10),), φ(Cβ-Cβ-Nt) (5)865
1068 (ω74)4A2gr (Np-Cα) (18), r (Nm-Cα) (34), r(Cβ-Nt) (6), φ (Cα -Nm-Cα) (6), φ(Cβ-Cβ-Nt) (6), φ(Cβ-Nt-S) (7), φ(Np-Ni-Np) (5)1024
1242 (ω81)27B2gr (Np-Cα) (41), r (Cα-Cβ) (26), r (Cβ-Nt) (10)1182
1413 (ω88)16A1gr (Np-Cα) (19), r (Nm-Cα) (13), r (Cα-Cβ) (10), r(Cβ-Cβ) (28)1266
1435 (ω89)48B1gr (Cα-Cβ) (29), r(Cβ-Cβ) (40), φ(Cα-Cβ-Nt) (9), φ(Cβ-Nt-S) (7)1248
1501 (ω92)15B1gr (Cα-Cβ) (17), r(Cβ-Cβ) (9), r (Cβ-Nt) (63)1353
1536 (ω94)7B2gr (Np-Cα) (11), r (Nm-Cα) (41), r(Cβ-Nt) (21), φ(Np-Cα-Cβ) (8)1362
1609 (ω100)1A2gr (Nm-Cα) (71), r (Cα-Cβ) (16), r(Cβ-Nt) (5)1534
1634 (ω104)10A1gr (Nm-Cα) (43), r (Cα-Cβ) (30), r(Cβ-Nt) (6)
1681 (ω105)100B1gr (Nm-Cα) (84)1572
* Coordinates are listed provided that their contributions (shown in parentheses) are greater than ~10%. Assignment of vibrational modes based on potential energy distribution. The following designations of the coordinates are used: r—stretching of the bond; φ—bending, a change in the angle; θ—a change in the dihedral angle.
Publisher’s Note: MDPI stays neutral with regard to jurisdictional claims in published maps and institutional affiliations.

