Abstract
Percolation describes the formation of a giant cluster once the average degree of a network exceeds a critical value. A hybrid percolation transition (HPT) denotes a phenomenon in which a discontinuous jump of the order parameter and the critical behavior, a basic pattern of a continuous transition, appear together at the same threshold. Such HPTs have been reported in many different systems. In this review, we present several representative examples of HPTs and classify them into two categories: global suppression-induced HPTs and cascading failure-induced HPTs. In the former class, critical behavior manifests itself in the distribution of cluster sizes, whereas in the latter it emerges in the distribution of avalanche sizes. We further outline the universal scaling relations shared by both types.
1. Introduction: Hybrid Percolation Transition
Percolation originally refers to the phenomenon in which a fluid penetrates a porous material and forms a path between its two opposite sides [1]. The percolation concept was applied to various natural and social phenomena, such as gelation in polymers [2,3,4], the spread of disease [5], the conductor-insulator transition [6,7], the resilience of systems [8,9], and the formation of public opinion [10,11]. To theoretically understand this phenomenon, one considers a network in which links are occupied according to a prescribed rule and analyzes the formation of clusters [12]. A percolation transition (PT) refers to the emergence of a giant cluster that contains a finite fraction of nodes with system size N when the mean degree z of a network exceeds a threshold . The order parameter is , defined as the fraction of nodes belonging to the largest cluster. The continuous PT (CPT) exhibits with criticality at , where is the critical exponent of the order parameter [13,14]. In discontinuous PT (DPT), jumps to at without exhibiting the critical behavior of a CPT.
Hybrid percolation transitions (HPT), sometimes referred to as mixed-order percolation transitions, describe the situation in which the features of CPT and DPT occur simultaneously at the same transition point . Consequently, the order parameter behaves as
where and r are constants independent of z, and is the critical exponent of the order parameter. Following the discontinuous jump of m at , critical behavior analogous to that of a CPT appears and is described by
where is the distribution of finite clusters of size s or finite avalanches of size s, and and are critical exponents associated with the size distribution [15,16].
In this review, we highlight two types of HPTs: global-suppression-induced HPTs and cascading-failure-induced HPTs. For the first type of HPTs, critical behavior is observed in the cluster-size distribution, as discussed in Section 2. For the second type, critical behavior appears in the avalanche size distribution in interdependent networks and in k-core percolation, as discussed in Section 3.
2. Global-Suppression-Induced Hybrid Percolation Transition
In a random network or lattice, links are added one at a time, and a cluster is defined as a group of nodes that can reach each other via these links. In explosive percolation (EP) models, the formation of large clusters is hindered by choosing, at each step, an optimal link from a set of candidate links. When the number of candidate links is finite [17,18,19,20,21,22,23,24,25,26], the model shows a CPT. In contrast, for an infinite number of candidate links, it exhibits either a DPT or a hybrid percolation transition (HPT) [27,28,29,30,31,32,33]. In this work, suppression based on an infinite pool of candidate links is referred to as global suppression.
We summarize two models, the half-restricted model (HR) [29] and the Bohman-Frieze-Wormald model (BFW) [34], which exhibit an HPT driven by global suppression. The criticality observed at arises from a tug-of-war type of competition between two sets for in the first model [35], and from the duration for which the cluster of a given node persists before merging with another cluster in the second model [36].
2.1. Half-Restricted Model
The original HR model was proposed in [29] to generate a DPT in an EP model with global suppression. In this study, we investigate a modified HR model constructed to make the HPT more distinctly visible, following the analytical considerations of [33]. We consider a network composed of N nodes, controlled by an external parameter . The network is initially empty (no links), and at each time step exactly one link is added, so that a total of links are eventually introduced. To establish each link, we select one node uniformly at random from the entire set of nodes, and the other node from a restricted subset R, defined as follows. All clusters in the network are ordered by nondecreasing size, so that for all , where denotes the size of . The restricted node set R consists of all nodes that belong to the smallest clusters , where k is chosen such that , and is the greatest integer not exceeding . In other words, R contains approximately a fraction g of the nodes, all of which are in the smallest clusters. In this modified version, R includes every node in the marginal cluster , whereas in the original HR model only a subset of nodes from is taken so that the total size of R is exactly . A schematic illustration of the division into the two sets R and is provided in Figure 1a.
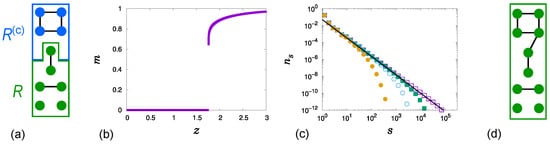
Figure 1.
(a) An illustration of the division into two subsets, R (the lower 6 nodes marked in green) and (the upper 4 nodes marked in blue), is provided for and . Note that all 6 nodes are assigned to R even though , since R is defined to contain every node in the marginal cluster. (b) Plot of m for . (c) Plot of for at , and for successively larger values of , shown from right to left. The solid line has slope . (d) In this case, all 10 nodes are included in R because the largest cluster exceeds in size.
When , m exhibits an HPT of the form given in Equation (1), as shown in Figure 1b. The cluster size distribution also exhibits a critical behavior Equation (2) as , as shown in Figure 1c. In [33], the scaling relations and with were derived independently of g, where characterizes the critical behavior of the mean size of finite clusters, as . Moreover, continuously increases from 2 to as g increases from 0 to 1. Therefore, the critical exponents and vary continuously for a fixed , following and as g increases. The rate equation for for , along with a qualitative explanation of how varies as g increases based on this rate equation, is presented in [33].
The derivation of the relations , and is summarized as follows. At , numerical results show that , implying that the largest cluster is and its size exceeds . Consequently, R contains all nodes, as illustrated in Figure 1d. Therefore, for , the HR model follows ER-type link addition, in which links are added between two randomly selected nodes.
The rate equation for ER-type link addition, written in terms of the shifted time , is
The initial condition is , where follows from . Using the generating function , Equation (3) can be written as , where and denote derivatives of with respect to and , respectively. The solution of this equation is given by
referring to the F-model in [37], where .
The order parameter is , since is the fraction of nodes belonging to finite clusters. By inserting into Equation (4), one obtains the self-consistency equation
To obtain the critical behavior as , is expanded for small as . Substituting this expansion into the right-hand side of Equation (5) yields
using the condition . Comparing with the critical behavior , the relation is obtained.
To obtain the relation , we use the identity . From Equation (4), we obtain , which leads to
where denotes the derivative of H with respect to x.
is expanded for small . Keeping only the leading contribution, we obtain , since . By inserting the leading contribution to the right-hand side of Equation (7), we obtain
using the condition . This yields by comparison with the critical behavior . We note that in the denominator vanishes as since .
in Equation (2) is derived by expanding , where are -independent constants. By inserting this expansion into Equation (3) and comparing terms of the same order in on both sides, together with the constraint , one obtains . Thus, satisfies Equation (2) with . We note that also confirms the conventional scaling relations and .
The HR model evolves through a forward link-addition process in which z increases irreversibly. Consequently, the exponent must be governed by the properties of the regime . In a subsequent study [35], this mechanism was clarified by analyzing the interevent time distribution , defined as the distribution of the durations z for which each node stays in the set R or before transitioning to the other set. As m undergoes a sudden rise up to near , displays a power-law tail, .
To obtain an expression for , the mean waiting time z of a cluster of size s in set R is calculated as . During the short time interval near , a cluster of size s is selected with a probability proportional to . A nodewise measurement for introduces an additional factor of s. In conclusion,
which yields . This indicates that the critical behavior at is governed by the cluster coalescence dynamics occurring for . Detailed derivations are presented in [35].
In a subsequent study [36], two distinct sets of critical exponents for , namely and , were proposed to describe, respectively, the critical behavior of the order parameter and that of the cluster size distribution. The first set is associated with the scaling relations , , and , where denotes an ensemble average and . For the second set, and play the roles of the critical exponents in Equation (2) via the identifications and . The characteristic cluster size follows , and at it scales as when . The exponent governs the critical behavior of the mean size of finite clusters, given by .
The two sets of critical exponents resulted in the derivation of three scaling relations: within the first set, within the second set, and between the two sets, where as discussed above.The first two scaling relations are explained by the conventional scaling relations and within each set. The third relation is given by
which expresses that the increment of the order parameter equals the average size of the finite cluster [36]. In Table 1, the critical exponent values of the HR model for various values of g are listed. These results confirm the three scaling relations, as well as the relation introduced above, with the identification .

Table 1.
Critical exponents in the HR model measured in [33,36].
2.2. BFW Model
The original BFW model was proposed in [34] to introduce a DPT in an EP model with global suppression. Here, we consider a modified version of BFW model to enable a clearer observation of the HPT based on analytical results [36]. In a network of N nodes, an external parameter is determined. Initially, the network contains no links, and the parameters are set to and . Links are added according to the following rules and the number of added links is .
At each time step , two nodes from different clusters are randomly selected, and the sizes of their respective clusters are denoted by and . A link between the two nodes is then either added or rejected according to the following rules:
- (i)
- If or but , a link is added and .
- (ii)
- Otherwise, a link is not added.
Therefore, both k and u evolve as u increases. We note that in the original BFW model, h depends on k as , whereas in the present model h remains constant throughout the process.
When , m exibits a HPT of the form given in Equation (1). The BFW model shows the same qualitative features of an HPT as the HR model, but with different exponent values. Two sets of critical exponents and were identified along with the three scaling relations , , and . Here, the relations , and were derived, independent of the value of h. To obtain these results, one uses the fact that the probability of link rejection in (ii) becomes zero for , so that ER-type link addition applies with the initial conditions and . The detailed derivation can be followed from Equations (3)–(10) by identifying , , , and . Like the HR model, increases continuously from 2 to as h increases from 0 to 1. Consequently, for the fixed value , the exponents and also vary continuously as h increases.
To explain the exponent at in terms of the dynamics for , the age distribution was analyzed. Here, the age z is defined as the time interval during which the cluster of a given node is not connected to any other cluster. During the abrupt increase of m up to on the verge of , exhibits a power-law decay , where is the onset of the ER-type link addition. It was shown that which implies that the critical behavior at is indeed characterized by the cluster coalescence before . follows dynamics similar to those of the HR model, and thus the origin of the relation can be understood using Equation (9).
In Table 2, the critical exponent values of the BFW model for various values of h are listed. These results confirm the scaling relations mentioned above.
Table 2.
Critical exponents in the BFW model measured in [36].
3. Cascading-Failure-Induced Hybrid Percolation Transition
3.1. Percolation in Interdependent Networks
In [38], the authors investigated percolation in a pair of interdependent networks, each containing the same number of nodes N and sharing the same average degree z. Within each network, nodes are linked by connectivity links, and every node in one network is connected to a corresponding node in the other network via a dependency link. When z exceeds a critical threshold, the mutually giant connected component (MGCC) appears in a discontinuous manner. Here, a mutually connected component (MCC) is defined as a collection of dependent node pairs such that, within each individual network, all nodes in the component are reachable from one another through connectivity links. The order parameter is given by the fraction of nodes that are part of the largest MCC.
Percolation phenomena in interdependent networks have been observed in a range of systems, including ferromagnetic and superconducting networks [39,40]. While subsequent studies have extended the framework to more than two interdependent networks [41,42,43], in this work we restrict our analysis to the case of two interdependent networks.
We focus on a scenario in which each pair of mutually dependent nodes is chosen at random. On a variety of network structures, the MGCC vanishes discontinuously as z is reduced below in accordance with Equation (1). Because this discontinuous jump in the order parameter is accompanied by critical behavior characteristic of a continuous transition, the transition is classified as hybrid, as elaborated below.
Consider a pair of interdependent networks with that has a MGCC. We first remove a randomly chosen pair of nodes from this MGCC. Subsequently, a cascade of failures of dependent node pairs typically unfolds: whenever one node in a pair loses its connection to the MGCC in its own network, the entire pair fails. This process proceeds iteratively until each dependent pair is either fully included in the MGCC or fully excluded from it. The size of the avalanche is defined as the total number of nodes that are disconnected from the MGCC during this entire cascade. An illustrative avalanche event is presented in Figure 2.
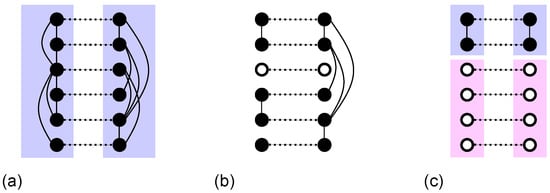
Figure 2.
Example of cascade size in the percolation of interdependent networks. Solid lines represent connectivity links, and dotted lines represent dependency links. (a) Initially, all nodes in each network belong to a giant mutually connected component. (b) A pair of interdependent nodes (∘) is removed. (c) The two upper nodes in each network remain in a mutually connected component. The other four nodes determine the avalanche size.
The avalanche size distribution represents the probability that an avalanche triggered by the removal of a pair of nodes has size s. To obtain , one removes different node pairs from given interdependent networks and then averages the resulting avalanche sizes over many network realizations. For a variety of networks, this avalanche size distribution shows the critical behavior given in Equation (2) as [15,44].
The critical properties described in Equations (1) and (2) have been investigated for a variety of interdependent network structures, including interdependent scale-free (SF), Erdős–Rényi (ER), and two-dimensional square lattice (2D) networks. For interdependent SF and ER networks, the systems can be approximated as locally tree-like, leading to the exponents and [15]. Notably, a HPT occurs even in SF networks with a degree exponent smaller than 3, in contrast to ordinary percolation on a single SF network, where the giant component appears continuously starting from . For interdependent 2D networks, numerical simulations yield and [44].
In a subsequent investigation of the critical behavior [44], two sets of critical exponents, and , were introduced to characterize the behavior as . The first set is associated with the order parameter and satisfies the scaling relations , , and , where denotes an ensemble average and .
For the second set, and are identified with the exponents appearing in Equation (2) by setting and . The characteristic cluster size scales as , and at the finite-size threshold it follows , where . The exponent describes the critical scaling of the mean size of finite avalanches, .
These two exponent sets are not independent; they are connected through the relation , where denotes the value of z at the onset of the cascading failure. Differentiating this relation yields and leads to
Table 3 summarizes the numerically evaluated critical exponents for interdependent ER and 2D networks. Notably, the hyperscaling relation is satisfied within the quoted uncertainties. In addition, the relation given in Equation (11) also holds within the error ranges, as expected.
Table 3.
Critical exponents in percolation of interdependent networks measured in [44].
3.2. k-Core Percolation
A k-core is a subgraph in which every node has at least k neighbors that also lie within this subgraph. When links are added among N nodes and the average degree z surpasses a critical value , a giant k-core appears. k-core percolation (also known as bootstrap percolation) was first examined on the Bethe lattice [45]. Later studies extended this analysis to locally tree-like networks, including ER and SF networks [46,47,48]. The order parameter is defined as the fraction of nodes that are part of the largest k-core.
For , the giant k-core disappears discontinuously as z decreases below following Equation (1) on the Bethe lattice and ER network. This discontinuity is accompanied by critical behavior, indicating that the transition is hybrid. We note that k-core percolation exhibits a continuous transition in SF networks with a degree exponent below 3.
At , a network with is given that contains a giant k-core. At each time step , all nodes with degrees less than k are removed. Removing a node reduces the degrees of its neighbors, and some of those neighbors may then have degrees less than k, which causes them to be removed in the next step. This cascading process continues until only the k-cores remain.
The critical behavior of the k-core pruning process has been understood as a branching process with a mean branching coefficient close to 1 in uncorrelated, locally tree-like networks [47]. In the ER network, the dynamics of the pruning process have been studied in three regimes: , , and . For the duration (relaxation) time until the steady state diverges as . At , the probability that a vertex is removed at time t decays as . The avalanche size distribution triggered by the removal of a node in the giant k-core (See Figure 3 for an example.) also follows Equation (2) with as .
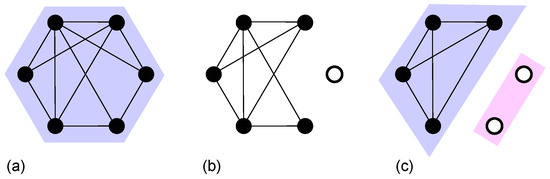
Figure 3.
Example of cascading failures in k-core percolation for . (a) Initially, all nodes belong to a giant k-core. (b) One node (∘) is removed. (c) Four nodes form a k-core, and the other two isolated nodes determine the avalanche size.
In a subsequent investigation of critical behavior [48], two sets of critical exponents, and , which were originally introduced for interdependent-network percolation, were analyzed in the context of k-core percolation. It was found that characteristic features, including the scaling relations in Equation (11) and , also hold for k-core percolation, as verified by measurements on ER networks summarized in Table 4. These universal aspects, shared by interdependent-network percolation and k-core percolation, are accounted for within the unified framework described in Section 3.3.
Table 4.
Critical exponents in k-core percolation of ER networks measured in [48].
3.3. Unified Framework as a Critical Branching Process of the Two-Step Contagion Model
In [16], the two-step contagion model was adopted to explain the underlying dynamics of the hybrid percolation transitions in interdependent networks and k-core percolation within a unified framework. In the two-step contagion model, each node can be in one of four states: susceptible (S), weakened (W), infected (I), or removed (R). Consequently, the model is known as the SWIR model [49].
The dynamical rules of the model are defined as follows: Consider a network with a mean degree z. At time , one node is initialized in state I, while all remaining nodes are in state S. At each subsequent time t, the following procedure is applied to every node that is in state I at that time. For each such infected node, the states of all of its neighbors are updated for the next time step according to these rules. If a neighbor is in state S, it changes to state I with probability or to state W with probability . If a neighbor is in state W, it transitions to state I with probability . These neighbor update rules are depicted in Figure 4a. To encode that weakened nodes are more susceptible to infection, the model imposes . As the system progresses from t to , all nodes that were in state I at time t transition to state R. This update procedure for each time step is iterated until the system reaches an absorbent configuration in which no infected nodes remain in the network.
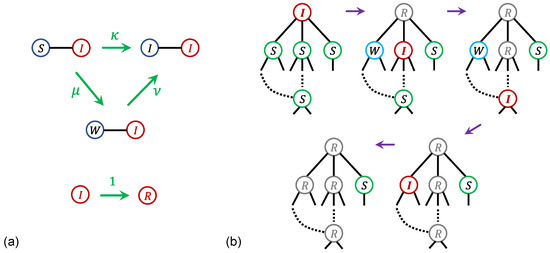
Figure 4.
(a) Schematic diagram of the update rules for nodes in the SWIR model. (b) Schematic diagram of the spread of infection originating from the top node and following the arrows. During the third step, the W node is infected via the long range shortcut.
For a fixed value of , the infection of S nodes propagates outward from the initially infected node as time t increases. If , the total number of removed nodes in the absorbing state stays finite, corresponding to a finite avalanche. In contrast, when , the total number of removed nodes in the absorbing state scales as , indicating an infinite avalanche. Notably, a sharp rise in the number of removed nodes appears around , because of the W nodes become infected via long-range shortcuts, as depicted in Figure 4b. The order parameter is defined as the fraction of R nodes in the absorbing state. For , displays a hybrid phase transition, following for .
At , the infection originating from a single initially infected node evolves as a critical branching process, with an average branching factor close to 1. This behavior is a typical feature in both interdependent network percolation and k-core percolation, offering a common explanation for the fundamental mechanism driving criticality in these two models.
In the percolation of interdependent networks, the unbounded cascade of link failures at , initiated by removing a node from the MGCC, can be viewed as the critical branching process of the SWIR model. The connectivity links in the two interdependent networks are denoted as A-type and B-type links. For comparison with the SWIR model on a single network, we treat each pair of mutually dependent nodes as one effective node carrying both A-type and B-type links. The corresponding effective degrees and are then assigned to each node j for the respective link types, such that every node in the MGCC satisfies and .
At each time t, each node is considered to be in one of the four states of the SWIR model. When a node is removed, it can trigger the failure of links connected to its neighbors; therefore, it is treated as a I-state node at that time and transitions to a R-state node at the next step. Initially, at , every node with or is placed in the S-state, since it can be removed at the following time step if one of its neighboring nodes is in the I state, and therefore it becomes an I-state node at the next time. During the avalanche (), any node that newly acquires or is classified as a W-state node. With this mapping, it has been verified in ER networks that the dynamics of the avalanche at corresponds to the critical branching process of the SWIR model, characterized by a mean branching coefficient close to 1.
In k-core percolation, the unbounded cascade of node failures occurring at after the removal of a node in the giant k-core can be understood as the critical branching process of the SWIR model. Analogous to the framework used for interdependent networks, each node in k-core percolation is assumed to occupy one of the four SWIR states at each time step t. When a node is removed, it may cause the links of its neighboring nodes to fail; hence it is treated as an I-state node and then transitions to an R-state node in the next step. At the initial time , every node i with degree is placed in the S-state, because it can be removed at the next step as a consequence of the removal of one of its I-state neighbors, thereby becoming an I-state node in the following step. During the avalanche (), if a node i attains degree , it is classified as a W-state node. Within this mapping, it has been verified for ER networks with that the avalanche dynamics at are captured by the critical branching process of the SWIR model, characterized by a mean branching coefficient close to 1.
4. Summary
In this review, we have summarized recent advances on two classes of HPTs in Section 2 and Section 3. The first class involves an HPT of a giant cluster that forms under global suppression as links are added. In this scenario, the critical behavior at is captured by the scaling of the cluster size distribution. Because both the HR and BFW models evolve as forward processes, their critical exponents at are determined, for , by the distributions of interevent times and ages, respectively. The second class includes HPTs of a MGCC in interdependent networks as well as HPTs of a giant k-core. As , the mean avalanche size of link failures diverges, producing a critical avalanche size distribution at . In both classes, the mechanism underlying the critical avalanches at can be consistently interpreted within a unified framework as a critical branching process described by the SWIR model.
Strikingly, for both categories of HPTs, two separate families of critical exponents have been identified: one associated with the order parameter and the other with the corresponding size distributions. This broadened framework captures not only the standard scaling relations but also reveals additional critical features, including the coupled scaling relation connecting these two families, as expressed in Equation (11). We expect that this recent progress on HPTs will provide a basis for understanding a wide variety of hybrid phase transitions, such as hybrid synchronization transitions driven by frequency-degree correlations [50] and hybrid phase transitions in thermal systems [51,52] and colloidal crystals [53]. Finally, these results can help provide an understanding of other types of percolation transitions, including the recently reported hybrid universality classes of cascades [54], higher-order percolation processes [55], and percolation in hypergraphs [56,57].
Author Contributions
Conceptualization, Y.S.C. and B.K.; methodology, Y.S.C. and B.K.; validation, Y.S.C. and B.K.; formal analysis, Y.S.C. and B.K.; investigation, Y.S.C. and B.K.; writing—original draft preparation, Y.S.C. and B.K.; writing—review and editing, Y.S.C. and B.K.; visualization, Y.S.C. and B.K.; supervision, B.K.; project administration, B.K.; funding acquisition, Y.S.C. and B.K. All authors have read and agreed to the published version of the manuscript.
Funding
This research was supported by National Research Foundation of Korea (NRF) Grant No. RS-2025-16067164 (YSC) and RS-2023-00279802 (BK), and the KENTECH Research Grant No. KRG-2021-01-007 (BK).
Institutional Review Board Statement
Not applicable.
Informed Consent Statement
Not applicable.
Data Availability Statement
No new data were created or analyzed in this study. Data sharing is not applicable to this article.
Conflicts of Interest
The authors declare no conflicts of interest.
Abbreviations
The following abbreviations are used in this manuscript:
| CPT | Continuous percolation transition |
| DPT | Discontinuous percolation transition |
| HPT | Hybrid percolation transition |
| EP | Explosive percolation |
| HR | Half-restricted |
| BFW | Bohman-Frieze-Wormald |
| MGCC | Giant mutually connected component |
| SF | Scale-free |
| ER | Erdos-Rényi |
References
- Broadbent, S.R.; Hammersley, J.M. Percolation processes. Cambridge Philos. Soc. 1957, 53, 629. [Google Scholar] [CrossRef]
- Flory, P.J. Molecular Size Distribution in Three Dimensional Polymers. I. Gelation. J. Am. Chem. Soc. 1941, 63, 3083–3090. [Google Scholar] [CrossRef]
- Flory, P.J. Molecular Size Distribution in Three Dimensional Polymers. II. Trifunctional Branching Units. J. Am. Chem. Soc. 1941, 63, 3091–3096. [Google Scholar] [CrossRef]
- Flory, P.J. Molecular Size Distribution in Three Dimensional Polymers. III. Tetrafunctional Branching Units. J. Am. Chem. Soc. 1941, 63, 3096–3100. [Google Scholar] [CrossRef]
- Murray, J.D. Mathematical Biology; Springer: Berlin/Heidelberg, Germany, 2005. [Google Scholar]
- McLachlan, D.S.; Blaszkiewiczm, M.; Newnham, R.E. Electrical Resistivity of Composites. J. Am. Ceram. Soc. 1990, 73, 2187–2203. [Google Scholar] [CrossRef]
- Last, B.J.; Thouless, D.J. Percolation Theory and Electrical Conductivity. Phys. Rev. Lett. 1971, 27, 1719. [Google Scholar] [CrossRef]
- Albert, R.; Jeong, H.; Barabási, A.L. Error and attack tolerance of complex networks. Nature 2000, 406, 378. [Google Scholar] [CrossRef] [PubMed]
- Morone, F.; Makse, H.A. Influence maximization in complex networks through optimal percolation. Nature 2015, 524, 65–68. [Google Scholar] [CrossRef]
- Watts, D.J. A simple model of global cascades on random networks. Proc. Natl. Acad. Sci. USA 2002, 99, 5766–5771. [Google Scholar] [CrossRef] [PubMed]
- Shao, J.; Havlin, S.; Stanley, H.E. Dynamic Opinion Model and Invasion Percolation. Phys. Rev. Lett. 2009, 103, 018701. [Google Scholar] [CrossRef]
- Erdos, P.; Rényi, A. On the evolution of random graphs. Publ. Math. Inst. Hung. Acad. Sci. 1960, 5, 17–61. [Google Scholar]
- Stauffer, D.; Aharony, A. Introduction to Percolation Theory, 2nd ed.; Taylor and Francis: London, UK, 1994. [Google Scholar] [CrossRef]
- Christensen, K.; Moloney, N.R. Complexity and Criticality; Imperial College Press: London, UK, 2005. [Google Scholar] [CrossRef]
- Baxter, G.J.; Dorogovtsev, S.N.; Goltsev, A.V.; Mendes, J.F.F. Avalanche Collapse of Interdependent Networks. Phys. Rev. Lett. 2012, 109, 248701. [Google Scholar] [CrossRef]
- Lee, D.; Choi, W.; Kertész, J.; Kahng, B. Universal mechanism for hybrid percolation transitions. Sci. Rep. 2017, 7, 5723. [Google Scholar] [CrossRef]
- Rozenfeld, H.; Gallos, L.; Makse, H. Explosive percolation in the human protein homology network. Eur. Phys. J. B 2010, 75, 305–310. [Google Scholar] [CrossRef]
- Ziff, R.M. Explosive Growth in Biased Dynamic Percolation on Two-Dimensional Regular Lattice Networks. Phys. Rev. Lett. 2009, 103, 045701. [Google Scholar] [CrossRef]
- Radicchi, F.; Fortunato, S. Explosive percolation: A numerical analysis. Phys. Rev. E 2010, 81, 036110. [Google Scholar] [CrossRef]
- Fan, J.; Meng, J.; Liu, Y.; Saberi, A.A.; Kurths, J.; Nagler, J. Universal gap scaling in percolation. Nat. Phys. 2020, 16, 455–461. [Google Scholar] [CrossRef]
- Araújo, N.A.M.; Andrade, J.S.; Ziff, R.M.; Herrmann, H.J. Tricritical Point in Explosive Percolation. Phys. Rev. Lett. 2011, 106, 095703. [Google Scholar] [CrossRef] [PubMed]
- Lee, H.K.; Kim, B.J.; Park, H. Continuity of the explosive percolation transition. Phys. Rev. E 2011, 84, 020101(R). [Google Scholar] [CrossRef]
- Choi, W.; Yook, S.H.; Kim, Y. Explosive site percolation with a product rule. Phys. Rev. E 2011, 84, 020102(R). [Google Scholar] [CrossRef]
- da Costa, R.A.; Dorogovtsev, S.N.; Goltsev, A.V.; Mendes, J.F.F. Explosive Percolation Transition is Actually Continuous. Phys. Rev. Lett. 2010, 105, 255701. [Google Scholar] [CrossRef]
- Grassberger, P.; Christensen, C.; Bizhani, G.; Son, S.W.; Paczuski, M. Explosive Percolation is Continuous, but with Unusual Finite Size Behavior. Phys. Rev. Lett. 2011, 106, 225701. [Google Scholar] [CrossRef]
- Cho, Y.S.; Kahng, B. Suppression effect on explosive percolation. Phys. Rev. Lett. 2011, 107, 275703. [Google Scholar] [CrossRef]
- Riordan, O.; Warnke, L. Explosive percolation is continuous. Science 2011, 333, 322–324. [Google Scholar] [CrossRef] [PubMed]
- Cho, Y.S.; Hwang, S.; Herrmann, H.J.; Kahng, B. Avoiding a Spanning Cluster in Percolation Models. Science 2013, 339, 1185–1187. [Google Scholar] [CrossRef] [PubMed]
- Panagiotou, K.; Sphöel, R.; Steger, A.; Thomas, H. Explosive Percolation in Erdos-Rényi-Like Random Graph Processes. Elec. Notes in Discret. Math. 2011, 38, 699–704. [Google Scholar] [CrossRef]
- Araújo, N.A.M.; Herrmann, H.J. Explosive Percolation via Control of the Largest Cluster. Phys. Rev. Lett. 2010, 105, 035701. [Google Scholar] [CrossRef] [PubMed]
- Schröder, M.; Araújo, N.A.M.; Sornette, D.; Nagler, J. Controlling percolation with limited resources. Phys. Rev. E 2017, 96, 062302. [Google Scholar] [CrossRef]
- Trevelyan, A.J.; Tsekenis, G.; Corwin, E.I. Degree product rule tempers explosive percolation in the absence of global information. Phys. Rev. E 2018, 97, 020301(R). [Google Scholar] [CrossRef]
- Cho, Y.S.; Lee, J.S.; Herrmann, H.J.; Kahng, B. Hybrid Percolation Transition in Cluster Merging Processes: Continuously Varying Exponents. Phys. Rev. Lett. 2016, 116, 025701. [Google Scholar] [CrossRef]
- Bohman, T.; Frieze, A.; Wormald, N.C. Avoidance of a giant component in half the edge set of a random graph. Random Struct. Algorithms 2004, 25, 432. [Google Scholar] [CrossRef]
- Park, J.; Yi, S.; Choi, K.; Lee, D.; Kahng, B. Interevent time distribution, burst, and hybrid percolation transition. Chaos 2019, 29, 091102. [Google Scholar] [CrossRef]
- Choi, H.; Cho, Y.S.; D’Souza, R.M.; Kertész, J.; Kahng, B. Unified framework for hybrid percolation transitions based on microscopic dynamics. Chaos Solitons Fractals 2024, 184, 114981. [Google Scholar] [CrossRef]
- Ziff, R.M.; Ernst, M.H.; Hendriks, E.M. Kineticsofgelation and universality. J. Phys. A Math. Gen. 1983, 16, 2293. [Google Scholar] [CrossRef]
- Buldyrev, S.V.; Parshani, R.; Paul, G.; Stanley, H.E.; Havlin, S. Catastrophic cascade of failures in interdependent networks. Nature 2010, 464, 1025–1028. [Google Scholar] [CrossRef]
- Gross, B.; Volotsenko, I.; Sallem, Y.; Yadid, N.; Bonamassa, I.; Havlin, S.; Frydman, A. The random cascading origin of abrupt transitions in interdependent systems. Nat. Commun. 2025, 16, 5869. [Google Scholar] [CrossRef]
- Gross, B.; Havlin, S. Physical Realizations of Interdependent Networks: Analogy to Percolation. Entropy 2025, 27, 109. [Google Scholar] [CrossRef]
- Son, S.W.; Bizhani, G.; Christensen, C.; Grassberger, P.; Paczuski, M. Percolation theory on interdependent networks based on epidemic spreading. Europhys. Lett. 2012, 97, 16006. [Google Scholar] [CrossRef]
- Cellai, D.; Dorogovtsev, S.N.; Bianconi, G. Message passing theory for percolation models on multiplex networks with link overlap. Phys. Rev. E 2016, 94, 032301. [Google Scholar] [CrossRef] [PubMed]
- Bianconi, G. Multilayer Networks: Structure and Function; Oxford University Press: Oxford, UK, 2018. [Google Scholar] [CrossRef]
- Lee, D.; Choi, S.M.; Stippinger, M.; Kertész, J.; Kahng, B. Hybrid phase transition into an absorbing state: Percolation and avalanches. Phys. Rev. E 2016, 93, 042109. [Google Scholar] [CrossRef]
- Chalupa, J.; Leath, P.L.; Reich, G.R. Bootstrap percolation on a Bethe lattice. J. Phys. C 1979, 12, L31–L35. [Google Scholar] [CrossRef]
- Dorogovtsev, S.N.; Goltsev, A.V.; Mendes, J.F.F. k-Core Organization of Complex Networks. Phys. Rev. Lett. 2006, 96, 040601. [Google Scholar] [CrossRef] [PubMed]
- Baxter, G.J.; Dorogovtsev, S.N.; Lee, K.E.; Mendes, J.F.F.; Goltsev, A.V. Critical Dynamics of the k-Core Pruning Process. Phys. Rev. X 2015, 5, 031017. [Google Scholar]
- Lee, D.; Jo, M.; Kahng, B. Critical behavior of k-core percolation: Numerical studies. Phys. Rev. E 2016, 94, 062307. [Google Scholar] [CrossRef]
- Janssen, H.K.; Müller, M.; Stenull, O. Generalized epidemic process and tricritical dynamic percolation. Phys. Rev. E 2004, 70, 026114. [Google Scholar] [CrossRef] [PubMed]
- Gómez-Gardeñes, J.; Gómez, S.; Arenas, A.; Moreno, Y. Explosive Synchronization Transitions in Scale-Free Networks. Phys. Rev. Lett. 2011, 106, 128701. [Google Scholar] [CrossRef] [PubMed]
- Bar, A.; Mukamel, D. Mixed-Order Phase Transition in a One-Dimensional Model. Phys. Rev. Lett. 2014, 112, 015701. [Google Scholar] [CrossRef]
- Jang, S.; Lee, J.S.; Hwang, S.; Kahng, B. Ashkin-Teller model and diverse opinion phase transitions on multiplex networks. Phys. Rev. E 2015, 92, 022110. [Google Scholar] [CrossRef]
- Alert, R.; Tierno, P.; Casademunt, J. Mixed-order phase transition in a colloidal crystal. Proc. Natl. Acad. Sci. USA 2017, 114, 12906. [Google Scholar] [CrossRef]
- Bonamassa, I.; Gross, B.; Kertész, J.; Havlin, S. Hybrid universality classes of systemic cascades. Nat. Commun. 2025, 16, 1415. [Google Scholar] [CrossRef]
- Sun, H.; Bianconi, G. Higher-order percolation processes on multiplex hypergraphs. Phys. Rev. E 2021, 104, 034306. [Google Scholar] [CrossRef] [PubMed]
- Bianconi, G.; Dorogovtsev, S.N. Theory of percolation on hypergraphs. Phys. Rev. E 2024, 109, 014306. [Google Scholar] [CrossRef] [PubMed]
- Bianconi, G.; Dorogovtsev, S.N. Nature of hypergraph k-core percolation problems. Phys. Rev. E 2024, 109, 014307. [Google Scholar] [CrossRef] [PubMed]
Disclaimer/Publisher’s Note: The statements, opinions and data contained in all publications are solely those of the individual author(s) and contributor(s) and not of MDPI and/or the editor(s). MDPI and/or the editor(s) disclaim responsibility for any injury to people or property resulting from any ideas, methods, instructions or products referred to in the content. |
© 2026 by the authors. Licensee MDPI, Basel, Switzerland. This article is an open access article distributed under the terms and conditions of the Creative Commons Attribution (CC BY) license.