Article

Operational Reliability Assessment of Compressor Gearboxes with Normalized Lifting Wavelet Entropy from Condition Monitoring Information

1
Key Laboratory of Road Construction Technology and Equipment, Ministry of Education, Chang'an University, Xi'an 710064, China
2
State Key Laboratory for Manufacturing and Systems Engineering, Xi'an Jiaotong University, Xi'an 710049, China
*
Author to whom correspondence should be addressed.
Entropy 2015, 17(5), 3479-3500; https://doi.org/10.3390/e17053479
Submission received: 12 April 2015 / Accepted: 14 May 2015 / Published: 20 May 2015
(This article belongs to the Special Issue Wavelet Entropy: Computation and Applications)

Abstract

:
Classical reliability assessment methods have predominantly focused on probability and statistical theories, which are insufficient in assessing the operational reliability of individual mechanical equipment with time-varying characteristics. A new approach to assess machinery operational reliability with normalized lifting wavelet entropy from condition monitoring information is proposed, which is different from classical reliability assessment methods depending on probability and statistics analysis. The machinery vibration signals with time-varying operational characteristics are firstly decomposed and reconstructed by means of a lifting wavelet package transform. The relative energy of every reconstructed signal is computed as an energy percentage of the reconstructed signal in the whole signal energy. Moreover, a normalized lifting wavelet entropy is defined by the relative energy to reveal the machinery operational uncertainty. Finally, operational reliability degree is defined by the quantitative value obtained by the normalized lifting wavelet entropy belonging to the range of [0, 1]. The proposed method is applied in the operational reliability assessment of the gearbox in an oxy-generator compressor to validate the effectiveness.

1. Introduction

Reliability is a worldwide popular expression that has been celebrated for years as a commendable attribute of a person or a thing. The first recorded appearance of the term reliability can be traced to a source praising a friend written by Samuel T. Coleridge in 1816 [1]. From its first record to present, technological and social progress have prompted a rational scheme of reliability and have given rise to reliability as a scientific discipline. In 2006, Saleh et al. highlighted the history and key events of reliability to acknowledge its past and anticipate its future challenges [1]. In 2009, Zio shared the existing problems and challenges that researchers and practitioners were facing when analyzing complex systems’ reliability [2]. Nowadays, reliability is a multi-disciplinary scientific discipline which aims at system safety. The dictionary defines it as the quality or fact of being reliable and the degree to which repeated measurements of the same subject under identical conditions yield consistent results.
Reliability engineering is an important branch of the reliability discipline, which refers to the capability of a system or component to execute its essential functions under stated conditions in a given period of time. Probability statistics and mass production from standardized parts are the essential conditions that have given rise to the birth of reliability engineering. In particular, vacuum tubes promoted the development of the discipline of reliability engineering since vacuum tubes are the primary causes of equipment failure and their replacement ratios were five times as much as those of other equipment in World War Two [1]. Therefore, reliability engineering focuses on the quantification of failure probability and its safeguards. The fundamental issues of reliability engineering relate to the representation and modeling of the complexity of the system, the quantification analysis of the system models, the expression, propagation and uncertainty evaluation in the system failure behavior and consequences [2].
At present, reliability is a general attribute that has been used as an omnipresent concept with qualitative and quantitative connotations in mechanical engineering. Mechanical reliability spans design reliability, manufacturing reliability, operational reliability, maintenance reliability and management reliability, etc. There is a common sense that probability distribution and statistics analysis are the essentials of mechanical reliability. The manufacture of standardized mechanical parts in large quantities is a fundamental ingredient of probability distribution and statistics models, such as the normal, exponential or Weibull ones. Probability and statistics entail sufficient failure samples estimating the general probability of the system or component failures and the distribution of the times-to-failure, which are usually fitted by historical time-to-failure data. However, it is common sense that a lack of failure samples and time-to-failure data makes it very difficult to use probability and statistics for mechanical reliability analysis. Secondly, the variations of the environmental and operating parameters (such as temperatures, vibration, stress, electrical loads) often affect reliability whenever a single parameter is above its limit or a failure is caused. Variations in quality and operation are usually more difficult to deal with because they seldom follow a conventional mathematical distribution form. In fact, mechanical equipment is usually used in different operating states depending on the operating parameters and component conditions, which go through a series of degradation states evolving from functioning to failure in the lifetime span. The degradation patterns and rules are diverse due to the different operating parameters and working conditions. Using historical time-to-failure data to evaluate the future performance and reliability of machines requires a proposition that the historical and current conditions are highly similar, which rarely conforms to the facts. Therefore, reliability assessment of an individual machine is demanded [3]. Since the traditional probability and statistics methods rarely utilize the operational condition information of mechanical equipment to assess the operational reliability and predict machinery breakdowns or other serious risk occurrences, it is necessary to assess the operational reliability of individual mechanical equipment with time-varying condition monitoring information.
Operational reliability is very important for industrial enterprises to protect mechanical equipment running safety from damage, faults, failures and economic losses. Recently, Arnaiz proposed a new decision support system based on operational risk assessment to improve aircraft operability [4]. Vinnem proposed a generalized methodology for operational risk analysis of offshore installations [5]. When condition monitoring is performed during plant operational transients, the intrinsically dynamic behavior of the monitored time-varying signals should be taken into account [6]. Therefore, many studies assess the operational reliability by means of condition monitoring information. Wang et al. presented a method for quantitative analysis of real-time operational reliability of a space manipulator using a state space equation and Bayesian method [7]. Sun et al. presented a non-probabilistic metric derived from condition information for operational reliability assessment of aero-engines [8]. Chen et al. used vibration signals and a logistic regression model for reliability estimation of cutting tools [9]. Hua et al. proposed a novel performance degradation reliability estimation method based on an adaptive failure threshold and degradation signal data series [10]. The above operational reliability methods have mainly utilized dynamic monitored condition information of mechanical equipment instead of probability statistics, so how to process the condition information and map the condition information to reliability is very essential for operational reliability assessment.
Information entropy, which was first presented by Shannon in 1948, is an effective indicator to measure a system’s degree of uncertainty. From then on, information entropy has become widespread in engineering applications. Different types of information entropy have been defined in accordance with their own usage, such as fuzzy entropy for adaptive bacterial foraging [11], sample entropy for tool state detection [12], hierarchical entropy for biological signal analysis [13], Renyi entropy for high-resolution scalar quantization [14], cross entropy for multi-target tracking [15], and so on. Since the wavelet transform excels in analyzing unsteady signals in both the time domain and frequency domain, wavelet information entropy is defined to represent the dynamic characteristics of mechanical signals. Up to now, wavelet information entropy has been applied in machinery condition monitoring and fault diagnosis. For example, Bafroui proposed using wavelet energy and Shannon entropy for feature extraction in gearbox fault detection under varying speed conditions [16]. Safty et al. adopted wavelet information entropy with a neural-fuzzy inference system to identify transmission line faults and determine the phases involved in power system faults [17]. Lin et al. detected motor shaft misalignments using multiscale entropy with wavelet denoising [18]. Ren et al. defined wavelet entropy, relative wavelet entropy, and wavelet-time entropy to detect damage in structures [19]. Chen et al. proposed the concept of Tsallis wavelet energy entropy and applied it to the feature extraction of transient signals in power systems [20]. Yu et al. defined an instantaneous wavelet energy entropy in the fault diagnosis of micro-gas turbine sensors [21]. From the above, current research is mainly focused on mechanical fault diagnosis with wavelet information entropy.
On the basis of information entropy theory, the most uncertain probability distribution (such as an equal probability distribution) has the largest entropy and the most certain probability distribution has the smallest entropy, so information entropy supplies a measure of uncertainty and provides a practical criterion for analyzing similarity or dissimilarity between distributions of probability when mechanical equipment is settled on different operating states involving functioning to failure. Since wavelets meet the demands of transient signal analysis and entropy is associated with the measurements of information uncertainty, it is useful to evaluate the operational reliability of mechanical equipment with wavelet entropy from condition monitoring information.
The lifting scheme, a simple, general construction of second generation wavelets was proposed by Sweldens [22]. A lifting scheme inherits the time-frequency localization property and multi-resolution ratio characteristic of first generation wavelets. A lifting scheme is a more effective and quicker implementation of the wavelet transform and has merits such as simple construction, a small amount of calculations and in-place calculation. Moreover, the inverse transform can immediately be derived from the forward scheme by running the scheme backwards. It has been proved by Daubechies that arbitrary wavelet transforms can be implemented by using a lifting scheme [23]. The lifting wavelet transform has been widely used in mechanical signal processing. For example, Li et al. proposed a new signal-adapted lifting scheme for rotating machinery fault diagnosis, which was applied to analyze bearing and gearbox vibration signals [24]. Huang et al. proposed an enhanced feature extraction model for machinery performance assessment, which is based on the lifting-based wavelet packet transform and sampling-importance-resampling methods [25]. Yang et al. stated a least squares method based on data fitting to construct a new lifting wavelet, together with the nonlinear idea and redundant algorithm [26]. Liao et al. proposed a hybrid fault-feature extraction method by detecting localized defects and analyzing vibration signals of rolling element bearings via a customized multi-wavelet packet transform, which matches the diverse characteristics of hybrid fault and attains effective results [27].
Therefore, a novel operational reliability assessment method based on normalized lifting wavelet entropy is proposed. Degree of reliability is realized by a lifting wavelet package transform to process vibration signals and then quantitatively evaluated by the normalized lifting wavelet entropy belonging to the range of [0, 1]. In this instance, a degree of reliability value is uniformly and monotonously mapped into the range of [0, 1] that coincides with the traditional definition of degree of reliability. Since gearboxes are ubiquitous in different types of industrial equipment and are one of the core components in rotating machinery, assessing the operational reliability of gearboxes can reduce machinery breakdowns and improve machinery availability. Therefore, an application is conducted to evaluate the operational reliability of the gearbox in an oxy-generator compressor. The paper is organized as follows: the basic theory of wavelets and information entropy are briefly reviewed in Section 2. A novel operational reliability assessment method based on normalized lifting wavelet entropy from condition information is proposed in Section 3. An operation reliability assessment application for the gearbox of an oxy-generator compressor is conducted in Section 4. General conclusions are drawn in Section 5.

2. Theoretical Background

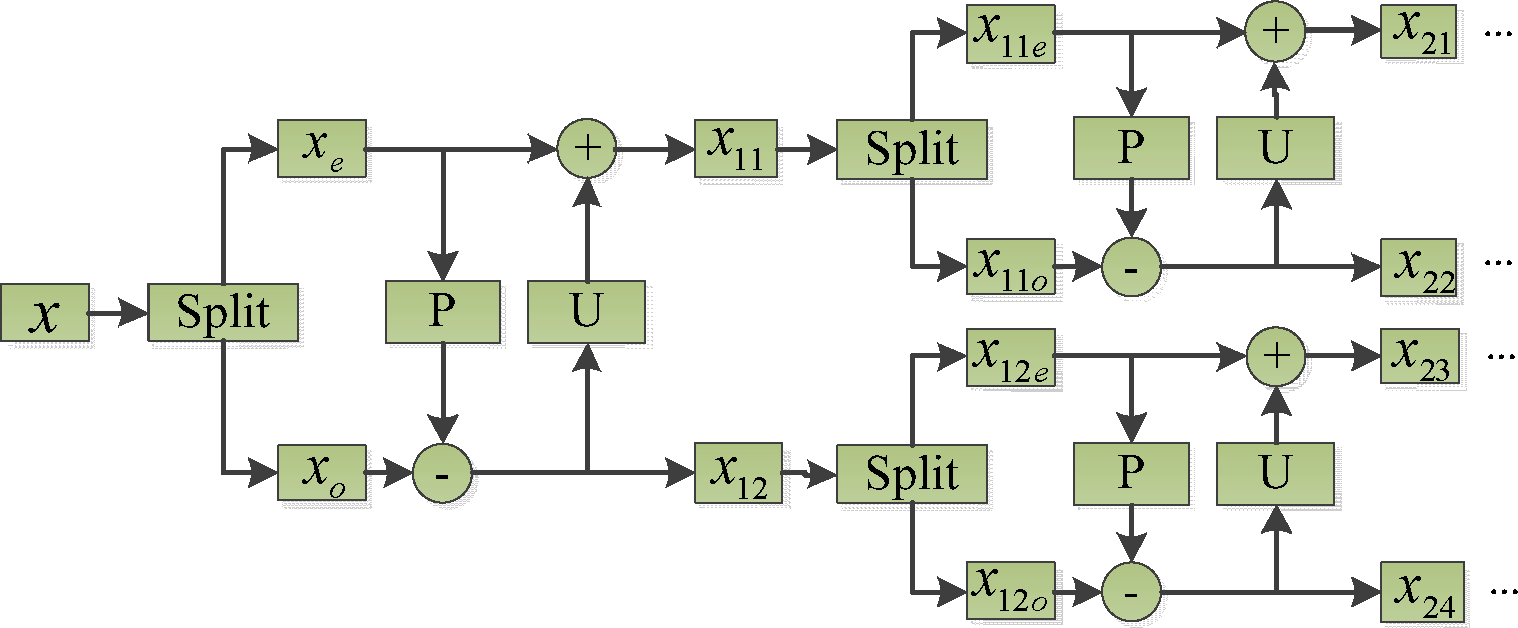
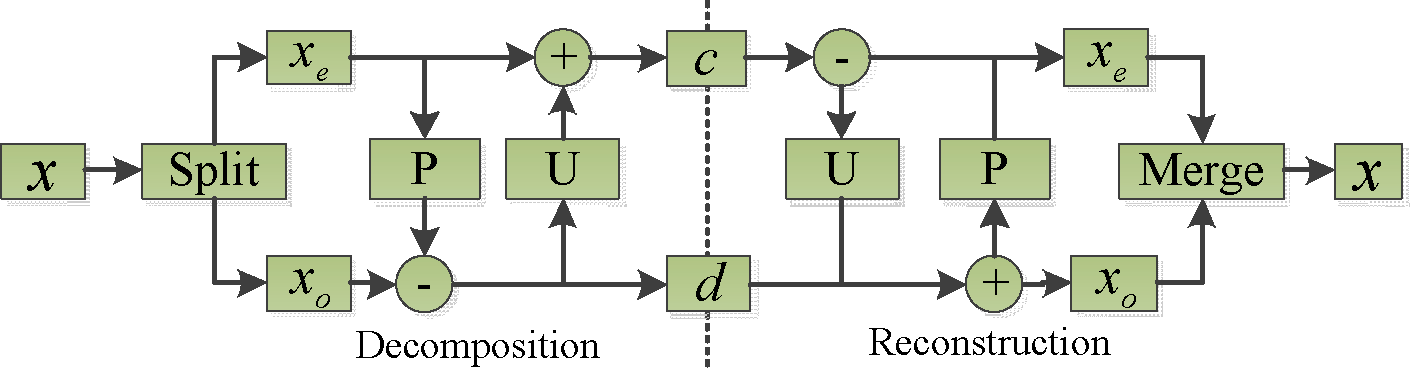
2.1. Lifting Scheme: a Construction of Second Generation Wavelets

The forward transform of a typical lifting scheme usually consists of three steps: split, prediction and update. Consider a signal: X = {x(n),n ∈ Z} with x(n) ∈ R. The implementation of the forward transform is illustrated as below:
  • Split
    The original signal X is split into two subsets: even indexed samples xe and odd indexed sample xo by means of a sample operation:
    { x e = x ( 2 n ) x o = x ( 2 n + 1 )
    After the split operation is completed, the odd set and even set are obtained and the two sets are closely correlated. That is, adjacent samples are much more correlated than those far from each other. It is natural that one can build a good predictor for one set with other set.
  • Prediction
    Given the odd indexed samples xo, a predictor P for the even indexed samples xe can be designed:
    x ˜ o = P ( x e )
    The difference denoted as d between the predicted results and the odd samples is considered as the detail coefficients of the signal x(n), and it is expressed as:
    d = x o x ˜ o = x o P ( x e )
  • Update
    Knowing the even sample xe and the detail coefficients d , the approximation coefficients c are calculated using the updating operator U as:
    c = x e + U ( d )
The inverse transform can immediately be derived from the forward transform by running the lifting scheme backwards. The block diagram of the lifting scheme is given in Figure 1.
The advantages and characteristics of the lifting scheme based second generation wavelet transform are listed as below [23]:
  • Lifting allows for an in-place implementation of the fast wavelet transform, a feature similar to the Fast Fourier Transform (FFT). This means the wavelet transform can be calculated without allocating auxiliary memory.
  • Lifting leads to a speed-up when compared to the standard implementation.
  • A construction using lifting is entirely spatial and therefore ideally suited for building second generation wavelets when Fourier techniques are no longer available.
  • The inverse transform of lifting scheme can be implemented easily. The inverse transform can immediately be derived from the forward by running the scheme backwards.
  • It is particularly easy to build non-linear wavelet transforms using lifting scheme. Such transforms are important for hardware implementation and for lossless image coding.
  • Lifting allows for adaptive wavelet transforms, which means one can start analysis of a function from the coarsest levels and then build the finer levels by refining only in the areas of interest.

2.2. Shannon Entropy Measure and Properties

Shannon entropy [28,29], named after Claude Shannon, was first proposed in 1948. Since then, Shannon entropy has been widely used in the information sciences. Shannon entropy is a measure of the uncertainty associated with a random variable. Specifically, Shannon entropy quantifies the expected value of the information contained in a message. The Shannon entropy of a random variable X can be defined as in Equation (5), where Pi is defined in Equation (6) with xi indicating the ith possible value of X out of n symbols, and Pi denoting the possibility of X = xi:
H ( X ) = H ( P 1 , , P n ) = i = 1 n P i log 2 P i
P i = Pr ( X = x i )
Shannon entropy attains, but is not limited to, the following properties:
  • Bounded: 0 ≤ H (X) ≤ log2 n
  • Symmetry: H (P1, P2,⋯, Pn) = H (P2, P1,⋯, Pn) = ⋯
  • Grouping: H (P1, P2,⋯, Pn) = H (P1 + P2,⋯, Pn) + (P1 + P2)H (P1 / (P1 + P2), P2 / (P1 + P2))

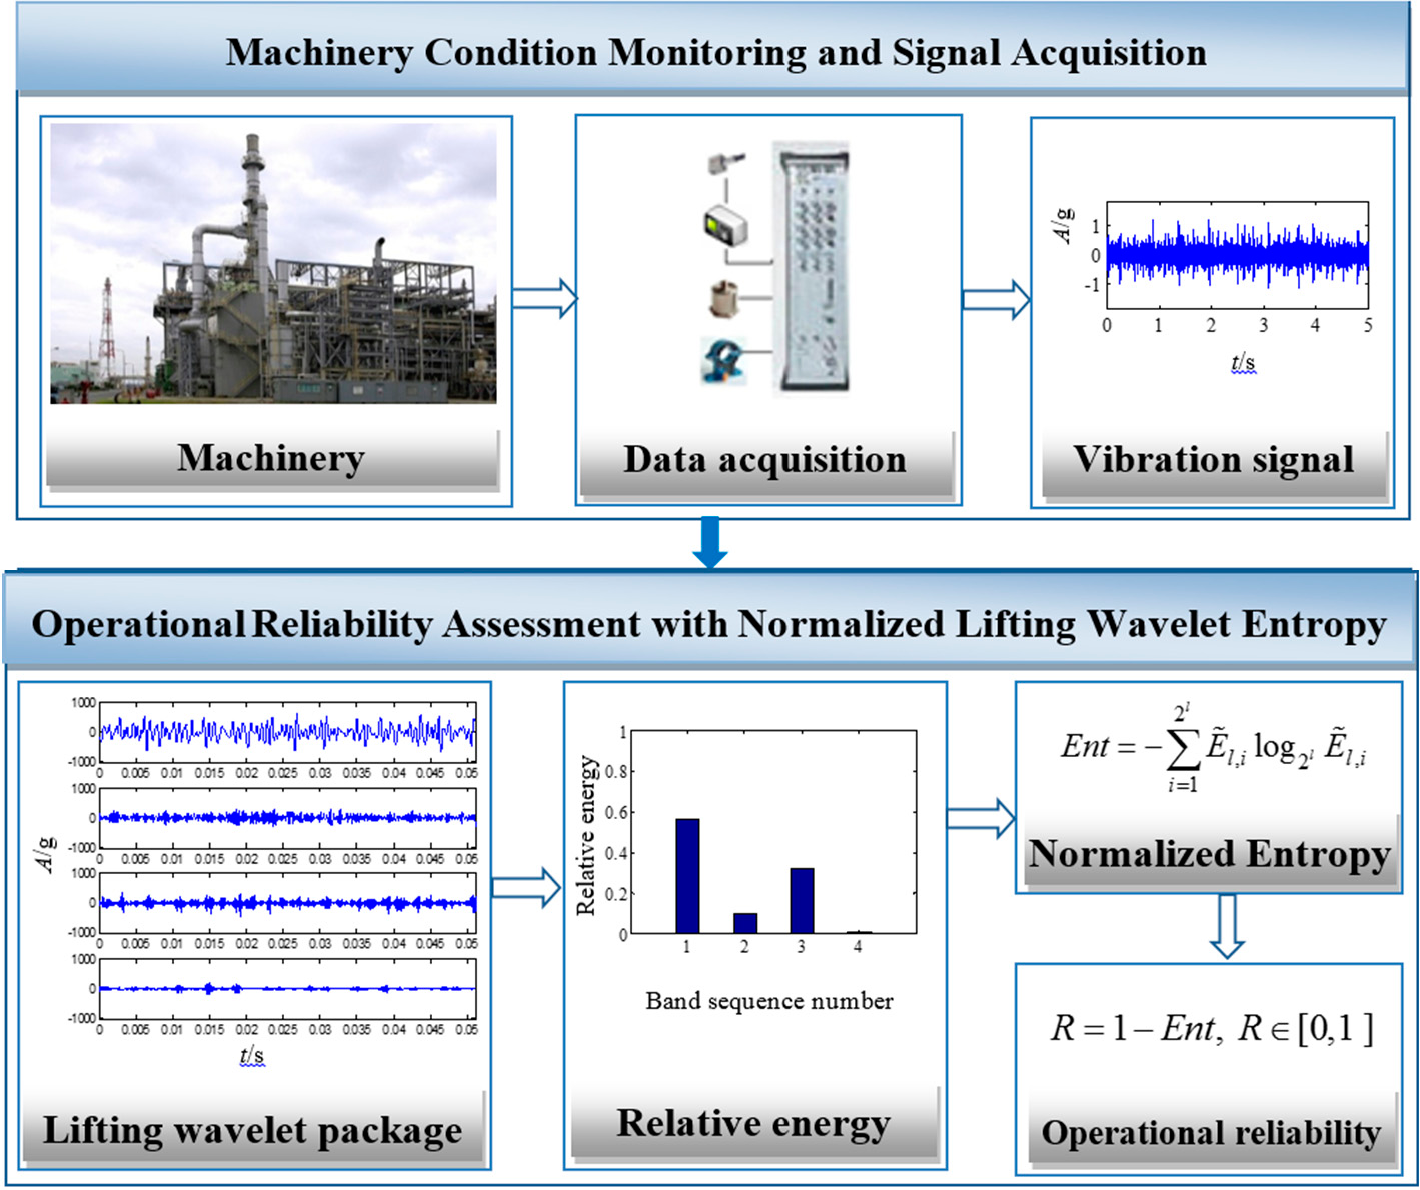
3. Operational Reliability Assessment with Normalized Lifting Wavelet Entropy

Based on the lifting wavelet scheme and theory of entropy, a novel operational reliability assessment method with normalized lifting wavelet entropy is proposed. The central components of the proposed method are the machinery condition monitoring and signal acquisition, signal processing with the lifting wavelet package, and operational reliability assessment with normalized lifting wavelet entropy, which mainly utilize lifting wavelet package to analyze the machinery condition monitoring information and compute the normalized lifting wavelet entropy so as to obtain operational reliability. An illustration of the proposed operational reliability assessment method with normalized lifting wavelet entropy is presented in Figure 2, which works as follows.

3.1. Machinery Condition Monitoring and Signal Acquisition

It is well known that machinery evolving from functioning to failure undergoes a series of degradation states and the operational process can be monitored by some measurable variables. Therefore, it is of great significance to establish an internal relationship between machinery operational reliability and condition monitoring information, such as vibration signals, temperatures, pressures, etc. Vibration signals are the most commonly acquired data, which is realized by sensors. The proposed operational reliability assessment method starts with vibration data acquisition by sensors and a data acquisition system to collect machinery condition vibration information, which relies on precisely acquiring information about the current operating conditions. Afterwards, the vibration signal information is analyzed by the lifting wavelet package transform due to the predominance of the lifting scheme-based wavelet transform.

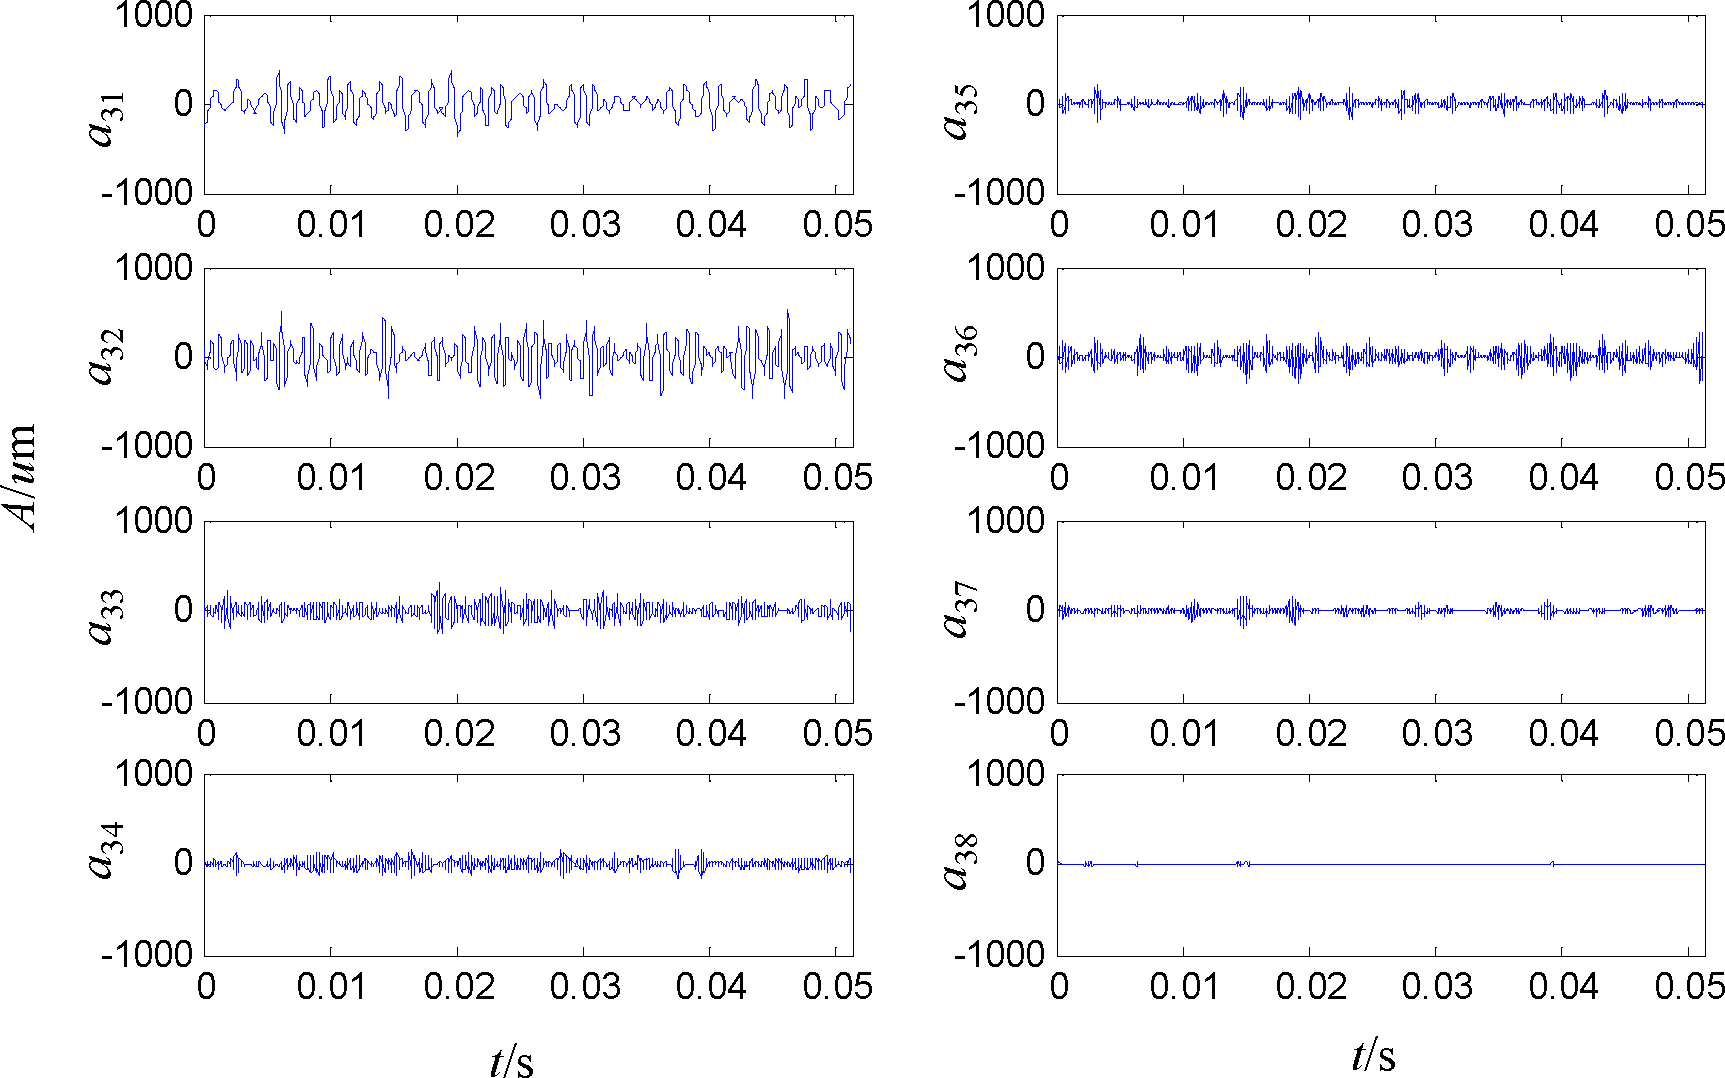
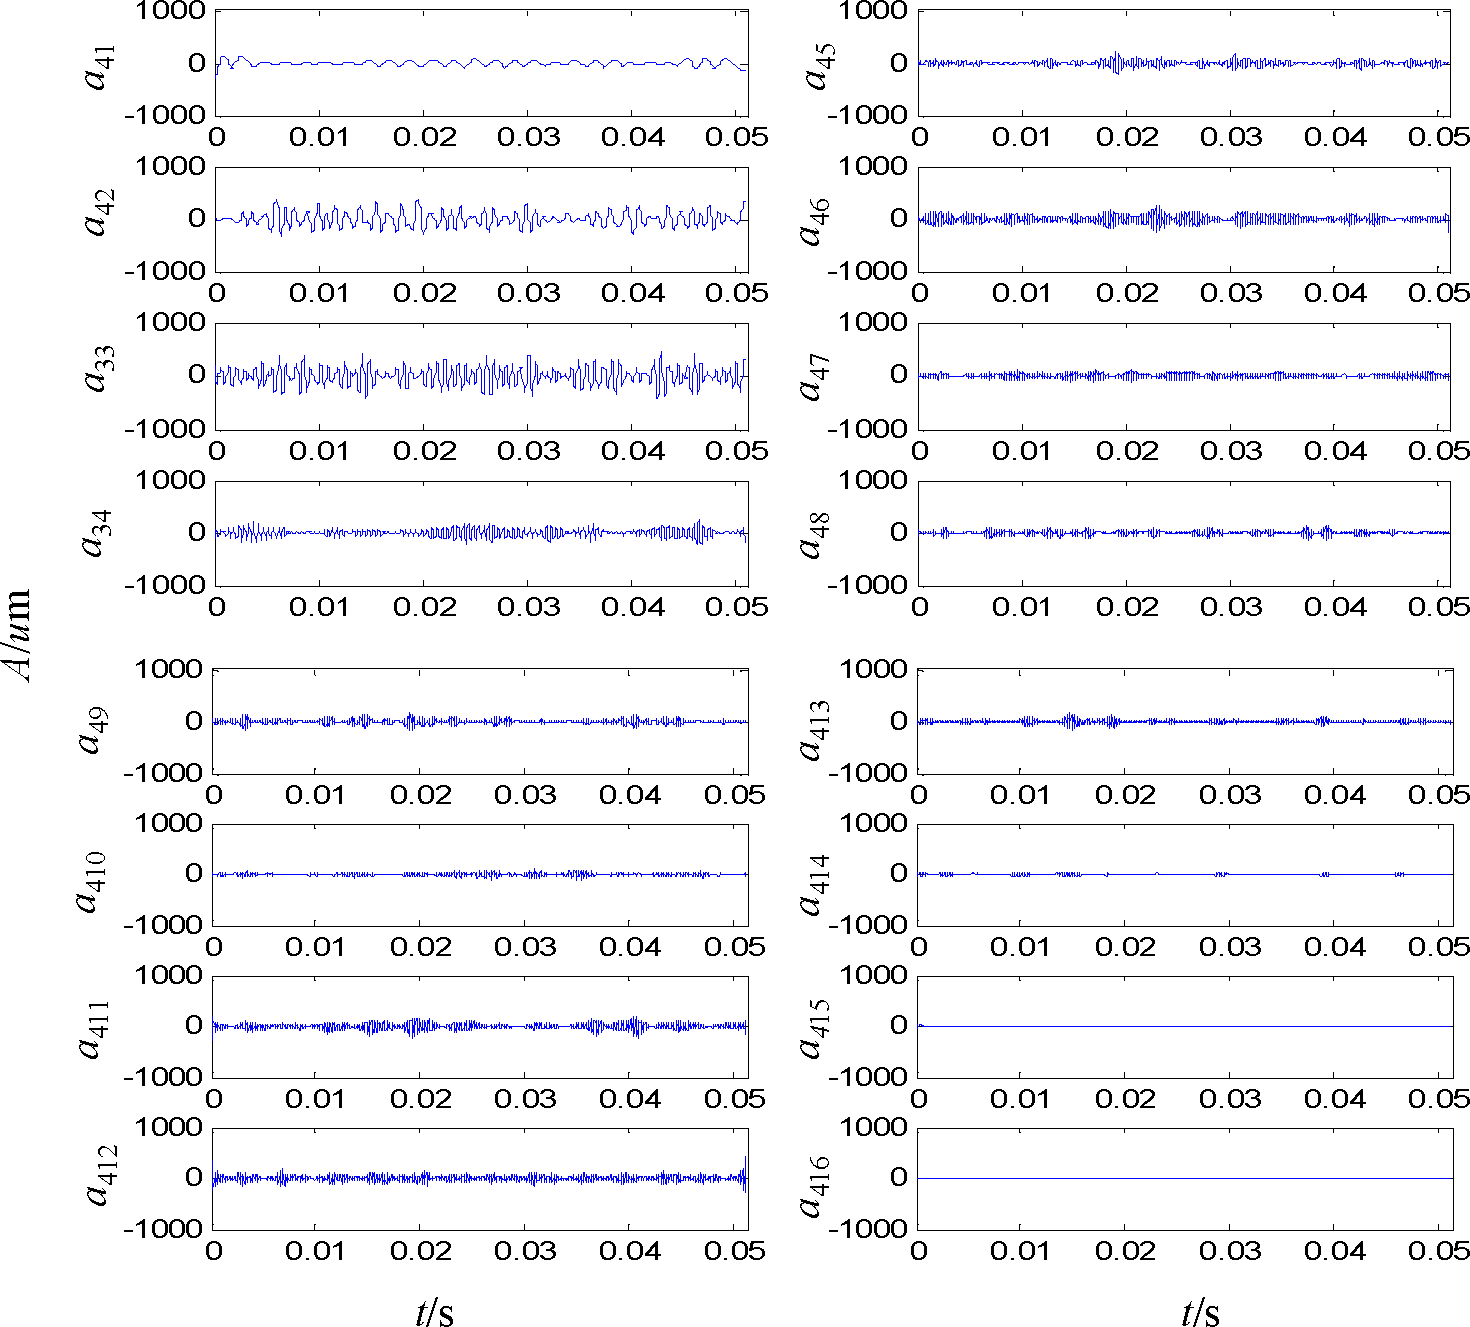
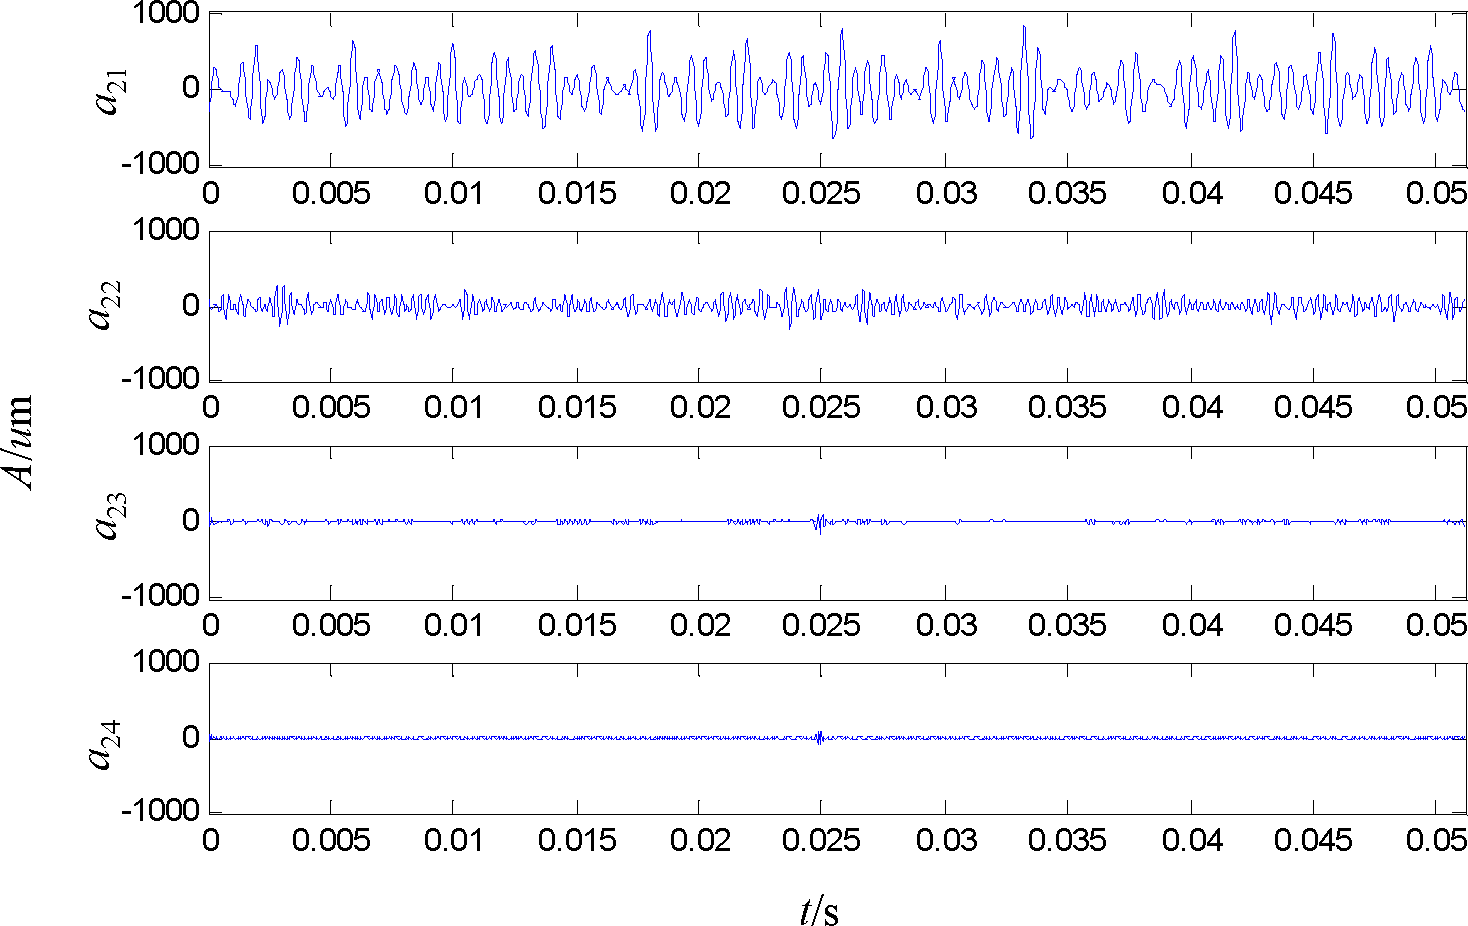
3.2. Lifting Wavelet Package Transform

The lifting wavelet package transform is often called second generation wavelet package transform, which is a lifting scheme based on the wavelet packet transform. The forward transform of the lifting wavelet package transform is illustrated in Figure 3.
The inverse transform can be derived from the forward transform by running the lifting scheme backwards. The detail procedure of lifting wavelet package transform is as follows:
Original signal S ={x(k),kZ} can be divided into even series se ={se (k),kZ} and odd series so ={so (k),kZ}:
s e ( k ) = x ( 2 k ) , k Z
s o ( k ) = x ( 2 k + 1 ) , k Z
Since the odd and even subsets are highly correlated, several samples of the even series can be used to predict a certain sample in the odd series, and the prediction difference is defined as the detail signal. The even series can be updated using the obtained detail signal and modified even if the subset is defined as an approximation signal:
s l 1 = s ( l 1 ) 1 o P ( s ( l 1 ) 1 e )
s l 2 = s ( l 1 ) 1 e + U ( s l 1 )
s l ( 2 l 1 ) = s ( l 1 ) 2 l 1 o P ( s ( l 1 ) 2 l 1 e )
s l 2 l = s ( l 1 ) 2 l 1 e + U ( s l ( 2 l 1 ) )
where s l 1 , s l 2 , , s l 2 l are the decomposed signals, respectively, in each frequency band after the lth decomposition. s ( l 1 ) 1 o , , s ( l 1 ) 2 l 1 o are the odd series, respectively, after the (l −1)th decomposition; s ( l 1 ) 1 e , , s ( l 1 ) 2 l 1 e are the even series, respectively, after the (l −1)th decomposition. P is defined as the N point predictor whose prediction coefficients are p1, p2,⋯,pN and N is the predictor order. U is denoted as the Ñ point updater with update coefficients u1,u2,⋯,uÑ and Ñ is the updater order. The coefficients p1, p2,⋯, pN and u1,u2,⋯,uÑ can be determined based on [23,30].
We keep the signal in one frequency band to be reconstructed, and then set the others as zero. The signal reconstruction of the lifting wavelet package transform for one appointed frequency band is as follows:
s ( l 1 ) 2 l 1 e = s l 2 l U ( s l ( 2 l 1 ) )
s ( l 1 ) 2 l 1 o = s l ( 2 l 1 ) + P ( s ( l 1 ) 2 l 1 e )
s ( l 1 ) 2 l 1 ( 2 k ) = s ( l 1 ) 2 l 1 e ( k ) , k Z
s ( l 1 ) 2 l 1 ( 2 k + 1 ) = s ( l 1 ) 2 l 1 o ( k ) , k Z
s ( l 1 ) 1 e = s l 2 U ( s l 1 )
s ( l 1 ) 1 o = s l 1 + P ( s ( l 1 ) 1 e )
s ( l 1 ) 1 ( 2 k ) = s ( l 1 ) 1 e ( k ) k Z
s ( l 1 ) 1 ( 2 k + 1 ) = s ( l 1 ) 1 o ( k ) k Z
where s ( l 1 ) 1 ( 2 k ) , s ( l 1 ) 1 ( 2 k + 1 ) , , s ( l 1 ) 2 l ( 2 k ) , s ( l 1 ) 2 l ( 2 k + 1 ) are the reconstructed signals of the appointed frequency band from the (l −1)th reconstruction of the lifting wavelet package transform.

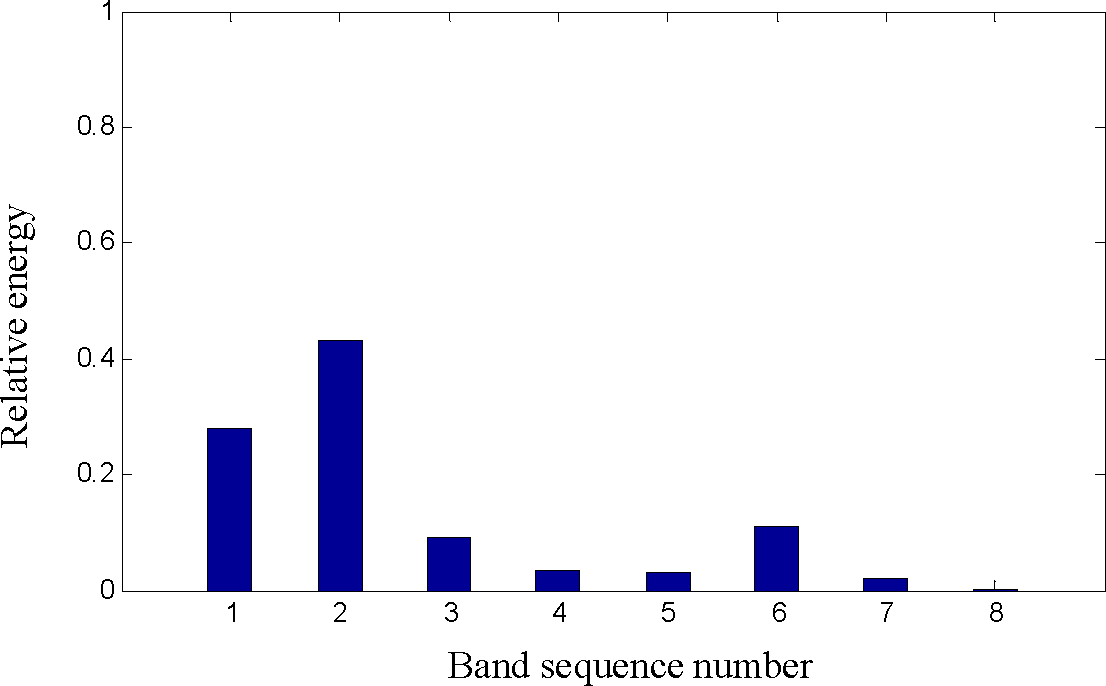
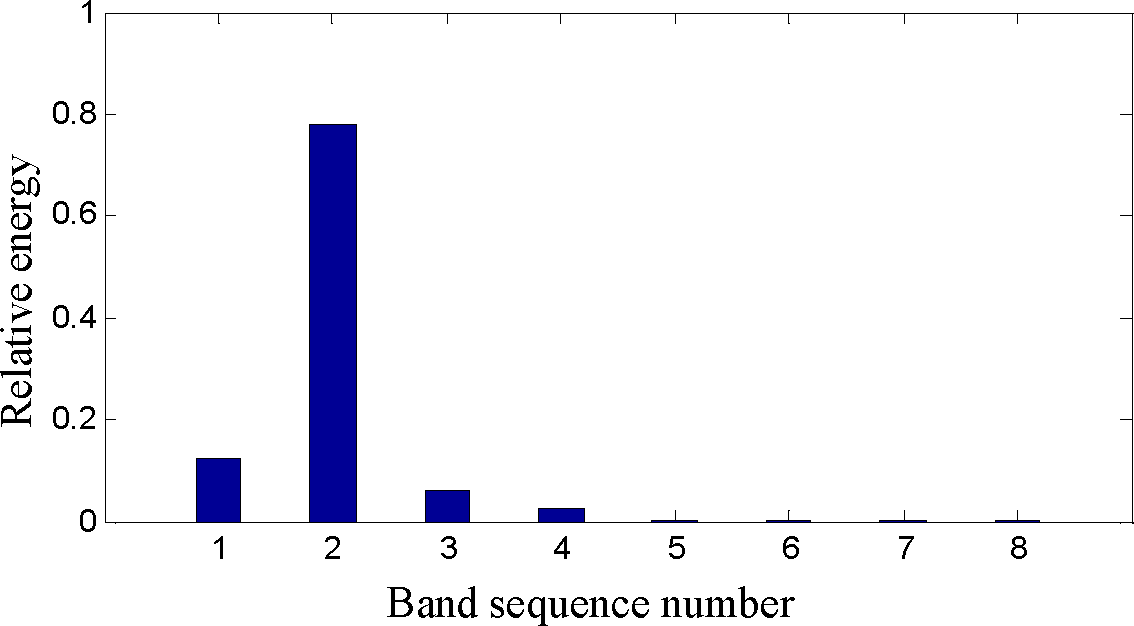
3.3. Frequency Band Energy of Lifting Wavelet Package Transform

The lifting wavelet package transform obeys the energy conservation principle because of its biorthogonal basis. After the lth decomposition, 2l frequency bands are attained where each frequency band has the same bandwidth and end to end. Let xl,i (k) be the reconstructed signal at the lth decomposition in the ith frequency band, its energy El,i and relative energy l,i are respectively calculated as follows:
E l , i = 1 n 1 k = 1 n ( s l , i ( k ) ) 2 , i = 1 , 2 , , 2 l , k = 1 , 2 , , n , n Z
E ˜ l , i = E l , i ( i = 1 2 l E l , i ) 1
Obviously, i = 1 2 l E ˜ l , i = 1, the sum of total relative energy equals 1.

3.4. Normalized Lifting Wavelet Entropy

The normalized lifting wavelet entropy Ent is defined as:
E n t = i = 1 2 l E ˜ l , i log 2 l E ˜ l , i
In Equation (23), the base of logarithm is defined as 2l . In this case, the value Ent belongs to [0, 1]. If all of the transformed 2l frequency bands have the same value of relative energy of (2l)−1 (such as the equal probability distribution), the normalized lifting wavelet entropy Ent is equal to one. On the contrary, if there is only one frequency band which concentrates the whole energy of 2l frequency bands, its relative energy is equal to one (like the most certain probability distribution), and the normalized lifting wavelet entropy Ent is equal to zero.
From the above, it is concluded that the most uncertain probability distribution (such as the equal probability distribution) has the largest entropy of one and the most certain probability distribution has the smallest entropy equaling zero. Therefore, the defined normalized lifting wavelet entropy supplies a measure of the information uncertainty and provides a practical criterion for analyzing the probability distributions of condition information when mechanical equipment is settled on different operational states involving functioning to failure. Since wavelets meet the demands of transient signal analysis and entropy is associated with the measurements of information uncertainty, it is useful to evaluate the operational reliability of mechanical equipment with the proposed normalized lifting wavelet entropy from condition monitoring information.

3.5. Reliability Degree Based on Normalized Lifting Wavelet Entropy

The degree of reliability is defined by a quadratic relation from normalized lifting wavelet entropy as follows:
R = 1 E n t 2 , R [ 0 , 1 ]
The degree of reliability is transformed by the normalized lifting wavelet entropy belonging to the range of [0, 1]. In this instance, the degree of reliability value is uniformly and monotonously mapped into the range of [0, 1] that coincides with the traditional definition of degree of reliability. When mechanical equipment are undergoing performance degradation or some faults occur in the equipment, its operational condition will become more and more uncertain. The normalized lifting wavelet entropy will increase and the equipment operational reliability will decrease. Since the normalized lifting wavelet entropy Ent belongs to [0, 1], and the value of the degree of reliability R belongs to [0, 1] too, obviously, a large normalized lifting wavelet entropy Ent corresponds to a small reliability R. Contrarily, a small normalized lifting wavelet entropy Ent corresponds to a large reliability R.

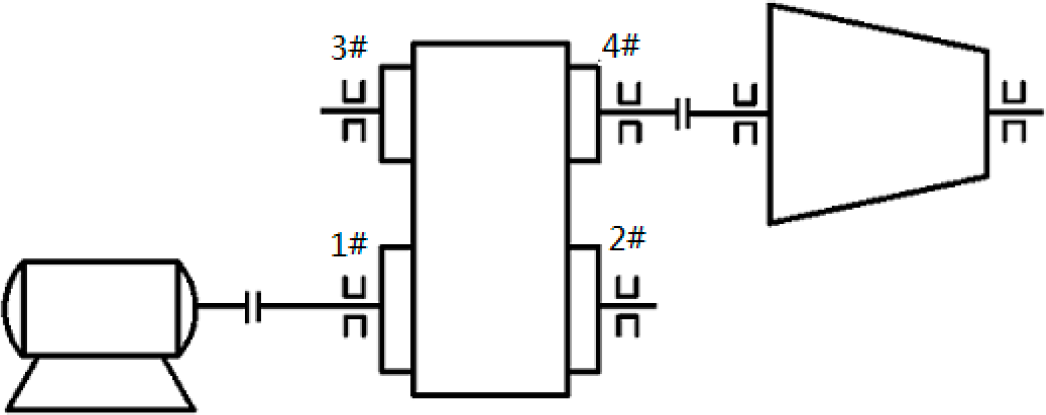
4. Application in Operational Reliability Assessment of a Compressor Gearbox

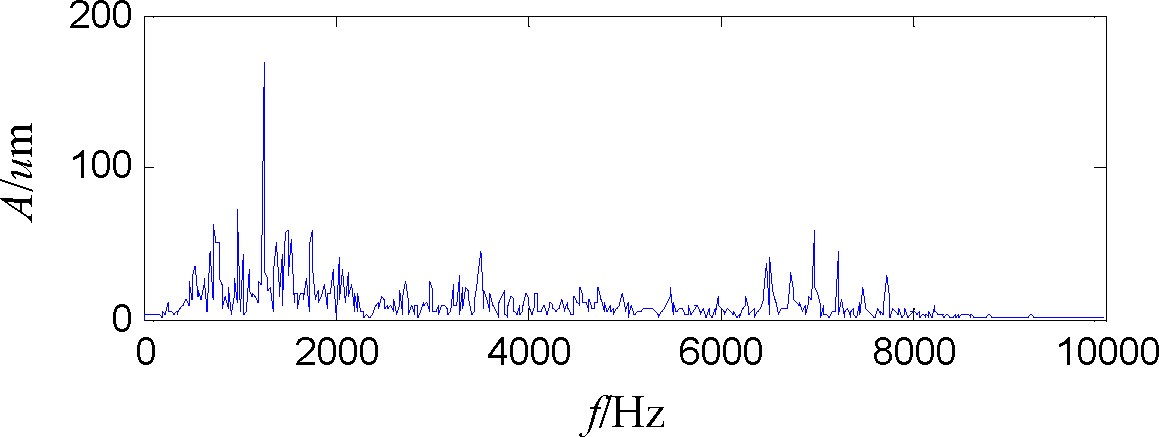
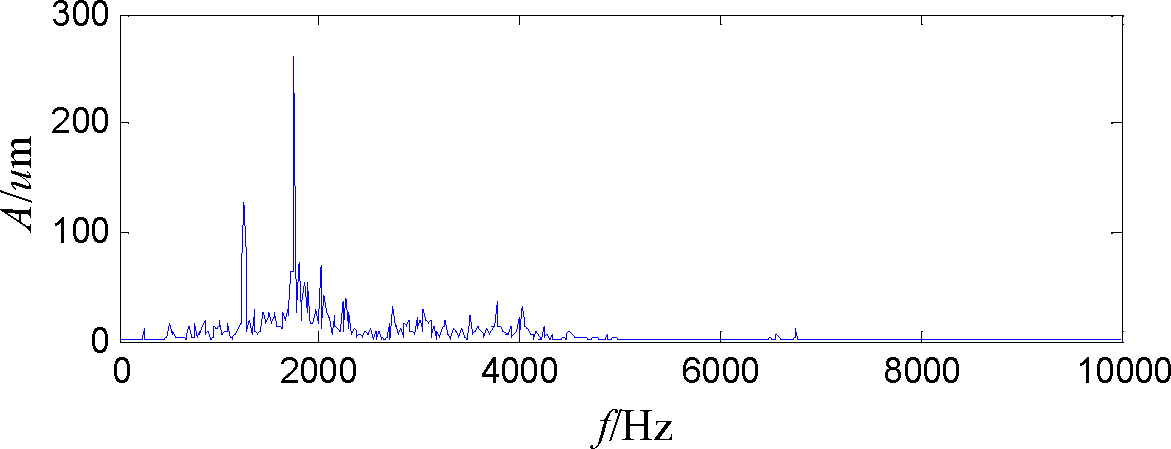
4.1. Vibration Monitoring and Analysis

There is an oxy-generator compressor in a steel mill, which is shown in Figure 4. The rotating speed of the output shaft in the overdrive gearbox is 14,885 r/min. The vibration of the gearbox increases and high-frequency noise appears in service. As shown in Figure 5, the gearbox contains four sliding bearings, which can be tested by an acceleration transducer with 20 KHz sampling frequency. It is found that the vibration of the 3# bearing is the highest among the four sliding bearings. Meanwhile, the temperature of the 3# bearing bush, which is more than 50 °C, is also the highest.
The acquired vibration signal shown in Figure 6 contains much disorder information. The frequency spectrum of the vibration signal shown in Figure 7 is spread over the whole frequency band with rich vibration information in the high frequency band. In order to further analyze the vibration signal to obtain the rich condition information, the lifting wavelet package is adopted to decompose the original signal to the extent of level 2, level 3 and level 4, respectively, so as to reveal the impact induced by decomposition level. The obtained four signals analyzed by the lifting wavelet package in level 2 are illustrated in Figure 8.
Afterwards, the relative energy of the corresponding frequency band analyzed by the lifting wavelet package is computed according to Equation (22). The relative energy of the corresponding frequency band shown in Figure 9 is distributed in the four frequency bands after the lifting wavelet package analysis. The energy of the first frequency band is the largest, while the energy of the second and the third frequency band is larger than the energy of the fourth frequency band.
On the basis of the level 2, the original signal is further processed to the extent of level 3 as shown in Figure 10. The relative energy of the corresponding frequency band shown in Figure 11 is distributed in eight frequency bands. The energy of the first two frequency bands is much larger than the energy of the other frequency bands. Except for the first two frequency bands, the energy of the sixth frequency band is the largest among the rest of the frequency bands. It is inferred that the energy of the sixth frequency band is generated by the machinery degradation information and fault.
The original signal is further processed to the extent of level 4 shown in Figure 12. The relative energy of the corresponding frequency band shown in Figure 13 is distributed in sixteen frequency bands. The energy of the second and the third frequency band are much larger than that of other frequency bands. Except for these two frequency bands, the first band, the fourth band, the eleventh band and twelfth band are larger than the rest, the energy of which is generated by machinery degradation information or faults.

4.2. Operational Reliability Assessment

The normalized wavelet information entropy is calculated according to Equation (23) from level l = 2 to level l = 4, respectively. Like the discussion of Equation (23), the value Ent belongs to [0, 1]. If all of the transformed frequency bands have the same relative energy value (such as the equal probability distribution), the normalized lifting wavelet entropy Ent is equal to one. On the contrary, if there is only one frequency band concentrating the whole energy, the normalized lifting wavelet entropy Ent is equal to zero. Since mechanical performance degradation and faults can make machinery condition uncertain, the probability distribution of the monitored condition information will become uncertain and entropy will be added.
From Table 1, the obtained normalized wavelet information entropy is larger than 0.6. The degree of reliability is calculated according to Equation (24) from level l = 2 to level l = 4, respectively. From Table 1, it is seen that machinery performance is degraded during longtime operation and needs repair, since all of the calculated reliability degrees from level l = 2 to level l = 4 are near 0.5, the lowest of which is 0.4854 in level l = 4. It is concluded that the mechanical equipment is undergoing performance degradation and some faults may have occurred.

4.3. Repair and Maintenance

The oxy-generator compressor in the steel mill is stopped and overhauled, and many cracks and fragments are found on the #3 bearing bush of the gearbox. After replacing the #3 bearing and maintenance, the oxy-generator is run again. The vibration is decreased and the high-frequency noise is reduced.
The waveform of the acquired vibration signal shown in Figure 14 shows some differences compared with the vibration signal before replacing the #3 bearing shown in Figure 6, such as the maximum amplitude of the monitored vibration signal is decreased after replacement and maintenance.
The FFT spectrum of the vibration signal is concentrated in the low frequency band as shown in Figure 15, which is different from the spectrum before maintenance in Figure 7. The lifting wavelet package is adopted to analyze the acquired vibration signal on level 2, level 3 and level 4, respectively. Afterwards, the relative energy of the corresponding frequency band analyzed by the lifting wavelet package is computed according to Equation (22) and the normalized wavelet information entropy is calculated according to Equation (23).
The four obtained signals analyzed by the lifting wavelet package in level 2 are illustrated in Figure 16. The relative energy of the corresponding frequency band after maintenance is concentrated in the first two frequency bands shown in Figure 17, and the energy of the last two frequency bands is very small, which is quite different from Figure 9. It is seen that the increased energy in the high frequency band of Figure 9 is generated by the machinery degradation information and the energy is decentralized in the frequency bands.
The vibration signal is further processed to the extent of level 3, which is shown in Figure 18. The relative energy of the corresponding frequency band shown in Figure 19 is different from the energy distribution in Figure 11 before maintenance, such as the energy of the last four frequency bands is very little.
It is concluded that the increased energy of the high frequency band is caused by machinery degradation information. The vibration signal is then processed to the extent of level 4, which is shown in Figure 20.
As shown in Figure 21, the relative energy of the corresponding frequency band after maintenance is also different from the energy distribution before maintenance in Figure 13, such as the energy in the last seven high frequency bands is very small. Therefore, it is verified that the lifting wavelet package transform can process the vibration signal in different frequency bands to effectively reveal the machinery condition information.
The normalized wavelet information entropy and the reliability degree of the acquired signals after maintenance are respectively calculated according to Equations (23) and (24) from level l = 2 to level l = 4 as listed in Table 2. It is seen that the normalized wavelet information entropy decreases and the operational reliability increases after maintenance.

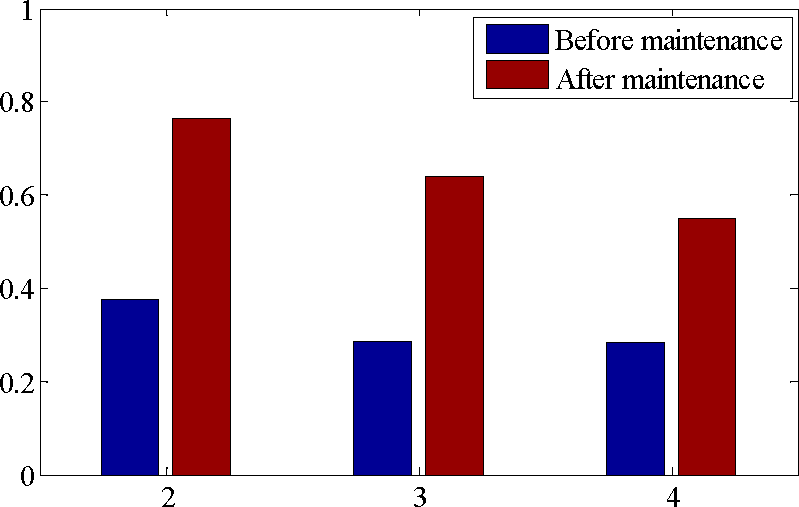
4.4. Discussion of the Operational Reliability before and after Maintenance

When mechanical equipment is undergoing performance degradation or some fault occurs in the equipment, its operational condition will become more and more uncertain. Therefore, the normalized lifting wavelet entropy will increase and the equipment operational reliability will correspondingly decrease.
The operational reliability before and after maintenance is contrasted in Figure 22, where it is seen that the operational reliability after maintenance is greater than that before maintenance at different levels l of the lifting wavelet package transform. From Table 1, it is shown that all of the calculated operational degrees of reliability from level l = 2 to level l = 4 are near 0.5, which illustrates that the current machinery condition is poor and maintenance is needed. After overhauling, many cracks and fragments were found on the #3 bearing bush of the gearbox, so it is concluded that performance degradation of mechanical equipment in long time usage will decrease the operational reliability and finally induce cracks or faults, which demand timely repair and maintenance.
After maintenance, all of the calculated operational reliability degrees from level l = 2 to level l = 4 are over 0.7, the highest of which is 0.9444 in level l = 2. From Table 2, it is shown that repair and maintenance in time can increase the operational reliability of mechanical equipment and avoid the occurrence of accidents, so it is concluded that the proposed operational reliability assessment from condition monitoring information can assure the machinery safety and serve as a basis for condition- based maintenance.

4.5. Discussion of Operational Reliability Influenced by Decomposition Level l

From Tables 1 and 2, it is seen that the degree of reliability value uniformly and monotonously decreases from level l = 2 to level l = 4. When the decomposition level l increases, the number of frequency bands is increased and the initially concentrated energy is scattered with the increased frequency bands. With the increased frequency bands, each frequency band occupies a certain energy and the distribution becomes more uncertain. Since the more uncertain probability distribution has more entropy, the normalized lifting wavelet entropy is added and the operational reliability is decreased with increased frequency bands. Therefore, the defined normalized lifting wavelet entropy should be computed at an appropriate level l in order to achieve a reasonable operational reliability. In this case, level l = 3 is thought as the most suitable level since it is an intermediate level between level l = 2 to level l = 4, which is not too large or too small.

5. Conclusions

A new machinery operational reliability assessment approach using the normalized lifting wavelet entropy from condition monitoring information is proposed, which is realized by analyzing condition monitoring information of mechanical equipment. The monitored vibration signals of mechanical equipment are analyzed by a lifting wavelet package transform. The relative energy in each reconstructed signal is computed as an energy percentage of the reconstructed signal in the whole signal energy. Moreover, a normalized lifting wavelet entropy is defined by the relative energy to describe the machinery operational uncertainty of a system instead of the classical probability. Finally, a degree of operational reliability is defined by the quantitative value obtained by the normalized lifting wavelet entropy in the range of [0, 1]. Since the lifting wavelet package transform meets the demands of the transient signal analysis and the normalized lifting wavelet entropy is associated with the measurements of information uncertainty, it is feasible to evaluate operational reliability with the proposed normalized lifting wavelet entropy from condition monitoring information. The proposed method is applied in operational reliability assessment of the gearbox in an oxy-generator compressor, which attains the desired result of identifying the existence of faults.

Acknowledgments

This work is supported by National Natural Science Foundation of China (No. 51405028), China Postdoctoral Science Foundation funded project (No. 2015M572553), National Natural Science Foundation of China (No. 51225501) and the Fundamental Research Funds for the Central Universities of China, Chang’an University (No. 2013G1502046).

Author Contributions

The individual contribution of each co-author to the reported research and writing of the paper are as follows: XiaoLi Zhang contributed significantly to the data analysis and wrote the whole manuscript. BaoJian Wang and HongRui Cao performed experiments and data analysis. Bing Li and XueFeng Chen helped perform the analysis with constructive discussions. All authors have read and approved the final manuscript.

Conflicts of Interest

The authors declare no conflict of interest.

References

  1. Saleh, J.H.; Marais, K. Highlights from the Early (and Pre-) history of Reliability Engineering. Reliab. Eng. Syst. Saf. 2006, 91, 249–256. [Google Scholar]
  2. Zio, E. Reliability Engineering: Old Problems and New Challenges. Reliab. Eng. Syst. Saf. 2009, 94, 125–141. [Google Scholar]
  3. Goode, K.B.; Moore, J.; Roylance, B.J. Plant Machinery Working Life Prediction Method Utilizing Reliability and Condition-monitoring Data. Proc. Inst. Mech. Eng. E 2000, 214, 109–122. [Google Scholar]
  4. Arnaiz, A.; Ferreiro, S.; Buderath, M. New Decision Support System Based on Operational Risk Assessment to Improve aircraft Operability. Proc. Inst. Mech. Eng. O 2010, 224, 137–147. [Google Scholar]
  5. Vinnem, J.E.; Seljelid, J.; Haugen, S.; Sklet, S.; Aven, T. Generalized Methodology for Operational Risk Analysis of Offshore Installations. Proc. Inst. Mech. Eng. O 2009, 223, 87–97. [Google Scholar]
  6. Baraldi, P.; Di Maio, F.; Pappaglione, L.; Zio, E.; Seraoui, R. Condition Monitoring of Electrical Power Plant Components During Operational Transients. Proc. Inst. Mech. Eng. O 2012, 226, 568–583. [Google Scholar]
  7. Wang, Y.F.; Gao, X.; Sun, H.X.; Jia, Q.X.; Zhao, W.C.; Du, M.T. Research on Control Method Based on Real-time Operational Reliability Evaluation for Space Manipulator. Adv. Mech. Eng. 2014, 2014, 179239. [Google Scholar]
  8. Sun, C.; He, Z.J.; Cao, H.R.; Zhang, Z.S.; Chen, X.F.; Zuo, M.J. A Non-probabilistic Metric Derived from Condition Information for Operational Reliability Assessment of Aero-engines. IEEE Trans. Reliab. 2014, 64, 167–181. [Google Scholar]
  9. Chen, B.J.; Chen, X.F.; Li, B.; He, Z.J.; Cao, H.R.; Cai, G.G. Reliability Estimation for Cutting Tools Based on Logistic Regression Model Using Vibration Signals. Mech. Syst. Signal Process. 2011, 25, 2526–2537. [Google Scholar]
  10. Hua, C.; Zhang, Q.; Xu, G.H.; Zhang, Y.Z.; Xu, T. Performance Reliability Estimation Method Based on Adaptive Failure Threshold. Mech. Syst. Signal Process. 2013, 36, 505–519. [Google Scholar]
  11. Sanyal, N.; Chatterjee, A.; Munshi, S. An Adaptive Bacterial Foraging Algorithm for Fuzzy Entropy Based Image Segmentation. Expert Syst. Appl. 2011, 38, 15489–15498. [Google Scholar]
  12. Song, W.Q.; Zhang, J. Tool State Detection by Harmonic Wavelet and Sample Entropy. Chin. J. Mech. Eng. 2011, 24, 1068–1073. [Google Scholar]
  13. Jiang, Y.; Peng, C.K.; Xu, Y.S. Hierarchical Entropy Analysis for Biological Signals. J. Comput. Appl. Math. 2011, 236, 728–742. [Google Scholar]
  14. Kreitmeier, W.; Linder, T. High-resolution Scalar Quantization with Renyi Entropy Constraint. IEEE Trans. Inf. Theory. 2011, 57, 6837–6859. [Google Scholar]
  15. Sigalov, D.; Shimkin, N. Cross Entropy Algorithms for Data Association in Multi-target Tracking. IEEE Trans. Aerosp. Electron. Syst. 2011, 47, 1166–1185. [Google Scholar]
  16. Bafroui, H.H.; Ohadi, A. Application of Wavelet Energy and Shannon Entropy for Feature Extraction in Gearbox Fault Detection under Varying Speed Conditions. Neurocomputing 2014, 133, 437–445. [Google Scholar]
  17. El Safty, S.; El-Zonkoly, A. Applying Wavelet Entropy Principle in Fault Classification. Int. J. Electr. Power. 2009, 31, 604–607. [Google Scholar]
  18. Lin, J.L.; Liu, J.Y.C.; Li, C.W.; Tsai, L.F.; Chung, H.Y. Motor Shaft Misalignment Detection Using Multiscale Entropy with Wavelet Denoising. Expert Syst. Appl. 2010, 37, 7200–7204. [Google Scholar]
  19. Ren, W.X.; Sun, Z.S. Structural Damage Identification by Using Wavelet Entropy. Eng. Struct. 2008, 30, 2840–2849. [Google Scholar]
  20. Chen, J.K.; Li, G.Q. Tsallis Wavelet Entropy and its Application in Power Signal Analysis. Entropy 2014, 16, 3009–3025. [Google Scholar]
  21. Ekici, S.; Yildirim, S.; Poyraz, M. Energy and Entropy-based Feature Extraction for Locating Fault on Transmission Lines by Using Neural Network and Wavelet Packet Decomposition. Expert Syst. Appl. 2008, 34, 2937–2944. [Google Scholar]
  22. Sweldens, W. The Lifting Scheme: A Construction of Second Generation Wavelets. SIAM J. Math. Anal. 1998, 29, 511–546. [Google Scholar]
  23. Daubechies, I.; Sweldens, W. Factoring Wavelet Transforms into Lifting Steps. J. Fourier Anal. Appl. 1998, 4, 247–269. [Google Scholar]
  24. Li, Z.; He, Z.J.; Zi, Y.Y.; Jiang, H.K. Rotating Machinery Fault Diagnosis Using Signal-adapted Lifting Scheme. Mech. Syst. Signal Process. 2008, 22, 542–556. [Google Scholar]
  25. Huang, Y.X.; Liu, C.L.; Zha, X.F.; Li, Y.M. An Enhanced Feature Extraction Model Using Lifting-based Wavelet Packet Transform Scheme and Sampling-importance-resampling Analysis. Mech. Syst. Signal Process. 2009, 23, 2470–2487. [Google Scholar]
  26. Yang, Z.J.; Cai, L.G.; Gao, L.X.; Wang, H.Q. Adaptive Redundant Lifting Wavelet Transform Based on Fitting for Fault Feature Extraction of Roller Bearings. Sensors 2012, 12, 4381–4398. [Google Scholar]
  27. Liao, Q.; Li, X.B.; Huang, B. Hybrid Fault-feature Extraction of Rolling Element Bearing via Customized-lifting Multi-wavelet Packet Transform. Proc. Inst. Mech. Eng. C 2013. [Google Scholar] [CrossRef]
  28. Shannon, C.E. A Mathematical Theory of Communication. Bell Syst. Tech. J 1948, 27, 379–423. [Google Scholar]
  29. Shannon, C.E. Communication Theory of Secrecy Systems. Bell Syst. Tech. J 1949, 28, 656–715. [Google Scholar]
  30. Sweldens, W. The Lifting Scheme: A Custom-design Construction of Biorthogonal Wavelets. Appl. Comput. Harmon. A 1996, 3, 186–200. [Google Scholar]
Figure 1. Illustration of signal decomposition and reconstruction using lifting scheme.
Entropy 17 03479f1
Figure 2. Illustration of operational reliability assessment with normalized lifting wavelet entropy.
Entropy 17 03479f2
Figure 3. Illustration of the forward transform of lifting wavelet package transform.
Entropy 17 03479f3
Figure 4. The picture of oxy-generator compressor.
Entropy 17 03479f4
Figure 5. The structure diagram of the gearbox in the oxy-generator compressor.
Entropy 17 03479f5
Figure 6. The waveform of the vibration signal in time domain.
Entropy 17 03479f6
Figure 7. The Fast Fourier Transform spectrum of the vibration signal.
Entropy 17 03479f7
Figure 8. Signal analysis by lifting wavelet package transform in level 2.
Entropy 17 03479f8
Figure 9. The relative energy distribution in level 2.
Entropy 17 03479f9
Figure 10. Signals analysis by lifting wavelet package transform in level 3.
Entropy 17 03479f10
Figure 11. The relative energy distribution in level 3.
Entropy 17 03479f11
Figure 12. Signals analysis by lifting wavelet package transform in level 4.
Entropy 17 03479f12
Figure 13. The relative energy distribution in level 4.
Entropy 17 03479f13
Figure 14. The waveform of the vibration signal in time domain after maintenance.
Entropy 17 03479f14
Figure 15. The FFT spectrum of the vibration signal after maintenance.
Entropy 17 03479f15
Figure 16. Signals analysis by lifting wavelet package transform in level 2 after maintenance.
Entropy 17 03479f16
Figure 17. The relative energy distribution in level 2 after maintenance.
Entropy 17 03479f17
Figure 18. Signals analysis by lifting wavelet package transform in level 3 after maintenance.
Entropy 17 03479f18
Figure 19. The relative energy distribution in level 3 after maintenance.
Entropy 17 03479f19
Figure 20. Signals analysis by lifting wavelet package transform in level 4 after maintenance.
Entropy 17 03479f20
Figure 21. The relative energy distribution in level 4 after maintenance.
Entropy 17 03479f21
Figure 22. Operational reliability of two conditions (before and after maintenance) in different levels.
Entropy 17 03479f22
Table 1. The normalized lifting wavelet entropy and the reliability degree before maintenance.
Lifting wavelet package levelNormalized lifting wavelet entropyDegree of reliability
l = 20.62290.6120
l = 30.71240.4924
l = 40.71730.4854
Table 2. The normalized lifting wavelet entropy and the degree of reliability after maintenance.
Lifting wavelet package levelNormalized lifting wavelet entropyDegree of reliability
l = 20.23580.9444
l = 30.36080.8698
l = 40.45080.7968

