Abstract
The structural design process is iterative and involves many design parameters. Thus, this paper presents a controlled framework for selecting the adequate structural floor system for reinforced concrete buildings and efficiently utilizing the corresponding construction materials. Optimization was performed using an evolutionary algorithm to minimize the total construction cost, considering the costs of concrete, steel reinforcement, formwork, and labor. In the problem formulation, the characteristic compressive strength of concrete was treated as a design variable because it affects the mechanical performance of concrete. The design variables included the column spacings, concrete dimensions, and steel reinforcement of different structural components. The constraints reflected the Egyptian code of practice provisions. Because the choice of the structural floor system affects the design details, three systems were considered: solid slabs, flat slabs with drop panels, and flat slabs without drop panels. Two benchmark examples were presented, and the optimal design results of the structural floor systems were compared. The solid slab system had the lowest construction cost among the three structural floor systems. Comparative diagrams were developed to investigate the distribution of construction costs of each floor system. The results revealed that an adequate choice of design variables could save up to 17% of the building’s total construction cost.
1. Introduction
Reinforced concrete (RC) has been extensively used in building construction for its versatility and ease of construction []. The first step in any structural design process is choosing a proper structural system. This step is followed by specifying a concrete grade and determining preliminary concrete dimensions of the structural elements. Then, structural analysis is performed. The required steel reinforcement is then calculated to enhance the mechanical performance of structural elements such as ductility, tensile strength, and creep resistance [,,,,,]. Finally, the ultimate limit state and serviceability limit state requirements provided by design codes are checked [,,,]. If any design provision is not satisfied, the concrete dimensions should be adjusted, and accordingly, re-analysis of the structure is performed []. From the steps mentioned above, it can be concluded that the design problem involves many dependent and independent variables; therefore, the design process is iterative and time-consuming []. For these reasons, researchers have been exploring different optimization techniques to reduce the computational time and minimize the overall construction cost [,,,]. The optimization techniques investigated include the firefly algorithm [], simulated annealing [,,], and genetic algorithm [,,]. Several studies used different algorithms built in the solver tool provided by Microsoft Excel [,,].
The majority of previous studies focused on the optimization of individual RC structural elements, such as slabs [,,], beams [,,], columns [,,], footings [,,], and retaining walls [,,]. The design procedures in these studies were subjected to specific code restrictions, such as the American concrete institute (ACI 318-19, ACI 318-14, ACI 318-05), Indian standards (IS: 456), Eurocode 2 (EN 1992-1-1:2004/A1:2014), and Brazilian standards (ABNT NBR 6118:2014, ABNT NBR 6118:2007). The design variables were limited to the structural element’s concrete dimensions and steel reinforcement. Several studies performed design optimization of RC three-dimensional large-scale structures with a single structural floor system [,,,]. Sahab et al. [] performed cost optimization of buildings with flat slabs without drop panels, and they determined the optimal concrete dimensions and steel reinforcement of floors and columns. They also examined the effects of the column spacings on the optimal construction costs and found significant cost savings when the most economic column spacing was considered. Ženíšek et al. [] studied the effects of ten concrete grades on the optimal construction costs of load-bearing structures. They investigated the effects of column spacings on the optimal results by considering two span variants (4 m and 8 m). Dehnavipour et al. [] performed cost optimization of multi-story frames and determined the optimal concrete dimensions and steel reinforcement of beams and columns. Boscardin et al. [] developed an optimization model to obtain the minimum construction cost of multi-story frames considering the steel reinforcement of columns and the concrete dimensions of beams and columns as design variables. The model was designed to investigate the effects of this automation on the optimal results. In another attempt, Robati et al. [] conventionally designed a multi-story building by considering two structural floor systems and two types of concrete: flat slab with normal weight concrete, flat slab with ultra-lightweight concrete, waffle slab with normal weight concrete, and waffle slab with ultra-lightweight concrete. The authors found that the most economical design alternative was the waffle slab with normal weight concrete, which saved up to 7% on material consumption.
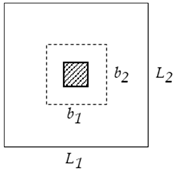
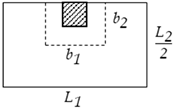
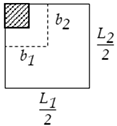
Despite the intensive efforts of the researchers to minimize the costs of RC buildings, little attention was paid to considering different structural floor systems. Thus, the main aim of the current study was to determine the most economical structural floor system. To this end, three different structural floor systems were considered: solid slabs (SS), flat slabs with drop panels (FSDP), and flat slabs without drop panels (FS). Figure 1 provides a scheme of the building for each structural floor system. The structural components of each system were designed in accordance with the Egyptian code of practice for the design and construction of concrete structures (ECP 203-18) [].
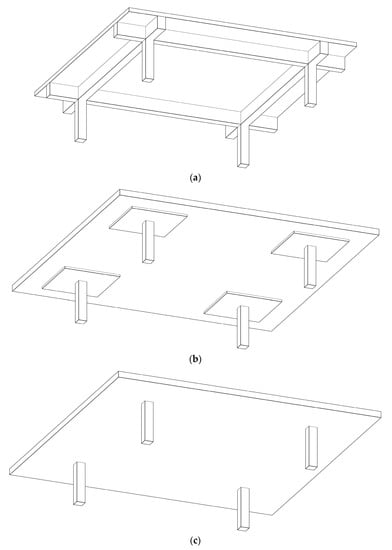
Figure 1.
Building schemes for different structural floor systems considered in the current study: (a) solid slabs (SS); (b) flat slabs with drop panels (FSDP); (c) flat slabs without drop panels (FS).
The design variables in most studies were limited to the concrete dimensions and steel reinforcement, neglecting the concrete characteristic compressive strength and column spacings. The authors considered as a design variable because it influences the mechanical performance of RC elements (i.e., elastic modulus, flexural strength, shear strength, punching strength, etc.). Accordingly, the concrete dimensions of structural components are dependent on . As increases, the unit price of concrete increases and, consequently, the construction cost increases. Likewise, the column spacings were considered as design variables because they affect the straining actions (i.e., axial compressive loads, bending moments, shear loads), deflections, and choice of the concrete dimensions of the structural components. The design variables also included the optimal concrete dimensions and steel reinforcement of structural components. The objective function of the optimization problem was expressed in a mathematical formula, where the minimum construction cost of the floors and columns was sought. The construction cost of foundations was not included in the problem formulation because it is greatly dependent on the geotechnical properties of the soil. The solver tool provided by Microsoft Excel was used to perform the cost optimization. Comparative diagrams were developed to compare the optimal costs of construction materials and labor for different structural floor systems.
2. Structural Design
The structural design started with calculating the applied loads. These loads were calculated as per the Egyptian code for calculating loads and forces in structural and building works (ECL) []. Then, structural analysis was performed to obtain the straining actions. Finally, the concrete dimensions and steel reinforcement were determined to fulfill the design requirements. The design procedures of the slabs, beams, and columns are summarized in the following subsections.
2.1. RC Slabs
In the current study, the structural analysis of solid slabs and flat slabs was performed using the empirical methods provided by ECP 203-18 []. In the case of solid slabs, a strip of 1 m width was analyzed in the long and short directions. In the case of flat slabs, a column strip (a strip in the region of columns) and a field strip (a middle strip between the column strips) were analyzed in the long and short directions. Figure 2 shows the analyzed strips of slabs for each structural floor system. The design steps can be summarized as follows.
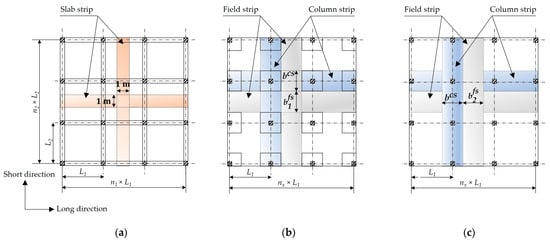
Figure 2.
Analyzed strips of slabs for each structural floor system: (a) SS; (b) FSDP; (c) FS.
Step 1. Checking the rectangularity of the slabs as per Equation (1).
where and are the column spacings in the long and short directions, respectively.
Step 2. For flat slabs, calculation of the column strip width , the field strip width in the long direction , and the field strip width in the short direction using Equations (2)–(4), respectively.
Step 3. Determining the preliminary slab thickness using Equation (5).
Step 4. For flat slabs with drop panels, determining the preliminary drop panel thickness using Equation (6) and the preliminary drop panel square width using Equation (7).
Step 5. Determining the preliminary width of each column utilizing Equation (8).
where cl represents the column under consideration and is the number of columns in a typical story.
Step 6. Calculation of the uniform load applied to the slabs utilizing Equation (9); this depends on the dead load g and the live load p. The dead load g is calculated using Equation (10), while the live load p is provided using ECL based on the function of the building [].
where is the unit weight of reinforced concrete; is the flooring load; is the partition wall load.
Step 7. Calculation of the applied bending moments and at each critical cross-section of the long and short directions, respectively, as per Equations (11) and (12).
where and are the coefficients obtained from ECP 203 based on the slab rectangularity; is a factor obtained from ECP 203-18 based on the location of the critical cross-section; s represents the critical cross-section under consideration; is the number of critical cross-sections; and and are percentages of the total bending moment for the column strip and field strips, respectively. These percentages are obtained from ECP 203-18, depending on the location of the critical cross-section.
Step 8. Calculation of the maximum permissible bending moment using Equation (13).
where is a factor obtained from ECP 203-18 and is based on the value of the yield strength of the longitudinal steel reinforcement , is the width of the slab cross-section, is the effective depth of the slab, and is the safety reduction factor for concrete obtained from ECP 203-18.
Step 9. Checking that and at each critical cross-section does not exceed .
Step 10. Calculation of the required steel reinforcement area for each critical cross-section in the long and short directions as per Equation (14).
where is the safety reduction factor for the steel reinforcement obtained from ECP 203-18 and is the applied bending moment in the direction under consideration.
Step 11. Calculation of the minimum and maximum permitted areas of steel reinforcement and , respectively, as per Equations (15) and (16).
where is the maximum permitted distance between the neutral axis and extreme compression fibers. The ratio is obtained from ECP 203-18 and is based on the value of .
Step 12. Selecting the bar diameter for each critical cross-section in the long and short directions, which shall be greater than or equal to 10 mm. This step is followed by determining the number of bars per meter for each critical cross-section in the long and short directions as per Equation (17).
Step 13. Calculation of the chosen steel reinforcement area for each critical cross-section in the long and short directions.
Step 14. Checking that satisfies the limits provided by Equation (18).
Step 15. Determining the shrinkage steel reinforcement area in each direction that satisfies the temperature and cracking requirements utilizing Equation (19).
where is the area of the maximum bottom steel reinforcement in each direction.
Step 16. Calculation of the tensile strength of concrete using Equation (20).
Step 17. Calculation of the cracking bending moment as per Equation (21).
where is the gross moment of inertia of the slab cross-section, neglecting the cross-sectional area of steel reinforcement, and is the distance from the neutral axis to the extreme tension fibers of the slab gross cross-section.
Step 18. Calculation of the unfactored applied bending moments , , and resulting from the dead, live, and total loads, respectively, as per Equations (22)–(24), respectively.
Step 19. Calculation of the elastic modulus of concrete as per Equation (25).
Step 20. Determining the distance from the neutral axis and the extreme compression fibers of the slab cracked cross-section at the midspan using Equation (26).
where n is the modular ratio of concrete to steel, and and are the chosen areas of the maximum bottom reinforcement in the long and short directions, respectively.
Step 21. Calculation of the moment of inertia of the slab cracked cross-section at the midspan as per Equation (27). Figure 3 illustrates the cracking modes of slabs against applied bending moments.
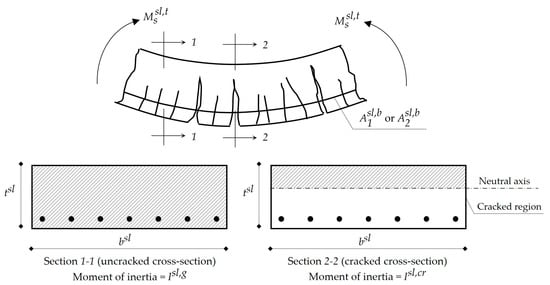
Figure 3.
Cracking modes of slabs against applied bending moments.
Step 22. Calculation of the effective moment of inertia of the slab cross-section at the midspan as per Equation (28).
where is the unfactored applied bending moment resulting from the total load at the midspan.
Step 23. Calculation of the short-term deflections , , and at the midspan resulting from the dead, live, and total loads, respectively, as per Equations (29)–(31).
where , , and are the unfactored applied bending moments resulting from the dead load at the midspan, left support, and right support, respectively.
Step 24. Calculation of the total long-term deflection at the midspan utilizing Equation (32).
where is a factor obtained from ECP 203-18 to consider the effects of creep.
Step 25. Checking that does not exceed the permitted deflection imposed by ECP 203-18 as per Equation (33).
Step 26. Check the punching shear stresses, where this shall be applied for flat slabs only because the presence of beams eliminates the risk of punching shear failure. The check starts with determining the effective depth which resists the punching shear stresses as per Equation (34).
Step 27. For each slab–column connection, calculation of the critical shear perimeter , the critical shear area , and the tributary area . These calculations are presented in Table 1, where the critical cross-section for punching shear is at a distance 0.5 from the column face.

Table 1.
Critical shear parameters at the slab–column connections.
Step 28. Calculation of the applied punching shear load as per Equation (35).
Step 29. Calculation of the applied punching shear stress using Equation (36).
where is a factor obtained from ECP 203-18 based on the column location.
Step 30. Calculation of the nominal concrete punching shear strength utilizing Equation (37).
where is a factor obtained from ECP 203-18 based on the column location.
Step 31. Checking that does not exceed the corresponding .
2.2. RC Beams
In the current study, the beams existed only in the solid slab structural floor system, and these were classified into four groups: interior beams in the long direction, interior beams in the short direction, edge beams in the long direction, and edge beams in the short direction. Using a conservative approach, all cross-sections of beams were designed as rectangular sections. Figure 4 illustrates the typical arrangement of the steel reinforcement of a beam. In practice, the concrete dimensions of all beams in a typical story are the same to attain simpler formwork, and these are reflected in the following design steps.
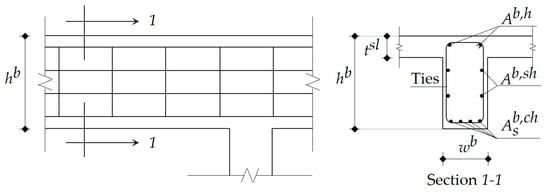
Figure 4.
Typical arrangement of the steel reinforcement of a beam.
Step 1. Determining the preliminary beam height utilizing Equation (38).
where b represents the beam under consideration and is the number of beams in a typical story.
Step 2. Determining the preliminary beam width using Equation (39).
where is the partition wall thickness.
Step 3. Checking that the span-to-depth ratio of each beam is greater than or equal to 4, where is the beam span length and is the effective depth of the beam (the distance between the steel reinforcement and the extreme compression fibers of the beam).
Step 4. Checking the side buckling for each beam. This can be achieved when the span is less than or equal to the two values and .
Step 5. Calculation of the uniform load applied on each beam as per Equation (40).
where is the number of slabs supported by the beam under consideration (i.e., equals 1 for edge beams and 2 for interior beams) and is a coefficient obtained from ECP 203-18 based on the direction under consideration.
Step 6. Calculation of the applied bending moment at each critical cross-section of the beam under consideration as per Equation (41).
where is the beam span length, is a factor obtained from ECP 203-18 and is based on the location of the critical cross-section, and is the number of critical cross-sections of a beam.
Step 7. Calculation of the maximum permissible bending moment for each beam utilizing Equation (42).
Step 8. Checking that at each critical cross-section of each beam does not exceed the corresponding .
Step 9. Calculation of the required steel reinforcement area for each critical cross-section of each beam using Equation (43).
Step 10. Calculation of the minimum and maximum permitted areas of steel reinforcement and , respectively, for each critical cross-section of each beam as per Equations (44) and (45).
Step 11. Determining the beam bar diameter , where this shall be greater than or equal to 10 mm. This step is followed by determining the number of bars for each critical cross-section of each beam as per Equation (46).
Step 12. Calculation of the chosen steel reinforcement area for each critical cross-section of each beam.
Step 13. Checking that for each critical cross-section of each beam satisfies the limits provided by Equation (47).
Step14. Determining the shrinkage steel reinforcement area for each beam that satisfies the temperature and cracking requirements as per Equation (48).
where is the area of the maximum bottom steel reinforcement for each beam.
Step15. Determining the top steel reinforcement area required to hang the lateral ties for each beam as per Equation (49).
Step 16. Calculation of the cracking bending moment as per Equation (50).
where is the gross moment of inertia of the beam cross-section, neglecting the cross-sectional area of steel reinforcement, and is the distance from the neutral axis to the extreme tension fibers of the beam gross cross-section.
Step 17. Calculation of the unfactored applied bending moments , , and resulting from the dead load, live load, and total load, respectively, at each critical cross-section of each beam using Equations (51)–(53).
Step 18. Determining the distance from the neutral axis and the extreme compression fibers of the cracked cross-section of each beam at the midspan using Equation (54).
Step 19. Calculation of the cracked moment of inertia for each beam at the midspan as per Equation (55).
Step 20. Calculation of the effective moment of inertia for each beam at the midspan as per Equation (56).
where is the unfactored applied bending moment resulting from the total load at the midspan of each beam.
Step 21. Calculation of the short-term deflections , , and resulting from the dead load, live load, and total load, respectively, at the midspan of each beam using Equations (57)–(59), respectively.
where , , and are the unfactored applied bending moments resulting from the dead load at the midspan, left support, and right support, respectively; , , and are the unfactored applied bending moments resulting from the live load at the midspan, left support, and right support, respectively.
Step 22. Calculation of the long-term deflection at the midspan of each beam as per Equation (60).
Step 23. Checking that does not exceed the permitted deflection imposed by ECP 203-18 as per Equation (61).
Step 24. Calculation of the applied shear load at the critical cross-section of each beam, i.e., at a distance 0.5 from the corresponding column face using Equation (62).
Step 25. Calculation of the applied shear stress at the critical cross-section of each beam as per Equation (63).
Step 26. Calculation of the maximum shear strength using Equation (64).
Step 27. Checking that does not exceed .
Step 28. Calculation of the concrete nominal shear strengths and in the uncracked and cracked stages, respectively, utilizing Equations (65) and (66).
Step 29. Determining the shear stress of the vertical ties for each beam as per Equation (67).
Step 30. Determining the number of branches of the vertical ties for each beam utilizing Equation (68).
Step 31. Determining the spacing between vertical ties for each beam that satisfies the shear stress requirements provided by Equation (69).
where is the area of the vertical ties for each beam.
Step 32. Checking that is greater than or equal to 100 mm.
2.3. RC Columns
According to ECP 203-18, the columns should be designed to resist the axial loads and bending moments. In the current study, the columns were classified into four groups based on their locations: interior columns, edge columns in the x-direction, edge columns in the y-direction, and corner columns. For simplification, each group had a square cross-section. Three steel reinforcement arrangements were utilized to satisfy the design provisions (Figure 5). Each arrangement had a specific number of vertical bars and a shape of lateral ties based on the column width . The design steps can be summarized as follows.
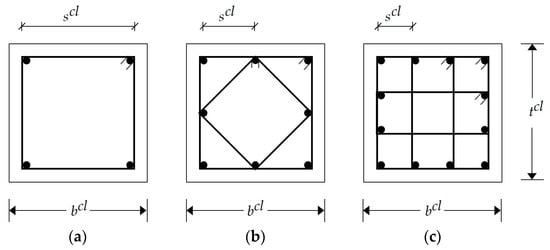
Figure 5.
Possible steel reinforcement arrangements for columns: (a) 4 bars; (b) 8 bars; (c) 12 bars.
Step 1. Calculation of the concrete cross-sectional area of each column.
Step 2. Calculation of the axial design load for each column using Equation (70).
where N is the number of stories, is a shear coefficient obtained from ECP 203-18 based on the column location, is the reaction of a beam at the beam–column connection under consideration, and H is the typical story height.
Step 3. Determining the steel arrangement of each column. The spacing between two adjacent bars shall not exceed 250 mm.
Step 4. Determining the bar diameter for each column, which shall be greater than or equal to 12 mm.
Step 5. Calculation of the chosen vertical steel reinforcement area of each column.
Step 6. Checking that of each column fulfills the reinforcement limits provided by Equation (71).
Step 7. Determining the number of lateral ties per meter for each column as per Equation (72).
Step 8. Calculation of the volume of steel lateral ties per meter for each column.
Step 9. Checking that for each column is greater than or equal to .
Step 10. Calculation of the maximum axial load that each column can withstand as per Equation (73).
Step 11. Checking that the axial design load for each column does not exceed the corresponding .
Step 12. For flat slabs only, calculation of the design bending moment transferred from the slabs to the columns utilizing Equation (74).
where is a factor obtained from ECP 203-18 based on the column location.
Step 13. For flat slabs only, constructing an interaction diagram for each column to check its safety. In this diagram, five points (i.e., combinations of axial loads and bending moments) were used to represent the failure envelope, i.e., the boundaries of the diagram (Figure 6).
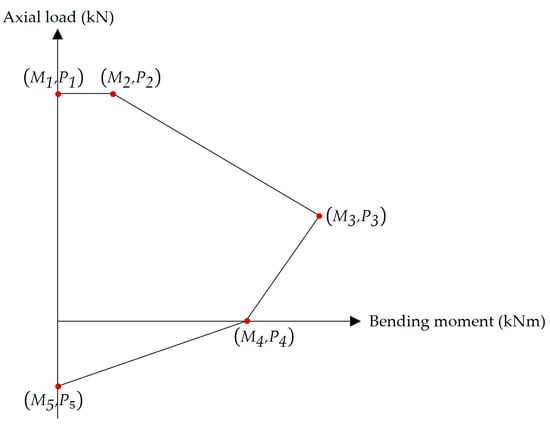
Figure 6.
Typical interaction diagram for eccentrically loaded columns.
- Point 1 represents the pure axial compression failure mode. Here, the axial load equals .
- Point 2 represents the compression failure mode with minimum eccentricity. The bending moment can be calculated using Equation (75). The minimum eccentricity permitted by ECP 203-18 is expressed in Equation (76).
- Point 3 represents the balanced failure mode (i.e., the concrete failure and steel reinforcement yielding occur simultaneously). The axial load and the bending moment are expressed in Equations (77) and (78), respectively.where is the area of steel reinforcement on the compression side, is the area of steel reinforcement on the tension side, is the length of the equivalent rectangular stress block, is the distance from the plastic centroid to the extreme compression fibers of the column cross-section, is the distance from the center of compressive bars to the extreme compression fibers of the column cross-section, and is the distance from the center of tensile bars to the extreme compression fibers of the column cross-section.
- Point 4 represents the pure bending failure mode. The bending moment can be calculated using Equation (79).
- Point 5 represents the pure axial tension failure. The axial load can be calculated using Equation (80).
Step 14. For flat slabs only, checking the adequacy of each column. This step can be achieved by ensuring that the axial load and the bending moment for the column under consideration exist within the interaction diagram boundaries.
3. Construction Cost Parameters
The total cost of a construction project consists of a set of direct costs and indirect costs. The direct costs include materials and labor costs, while the indirect costs include accounting services, administration, and site overhead. The indirect costs are often independent of the design parameters. Thus, the current study considers the direct costs of the skeleton structure of the RC building. Here, the costs of concrete, steel reinforcement, formwork, and labor of floors and columns are considered.
In practice, the concrete cost is calculated by multiplying the concrete volume by the unit price of concrete , which is based on the concrete grade. The steel reinforcement cost is calculated by multiplying the steel reinforcement weight by the unit price of steel reinforcement . In Egypt, the cost of formwork and labor is calculated by multiplying the concrete volume by the unit price of the formwork and labor . Here, was assumed to be the same for all structural floor systems. To illustrate one of the features of the optimization problem, the unit prices , , and in the past five years (2017–2021) are depicted in Figure 7. The unit prices and presented in Figure 7a were obtained from the monthly bulletins of average retail prices of major important building materials provided by the Ministry of Housing, Utilities, and Urban Communities in Egypt. The unit price presented in Figure 7b represents the average yearly unit prices and was obtained from several construction sites in Egypt. It can be observed that the unit prices of materials have been fluctuating inconsistently. For instance, increased from 516 USD/ton to 746 USD/ton (45% increase) in 3 months. The unit price remained constant (39 USD/m3) for 17 months before increasing to 46 USD/m3 in December 2021. The unit price increased linearly. The fluctuation of the unit prices may change the shape of the optimization problem and, consequently, affect the best design results. Table 2 summarizes the considered unit prices.
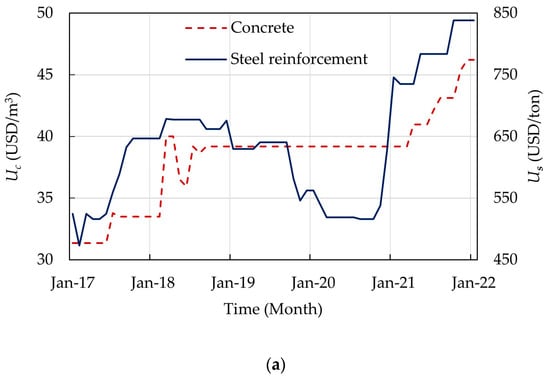
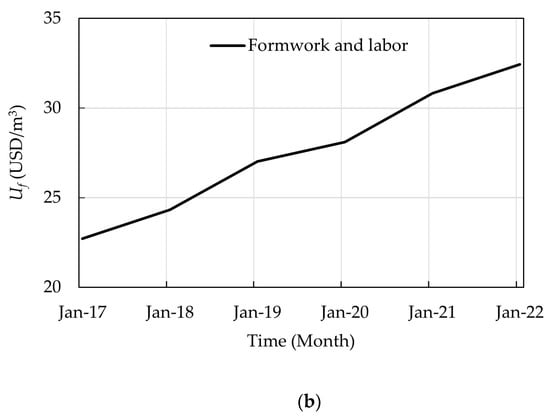
Figure 7.
Average unit prices in the past five years (2017–2021) in Egypt: (a) concrete and steel reinforcement; (b) formwork and labor.
Table 2.
Unit prices of the cost components.
4. Statement of the Problem
4.1. Design Variables
The design variables of the optimization problem are defined in Table 3 and Figure 8 for each structural floor system, including the concrete grades, column spacings, concrete dimensions, and steel reinforcement. The concrete grades utilized in the current study were restricted to those available in the ready-mix plants in Egypt. The column spacings were between 3 m and 8 m to cover the most common spans in a building. The concrete dimensions were rounded to define increments based on the formwork dimensions to fulfill the construction requirements. The bar diameters were chosen from Egypt’s commercial steel bar list.
Table 3.
Design variables of different structural floor systems.
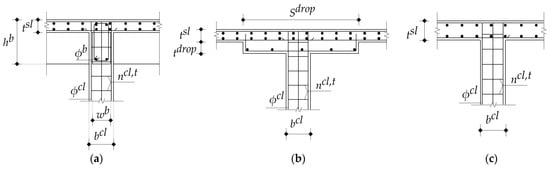
Figure 8.
Design variables regarding concrete dimensions and steel reinforcement of each structural floor system: (a) SS; (b) FSDP; (c) FS.
4.2. Objective Function
The general formulation of the design optimization problem can be expressed as
subject to
where x is the vector of design variables; is the objective function; , , and are the strength inequality constraint functions of slabs, beams, and columns, respectively; , , and are the strength inequality constraint functions of slabs, beams, and columns, respectively; I, J, and K are the number of strength constraints regarding slabs, beams, and columns, respectively; L, M, and O are the number of serviceability constraints regarding slabs, beams, and columns, respectively; and are the lower and upper bounds of the design variable x; and Z is the number of design variables. The strength and serviceability criteria were illustrated in Section 2, while the lower and upper bounds of the design variables were presented in Table 3.
5. Optimization Algorithm
The mathematical model was built using Microsoft Excel 2016 spreadsheets. The model was fully programmed using Visual Basic for Applications (VBA) embedded within Microsoft Excel. Repetitive tasks, such as running the solver tool and constructing tables, were also programmed using VBA. In the current study, each structural floor system had its spreadsheet comprising all the data. This data included the calculations regarding structural analysis; design steps of structural elements; and the construction costs of concrete, steel reinforcement, and formwork and labor.
The evolutionary method was utilized by the solver tool available in Microsoft Excel to perform the optimization for two reasons. First, it uses a variety of algorithms, along with local search methods. It relies on controlled sampling combined with deterministic methods to explore the search space efficiently. Second, it can handle non-smooth and discontinuous functions []. The evolutionary method parameters were the population size, random seed, mutation rate, convergence value, and maximum time without improvement. Table 4 lists the values of the solver parameters used in the model.
Table 4.
Microsoft Excel solver parameters.
6. Benchmark Examples and Discussions
Two benchmark examples with rectangular layouts were optimized (Figure 9). In the first example, two cases were examined to investigate the effects of optimizing the concrete grade and column spacings on the optimal results. The second example investigated the effects of optimizing the columns in the higher stories. The design input data of these examples are listed in Table 5.
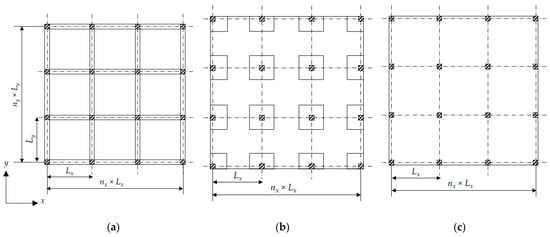
Figure 9.
Typical floor layouts of each structural floor system: (a) SS; (b) FSDP; (c) FS.
Table 5.
Design input data.
6.1. Example 1: A Four-Story Building
A four-story building with a rectangular layout and a 3.3 m typical story height was considered. The total lengths of the building in the x- and y-directions were 30 m and 25 m, respectively. In case 1, the concrete grade and column spacing in the long and short directions were constant ( = 35 MPa, = 5, and = 5). Here, the design variables were the parameters regarding concrete dimensions and steel reinforcement listed in Table 3. In case 2, the concrete grade and floor spacing in each direction were included in the design variables (i.e., the design variables were all the parameters defined in Table 3).
Five runs were performed to obtain the best optimal solution. During the optimization process, the convergence history of each run was recorded. The convergence history of the best run for each structural floor system is illustrated in Figure 10. The number of iterations of each run was based on the time termination criteria, i.e., maximum time without improvement. The design variables and optimal costs of the best run of each structural floor system are displayed in Table 6 and Table 7. These results are discussed in four sections.
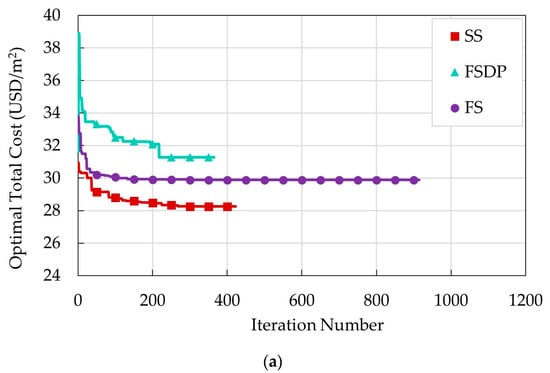
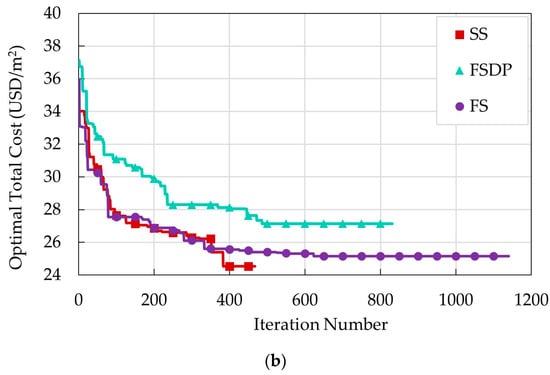
Figure 10.
Convergence history of the best optimal runs of example 1: (a) case 1; (b) case 2.
Table 6.
Summary of the optimal concrete grade, column spacings, concrete dimensions of floors, and costs of floors (example 1).
Table 7.
Summary of the optimal concrete dimensions, steel reinforcement, and costs of columns (example 1).
6.1.1. Effects of Optimizing the Concrete Grade and Column Spacings
This section compares the optimal design results of case 1 and case 2 for each floor system. For all floor systems, the optimal column spacings in case 2 were smaller than the constant column spacings in case 1. Decreasing the column spacings reduced the straining actions (i.e., flexure, shear, and compressive axial loads) and deflections of structural elements. Accordingly, smaller and concrete dimensions and less steel reinforcement were sufficient to satisfy the design requirements of the structural components in case 2. Hence, the construction costs of floors decreased when the concrete grade and column spacings were optimized. As the column spacings decreased in case 2, the number of columns increased, and the concrete dimensions and steel reinforcement of columns decreased. Consequently, the columns in case 2 were more expensive than those in case 1 due to the increased number of columns. The total construction costs in case 2 were 13.2%, 16.7%, and 15.8% less than those of case 1 for SS, FSDP, and FS, respectively.
6.1.2. Comparison between Floor Systems
In both cases, SS was the cheapest and FSDP was the most expensive structural floor system. The slabs of FSDP and FS utilized more steel reinforcement than those of SS slabs to satisfy the shrinkage provisions imposed, as was greater than or equal to 160 mm. Accordingly, the floors construction costs of FSDP and FS were higher than those of solid slabs.
Enhancing the slabs with drop panels reduced the punching stresses at the slab–column connections. Despite the reduction in punching stresses in FSDP compared to FS, results for FSDP and FS were the same in each case. In case 1, a high (200 mm) for FSDP was imposed to satisfy the long-term deflection criteria resulting from the heavy partition wall loads. In case 2, could not be less than the absolute minimum value (160 mm). Consequently, the floors construction costs of FSDP were higher than those of FS due to the presence of drop panels.
In case 1, SS was 9.7% and 5.5% cheaper than FSDP and FS, respectively, and FS was 4.5% cheaper than FSDP. In case 2, SS was 5.9% cheaper than FSDP and 2.5% cheaper than FSDP, and FS was 3.5% cheaper than FSDP.
6.1.3. Distribution of Structural Elements Construction Costs
Figure 11 compares the construction costs of floors and columns for each structural floor system. In both cases, the costs of floors constituted the major part of the total construction costs. Therefore, more attention shall be paid to the optimization of floors. A similar conclusion was reported by other researchers [,]. In case 2, the cost ratio of columns to floors increased as a result of the increased number of columns.
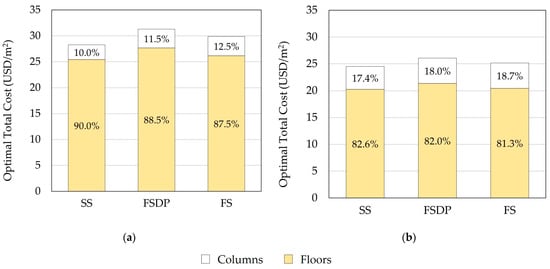
Figure 11.
Comparison of the optimal construction total costs of floors and columns (example 1): (a) case 1; (b) case 2.
6.1.4. Distribution of Materials and Labor Construction Costs
Figure 12 compares the construction costs of materials and labor for each structural floor system. In both cases, the steel reinforcement costs constituted about half the total construction costs as a result of the high unit price of steel reinforcement in Egypt. In contrast, Sahab et al. [] reported that the steel reinforcement costs constituted the lowest construction costs. It should be mentioned that Sahab et al. [] used different unit prices of materials and labor in accordance with Spon’s Architects’ and Builders’ Price Book 2001 [] and Harris [] in London, UK. Thus, the optimal design results may significantly vary based on the considered unit prices in a specific country.
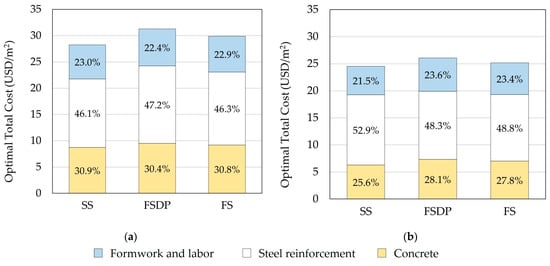
Figure 12.
Comparison of the optimal construction total costs of materials and labor (example 1): (a) case 1; (b) case 2.
6.2. Example 2: A Ten-Story Building
A ten-story building with a rectangular layout and a 3 m typical story height was considered. The total lengths of the building in the x- and y-directions were 35 m and 40 m, respectively. The design variables were all the parameters defined in Table 3. In this example, the concrete dimensions and steel reinforcement of columns were adjusted at three levels, namely, stories 1–4, stories 5–8, and stories 9–10, to reduce the columns’ construction costs. The characteristic strength was considered as a design variable to achieve higher cost savings of columns, as recommended by Boscardin et al. [].
The design variables of the best run of each structural floor system are presented in Table 8 and Table 9. In this example, a higher was utilized to enhance the axial resistance of columns and reduce the long-term deflections of slabs and beams. Because the high enhanced the punching shear resistance at slab–column connections, a low (160 mm) was sufficient to resist the punching shear stresses of FSDP and FS.
Table 8.
Summary of the optimal concrete grade, column spacings, concrete dimensions of floors, and costs of floors (example 2).
Table 9.
Summary of the optimal concrete dimensions, steel reinforcement, and cost of columns (example 2).
The concrete dimensions of SS columns were smaller than those of FSDP and FS. This can be explained in terms of the lower axial loads and lack of punching shear stresses and bending moments at the slab–column connections of SS. At lower story levels, the concrete dimensions of the FSDP columns were larger than those of FS because the chosen for FSDP was less than that of FS.
For all structural floor systems, the optimal concrete dimensions of columns decreased at higher story levels in proportion to the reduced axial loads. However, although the axial loads applied on columns decrease at higher story levels, it can be observed that the concrete dimensions of FS columns did not decrease at stories 9–10. The lower concrete dimensions of FS columns could not resist the punching stresses.
Figure 13 compares the optimal construction costs of the floors for a typical story for each floor system. In terms of the floors construction costs, SS was the cheapest, and FSDP was the most expensive structural floor system.
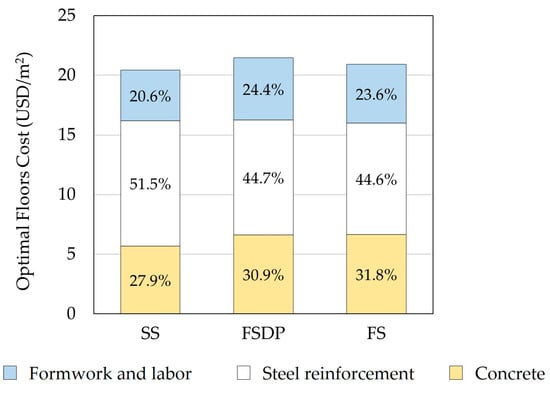
Figure 13.
Comparison of the optimal construction costs of floors (example 2).
Figure 14 compares the optimal construction costs of columns at different story levels for each structural floor system. As the number of stories increased, the columns cost reduction in SS was high compared to the other floor systems. It was verified that reducing the concrete dimensions of columns at higher story levels could achieve high cost savings, as reported by Boscardin et al. []. The total construction costs per building unit area of SS, FSDP, and FS were 25.21 USD/m2, 26.52 USD/m2, and 25.57 USD/m2, respectively. Hence, SS was 4.9% and 1.6% cheaper than FSDP and FS, respectively, and FS was 3.4% cheaper than FSDP.
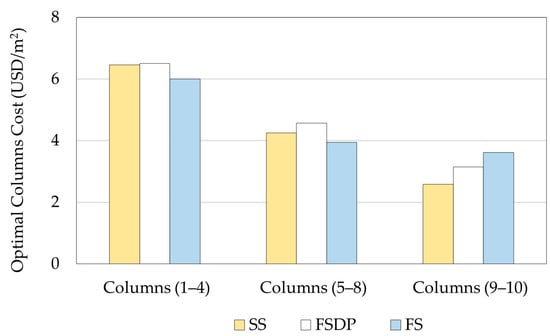
Figure 14.
Comparison of the optimal construction costs of columns at different story levels (example 2).
7. Conclusions
In this study, a design optimization model was developed to minimize the construction costs of materials and labor in RC buildings. The optimization model was built using the evolutionary algorithm provided by the Microsoft Excel solver tool. Three structural floor systems were considered: SS, FSDP, and FS. The design constraints were based on the design provisions of ECP 203-18 to ensure the safety of each floor system. Discrete values of design variables were utilized per construction industry requirements to account for the practical considerations.
Two benchmark examples were considered to investigate the effects of the design variables on the optimal results of each structural floor system. The results revealed that solid slab buildings produced the most cost savings among the three systems.
The construction costs could be significantly reduced by considering the concrete compressive strength and the column spacings as design variables. The optimizer tended to reduce the column spacings to minimize the straining actions of the structural elements and, consequently, achieve economical concrete dimensions and steel reinforcement.
Low concrete grades are sufficient for low-rise residential buildings with small column spacings to resist the low stresses applied on floors and columns. As the number of stories increases, the tendency toward selecting a higher concrete grade increases to reduce the concrete dimensions of columns. The cost of columns decreased significantly with reducing the concrete dimensions in the higher story levels. In the case of FS, the cost of columns was less likely to decrease in higher story levels to resist the punching shear stresses. The cost of floors constituted the major part of the construction cost concerning the structural elements.
The optimal distribution of construction materials can vary based on the considered unit prices. In the current study, steel reinforcement constituted about 50% of the construction cost due to the high unit price of steel reinforcement in Egypt.
The current study revealed the possibilities of determining an economical structural floor system, concrete grade, concrete dimensions, and steel reinforcement of RC buildings by considering the integration of structural components. The contribution of the concrete grade and column spacing in reducing the construction costs was discussed. The presented optimization method could be applied to RC buildings subjected to seismic and wind loads in future work by considering the additional load cases provided by the design code. Thus, the effects of the additional design constraints on the optimal construction costs could be examined. The input data, design calculations, and unit costs of materials and labor could be adjusted to fulfill the restrictions of any design code or consider different structural floor systems.
Author Contributions
Conceptualization, S.E.-D.F.T., S.Y.M. and M.R.; methodology, S.E.-D.F.T., S.Y.M. and M.R.; software, M.R.; investigation, M.R.; data curation, M.R.; writing—original draft preparation, S.Y.M. and M.R.; writing—review and editing, S.Y.M. and M.R.; visualization, M.R. and S.Y.M.; supervision, S.E.-D.F.T. and S.Y.M. All authors read and agreed to the published version of the manuscript.
Funding
This research received no external funding.
Institutional Review Board Statement
Not applicable.
Informed Consent Statement
Not applicable.
Data Availability Statement
All data generated or used during the study are available from the corresponding author by request.
Conflicts of Interest
The authors declare no conflict of interest.
References
- Serrano-González, L.; Merino-Maldonado, D.; Antolín-Rodríguez, A.; Lemos, P.C.; Pereira, A.S.; Faria, P.; Juan-Valdés, A.; García-González, J.; Morán-del Pozo, J.M. Biotreatments Using Microbial Mixed Cultures with Crude Glycerol and Waste Pinewood as Carbon Sources: Influence of Application on the Durability of Recycled Concrete. Materials 2022, 15, 1181. [Google Scholar] [CrossRef] [PubMed]
- Ashraf, M.R.; Akmal, U.; Khurram, N.; Aslam, F.; Deifalla, A.F. Impact Resistance of Styrene & ndash; Butadiene Rubber (SBR) Latex-Modified Fiber-Reinforced Concrete: The Role of Aggregate Size. Materials 2022, 15, 1283. [Google Scholar] [CrossRef] [PubMed]
- Li, Z. A Numerical Method for Applying Cohesive Stress on Fracture Process Zone in Concrete Using Nonlinear Spring Element. Materials 2022, 15, 1251. [Google Scholar] [CrossRef] [PubMed]
- Clauß, F.; Epple, N.; Ahrens, M.A.; Niederleithinger, E.; Mark, P. Correlation of Load-Bearing Behavior of Reinforced Concrete Members and Velocity Changes of Coda Waves. Materials 2022, 15, 738. [Google Scholar] [CrossRef]
- Jamshaid, H.; Mishra, R.K.; Raza, A.; Hussain, U.; Rahman, M.L.; Nazari, S.; Chandan, V.; Muller, M.; Choteborsky, R. Natural Cellulosic Fiber Reinforced Concrete: Influence of Fiber Type and Loading Percentage on Mechanical and Water Absorption Performance. Materials 2022, 15, 874. [Google Scholar] [CrossRef]
- Ji, S.-W.; Yeon, Y.-M.; Hong, K.-N. Shear Performance of RC Beams Reinforced with Fe-Based Shape Memory Alloy Stirrups. Materials 2022, 15, 1703. [Google Scholar] [CrossRef]
- Tawfik, A.B.; Mahfouz, S.Y.; Taher, S.E.-D.F. Nonlinear ABAQUS Simulations for Notched Concrete Beams. Materials 2021, 14, 7349. [Google Scholar] [CrossRef]
- Baena, M.; Barris, C.; Perera, R.; Torres, L. Influence of Bond Characterization on Load-Mean Strain and Tension Stiffening Behavior of Concrete Elements Reinforced with Embedded FRP Reinforcement. Materials 2022, 15, 799. [Google Scholar] [CrossRef]
- Bakar, M.B.C.; Muhammad Rashid, R.S.; Amran, M.; Saleh Jaafar, M.; Vatin, N.I.; Fediuk, R. Flexural Strength of Concrete Beam Reinforced with CFRP Bars: A Review. Materials 2022, 15, 1144. [Google Scholar] [CrossRef]
- de Souza, R.C.S.; Andreini, M.; La Mendola, S.; Zehfuß, J.; Knaust, C. Probabilistic Thermo-Mechanical Finite Element Analysis for the Fire Resistance of Reinforced Concrete Structures. Fire Saf. J. 2019, 104, 22–33. [Google Scholar] [CrossRef]
- Andreini, M.; Caciolai, M.; La Mendola, S.; Mazziotti, L.; Sassu, M. Mechanical Behavior of Masonry Materials at High Temperatures. Fire Mater. 2015, 39, 41–57. [Google Scholar] [CrossRef]
- Rahmanian, I.; Lucet, Y.; Tesfamariam, S. Optimal Design of Reinforced Concrete Beams: A Review. Comput. Concr. 2014, 13, 457–482. [Google Scholar] [CrossRef]
- Stochino, F.; Lopez Gayarre, F. Reinforced Concrete Slab Optimization with Simulated Annealing. Appl. Sci. 2019, 9, 3161. [Google Scholar] [CrossRef] [Green Version]
- Chutani, S.; Singh, J. Use of Modified Hybrid PSOGSA for Optimum Design of RC Frame. J. Chinese Inst. Eng. 2018, 41, 342–352. [Google Scholar] [CrossRef]
- Sánchez-Olivares, G.; Tomás, A. Optimization of Reinforced Concrete Sections under Compression and Biaxial Bending by Using a Parallel Firefly Algorithm. Appl. Sci. 2021, 11, 2076. [Google Scholar] [CrossRef]
- Bordignon, R.; Kripka, M. Optimum Design of Reinforced Concrete Columns Subjected to Uniaxial Flexural Compression. Comput. Concr. 2012, 9, 327–340. [Google Scholar] [CrossRef]
- Kripka, M.; Medeiros, G.F.; Lemonge, A.C.C. Use of Optimization for Automatic Grouping of Beam Cross-Section Dimensions in Reinforced Concrete Building Structures. Eng. Struct. 2015, 99, 311–318. [Google Scholar] [CrossRef]
- Pierott, R.; Hammad, A.W.A.; Haddad, A.; Garcia, S.; Falcón, G. A Mathematical Optimisation Model for the Design and Detailing of Reinforced Concrete Beams. Eng. Struct. 2021, 245, 112861. [Google Scholar] [CrossRef]
- Varga, R.; Žlender, B.; Jelušič, P. Multiparametric Analysis of a Gravity Retaining Wall. Appl. Sci. 2021, 11, 6233. [Google Scholar] [CrossRef]
- Habte, B.; Yilma, E. Cost Optimization of Reinforced Concrete Frames Using Genetic Algorithms. Int. J. Optim. Control Theor. Appl. 2020, 11, 59–67. [Google Scholar] [CrossRef]
- Rawat, S.; Kant Mittal, R. Optimization of Eccentrically Loaded Reinforced-Concrete Isolated Footings. Pract. Period. Struct. Des. Constr. 2018. [Google Scholar] [CrossRef]
- Correia, R.S.; Bono, G.F.F.; Bono, G. Optimization of Reinforced Concrete Beams Using Solver Tool. Rev. Ibracon Estruturas Mater. 2019, 12, 910–931. [Google Scholar] [CrossRef]
- Fernandez-Ceniceros, J.; Fernandez-Martinez, R.; Fraile-Garcia, E.; Martinez-de-Pison, F.J. Automation in Construction Decision Support Model for One-Way Floor Slab Design: A Sustainable Approach. Autom. Constr. 2013, 35, 460–470. [Google Scholar] [CrossRef]
- Ghandi, E.; Shokrollahi, N.; Nasrolahi, M. Optimum Cost Design of Reinforced Concrete Slabs Using Cuckoo Search Optimization Algorithm. Iran Univ. Sci. Technol. 2017, 7, 539–564. [Google Scholar]
- de Medeiros, G.F.; Kripka, M. Optimization of Reinforced Concrete Columns According to Different Environmental Impact Assessment Parameters. Eng. Struct. 2014, 59, 185–194. [Google Scholar] [CrossRef]
- Ukritchon, B.; Keawsawasvong, S. A Practical Method for the Optimal Design of Continuous Footing Using Ant-Colony Optimization. Acta Geotech. Slov. 2016, 13, 45–55. [Google Scholar]
- Jelušič, P.; Žlender, B. Optimal Design of Pad Footing Based on MINLP Optimization. Soils Found. 2018, 58, 277–289. [Google Scholar] [CrossRef]
- Mergos, P.E.; Mantoglou, F. Optimum Design of Reinforced Concrete Retaining Walls with the Flower Pollination Algorithm. Struct. Multidiscip. Optim. 2020, 61, 575–585. [Google Scholar] [CrossRef]
- Arama, Z.A.; Kayabekir, A.E.; Bekdaş, G.; Kim, S.; Geem, Z.W. The Usage of the Harmony Search Algorithm for the Optimal Design Problem of Reinforced Concrete Retaining Walls. Appl. Sci. 2021, 11, 1343. [Google Scholar] [CrossRef]
- Sahab, M.G.; Ashour, A.F.; Toropov, V.V. Cost Optimisation of Reinforced Concrete Flat Slab Buildings. Eng. Struct. 2005, 27, 313–322. [Google Scholar] [CrossRef]
- Ženíšek, M.; Pešta, J.; Tipka, M.; Kočí, V.; Hájek, P. Optimization of RC Structures in Terms of Cost and Environmental Impact—Case Study. Sustainability 2020, 12, 8532. [Google Scholar] [CrossRef]
- Dehnavipour, H.; Mehrabani, M.; Fakhriyat, A.; Jakubczyk-Gałczyńska, A. Optimization-Based Design of 3D Reinforced Concrete Structures. J. Soft Comput. Civ. Eng. 2019, 3, 95–106. [Google Scholar] [CrossRef]
- Boscardin, J.T.; Yepes, V.; Kripka, M. Optimization of Reinforced Concrete Building Frames with Automated Grouping of Columns. Autom. Constr. 2019, 104, 331–340. [Google Scholar] [CrossRef]
- Robati, M.; Mccarthy, T.J.; Kokogiannakis, G. Integrated Life Cycle Cost Method for Sustainable Structural Design by Focusing on a Benchmark Office Building in Australia. Energy Build. 2018, 166, 525–537. [Google Scholar] [CrossRef] [Green Version]
- ECP Committee, 203. Egyptian Code for Design and Construction of Concrete Structures (ECP 203-2018), 4th ed.; Housing and Building National Research Center: Cairo, Egypt, 2018. [Google Scholar]
- Committee, E. Egyptian Code for Calculating Loads and Forces in Structural Work and Masonry; Housing and Building National Research Center (HBRC): Giza, Egypt, 2012. [Google Scholar]
- Němec, P.; Stodola, P. Optimization of the Multi-Facility Location Problem Using Widely Available Office Software. Algorithms 2021, 14, 106. [Google Scholar] [CrossRef]
- Langdon, D. Spon’s Architects’ and Builders’ Price Book 2001, 126th ed.; Spon Press: London, UK, 2001. [Google Scholar] [CrossRef]
- Harris, E.C. CESMM3 Price Database: 1999/2000; Thomas Telford Ltd: London, UK, 1999. [Google Scholar]
Publisher’s Note: MDPI stays neutral with regard to jurisdictional claims in published maps and institutional affiliations. |
© 2022 by the authors. Licensee MDPI, Basel, Switzerland. This article is an open access article distributed under the terms and conditions of the Creative Commons Attribution (CC BY) license (https://creativecommons.org/licenses/by/4.0/).