In the original publication, there was a mistake in Figure 1 as published [1]. The scale of the color bar at the right side of the pH row in both Figure 1A,B should go from 6.5 to 8, instead of 0 to 5. The corrected Figure 1 appears below. The authors state that the scientific conclusions are unaffected. This correction was approved by the Academic Editor. The original publication has also been updated.
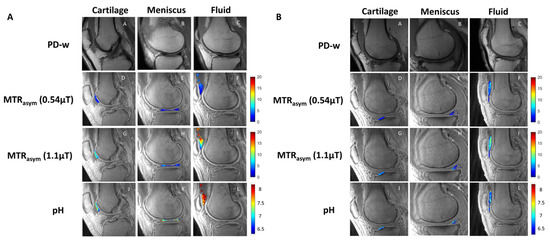
Figure 1.
Representative image examples from patients without OA (A) and with OA (B). Sagittal PD-weighted (first row), low-power acido-CEST UTE (second row), high-power acido-CEST UTE (third row), and pH pixel maps (fourth row) of cartilage, meniscus, and fluid. The pH is directly correlated with the radiofrequency power mismatch (RPM) measurements, as described in Equations (3) and (4). Note the higher pH values (yellow and red colors) in patients without OA compared with patients with OA (blue colors).
Reference
- Lombardi, A.F.; Ma, Y.; Jang, H.; Jerban, S.; Tang, Q.; Searleman, A.C.; Meyer, R.S.; Du, J.; Chang, E.Y. AcidoCEST-UTE MRI Reveals an Acidic Microenvironment in Knee Osteoarthritis. Int. J. Mol. Sci. 2022, 23, 4466. [Google Scholar] [CrossRef] [PubMed]
Disclaimer/Publisher’s Note: The statements, opinions and data contained in all publications are solely those of the individual author(s) and contributor(s) and not of MDPI and/or the editor(s). MDPI and/or the editor(s) disclaim responsibility for any injury to people or property resulting from any ideas, methods, instructions or products referred to in the content. |
© 2023 by the authors. Licensee MDPI, Basel, Switzerland. This article is an open access article distributed under the terms and conditions of the Creative Commons Attribution (CC BY) license (https://creativecommons.org/licenses/by/4.0/).