Abstract
In this paper, remote error monitoring techniques for electricity meters are overviewed suggesting their utilization for in-service surveillance assistance. It is discussed that in-service error observation could provide valuable input, contributing to the timely detection of batches of meters reaching nonconformance status. The payback period analysis of the deployment of a remote error monitoring solution is considered. However, it is pointed out that such an analysis lacks input information describing the relationship between the remote monitoring system’s performance and its ability to detect nonconformance of the batch. It is also noticed that there is no published methodology for grading the status of an entire batch of meters referring to error estimates of a subset of the meters, when the uncertainty of estimation is rather high.
1. Introduction
Utility (electricity, gas, etc.,) metering involves a large number of meters dedicated to measuring the resources consumed by each customer (consumer). Consumers are charged according to the amount measured and valid contract tariffs. Correctness of consumed quantity measurement by electrical energy meters is important for both producer and consumer. Falling under the scope of legal metrology, electricity meters must be verified periodically. The verification period is determined by national regulations. An individual reverification for conformance of energy meters at the end of the verification period is costly. Therefore, a statistical reverification can be applied as recommended by OIML (International Organization of Legal Metrology) []. If statistically sampled and in-laboratory verified meters conform to requirements, the operating period of the entire lot (batch) of meters can be extended until the next reverification. A lot is a homogenous group of meters that comply with a list of certain criteria (same manufacturer, same type or model, same year of production, same accuracy class, same type approval number or mark, same date of initial or subsequent verification []). A full replacement of the lot of energy meters before the expiration of the verification interval instead of reverification is practiced by utilities as well. Periodic verification or a full replacement scenario by the energy provider is chosen, considering economic and political criterion that may be country-dependent.
Statistical verification aiming to assess the meter lot’s conformity to requirements, e.g., maximum permissible error (MPE) is the mechanism to balance the risk between producer and consumer. Indeed, in operating nonconforming meters, both producer and consumer are exposed to the risk of economic loss due to positive or negative meter error. In the short term, whatever the decision of the producer is, at the end of the verification period (either lot replacement or statistical verification suggesting the extension of the verification period) the cost is covered by the producer because the price of the resource is agreed and fixed after negotiation with government bodies. However, from the long term perspective, utilities will include their expenditure and request a price increase in later negotiations with government bodies regulating electricity price country-wide. Therefore, it is not only in the provider’s interest to optimize the cost of metrological surveillance but in the consumers’ as well.
Statistical verification of a batch of meters is the procedure established by international standards and their adaptation at the national level. Dependent on national regulations it has to be carried out at the time of reverification. During exploitation (in-service) the meter can be inspected in a certified lab or on-site only in response to consumer complaints or suspicion by the energy provider. Recently, various remote [,,], built-in [], based on automatic meter reading data [] meter error monitoring techniques have emerged and are gaining more interest for implementation in smart energy meters. These new technologies introduce an opportunity to monitor meter error nearly constantly. However, remote error monitoring systems are not yet traceable to any power or energy units. For example, the approaches introduced in [,,] include a traceable reference meter, but it also includes fluctuating media (distribution grid with all consumers’ loads), whose unpredictable and random nature prevents achievement of error estimation (error measurement) traceability. Moreover, the uncertainty of remote monitoring is way larger than achievable in certified laboratories. For example, in the use case presented in [] the uncertainty of remotely assessed meter multiplicative correction factor (adjustment gain) was found 9.4% assuming the nominal value of correction factor is equal to 1. A 0.63% power measurement error uncertainty of a Class 1 meter is reported for the noninvasive error monitoring technique described in []. Therefore, a methodology for how to include experimental measurement uncertainty in the conformity assessment decision rule is demanded as opposite to in-laboratory verification where reference instrument uncertainty is neglected due to its small size compared to the permissible error limits of a meter under test (MUT).
The goal of this paper is to discuss the applications of the remote energy meter’s error monitoring, their benefits and motivation for producers, meter manufacturers and consumers, their relationship to the legal metrology system, and also to foresee challenges to be solved in future advancement of remote error monitoring (REM) applications.
2. Related References Overview
2.1. Standards and Regulations for Statistical Verification
OIML international recommendation OIML R 46-1 on active electrical energy meters [], among many metrological and technical requirements, outlines requirements for statistical verification. The requirements to the batch of meters, sampling and statistical testing are specified in the recommendation. In particular, the so-called Acceptance Quality Level (AQL) and Limiting Quality (LQ) parameters are correspondingly set to 1% and 7%. AQL and LQ parameters originate from ISO (International Organization for Standardization) standards ISO 2859-1:1999 [] and ISO 2859-2:1985 [] standards which specify an acceptance sampling system for inspection by attributes indexed in terms of AQL and LQ correspondingly. These standards describe sampling schemes aiming to provide an upper limit for the risk to the consumer of accepting the occasional poor lot.
In the European market, active energy meters fall under the regulation of Directive 2014/22/EC of the European Parliament and of the Council a so-called measurement instrument directive (MID) []. Module F and F1 of the directive Annex II describe the declaration of product (for instance, an energy meter) conformity based on verification. Both verification of conformity with metrological requirements by testing of every instrument and statistical verification of conformity are allowed by the directive. In the case of statistical verification, the probability of lot conformance acceptance of 95% with a nonconformity of less than 1% and the probability of acceptance of 5% with a nonconformity of less than 7% is demanded by the MID. In terms of AQL and LQ requirements, the MID is compatible with OIML R 46-1 []. For practical implementation of the statistical verification according to the MID, the WELMEC (Western European Legal Metrology Cooperation) Guide 8.10 [] is intended to support notified bodies when creating suitable sampling plans for conformity assessment. This WELMEC guide is often taken as the reference for national statistical verification methodologies approved by each country’s government authorities.
The OIML Guide 20 [] describes procedures for utility (including electricity) meter in-service surveillance by statistical verification before the end of the validity of verification of the meters in the lot. If the correctness of meters has been proved by sampling inspection, then the verification validity period may be extended according to national regulations. National regulations, including sampling plans, are built based on political decisions to ensure a selected level of consumer protection [,]. These decisions reflect the regulatory body’s confidence about the meter’s reliability. With emerging new manufacturers and types of smart meters entering the market it becomes more and more challenging to estimate reliability and build confidence due to the lack of data. Therefore, in-service monitoring should be a helpful methodology for continuous assessment of meter lot status instead of only statistical verification before the expiration of the verification validity period.
Some countries move towards demanding the future reliability of electricity meters (conformance to metrological requirements) [] instead of traditional ISO 2859-2 based approaches that ensure the conformance of utility meters at the time of inspection only. The building of sampling plans for assurance of future reliability of the instrument reliability models are crucial. In [], authors demonstrate how this type of sampling plan can be built by adapting binomial reliability models and still applying ISO standards. The future reliability prediction requires larger samples [] or tightening of the test for conformance conditions []. Authors acknowledge the expectation of promising benefits from remote monitoring of meters in terms of gaining more information about real reliability models that are used in the sampling plan selection [].
A use case study described in [] stimulates the discussion about how to determine the reverification time and still to balance the risk between producer and consumer while operating a batch of meters with degrading errors. The authors suggest economical risk approach analysis to calculate a period until the next verification. Actual measurement errors, price and consumption profiles throughout the year, and replacement costs are key inputs to the risk analysis producing the estimate of the next moment for statistical test for conformance. Feeding the information obtained from continuous remote error monitoring of meters could be a promising extension to the method improvement and optimization of reverification period extension. In this way the input from remote in-service observation indeed assists in making the decision about when to verify the meter lot and does not interfere or contradict with any of regulations in law.
2.2. Remote Error Monitoring Techniques
In this paper we only consider meter errors observable in the meter’s operating location and conditions. Only this measurement error can be assessed by remote monitoring techniques, though the minimum test program according to OIML recommendations [] for periodic verification involves more performance indicators namely no-load check, starting current check, current dependence, check of the register. When a meter is operating in its place of installation, conditions cannot be manipulated. On the other hand, the in-service observed meter error directly influences producer and consumer risk and associated economic losses.
Several types of REM methods have been published recently in research papers. Some of the described techniques [,] rely on the meters’ energy consumption measurement comparison over reference meter energy measurement. The reference meter is typically installed at the input of electricity distribution subgrid feeding a set of consumers. The reference meter (also called sum meter) measures the total energy of connected consumers. Meters of these consumers are remotely monitored using synchronously recorded energy consumption samples. An adjustment (multiplicative) coefficient (meter constant) can be then determined for every meter minimizing the difference between the sum energy of all observed meters and energy measured by sum (reference) meter. Other methods [,,] also rely on a reference meter (installed in the sum meter of the subgrid location), but individually selected meter’s readings are synchronously compared with energy consumption at the sum meter. In [], an injected 10 W load is suggested while the method described in [,] utilize natural power usage changes due to consumer activities. The common feature of these already introduced techniques is that meter error estimation uncertainty is significant. It is affected by the power consumption fluctuations in the grid and load dependent power losses in distribution lines between MUT and reference meter, which are unknown. A REM method by Analog Devices Inc. [] called a close-loop system (mSure technology) is based on the meter’s built-in reference source instead of an external meter.
The meter accuracy estimation error consists of the random and the systematic parts. Besides random error of reference meter and MUT, the random part is influenced by random fluctuations (power, voltage, losses, quality parameters, etc.) in the grid over the error estimation time. Whatever REM technique is used, the procedure of error estimation can be executed many times and averaging applied seeking to reduce its random deviation.
The systematic error is mainly composed of parts arising due to assumptions of the method. For example, the method, described in [], has the systematic error term as the power losses in the distribution feeder are neglected. Electrical power losses depend on the power delivered to the consumer and characteristics of connecting lines. Distribution grid lines connecting a consumer and his/her meter are fixed and the range of systematic error [] due to power losses usually can be estimated in advance considering parameters of lines []. For a particular meter the REM systematic error is constant but it is only known that it is within the range []. Therefore, systematic error is also treated as a random error considering the arbitrary location of a meter in the grid.
Overall, the error e is a random quantity which is fully described by the probability density function PDF(e). The PDF estimate can be gained from multiple samples of the error obtained during the remote monitoring. Overall, the error e is a random quantity fully described by the probability density function (PDF), which may be dependent on the random influence of power fluctuations in the meter’s particular location of the grid. The range of the PDF(e) of each monitored meter’s overlapping error tolerance limits should be considered while stating the probability of conformance of either a single meter or the lot acceptance. REM targets only an assisting role for in-service surveillance. Therefore, REM aims to characterize the status of a meter or lot but it does not seek for conformance acceptance or rejection. Because one meter remote error observation contains a constant systematic error (though of unknown value) the definition of tolerance limits for REM should include not only the meter’s MPE but also account for the limits of systematic error of remote error estimation as expressed by Equations (1) and (2):
where and are correspondingly lower and upper tolerance limits.
It is shown in Figure 1 that error PDF can overlap with the tolerance limits in various ways. All PDFs in Figure 1 are depicted by different shapes, because the experimentally assessed PDF of every meter may be different due to the limited number of samples, behavior of the meter random error or the different influences of the operating conditions, like alternating loads during the meter error estimation.
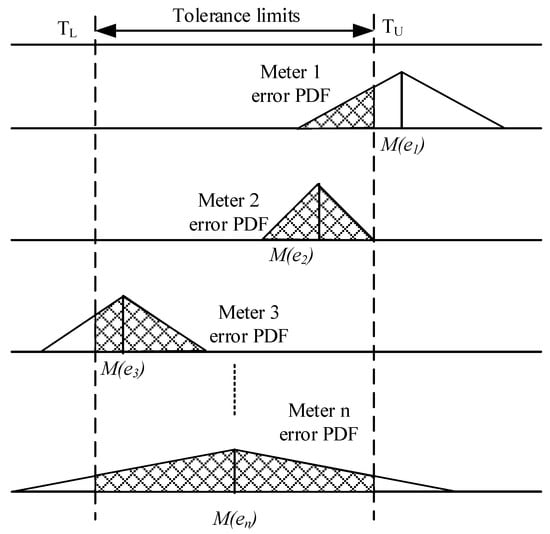
Figure 1.
Experimental error probability density function (PDF) of meters in relationship to tolerance limits.
Conformance probability of the n-th meter considering its measurement error estimated by REM could be described by Equation (3) []
The set of conformance probabilities of all monitored N meters then has to be used to approximate the probability of conformance of the entire lot consisting of L > N meters. This challenge is neither solved nor has any existing recommendations to the best of our knowledge. In the following chapter we are giving an overview of possible applications that could be implemented if the above stated challenge is solved.
3. Suggested Applications of Remote Error Monitoring
3.1. Assisting In-Service Surveillance
The measurement systems implementing the current state-of-the-art remote meter error monitoring techniques are not proved to be traceable and therefore they can play only an assisting role in regulated meter in-service surveillance. In-service surveillance of energy meters mainly relies on sampling verification. The conformance results of a selected sample of meters from a lot are used to decide regarding the replacement or verification period extension of the entire lot. If the lot is rejected the producer has to replace all meters even though some items may still conform to regulations. Therefore, some possible remote monitoring application-assisted sampling may be motivated:
- Referring to the observations of REM the producer may choose to replace meters exhibiting errors beyond tolerance limits. The decision is made solely by the producer (the owner of the lot of meters), it does not interfere with the sampling requirements but reduces the probability of rejecting the lot based on statistical verification completed using the remaining (not replaced) meters in the lot.
- Referring to the observations of REM the producer may decide to call for statistical verification earlier than at expiration of the verification period. This is the case when the producer sees the lot as unreliable and probably causing financial loss because of negative errors dominating the lot.
In all cases the sampling verification and conformance testing is executed according to regulations in law.
3.2. Producer and Consumer Business
Besides the existing national regulations and legal metrology standards aiming to protect consumer economic interests, other types of business between producer and customer become possible due to the REM implementation. Let us discuss the motivation for several of them:
- The producer installs remote meter error monitoring at his own cost and not only uses it for internal meter monitoring but offers contractual agreements to disclose the results of REM to a consumer. The consumer is free to sign such an agreement and gain access to REM of the meter measuring his or her revenue. If the consumer discovers that the meter errors are beyond the MPE (it is possible for some percentage of meters according to national regulations) he may ask a provider to check and replace the meter. On the other hand, the consumer may order the remote monitoring service driven by curiosity or seeking to compare consumption results with some internal submetering systems.
- Monitoring of consumers’ submeter errors using a smart revenue meter in the role of reference meter. In this application the REM service is orchestrated by the smart revenue meter acting as a sum meter for down-grid connected consumers’ submeters. HAN (home area network), NAN (neighboring area network), WAN (wide area network), enterprise SCADA systems protocols can be used to establish communication between the smart revenue meter and the submeter under monitoring [,], for instance using HomePlug protocol.
- Typically, sum (also called check or balance) meters are installed on the incoming feeder for monitoring of technical losses and/or electricity thefts in the grid []. Though check meters do not fall under the scope of legal metrology their measurement accuracy is of importance when making decisions about the status of the energy consumption changes in the distribution grid. Therefore, the error monitoring of the sum (check) meter itself using revenue meters becomes possible.
The meter manufacturers should not be forgotten as playing a vital role in new technology deployment in smart meters. Indeed, the competition between manufacturers of meters pushes them to integrate new unique features unavailable with the competitors’ production.
4. Verification Time Prediction
4.1. Reliability of Smart Meter and Error Drift
In reliability, theory and practice, a meter’s life expectancy is characterized by the mean time to failure (MTTF). Considering measurement error, the moment of failure (conformance loss) of a meter is determined by the error value exceeding MPE. The instrumental drift [] caused error may deviate continuously under the influence of stressors, mainly temperature, humidity and load current []. If the degradation rate is known or identified then the failure moment can be predicted and meter replacement planned. From the risk cost point of view, the moment of reaching the MPE limit is not somehow exceptional because the risk cost accumulation rate is similar to the rate just before the moment of MPE violation. Contrarily, in the case of a sudden (step-wise) error change because of severe failure of the metering function, the risk cost jumps dramatically and every day increases the accumulated cost significantly. Usually, it is easier to detect the second type of failure from consumer’s monthly bills exposing obvious consumption changes compared to the first type of failure.
The reliability of smart electricity meters is already addressed in several research works []. It is typical for electronic devices (also smart energy meters) that the hazard (failure) rate vs. time follows a so-called ‘bathtub’ shape [] (p. 9). Typically, the steady central part and the “wear out” part are the operating time intervals when in-service metrological surveillance is expected to detect nonconformance and prevent further use of a meter or lot. Replacement of nonconforming meters aims to avoid accumulation of financial losses due to over- or underestimated energy consumption.
A deeper analysis of smart meter reliability is reported in []. It is found that the meter’s basic error and chronometer error degradation paths are linear over time. In response to the long-term influences of temperature and humidity a meter error exhibits linear deviation. The error may deviate from some initial value either towards a larger error or towards a smaller error (zero error). In the second case, it takes a longer time for the error to reach the threshold characterizing MPE.
In [], the reliability of smart electricity meters is assessed by composing a matrix of meter blocks vs. meter features. Measurement of energy consumption is said to be one of the key features of a meter. However, error deviation is not considered explicitly but rather failure rate is targeted. Meter failure due to measurement error noncomplying with the MPE is not separated from total failure intensity. Measurement and processing modules influencing energy consumption measurement constitute only a small fraction of smart meter modules and features []. Authors explore only the total cost of meter ownership and its dependence on failure rate. Each module of a meter’s contribution to failure intensity is attributed a scaled risk grade based on expert knowledge. Therefore, producer or consumer losses caused by incorrect energy measurement are not considered in the paper.
4.2. Prediction of Conformance Loss Moment
It is revealed in [], that not only does meter accuracy degrade slowly because of long-term drift error caused by ageing under the influence of temperature, humidity, load, etc., but also the meter exhibits short-term (during a day) fluctuations. Therefore, in-service monitoring results may indicate that the error of a meter under observation fluctuates around the MPE limit. Deciding that the meter has lost conformance from the economic risk point of view might be challenging. Taking into account the considerable uncertainty of REM makes the derivation of a rule for separate meter replacements or distrust of the whole lot even more troublesome. In Figure 2, typical meter error fluctuations in the short-term and deviation in the long period perspective are shown. The long-term accuracy degrading is caused by the ageing phenomenon influencing the meter components while the short-term fluctuations are usually observed because of meter-error dependence on operating conditions (temperature, humidity, load). In the situation indicated in Figure 2, the meter error may oscillate by temporarily exceeding the MPE threshold but later returned below the threshold. The decision making regarding the meter’s conformance is rather challenging from a single error estimate in such a situation and a longer observation of error behavior is relevant.
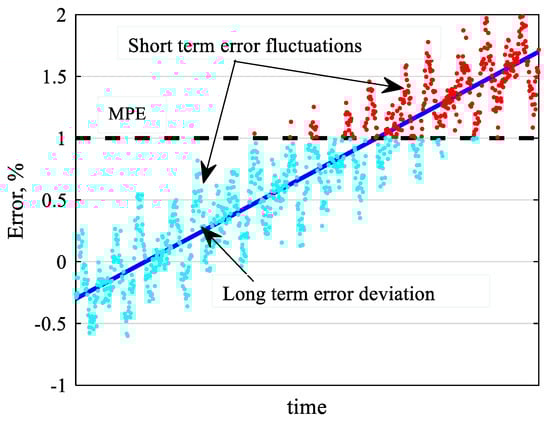
Figure 2.
Long term and short term meter error deviation and maximum permissible error (MPE) boundary.
The determination of the statistical verification moment when the rejection of the lot can be expected with the selected probability and confidence is the main goal for future investigations. REM could provide an option to detect meter error approaching and exceeding of MPE moment and contribute to the prevention of larger economic losses. However, the implementation of REM functionality also means additional cost, which has to be accounted for while justifying the payback period of REM deployment. In the next chapter a preliminary payback period analysis is provided to explain the concept.
5. The Payback Period of Remote Error Monitoring
The energy producer and the consumer are the two players in the energy market. National regulation systems are designed such that risk cost due to metering errors is balanced between producer and consumer in total. However, this is only on average, because particular consumers may be unhappy because their particular meter has a positive error exceeding the meter’s MPE, and equally the provider may not be happy about billing a particular consumer whose consumption is measured with a meter exhibiting a negative error below the MPE limit.
Assuming a meter instrumental drift is linear over time the average error over the i-th month after verification may be expressed by Equation (4):
where is the initial error at the start of the meter’s service, and is the error increase (deviation) rate per month. The monthly cost increase due to meter error to consumer when or to producer when is described by Equation (5):
where is the i-th month electricity bill in the absence of meter error described by Equation (6):
where is the electricity price (tariff) in currency per consumed energy (in Eur/kWh), and is the energy amount consumed per i-th month in kWh.
The total accumulated cost due to the meter error over M months is modeled by Equation (7):
The total accumulated cost denotes the loss for the consumer and gain for the producer when , or loss for the producer and gain for the consumer when .
In order to implement the remote meter monitoring, some initial investment is necessary. Let us consider that at the meter operating month . a remote monitoring system detects its error exceeding MPE. The meter is then inspected in the certified laboratory or according to approved on-site verification methods and replaced if it is found that . . After the replacement, the meter error deviation restarts from the initial error . The monthly cost increase due to meter error, remote monitoring, verification and replacement investment is seen in Equation (8):
where is REM service cost, is metrological verification cost, is replacement cost equal to the sum of meter cost and installation cost .
The total accumulated cost due to the meter error over M months is described by Equation (9):
REM cost includes two meters (one initially operated and second used for replacement) price increase due to integration of REM functionality and grid infrastructure investment cost per meter to support REM service (cost and installation of sum meter) as shown in Equation (10):
Assuming the criteria of loss minimization (regardless of whether it is producer or consumer loss), the payback period of REM service is the interval from the service start and the moment when accumulated cost due to the meter error with and without REM becomes equal. The payback period may be estimated by solving the Equation (11):
Alternatively, if a requirement on the payback period is set, say , then the maximum acceptable investment for REM service could be expressed by Equation (12):
In Figure 3, and are shown, corresponding to sample values typical to Lithuania: (typical), MPE = 1%, the verification cost is ([] Part 2, p. 148), meter cost is ([], Part 2, Table 5) and installation cost is ([], Part 2, Table 20). The other parameters used to draw plots in Figure 3 are , (error changes by 0.01% per month), , , . According to Figure 3, plotted for illustration purposes, the payback period of the remote monitoring service is 5 years. A more comprehensive analysis for payback period and REM service investment should include inflation, electricity cost fluctuations, differentiation of consumer and producer loss.
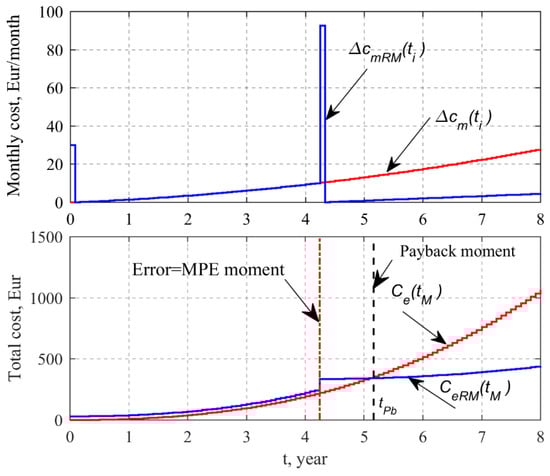
Figure 3.
Monthly cost increase (upper subplot) and accumulated cost (bottom subplot) due to meter error (red line) and meter error with included remote monitoring and replacement (blue line).
6. Discussion and Future Work
Assume that at the moment TREMn < Tv0, N meters from the lot were inspected using REM and their error experimental probability density function (histogram) PDF or uncertainty was estimated. Tv0 is the verification time according to valid national regulations. Each n-th meter error estimate is obtained by REM from the series of repeated observations K. It is expected that the uncertainty of remote error estimation is considerable in respect to the size of tolerance limits for conformance assessment. It is shown in Figure 4 that the REM-estimated errors of N meters from the lot did not indicate possible lot rejection if statistical inspection had been carried out at the time TREM1. However, based on REM results the expectation of lot rejection after statistical inspection at the moment TREM2 is higher. Therefore, the statistical inspection might be suggested before the expiration of the regulated verification interval Tv0.
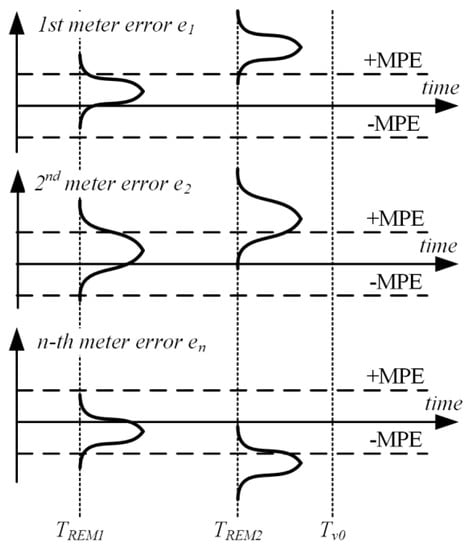
Figure 4.
Time diagram of a meter batch’s in-service surveillance assisted by remote error monitoring.
To advance towards REM-assisted in-service surveillance which aims to strengthen consumer and producer protection (minimizing risk cost) the challenge has to be solved: having a group of meters’ error observations and their corresponding uncertainties, what is the probability along with the selected confidence that the lot would be rejected if inspected at a particular moment before the expiration of the verification period and according to the statistical verification methodology adopted in the country?
Solving the challenge will provide input to a more comprehensive economic analysis of the payback period of an REM system deployment. The number of meters inspected by REM, the periodicity of the REM inspection and the probability of detecting the lot reaching nonconformance status are the factors influencing the payback period analysis.
7. Conclusions
Emerging techniques for remote electricity meter error monitoring are not yet approved in legal metrology regulatory documents. The conducted overview reveals that remote error monitoring solutions are suitable for collecting electricity meter error estimates in-service. However, the uncertainty of error estimation is quite challenging to determine because of the influence of the fluctuation of the parameters of the media connecting the reference device and the meter under test. Nevertheless, it is reasonable to use the data obtained when reaching a decision about the moment for the statistical verification of a batch of meters for conformance testing. In current practice, the verification period is set by national regulatory bodies. The period is fixed in advance despite any real observations of errors in meters. The selection of the verification period is often justified by economical balancing between the producer’s interest and the level of the consumer protection.
The deployment of remote error monitoring would contribute to the cost of electricity but on the other hand it could increase consumer protection. Therefore, the contribution of our research is the introduction of the REM deployment payback period analysis referring to country-specific costs like metrological verification, meter replacement, and average monthly electricity bill.
Currently unavailable methodologies for prediction of the nonconformance of a batch of meters from error observation with rather high uncertainty (similar or higher than the meter accuracy class) makes the set of inputs for the payback period analysis insufficient. Therefore, our second contribution is the identification of the key challenge ahead of the advancement of remote error monitoring assisted in-service surveillance. In particular, the need for a statistical framework for prediction of the nonconformance of a batch of meters, based on estimation of the errors of a subset of meters in the lot is highlighted.
Author Contributions
Conceptualization, Ž.N. and P.K.; methodology, P.K.; formal analysis, Ž.N.; writing—original draft preparation, Ž.N.; writing—review and editing, P.K.; visualization, Ž.N.; All authors have read and agreed to the published version of the manuscript.
Funding
This research received no external funding.
Conflicts of Interest
The authors declare no conflict of interest.
References
- OIML R 46-1/R 46-2:2012. Active Electrical Energy Meters. Part 1: Metrological and Technical Requirements, Part 2: Metrological Controls and Performance Tests. Available online: https://www.oiml.org/en/files/pdf_r/r046-p-e12.pdf (accessed on 1 September 2020).
- OIML G 20 Edition 2017 (E). Surveillance of Utility Meters in Service on the Basis of Sampling Inspections. Available online: https://www.oiml.org/en/files/pdf_g/g020-e17.pdf (accessed on 4 September 2020).
- Nakutis, Ž.; Saunoris, M.; Ramanauskas, R.; Daunoras, V.; Lukočius, R.; Marčiulionis, P. A Method for Remote Estimation of Wattmeter’s Adjustment Gain. IEEE Trans. Instrum. Meas. 2018, 68, 713–721. [Google Scholar] [CrossRef]
- Nakutis, Ž.; Rinaldi, S.; Kuzas, P.; Lukočius, R. An Analysis of Customer Power Profile Events for Non-invasive Energy Meter Error Monitoring. In Proceedings of the IEEE 10th International Workshop on Applied Measurements for Power Systems (AMPS), Aachen, Germany, 25–27 September 2019; pp. 1–6. [Google Scholar] [CrossRef]
- Nakutis, Ž.; Rinaldi, S.; Kuzas, P.; Lukočius, R. A Method for Noninvasive Remote Monitoring of Energy Meter Error Using Power Consumption Profile. IEEE Trans. Instrum. Meas. 2020, 69, 6677–6685. [Google Scholar] [CrossRef]
- mSure A New Technology that Maintains Equipment Health Over the Lifetime of Grid Infrastructure Assets. Available online: https://www.analog.com/media/en/news-marketing-collateral/product-highlight/mSure.pdf (accessed on 4 September 2020).
- Kong, X.; Ma, Y.; Zhao, X.; Li, Y.; Teng, Y. A recursive least squares method with double-parameter for online estimation of electric meter errors. Energies 2019, 12, 805. [Google Scholar] [CrossRef]
- Nakutis, Ž.; Kaškonas, P.; Saunoris, M.; Daunoras, V.; Jurčević, M. A framework for remote in-service metrological surveillance of energy meters. Measurement 2021, 168, 108438, ISSN 0263-2241. [Google Scholar] [CrossRef]
- ISO 2859-1:1999. Sampling Procedures for Inspection by Attributes—Part 1: Sampling Schemes Indexed by Acceptance Quality Limit (AQL) for lot-by-lot Inspection. Available online: https://www.iso.org/obp/ui/#iso:std:iso:2859:-1:ed-2:v1:en (accessed on 4 September 2020).
- ISO 2859-2:2020. Sampling Procedures for Inspection by Attributes—Part 2: Sampling Plans Indexed by Limiting Quality (LQ) for Isolated Lot Inspection. Available online: https://www.iso.org/obp/ui/#iso:std:iso:2859:-2:ed-2:v1:en (accessed on 4 September 2020).
- Directive 2004/22/EC of the European Parliament and of the Council 26 February 2014. Available online: https://eur-lex.europa.eu/legal-content/EN/TXT/?uri=CELEX%3A32014L0032 (accessed on 4 September 2020).
- Welmec Guide 8.10 Measuring Instruments Directive (2004/22/EC): Guide for Generating Sampling Plans for Statistical Verification According to Annex F and F1 of MID 2004/22/EC. 1. 2011. Available online: https://www.welmec.org/fileadmin/user_files/publications/WELMEC_08.10_Guide_for_statistical_verification.pdf (accessed on 4 September 2020).
- In-Service Testing Handbook for Gas and Electricity Meters, February 2020. Available online: https://www.gov.uk/government/publications/in-service-testing-handbook-for-gas-and-electricity-meters (accessed on 4 September 2020).
- S-02—Application of Specifications for Statistical Sampling and Measurement Uncertainty in the Verification and Reverification of Electricity and Gas Meters, 2018-07-01, rev. 5. Available online: https://www.ic.gc.ca/eic/site/mc-mc.nsf/eng/lm00090.html (accessed on 4 September 2020).
- Klauenberg, K.; Elster, C. Sampling for assurance of future reliability. Metrologia 2016, 54, 59. [Google Scholar] [CrossRef]
- Klauenberg, K.; Kramer, R.; Kroner, C.; Rose, J.; Elster, C. Reducing sample size by tightening test conditions. Qual. Reliab. Eng. Int. 2018, 34, 333–346. [Google Scholar] [CrossRef]
- Falnes Olsen, A.A.; Karlsson, H.; Pendrill, L. Conformance assessment of electrical energy meters investigated by risk analysis–a case study. OIML Bull. 2016, 57, 5–20. [Google Scholar]
- Korhonen, A. Verification of Energy Meters Using Automatic Meter Reading Data. Master’s Thesis, School of Electrical Engineering, Aalto University, Espoo, Finland, 2012. [Google Scholar]
- Lukočius, R.; Nakutis, Ž.; Daunoras, V.; Deltuva, R.; Kuzas, P.; Račkienė, R. An Analysis of the Systematic Error of a Remote Method for a Wattmeter Adjustment Gain Estimation in Smart Grids. Energies 2019, 12, 37. [Google Scholar] [CrossRef]
- OIML G 1-106:2012. Evaluation of Measurement Data—The Role of Measurement Uncertainty in Conformity Assessment. Available online: https://www.oiml.org/en/files/pdf_g/g001-106-e12.pdf (accessed on 4 September 2020).
- Kuzlu, M.; Pipattanasomporn, M.; Rahman, S. Communication network requirements for major smart grid applications in HAN, NAN and WAN. Comput. Netw. 2017, 67, 74–88. [Google Scholar] [CrossRef]
- Živic, N.S.; Ur-Rehman, O.; Ruland, C. Evolution of smart metering systems. In Proceedings of the 23rd Telecommunications Forum Telfor (TELFOR), Belgrad, Serbia, 24–26 November 2015; pp. 635–638. Available online: https://ieeexplore.ieee.org/document/7377547 (accessed on 8 October 2020). [CrossRef]
- Sreenivasan, G. Check Metering System. In Power Theft, 4th ed.; PHI Learning Pvt. Ltd.: Delhi, India, 2016. [Google Scholar]
- VIM3: International Vocabulary of Metrology. Available online: https://jcgm.bipm.org/vim/en/4.21.html (accessed on 4 September 2020).
- Yang, Z.; Chen, Y.X.; Li, Y.F.; Zio, E.; Kang, R. Smart electricity meter reliability prediction based on accelerated degradation testing and modeling. Int. J. Electr. Power Energy Syst. 2014, 56, 209–219. [Google Scholar] [CrossRef]
- Li, N.; Yang, J.; Sun, Y.; Wang, G.; Zhang, J.; Liu, C. Failure Modes and Effects Analysis for Domestic Electric Energy Meter Using In-Service Data. E&ES 2018, 108, 052036. [Google Scholar] [CrossRef]
- O’Connor, P.; Kleyner, A. Practical Reliability Engineering, 5th ed.; John Wiley & Sons: Southern Gate, Chichester, West Sussex, UK, 2012. [Google Scholar]
- Mamula, O.; Mejzrova, L.; Vodrazka, J. Failure analysis of current and future electricity meters and their components in relation to the costs of ownership. Adv. Electr. Electron. Eng. 2018, 16, 218–225. [Google Scholar] [CrossRef]
- Zhang, Z.; Gong, H.; Li, C.; Wang, Z.; Xiang, X. Research on estimating method for the smart electric energy meter’s error based on parameter degradation model. Mater. Sci. Eng. 2018, 366, 012065. [Google Scholar] [CrossRef]
- Cost-Benefit Analysis of Smart Energy Metering in Lithuania, 2017 Part I and Part II (In Lithuanian). Available online: https://ismaniejiskaitikliai.lt/naujienos/ismaniosios-energijos-apskaitos-diegimo-lietuvoje-kastu-ir-naudos-analize/14 (accessed on 4 September 2020).
© 2020 by the authors. Licensee MDPI, Basel, Switzerland. This article is an open access article distributed under the terms and conditions of the Creative Commons Attribution (CC BY) license (http://creativecommons.org/licenses/by/4.0/).