Abstract
Hypergraphs, a generalisation of traditional graphs in which hyperedges may connect more than two vertices, provide a natural framework for modeling higher-order interactions in complex biological systems. In the context of protein complexes, hypergraphs capture relationships in which a single protein may participate in multiple complexes simultaneously. A fundamental question is how such protein complex hypergraphs evolve over time. Motivated by duplication–divergence–deletion models often used for protein–protein interaction networks, we propose a novel Duplication–Divergence Hypergraph (DDH) model for the evolutionary dynamics of protein complex hypergraphs. To evaluate network resilience, we simulate targeted attack strategies analogous to drug treatments or genetic knockouts that remove selected proteins and their associated hyperedges. We measure the resulting structural changes using hypergraph-based efficiency metrics, comparing synthetic networks generated by the DDH model with empirical E. coli protein complex data. This framework demonstrates closer alignment with empirical observations than standard pairwise duplication–divergence models, suggesting that hypergraphs provide a more realistic representation of protein interactions.
1. Introduction
Conventionally, protein-protein interactions (PPIs) have been represented using pairwise interaction networks, in which proteins are nodes and edges denote observed interactions between them [1]. These binary undirected graphs underpin a wide range of bioinformatics tools, from function prediction and modular detection to the inference of essential genes.
However, many biologically meaningful interactions involve more than two proteins simultaneously. In particular, proteins often assemble into multi-protein complexes. Protein complexes are typically composed of three or more proteins bound together in a stable configuration to perform a specific biological role. For example, human ATP synthase is a protein complex composed of 29 protein subunits [2]. Protein complexes are stable, higher-order structures that are fundamental to many cellular functions. Analysing the structure and organisation of such structures can provide insights into important principles of cellular organization and function [3]. In fact, it is conjectured that over half of all proteins are in stable multi-protein complexes across the yeast proteome [4] and the majority of human proteins function as part of multimeric protein complexes [5].
Although each pair of proteins within a complex can be assumed to physically interact, representing protein complexes as mere collections of binary edges results in a loss of higher-order structural information and may introduce spurious edges that do not correspond to any biological reality. In general, graph-based models are fundamentally limited to pairwise interactions. Many molecular processes, however, are inherently polyadic [6,7,8,9]: proteins assemble into complexes with multiple subunits [10], metabolites participate in multi-enzyme reactions [11], and regulatory interactions often involve groups of transcription factors and cofactors acting together [12]. Representing such systems as simple graphs requires decomposing higher-order interactions into collections of pairwise edges, thereby obscuring the cooperative nature of the underlying biology, and with the danger of producing artefactual structures.
For a more faithful representation, higher-order structures have been proposed. The mathematically appealing concept of a simplicial complex, as used in [13,14,15], is not quite applicable for protein complexes, as a subset of a protein complex may not itself be a viable protein complex. A relaxation of a simplicial complex, as for example in [16], may not be easy to interpret for protein complexes. Instead, hypergraphs provide a natural generalisation of graphs [17,18,19], in which a hyperedge can join any number of vertices. Structural and dynamical properties of hypergraphs are of considerable interest to the complex systems community, see for example [20,21,22,23].
Similarly to networks, centrality measures for hypergraphs have been derived, see for example [24]. This higher-fidelity representation preserves information which may be lost under pairwise projection, and can be especially fruitful when the dependencies between multiple entities cannot be adequately captured by pairwise links, see [25] for an overview and examples from a wide range of applications. In particular, a protein complex can be represented by a hyperedge. It has been shown that in this representation, hypergraph centralities can yield improved predictions of protein essentiality [26] and can better reflect the modularity of cellular systems compared to their graph-projected counterparts [27]. Instead projecting a protein complex into a clique of pairwise interactions may spuriously inflate clustering coefficients or produce artificial hierarchical patterns that are not observed in the original hypergraph structure [26,28]. Analyses of protein complex data have demonstrated that hypergraph models can more accurately capture biological organisation than their graph projections [27,29]. Similarly, hyperedge betweenness can outperform graph-based metrics in identifying critical genes involved in viral response [30,31].
To study such higher-order networks, several random hypergraph models have been proposed as analogues of the classical Erdős–Rényi models [17,19,24,32]. Yet, the evolutionary mechanisms driving the emergence of complex higher-order structure in protein networks remain poorly understood. Existing models of molecular network evolution, such as the duplication–divergence (DD) framework, typically operate on binary graphs, wherein a node (protein) is duplicated, and some of its interactions are retained or rewired [33,34]. For example, a Duplication–Divergence model with Node Loss (DDL) model is introduced in [35], which evolves over time according to the following steps: (i) Duplication: at time t, a uniformly chosen node u is duplicated by adding a new node connected to all neighbors of u. (ii) Divergence: each edge connected to node is independently retained with probability ; (iii) Node loss: a node is randomly lost with probability q if it is isolated. These models fall short in explaining the formation and evolution of multiprotein complexes. In particular, they do not consider how entire hyperedges (i.e., protein complexes) may evolve through duplication and divergence events.
In this study, we propose a new Duplication–Divergence Hypergraph (DDH) model to simulate the evolution of protein complex networks. This model extends the classical DD framework to the hypergraph setting by allowing the duplication of a protein to result in the duplication or divergence of associated complexes. Our model captures not only vertex-level duplication but also hyperedge-level divergence, in which newly formed complexes may differ in composition from their parent complexes.
We systematically analyse the behaviour of this model, both theoretically and through simulations, focusing on (i) the asymptotic growth of the number of complexes and (ii) the robustness of the network under simulated perturbations. To achieve this, we also introduce targeted attack strategies and evaluate network efficiency via clique projections, thereby assessing the structural resilience of the system, a critical property when considering drug targetability or vulnerability to mutations.
This paper is structured as follows. Section 2 introduces the setup of the DDH model. Section 3 presents the attack strategies applied to the networks and the measures used to quantify network efficiency. Section 4 formulates the behaviour of the expected number of hyperedges in the DDH model and its long-term scaled convergence. Section 5 reports the simulation results, comparing the response of the DDH models to attacks with the observed E. coli protein complex network, showing close alignment. Finally, Section 6 summarises the main conclusions and outlines directions for future work.
2. The Duplication-Divergence Hypergraph Model
A hypergraph is a generalisation of a graph in which edges, called hyperedges, can connect any number of nodes, not just pairs. Formally, a hypergraph is defined as an ordered pair , where:
- V is a finite set of nodes, which in our context represent individual proteins;
- is a set of hyperedges, where each hyperedge is a non-empty subset of V, corresponding to a protein complex.
We model the evolution of protein complexes using a growing sequence of hypergraphs , where each hypergraph at a discrete time t represents the collection of proteins and their higher-order interactions (complexes) observed in the system. Our model, which we call the DDH model, models the dynamic growth of such protein complex networks such that at each discrete time step , the hypergraph is updated via the following steps:
- Protein Duplication: A protein is selected uniformly at random. A new protein is created as a duplicate of v. This new protein initially inherits the complex membership of its parent:
- For every hyperedge that includes v, a new hyperedge is generated by replacing v with its duplicate :
- Let be the set of duplicated hyperedges. The updated node set is , and the hyperedge set (prior to divergence) becomes the following:
- Hyperedge Divergence: To model functional divergence over time, we introduce stochastic loss of interactions:
- Each hyperedge is independently removed from the hypergraph with probability . That is,
- Hyperedges in the original set remain unchanged during this step. This reflects the biological observation that duplicated proteins may not retain all their functions indefinitely. Mechanisms such as subfunctionalisation and neofunctionalisation can lead to the partitioning or reconfiguration of protein complex participation [36].
The final updated hypergraph at time is as follows:
3. Network Robustness and Attack Strategies
3.1. Attack Strategies
Inspired by the success of multi-target drugs, ref. [37] propose a collection of attacks on protein-protein interaction networks to assess their robustness. Similarly, attack frameworks for hypergraphs have been developed, starting with [38], who consider a percolation approach. Ref. [39] establishes a mathematical framework for analyzing targeted attacks on random hypergraphs by mapping the process to equivalent random attacks through a factor-graph representation; a factor-graph is a bipartite network representation of a hypergraph with nodes and factor-nodes. Ref. [40] introduces a spectral-clustering-based hypergraph dismantling approach that identifies key nodes through iteratively partitioning the hypergraph into clusters and finding groups of nodes that, when simultaneously removed, maximise hypergraph fragmentation. Other approaches employ collective-influence, belief-propagation, or reinforcement-learning strategies to optimize attack sequences while accounting for hyperedge cardinality and overlapping group interactions [41,42]. These studies show that targeted removal strategies guided by hyperedge size, hyperdegree, or community structure can substantially reduce hypergraph connectivity.
Motivated by the context of drug targeting or mutational effects, here we evaluate the structural resilience of the evolving hypergraph under perturbations by simulating targeted attacks using a two-level, probabilistic knockout strategy. This approach is designed to mimic distributed molecular interventions that may affect protein–protein interactions at the level of entire complexes.
For an attack at a time , the following procedure, which is reminiscent of the percolation approach in [38], is performed after the duplication–divergence events:
- Node selection: A protein is selected uniformly at random from the current node set. This selection emulates a perturbation event such as a targeted genetic knockout or deleterious mutation that impairs the functionality of a specific protein.
- Complex disruption: Each hyperedge such that is independently removed from the hypergraph with probability . That is, the complex is disrupted with probability r if it contains the targeted protein:
3.2. Quantifying Network Efficiency via Clique Projection
To assess the impact of perturbations on the global structure of the network, we quantify its efficiency, a measure of how effectively information can propagate across the system. Originally introduced by [43], network efficiency is defined for a graph as follows:
where is the number of nodes, and denotes the length of a shortest path between nodes i and j. This metric captures the average inverse geodesic distance across all pairs of nodes and is maximised when the distances are short.
To generalise this notion to hypergraphs, first a notion of the length of a path on a hypergraph is needed. A path between two nodes in the hypergraph is a sequence of hyperedges in the hypergraph such that , and consecutive hyperedges intersect. To define the length for each path, in a way that reflects the sizes of the hyperedges as well as the sizes of the intersections between the hyperedges, we apply the clique projection method proposed in [44]. In this approach, the hypergraph is transformed into a weighted graph, often referred to as the line graph of the hypergraph, where:
- Each hyperedge is represented as a node in the projected graph.
- Edges between nodes and are drawn if the corresponding hyperedges intersect, i.e., . In particular, the line graph has self-loops at all of its nodes.
- The weight of each edge is defined as follows:
Considering the particular form of , the division by 3 serves as a normalization factor, balancing the contributions of total size and intersection so that the resulting weights remain comparable across complexes of different cardinalities. If one takes , then Thus, in a dyadic network , then for every . For fixed union size, the larger the intersection between two hyperedges and , the smaller the weight of the edge ; for fixed intersection size, the larger the hyperedges, the larger the weight of the edge .
Let denote the shortest distance between nodes e and f in the weighted line-graph, obtained as the sum of the weights on a path between e and f of shortest weight. A weighted distance between nodes i and j in the hypergraph is then defined as follows:
where is the set of hyperedges in the hypergraph which include the node i. In [44] it is shown that reduces to the classical distance if the hypergraph is just a dyadic network. Moreover, the larger the intersection of the hyperedges, the smaller the weighted distance tends to be. The larger the hyperedges, the larger the weighted distance tends to be. Also, the larger the number of hyperedges in a graph, the larger the weighted distance tends to be.
This weight function is thus designed to reflect biologically and structurally relevant constraints:
- Increased intersection reduces weight when the size of the union of the two hyperedges is fixed: Complexes that share more proteins indicate some redundancy, corresponding to smaller weights and a perhaps less efficient structure.
- Increased union increases weight when the size of the intersection of the two hyperedges is fixed: Hyperedges with large cardinalities have the potential to introduce larger weights. Biologically, this weighting assumes that interactions involving larger complexes have greater potential to influence network efficiency. This behaviour is motivated by [45], showing that a large protein complex is more likely to be able to provide the correct functional groups for catalysis, and by [46], showing that large protein complex interfaces have evolved to promote cotranslational assembly.
- Compositional diversity affects linkage: The use of both union and intersection terms ensures that distant and weakly overlapping complexes contribute more weight.
Once the weighted projection is constructed, a shortest path finding algorithm is applied to compute the pairwise shortest path distances between all projected nodes (complexes). The efficiency of the hypergraph is then defined as follows:
where denotes the length of a shortest path between hyperedges and in the weighted line graph.
4. Evolution of the Number of Hyperedges in the DDH Model
In this section, we investigate how the expected number of hyperedges in the duplication–divergence hypergraph (DDH) model evolves over time.
Let denote the average size of a hyperedge at time t. Define the increment in hyperedge count at time t by the following:
We now establish the expected one-step recursion for the number of hyperedges.
Theorem 1
(Expected Hyperedge Change). Let denote the hypergraph at time t. Then the conditional expectation of the number of hyperedges at time is as follows:
Proof.
At each time step, a protein is selected uniformly at random for duplication. Let denote the degree of protein v, i.e., the number of hyperedges containing v at time t. By definition,
The expected degree of a uniformly chosen protein is as follows:
By the definition of the average hyperedge size,
Hence,
Each of the hyperedges containing v generates a duplicate hyperedge, which is retained with probability . Thus, the expected number of new hyperedges added at step t is as follows:
Adding this expected increment to the existing hyperedge count gives the recursion (3). □
Beyond the mean behaviour, it is also useful to characterise the variability of the increment in hyperedge count.
Lemma 1
(Second Moment of Hyperedge Increment). Let denote the hypergraph at time t. Then the conditional second moment of the hyperedge increment satisfies the following:
Proof.
Conditional on , the increment is the sum of independent Bernoulli random variables, one for each hyperedge containing the duplicated protein, retained with probability . Thus, by the standard variance decomposition,
For the mean, we have Equation (4), whereas the variance follows from the Bernoulli structure:
Substituting these expressions yields the claimed Formula (5). □
Theorem 2
(Convergence of A Scaled Hyperedge Process). Let be the DDH hypergraph process. Assume that all hyperedges have same size . Define the scaled process and let . Then:
- 1.
- If , then there exists an such that ;
- 2.
- If , then ;
- 3.
- If , then .
Proof.
Since all hyperedges have size s, Theorem 1 gives the following:
Taking expectations and iterating,
Dividing by ,
By Stirling’s formula, as ,
Therefore
Define
Theorem 1 shows that , so is a non-negative martingale with . By Doob’s Martingale Convergence Theorem, almost surely for some finite random variable . Now write
Note that
where
Therefore
Case 1: . Since , we have as . Thus
Combining with almost surely, it follows that
Case 2: . The same representation (8) gives the following:
where the second factor converges to C given in (7). Since almost surely, we obtain the following:
As , the limit is almost surely finite and strictly positive: .
Case 3: . In this case, . Since almost surely, from the representation (8) it follows that almost surely. □
Remark 1.
Biologically, the first case is the most relevant regime. In this setting, the growth of the number of hyperedges is balanced by the divergence probability p, such that the rescaled process converges almost surely to a finite, non-trivial limit. This corresponds to the scenario where protein complexes expand in proportion to the evolutionary timescale, but the rate of complex loss due to divergence counteracts unbounded growth. In biological terms, it captures the intuition that while gene duplication events continually introduce new potential interactions, not all of these are retained, and the system stabilises into a structurally sustainable state rather than diverging to trivial sparsity or uncontrolled complexity.
Corollary 1
(Dominance of the Largest Hyperedge Size). Suppose the initial DDH hypergraph consists of isolated hyperedges of sizes , and let
For each j, let denote the collection of hyperedges at time t generated from the initial hyperedge of size , and define the scaled processes Then:
- 1.
- For each j, converges almost surely as in Theorem 2 with .
- 2.
- For the global processwe have the following:where each is the almost sure limit of . In particular, all components with vanish in this scaling limit.
Proof.
Since the initial hyperedges are isolated, the duplication-divergence dynamics act independently on each hyperedge. For a given hyperedge of size , every duplicated hyperedge has size and is retained with probability . By Theorem 2, the process converges almost surely to a limit which depends on whether is greater than, equal to, or smaller than .
Now fix . If , then almost surely. If , then almost surely. Summing over j gives the following:
which is finite and strictly positive almost surely. □
Remark 2.
If the initial hypergraph is not a disjoint union of isolated hyperedges, dependencies arise because duplications can generate new intersections across components. Nevertheless, our simulations indicate that the same limiting principle may still hold in practice.
Figure 1 illustrates the behaviour of in a simulation with and an initial maximum hyperedge size of 3. In this setup, the scaling exponent is set to be . Among the values of tested, only produces a non-trivial limiting trajectory within 5000 steps, while choices of above or below lead to vanishing or diverging behaviour, respectively.
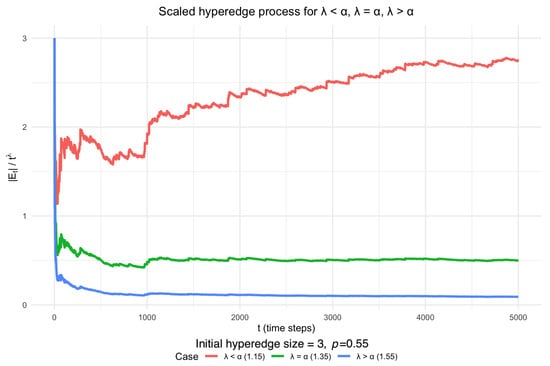
Figure 1.
Scaled DDH hyperedge process starting from hyperedges of different sizes, with and maximum hyperedge size 3. The scaling exponent is set to be . The simulated behaviour is consistent with Theorem 2: within 5000 steps, the red trajectory () diverges, the blue trajectory () decays to zero, and only the green trajectory () stabilises at a non-trivial limit.
Slightly varying the size of the initial hyperedge or the value of p still yields hypergraphs that match empirical observations. For example, Figure 2 validates our conclusion for and an initial hyperedge size of 5.
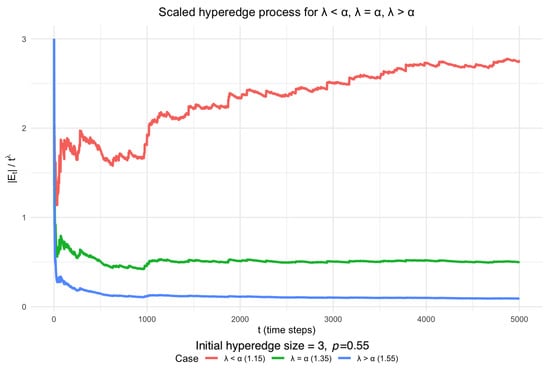
Figure 2.
Scaled DDH hyperedge process starting from hyperedges of different sizes, with and maximum hyperedge size 5. The simulated behaviour is also consistent with Theorem 2.
Moreover, the existence of this finite scaling limit suggests a potential way to estimate p. Since and the long-term slope of hyperedge growth reflects the divergence probability, analysing the scaling behaviour of empirical complex networks may offer a way to infer model parameters from comparative genomics across species. In this way, the abstract probabilistic model could be linked to measurable biological quantities. However, a key challenge is that there is currently no available data on real protein complex evolution to estimate this rate.
5. Simulation
5.1. Dataset
We validate our model using the E. coli protein complex network, obtained from the Complex Portal in November 2024 [47]. This dataset comprises 831 protein complexes and 2776 unique proteins. Figure 3a illustrates the decline in network efficiency over the course of 25 targeted attacks.
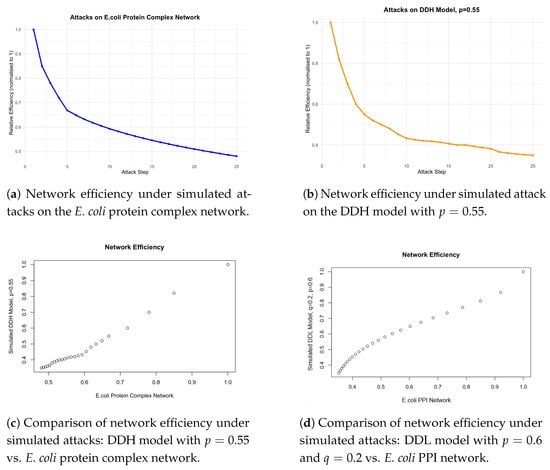
Figure 3.
Comparison of network efficiency under simulated attacks.
5.2. Empirical Validation
For synthetic network generation, we initialise with three vertices and two randomly sampled hyperedges, where each hyperedge is drawn uniformly at random, without replacement, from all possible non-empty subsets of the vertex set containing at least two vertices. From each initalisation we run the DDH model for 2773 time steps, to give a hypergraph of 2776 vertices, the same number of vertices as in the observed E. coli protein complex network. We repeat this process 50 times. For the DDH model, p is set to be 0.55, which we show produces the number of hyperedges most closely matching the observed E. coli protein complex network, see in Section 5.3. Figure 3b shows how network efficiency decreases within 25 attacks as described in Section 3.1.
To assess biological realism, Figure 3c shows the decay of the DDH model against the E. coli protein complex network across 25 targeted attacks. The observed efficiency decline is nearly linear, indicating that the hypergraph model faithfully reproduces the attack dynamics observed in real protein complex networks.
This performance represents a notable improvement over the pairwise duplication-divergence model with node loss (DDL) [35]. As illustrated in Figure 3d, the DDL model with , the estimated value for several protein–protein interaction networks [34], exhibits a parabolic response to attacks, in contrast to the approximately linear trend of the DDH model, which aligns more closely with the empirical E. coli protein complex network. This difference suggests that the hypergraph formulation offers a more structurally accurate representation of protein interaction systems. However, while the overall decreasing trend in network efficiency is more closely aligned between the simulated DDH model and the E. coli protein complex network, the DDH model shows a sharper drop in network efficiency.
Furthermore, we evaluated the DDH model on additional structural properties of the hypergraph, namely the hyperedge size distribution and the hyperdegree distribution. Again, each simulation commenced from an initial configuration of three distinct vertices, from which two initial hyperedges were generated. Each hyperedge was drawn uniformly at random, without replacement, from all possible non-empty subsets of the vertex set containing at least two vertices. The system then evolved according to the DDH process for 2773 time steps, after which 25 sequential attacks were applied to the resulting hypergraph. During each attack, both the hyperedge size and hyperdegree were recorded. This procedure was repeated 30 times, and the resulting measurements were averaged across these independent runs. All quantities were subsequently normalised to their respective initial values to allow comparison of the network’s relative structural degradation over time.
As shown in Figure 4, the responses to attacks, measured by both the relative mean hyperedge size and the relative mean hyperdegree, are well aligned between the simulated networks and the observed E. coli hypergraph.
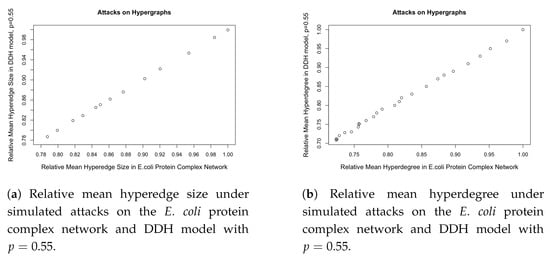
Figure 4.
Comparison of relative mean hyperedge size and hyperdegree under simulated attacks.
5.3. Parameter Tuning
To identify parameter regimes which are most consistent with empirical observations, we performed 60 independent simulations across a range of divergence probabilities (p). Figure 5 reports the resulting distribution of hyperedge counts relative to the observed value of 831.
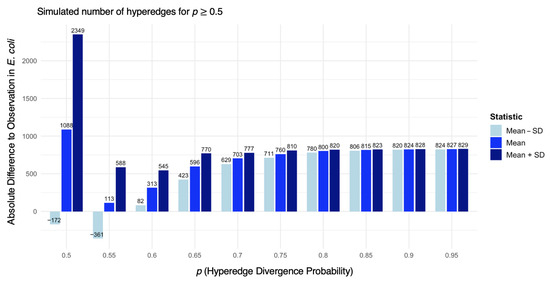
Figure 5.
Histogram of the mean absolute difference ± standard deviation from the target number of hyperedges (831). Each block of three tiles corresponds to one value of p: (left) mean difference minus the standard deviation, (middle) mean difference, and (right) mean difference plus the standard deviation. Black labels indicate exact values. The x-axis groups correspond to different divergence probabilities p.
We observed that smaller values of p systematically yield networks with substantially more hyperedges than the empirical E. coli complex network. For clarity, simulations with are omitted from Figure 5. Across the tested range, higher values of p reduced variance, although the spread remains moderate.
In particular, produces an average hyperedge count closest to the empirical benchmark of 831. This suggests that a moderate divergence probability provides the best fit for E. coli protein complex organisation. This value is slightly lower than the estimate reported from pairwise duplication–divergence models of PPI networks [34].
6. Discussion
In this work, we have introduced a DDH model that more accurately captures network efficiency against attacks than traditional pairwise duplication–divergence models. By explicitly modelling complexes as hyperedges, the framework accommodates higher-order protein interactions and reproduces empirical trends in network resilience under targeted attack. Validation against the E. coli protein complex network demonstrates that the DDH model generates efficiency-decay patterns more closely aligned with biological observations, substantially improving on the parabolic behaviour exhibited by the pairwise model. Parameter tuning further revealed that a moderate divergence probability () best reflects the empirical structure of E. coli complexes.
While this paper only introduces the DDH model, questions of how it behaves could be of interest for further studies. Are communities and core-periphery structures preserved over time? How do motif counts behave? In other hypergraph models, progress has been made in this direction, see for example [21,48,49,50].
However, the DDH model still has some shortcomings. The slightly sharper decrease in network efficiency for the DDH model compared to the E. coli protein complex network suggests the possibility of further refining the DDH framework to more faithfully reproduce the nuanced resilience of biological networks. One way is to expand the criteria for model construction, aligning not just the number of vertices but also higher-order structural statistics into the validation process. For example, distributions of degree centrality, hyperedge size, and clustering coefficients provide summary statistics of hypergraph topology. Matching these statistics between synthetic and empirical networks would allow for a more rigorous calibration of model parameters, and would help ensure that the synthetic networks preserve not only global counts but also finer-grained local and mesoscopic organisation.
Additionally, refining the model construction could also help. Motivated by evidence that pairwise duplication–divergence models incorporating node loss [35] or edge deletions [51] better reproduce the structural properties of real protein–protein interaction networks, it is natural to extend these ideas to the hypergraph setting. In particular, incorporating stochastic deletions of nodes or hyperedges would allow the model to mimic the natural processes of protein complex degradation, thereby capturing the dynamic instability and turnover observed in cellular environments. Such an extension opens the door to a diverse family of hypergraph variations, which can potentially enhance biological realism and provide a flexible framework for exploring how different types of perturbations shape network evolution.
Another possible direction of future work is to employ machine learning methods to optimise parameter fitting across multiple hypergraph statistics simultaneously. In particular, likelihood-free approaches such as approximate Bayesian computation, or simulation-based inference with neural density estimators, could be employed to learn divergence probabilities (p) and other model parameters that best replicate the topology of empirical protein complex networks. Such approaches would also enable systematic exploration across species, providing insights into whether evolutionary constraints on protein complex organisation are conserved or vary in a lineage-specific manner.
In summary, the DDH model constitutes an important step towards biologically realistic modelling of protein complexes. Extending validation to incorporate additional hypergraph statistics, refining model construction, and employing machine learning–based inference could further enhance its explanatory and predictive power, not only for cellular interaction networks but also for other complex systems that exhibit analogous structural patterns.
Finally, as already noted in [52], biological data tend to be very noisy, and their models usually are not able to match all aspects of the data. Instead, a model is already useful if one is able to learn something about some aspects of the data. Here, we show that the DDH model captures some features of protein complex data, in particular their behaviour under a complex knock-out attack. Thus, the model may be useful in assessing the effect of a drug which targets a whole protein complex. Moreover, the performance of the DDH model hints at an underlying evolutionary process which treats protein complexes as units.
Author Contributions
Writing—original draft, R.Z. and G.R.; Writing—review & editing, G.R.; supervision, G.R. All authors have read and agreed to the published version of the manuscript.
Funding
G.R. acknowledges the support from EPSRC grants EP/R018472/1, EP/T018445/1, EP/X0021951 and EP/Y028872/1.
Data Availability Statement
The E. coli protein complex network dataset used in this study was obtained from the Complex Portal at https://www.ebi.ac.uk/complexportal in 18 November 2024.
Conflicts of Interest
The authors declare no conflicts of interest.
References
- Koyutürk, M.; Kim, Y.; Topkara, U.; Subramaniam, S.; Szpankowski, W.; Grama, A. Pairwise alignment of protein interaction networks. J. Comput. Biol. 2006, 13, 182–199. [Google Scholar] [CrossRef] [PubMed]
- He, J.; Ford, H.C.; Carroll, J.; Douglas, C.; Gonzales, E.; Ding, S.; Fearnley, I.M.; Walker, J.E. Assembly of the membrane domain of ATP synthase in human mitochondria. Proc. Natl. Acad. Sci. USA 2018, 115, 2988–2993. [Google Scholar] [CrossRef] [PubMed]
- Spirin, V.; Mirny, L.A. Protein complexes and functional modules in molecular networks. Proc. Natl. Acad. Sci. USA 2003, 100, 12123–12128. [Google Scholar] [CrossRef] [PubMed]
- Juszkiewicz, S.; Hegde, R.S. Quality Control of Orphaned Proteins. Mol. Cell 2018, 71, 443–457. [Google Scholar] [CrossRef]
- Pla-Prats, C.; Thomä, N.H. Quality control of protein complex assembly by the ubiquitin–proteasome system. Trends Cell Biol. 2022, 32, 696–706. [Google Scholar] [CrossRef]
- Barabási, A.L.; Oltvai, Z.N. Network biology: Understanding the cell’s functional organization. Nat. Rev. Genet. 2004, 5, 101–113. [Google Scholar] [CrossRef]
- Pereira-Leal, J.B.; Levy, E.D.; Teichmann, S.A. The origins and evolution of functional modules: Lessons from protein complexes. Philos. Trans. R. Soc. B Biol. Sci. 2006, 361, 507–517. [Google Scholar] [CrossRef]
- Taylor, M.B.; Ehrenreich, I.M. Higher-order genetic interactions and their contribution to complex traits. Trends Genet. 2016, 31, 34–40. [Google Scholar] [CrossRef]
- Vidal, M.; Cusick, M.E.; Barabási, A.L. Interactome Networks and Human Disease. Cell 2011, 144, 986–998. [Google Scholar] [CrossRef]
- Marsh, J.A.; Teichmann, S.A. Structure, dynamics, assembly, and evolution of protein complexes. Annu. Rev. Biochem. 2015, 84, 551–575. [Google Scholar] [CrossRef]
- Welch, G.R. On the Role of Organized Multienzyme Systems in Cellular Metabolism: A General Synthesis. In Progress in Biophysics and Molecular Biology; Eleviser: Amsterdam, The Netherlands, 1978; pp. 103–191. [Google Scholar]
- Wang, Z.; Wang, P.; Li, Y.; Peng, H.; Zhu, Y.; Mohandas, N.; Liu, J. Interplay between cofactors and transcription factors in hematopoiesis and hematological malignancies. Signal Transduct. Target. Ther. 2021, 6, 24. [Google Scholar] [CrossRef]
- Benson, A.R.; Abebe, R.; Schaub, M.T.; Jadbabaie, A.; Kleinberg, J. Simplicial closure and higher-order link prediction. Proc. Natl. Acad. Sci. USA 2018, 115, E11221–E11230. [Google Scholar] [CrossRef]
- Iacopini, I.; Petri, G.; Barrat, A.; Latora, V. Simplicial models of social contagion. Nat. Commun. 2019, 10, 2485. [Google Scholar] [CrossRef] [PubMed]
- Zhang, Y.; Lucas, M.; Battiston, F. Higher-order interactions shape collective dynamics differently in hypergraphs and simplicial complexes. Nat. Commun. 2023, 14, 1605. [Google Scholar] [CrossRef]
- Landry, N.W.; Young, J.G.; Eikmeier, N. The simpliciality of higher-order networks. EPJ Data Sci. 2024, 13, 17. [Google Scholar] [CrossRef]
- Battiston, F.; Cencetti, G.; Iacopini, I.; Latora, V.; Lucas, M.; Patania, A.; Young, J.G.; Petri, G. Networks beyond pairwise interactions: Structure and dynamics. Phys. Rep. 2020, 874, 1–92. [Google Scholar] [CrossRef]
- Berge, C. Hypergraphs: Combinatorics of Finite Sets; Elsevier: Amsterdam, The Netherlands, 1984; Volume 45. [Google Scholar]
- Benson, A.R.; Gleich, D.F.; Leskovec, J. Higher-order organization of complex networks. Science 2016, 353, 163–166. [Google Scholar] [CrossRef] [PubMed]
- Di Gaetano, L.; Battiston, F.; Starnini, M. Percolation and topological properties of temporal higher-order networks. Phys. Rev. Lett. 2024, 132, 037401. [Google Scholar] [CrossRef]
- Tudisco, F.; Higham, D.J. Node and edge nonlinear eigenvector centrality for hypergraphs. Commun. Phys. 2021, 4, 201. [Google Scholar] [CrossRef]
- Lotito, Q.F.; Musciotto, F.; Montresor, A.; Battiston, F. Higher-order motif analysis in hypergraphs. Commun. Phys. 2022, 5, 79. [Google Scholar] [CrossRef]
- Contisciani, M.; Battiston, F.; De Bacco, C. Inference of hyperedges and overlapping communities in hypergraphs. Nat. Commun. 2022, 13, 7229. [Google Scholar] [CrossRef]
- Battiston, F.; Amico, E.; Barrat, A.; Bianconi, G.; Ferraz de Arruda, G.; Franceschiello, B.; Iacopini, I.; Kéfi, S.; Latora, V.; Moreno, Y.; et al. The physics of higher-order interactions in complex systems. Nat. Phys. 2021, 17, 1093–1098. [Google Scholar] [CrossRef]
- Torres, L.; Blevins, A.S.; Bassett, D.S.; Eliassi-Rad, T. The Why, How, and When of Representations for Complex Systems. SIAM Rev. 2021, 63, 435–485. [Google Scholar] [CrossRef]
- Klimm, F.; Deane, C.M.; Reinert, G. Hypergraphs for predicting essential genes using multiprotein complex data. J. Complex Netw. 2021, 9, cnaa028. [Google Scholar] [CrossRef]
- Murgas, K.A.; Saucan, E.; Sandhu, R. Hypergraph geometry reflects higher-order dynamics in protein interaction networks. Sci. Rep. 2022, 12, 20879. [Google Scholar] [CrossRef] [PubMed]
- Klamt, S.; Haus, U.U.; Theis, F. Hypergraphs and Cellular Networks. PLoS Comput. Biol. 2009, 5, e1000385. [Google Scholar] [CrossRef]
- Franzese, N.; Groce, A.; Murali, T.M.; Ritz, A. Hypergraph-based connectivity measures for signaling pathway topologies. PLoS Comput. Biol. 2019, 15, e1007384. [Google Scholar] [CrossRef]
- Estrada, E.; Rodríguez-Velázquez, J.A. Subgraph centrality and clustering in complex hyper-networks. Phys. A Stat. Mech. Appl. 2006, 364, 581–594. [Google Scholar] [CrossRef]
- Feng, S.; Heath, E.; Jefferson, B.; Joslyn, C.; Kvinge, H.; Mitchell, H.D.; Praggastis, B.; Eisfeld, A.J.; Sims, A.C.; Thackray, L.B.; et al. Hypergraph models of biological networks to identify genes critical to pathogenic viral response. BMC Bioinform. 2021, 22, 287. [Google Scholar] [CrossRef]
- Bianconi, G.; Dorogovtsev, S.N. Theory of percolation on hypergraphs. Phys. Rev. E 2024, 109, 014306. [Google Scholar] [CrossRef]
- Chung, F.; Lu, L.; Dewey, G.; Galas, D. Duplication Models for Biological Networks. J. Comput. Biol. 2003, 10, 677–687. [Google Scholar] [CrossRef]
- Ispolatov, I.; Krapivsky, P.L.; Yuryev, A. Duplication-divergence model of protein interaction network. Phys. Rev. E Stat. Nonlin. Soft. Matter. Phys. 2005, 71, 061911. [Google Scholar] [CrossRef]
- Zhang, R.; Reinert, G. Simulating Weak Attacks in a New Duplication–Divergence Model with Node Loss. Entropy 2024, 26, 813. [Google Scholar] [CrossRef]
- Birchler, J.A.; Yang, H. The multiple fates of gene duplications: Deletion, hypofunctionalization, subfunctionalization, neofunctionalization, dosage balance constraints, and neutral variation. Plant Cell 2022, 34, 2466–2474. [Google Scholar] [CrossRef] [PubMed]
- Ágoston, V.; Csermely, P.; Sándor, P. Multiple weak hits confuse complex systems: A transcriptional regulatory network as an example. Phys. Rev. 2005, 71, 051909. [Google Scholar] [CrossRef] [PubMed]
- Sun, H.; Bianconi, G. Higher-order percolation processes on multiplex hypergraphs. Phys. Rev. E 2021, 104, 034306. [Google Scholar] [CrossRef]
- Peng, H.; Qian, C.; Zhao, D.; Zhong, M.; Ling, X.; Wang, W. Disintegrate hypergraph networks by attacking hyperedge. J. King Saud-Univ.-Comput. Inf. Sci. 2022, 34, 4679–4685. [Google Scholar] [CrossRef]
- Feng, R.; Ke, Q.; She, L.; Kong, X.; Liu, C.; Zhan, X.X. Hypergraph dismantling with spectral clustering. Commun. Nonlinear Sci. Numer. Simul. 2025, 105, 108975. [Google Scholar] [CrossRef]
- Genetti, S.; Ribaga, E.; Cunegatti, E.; Lotito, Q.F.; Iacca, G. Influence maximization in hypergraphs using multi-objective evolutionary algorithms. In Proceedings of the International Conference on Parallel Problem Solving from Nature, Hagenberg, Austria, 14–18 September 2024. [Google Scholar]
- Peng, P.; Fan, T.; Lü, L. Network higher-order structure dismantling. Entropy 2024, 26, 248. [Google Scholar] [CrossRef]
- Latora, V.; Marchiori, M. Efficient behavior of small-world networks. Physical review letters. Phys. Rev. Lett. 2001, 87, 198701. [Google Scholar] [CrossRef] [PubMed]
- Vasilyeva, E.; Romance, M.; Samoylenko, I.; Kovalenko, K.; Musatov, D.; Raigorodskii, A.M.; Boccaletti, S. Distances in Higher-Order Networks and the Metric Structure of Hypergraphs. Entropy 2023, 25, 923. [Google Scholar] [CrossRef]
- Bergendahl, L.T.; Marsh, J.A. Functional determinants of protein assembly into homomeric complexes. Sci. Rep. 2017, 7, 4932. [Google Scholar] [CrossRef]
- Badonyi, M.; Marsh, J.A. Large protein complex interfaces have evolved to promote cotranslational assembly. eLife 2022, 11, e79602. [Google Scholar] [CrossRef]
- Balu, S.; Huget, S.; Medina Reyes, J.; Ragueneau, E.; Panneerselvam, K.; Fischer, S.; Claussen, E.; Kourtis, S.; Combe, C.; Meldal, B.; et al. Complex portal 2025: Predicted human complexes and enhanced visualisation tools for the comparison of orthologous and paralogous complexes. Nucleic Acids Res. 2025, 53, D644–D650. [Google Scholar] [CrossRef]
- Mancastroppa, M.; Iacopini, I.; Petri, G.; Barrat, A. Hyper-cores promote localization and efficient seeding in higher-order processes. Nat. Commun. 2023, 14, 6223. [Google Scholar] [CrossRef] [PubMed]
- Galimberti, E.; Barrat, A.; Bonchi, F.; Cattuto, C.; Gullo, F. Mining (maximal) span-cores from temporal networks. In Proceedings of the 27th ACM international Conference on Information and Knowledge Management, Torino, Italy, 22–26 October 2018; pp. 107–116. [Google Scholar]
- Lotito, Q.F.; Montresor, A. Efficient algorithms to mine maximal span-trusses from temporal graphs. arXiv 2020, arXiv:2009.01928. [Google Scholar] [CrossRef]
- Lo, T.; Reinert, G.; Zhang, R. Isolated vertices in two duplication-divergence models with edge deletion. arXiv 2025, arXiv:2501.11077. [Google Scholar] [CrossRef]
- De Silva, E.; Stumpf, M.P. Complex networks and simple models in biology. J. R. Soc. Interface 2005, 2, 419–430. [Google Scholar] [CrossRef]
Disclaimer/Publisher’s Note: The statements, opinions and data contained in all publications are solely those of the individual author(s) and contributor(s) and not of MDPI and/or the editor(s). MDPI and/or the editor(s) disclaim responsibility for any injury to people or property resulting from any ideas, methods, instructions or products referred to in the content. |
© 2025 by the authors. Licensee MDPI, Basel, Switzerland. This article is an open access article distributed under the terms and conditions of the Creative Commons Attribution (CC BY) license (https://creativecommons.org/licenses/by/4.0/).