Abstract
Anthropogenic night light (ANL) provides a unique observable for the spatially explicit mapping of human-modified landscapes in the form of lighted infrastructure. Since 2013, the Visible Infrared Imaging Radiometer Suite (VIIRS) Day Night Band (DNB) on the Suomi NPP satellite has provided more than a decade of near-daily observations of anthropogenic night light. The objective of this study is to quantify changes in ANL in developed eastern China post-2013 using VIIRS DNB monthly mean brightness composites. Specifically, to constrain sub-annual and interannual changes in night light brightness to distinguish between apparent and actual change of ANL sources, and then conduct a spatiotemporal analysis of observed changes to identify areas of human activity, urban development and rural electrification. This analysis is based on a combination of time-sequential bitemporal brightness distributions and quantification of the spatiotemporal evolution of night light using Empirical Orthogonal Function (EOF) analysis. Bitemporal brightness distributions show that bright (>~1 nW/cm2/sr) ANL is heteroskedastic, with temporal variability diminishing with increasing brightness. Hence, brighter lights are more temporally stable. In contrast, dimmer (<~1 nW/cm2/sr) ANL is much more variable on monthly time scales. The same patterns of heteroskedasticity and variability of the lower tail of the brightness distribution are observed in year-to-year distributions. However, year-to-year brightness increases vary somewhat among different years. While bivariate distributions quantify aggregate changes on both subannual and interannual time scales, spatiotemporal analysis quantifies spatial variations in the year-to-year temporal evolution of ANL. The spatial distribution of brightening (and, much less commonly, dimming) revealed by the EOF analysis indicates that most of the brightening since 2013 has occurred at the peripheries of large cities and throughout the networks of smaller settlements on the North China Plain, the Yangtze River Valley, and the Sichuan Basin. A particularly unusual pattern of sequential brightening and dimming is observed on the Loess Plateau north of Xi’an, where extensive terrace construction has occurred. All aspects of this analysis highlight the difference between apparent and actual changes in night light sources. This is important because many users of VIIRS night light attribute all observed changes in imaged night light to actual changes in anthropogenic light sources—without consideration of low luminance variability related to the imaging process itself.
1. Introduction
Anthropogenic night light (ANL) provides a unique observable for spatially explicit mapping of human-modified landscapes in the form of lighted infrastructure. From 1994 to 2013, the Defense Meteorological Satellite Program (DMSP) [1] collected digital imagery of the Earth at night using a series of Operational Line Scanner (OLS) instruments [2]. For decades, the DMSP-OLS program provided the sole source of regular global observations of moonlit clouds, as well as visible and infrared emissions of anthropogenic night light on moonless nights. The seminal work of Elvidge, Sutton, and colleagues focused on the use of ANL as a proxy for population distribution [3,4,5], while later studies focused on proxies for economic development more specifically [6,7,8,9,10].
Subsequent studies of ANL demonstrated a consistent relationship between night light brightness and settlement size to quantify spatial network structure and scaling at continental to global scales [11,12]. Combining this brightness-dependent network structure with spatiotemporal analysis revealed a persistent rank-size scaling of lighted settlement networks in South and East Asia throughout the 1990s and 2000s. Specifically, one study [13] applied the successive brightness thresholding used in another study [11] to annual time series of DMSP night light to quantify the spatiotemporal network evolution over two decades of rapid urban development in South and East Asia. The power law scaling observed for static networks globally has been shown to persist over time for urban network growth in Asia. However, all these studies using DMSP-OLS imagery were limited to annual composite images with less than 2.5 km spatial resolution and were constrained by sensor detection limits and the ubiquitous spatial “overglow” phenomenon by which positional uncertainty and atmospheric scattering together cause the lighted area detected by the OLS sensors to overestimate the spatial extent of light sources [14].
Since 2013, the Visible Infrared Imaging Radiometer Suite (VIIRS) Day Night Band (DNB) on the Suomi NPP satellite has provided more than a decade of daily observations of anthropogenic night light. In comparison to DMSP-OLS night light imagery, VIIRS DNB offers considerably greater dynamic range (14 vs. 6 bit), higher spatial resolution (0.7 vs. 5 km), on-board calibration and greater sensitivity for low light imaging [15]. As a result, VIIRS can detect a much greater diversity of night lights than the DMSP-OLS sensors were able to resolve. Due to the improved spatial and temporal resolution, VIIRS is available as individual swaths, as well as monthly and annual cloud-masked composites.
Extending the successive brightness thresholding approach to VIIRS DNB monthly mean composites provided much more detailed spatial network structure than was possible with DMSP-OLS, and showed consistent network scaling down to sub-kilometer resolution [16]. Having established the persistence of spatial network scaling with VIIRS monthly composites, with now more than a decade of VIIRS observations, an obvious next step would be a spatiotemporal analysis of urban growth and evolution since 2013. However, the increased temporal frequency of imaging, with less temporal averaging than annual composites and greater spatial resolution, now makes it necessary to consider the distinction between apparent temporal changes of measured night light related to the imaging process and actual changes in the underlying sources of the night light being imaged.
The objective of this study is to quantify changes in ANL in eastern China since 2013 using VIIRS DNB monthly composites. Specifically, to constrain sub-annual and interannual changes in night light brightness to distinguish between apparent and actual change of ANL sources, and then conduct a spatiotemporal analysis of observed changes to identify areas of human activity, development, and rural electrification. This is accomplished through an analysis of brightness-dependent changes in month-to-month and year-to-year night light distributions, followed by an Empirical Orthogonal Function (EOF) analysis of VIIRS DNB monthly composites between 2013 and 2025. The variance-based EOF analysis factors the spatiotemporal variance into orthogonal modes with complementary spatial and temporal components. Because the principal component (PC) transform, upon which the EOF analysis is based, ranks the orthogonal dimensions by contribution to total variance, it provides a basis for discriminating deterministic signal from stochastic noise of apparent change in night light associated with the imaging process from actual change in the sources of ANL.
The scope of the analysis is limited to eastern China, where almost all cities and settlements are located. A small number of cities in western China have been omitted in the interest of balance between lighted development and unlit, undeveloped areas.
2. Materials and Methods
Monthly and annual changes in the aggregate distribution of VIIRS night light are first quantified using bitemporal distributions of Log10 radiance for the entire study area. Month-to-month distributions quantify changes across years in the same season as well as changes from season to season. Year-to-year distributions in the same month (January) quantify year-to-year changes for the month with the greatest average number of cloud-free observations. Spatiotemporal changes in night light are quantified with an EOF analysis of the mean monthly luminance for January of each year. The results of the EOF analysis are presented as spatial principal components (i.e., maps) and temporal EOFs (i.e., decadal trends) and are substantiated with tri-temporal luminance maps. Decomposition of the spatiotemporal array was done via Singular Value Decomposition using ENVI software (v5.6, https://www.nv5geospatialsoftware.com/Products/ENVI, accessed on 10 November 2025).
2.1. Data
The Visible Infrared Imaging Radiometer Suite (VIIRS) sensor was launched as the primary payload on the NASA-NOAA Suomi satellite in 2011. The day/night band (DNB) of the sensor collects low-light imagery in a 3000 km swath at a fixed resolution of 742 m with an equator overpass time of ∼1 AM local time. Individual VIIRS swaths are generally composited across multiple dates to exclude clouds and intermittent sources like fires. More detailed descriptions of the data, products, and applications of VIIRS imagery are given by the authors of [15,17]. The VIIRS monthly mean night light composites and cloud-free coverages used in this study were produced by the Earth Observation Group at the Colorado School of Mines (https://payneinstitute.mines.edu/eog/, accessed on 10 November 2025). All analyses in this study use the stray-light-corrected monthly mean radiance product. Because VIIRS radiances typically span four orders of magnitude, all analyses are performed using Log10 (radiance).
This study focuses on the more densely populated region of eastern China, where nearly all development is concentrated. Figure 1 shows a tri-temporal composite of the eastern China study area for 2015, 2020 and 2025, along with a bivariate brightness distribution showing the change between 2015 and 2025. In this composite, color implies change. For comparison, monthly night light composites and single date false color composites from individual acquisitions of EMIT imaging spectroscopy of four of the largest cities in China are shown in Figure 2a,b. These side-by-side comparisons show the differences in land cover associated with different brightnesses of night light.
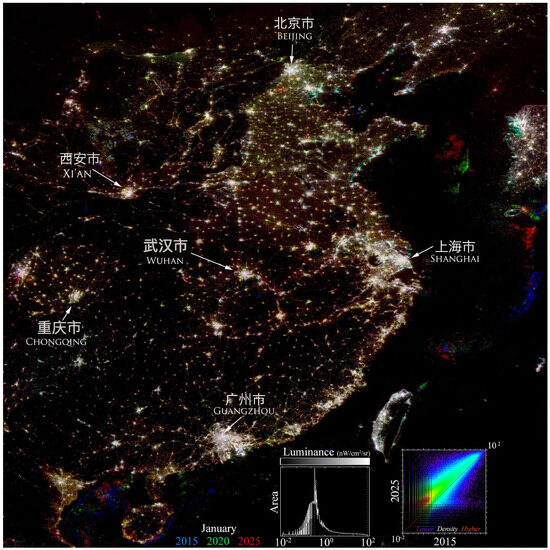
Figure 1.
Tri-temporal VIIRS night light composite for eastern China and surroundings. Color implies change. The study areas span urban-rural gradients of conurbations in diverse climates and landscapes. Beijing and Chongqing are located at the mountainous peripheries of agricultural basins. Shanghai and Guangzhou are on major river deltas. Wuhan and Xi’an are in inland river valleys. While interannual urban growth and electrification contribute to decadal brightening, background luminance (<~1 nW/cm2/sr) is more sensitive to subannual variability in cloud cover and atmospheric scattering [18].
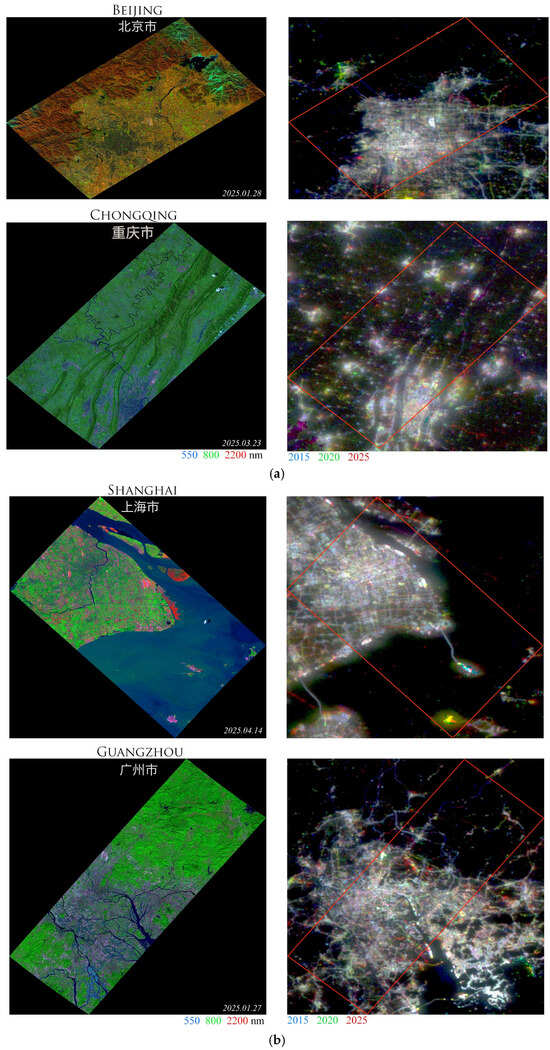
Figure 2.
(a) EMIT reflectance and VIIRS tri-temporal luminance for Beijing and Chongqing. The latitudinal scale of each is ~155 km. Color implies change in tri-temporal luminance composites. Warmer colors indicate brightening. Vegetation cover contrast of EMIT composites reflects different climates and dates of acquisition. (b) EMIT reflectance and VIIRS luminance for Shanghai and Guangzhou. The latitudinal scale is ~160 km for Shanghai and 220 km for Guangzhou. Color implies change in tri-temporal luminance composites. Warmer colors indicate brightening. Note the overglow extent on the water around Shanghai [18].
International Space Station (ISS) astronaut photos of example cities were obtained from the NASA Gateway to Astronaut Photography of Earth (https://eol.jsc.nasa.gov/, accessed on 10 November 2025). Nikon raw files were converted to DNG format and calibrated to a common color temperature and tint when taken with the same model of camera.
2.2. Methods
To establish the context within which changes in ANL occur, we first consider the overall distribution of all night lights in the study area and how it changes over time. Accordingly, this analysis is based on a combination of time-sequential bivariate brightness distributions and Empirical Orthogonal Function analysis. Empirical Orthogonal Function (EOF) analysis, originally developed for statistical weather prediction [19], is now a standard tool for analysis of spatiotemporal patterns and processes. Overviews of the use of EOF analysis in oceanography and meteorology are given by Refs. [20,21,22]. The combined use of EOF analysis with temporal feature spaces and temporal mixture models, with application to DMSP night light time series, is described in detail by Refs. [23,24]. In this study, the EOF analysis is used solely for characterizing the low-order temporal feature space, without applying temporal mixture modeling.
EOF analysis uses the principal component transform to represent spatiotemporal patterns as orthogonal modes of variance. Rotating the spatiotemporal coordinate system to align with orthogonal dimensions of uncorrelated variance allows any location-specific pixel time series Pxt in an N image time series to be represented as a linear combination of temporal patterns, F, and their location-specific spatial components, C, as:
where Cix is the spatial Principal Component (PC) and Fit is the corresponding temporal Empirical Orthogonal Function (EOF), and i is the dimension. EOFs are the eigenvectors of the spatiotemporal covariance matrix that represent uncorrelated temporal patterns of variability within the data. The PCs are the corresponding spatial weights that represent the relative contribution of each temporal EOF to the pixel time series Pxt at each location x. The relative contribution of each EOF to the total spatiotemporal variance of the observations is given by the eigenvalues of the covariance matrix. N is the number of discrete dimensions represented by the time series of observations. In this analysis, the temporal mean has not been subtracted prior to the PC transform being applied to the observations. The PC transform was implemented via Singular Value Decomposition using ENVI + IDL software (v.5.6).
Principal Components are uncorrelated but not necessarily independent—unless the data are normally distributed. In systems where the same deterministic processes are manifest at many locations, but stochastic processes are uncorrelated, the variance of the deterministic processes may be represented in the low-order PC/EOF dimensions while the stochastic variance may be relegated to the higher-order dimensions [20]. If a clear distinction can be made between a small number of physically meaningful EOFs (or PCs) distinct from a continuum of uninterpretable EOFs (or PCs), this can provide a statistical basis for attribution of deterministic and stochastic components of an image time series. However, the PC transformation is purely statistical, so there is no guarantee that any physical attribution to the spatial or temporal patterns will be physically meaningful.
3. Results
Bright (>~1 nW/cm2/sr) ANL is heteroskedastic, with temporal variability diminishing with increasing brightness. Hence, brighter lights are more temporally stable. Figure 3 compares subannual and interannual bivariate distributions of Log10 radiance spanning at least four orders of magnitude. Both month-to-month and year-to-year comparisons are consistently heteroskedastic, characterizing similar brightness-dependent variability on both time scales. In contrast, dimmer (<~1 nW/cm2/sr) ANL is more variable on both subannual and interannual time scales. In this figure, year-to-year comparisons use January composites because clear sky probability is greatest in January throughout China and diminishes monotonically with increasing cloud cover until the onset of the monsoon in May and June (https://weatherspark.com/compare/y/131055~126769~117232~137446/Comparison-of-the-Average-Weather-in-Beijing-Guangzhou-Chongqing-and-Shanghai, accessed on 10 November 2025).
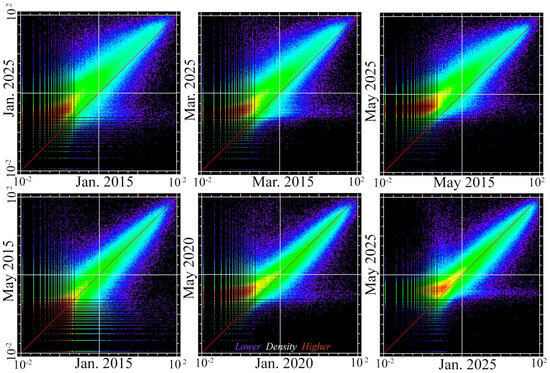
Figure 3.
Seasonal and decadal changes in VIIRS night light for eastern China. All three months show similar increases in luminance between 2015 and 2025, while all three years show similar distributions of monthly luminance for 2015, 2020, and 2025. The lower mode of the luminance distribution (<~10−1 nW/cm2/sr) varies considerably from month to month but is consistently higher in 2025 than in 2015. Despite variations in this background luminance, higher luminances scale linearly and show diminishing heteroskedasticity with increasing brightness across all months and years. The increase of all luminance levels and the increase in the lower mode between 2015 and 2025 both suggest either overall brightening of all sources or a persistent change in the imaging process, or both. In contrast, the subannual and interannual variability of the lower mode is consistent with daily, weekly and monthly variations in atmospheric opacity.
To substantiate the interannual changes seen in Figure 3, year-to-year annual changes are quantified for the full 2013–2025 interval. Figure 4 shows bivariate distributions spanning the same brightness range as Figure 3. The same patterns of heteroskedasticity and variability of the lower tail of the brightness distribution are observed in the year-to-year distributions. However, the year-to-year increases vary significantly among different years. As with the examples in Figure 3, the bivariate distributions also show a contrast between the stability of the upper tails of the distributions and the variability of the lower tails. It is noteworthy that the two distributions with the greatest year-to-year increase in upper tail brightness (2016–2017 and 2019–2020) correspond to opposite asymmetries in lower tail distribution changes—suggesting that lower tail asymmetries do not affect upper tail increases.
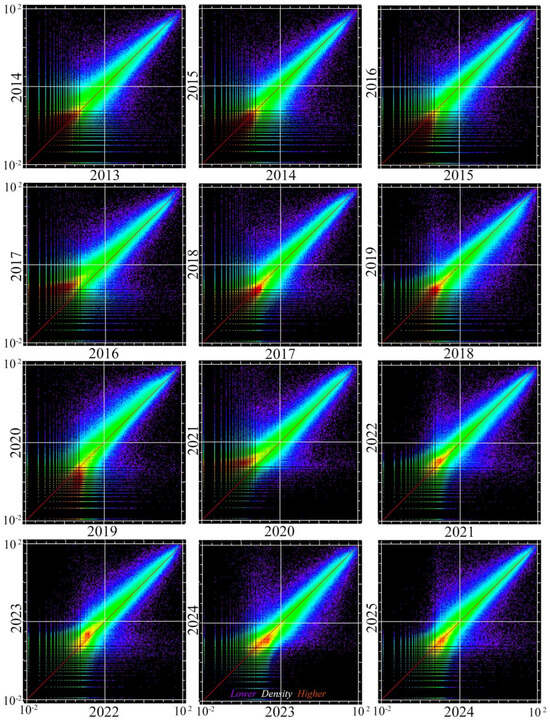
Figure 4.
Year-to-year variation in January luminance for eastern China. For all bivariate distributions, dispersion about 1:1 diminishes with increasing brightness, indicating that brighter lights are more temporally stable. Year-to-year variability of low luminance (<~100 nW/cm2/sr) contrasts with the generally increasing (>1:1) brightness from year to year. Changes in cloud masking algorithms between 2016 and 2021 may also affect the lower tails of the distributions (C. Elvidge, Pers. Comm.). The largest year-to-year increases (2016–2017 and 2019–2020) show opposite asymmetries in lower tail distributions, suggesting that variability in the lower tails does not affect the upper tails of the distributions.
While bivariate distributions quantify aggregate changes on both subannual and interannual time scales, spatiotemporal analysis quantifies spatial variations in the temporal evolution of ANL.
The EOF analysis effectively separates the spatially varying overall brightness component (PC 1) from orthogonal temporal trajectories of change (EOFs 2, 3). Moreover, the distribution of VIIRS temporal trajectories within the 2013–2025 temporal feature space is virtually identical to that obtained from the results from [13] for the 1994–2013 analysis of annual DMSP-OLS composites. A linear brightness axis accounting for spatial variations is perpendicular to a 2D phase plane that combines a decadal trend EOF with a decadal half-cycle EOF (Figure 5). Temporal EOF 1 is effectively flat in time, indicating that 88% of the total spatiotemporal variance it describes is purely spatial, i.e., the stable difference between bright and dark areas. Linear combinations of EOFs 2 and 3 allow for both increases (PC 2 > 0) and decreases (PC 2 < 0) over the study interval, with the concave (PC 3 > 0) and convex (PC 3 < 0) half cycles of EOF 3 modulating the phase to allow the full range of earlier and later increases and decreases (Figure 5).
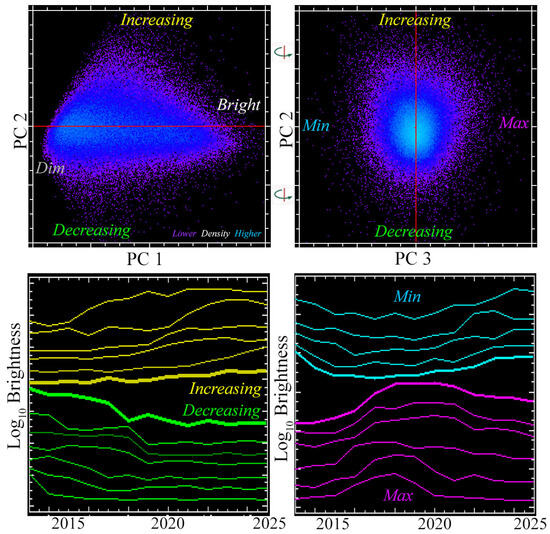
Figure 5.
Temporal feature space and peripheral night light trajectories for the 2013–2025 January VIIRS composite time series. The temporal feature space of spatial PCs 1 and 2 represents 84% and 6% of total spatiotemporal variance (respectively). Individual pixel time series from the peripheries of the feature space illustrate the asymmetry between significantly increasing and slightly decreasing brightness. In the orthogonal projection of the 3D space, PC 3 represents only 2% of the total variance with relatively few concave (Min) or convex (Max) trajectories. Largest in/decreases occur at lower brightness levels.
The spatial distribution of brightening (and much less common dimming) shown by PC 2 (Figure 6) indicates that most of the brightening occurred at the peripheries of large cities and conurbations and throughout the network of smaller settlements throughout the North China Plain. These patterns are shown in more detail in Figure 7a–c.
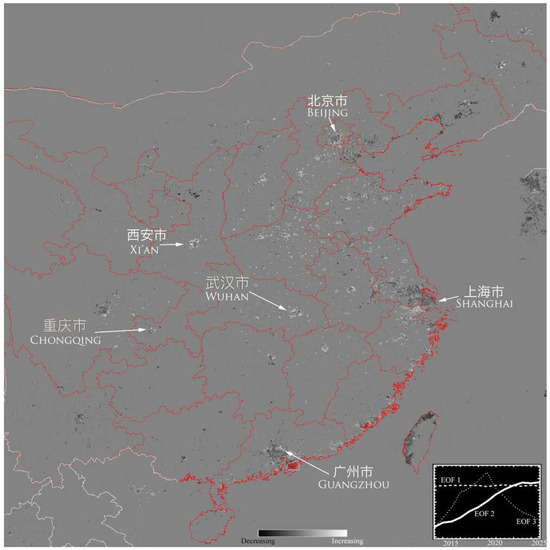
Figure 6.
Decadal night light luminance change map from spatial PC 2 of the January VIIRS time series. Larger urban cores are darker, suggesting a slight decrease in luminance since 2013. In contrast, larger urban peripheries and numerous smaller cities are lighter, indicating increasing luminance since 2013. Temporal EOF 2 (inset LR) shows a slower increase post-2023.
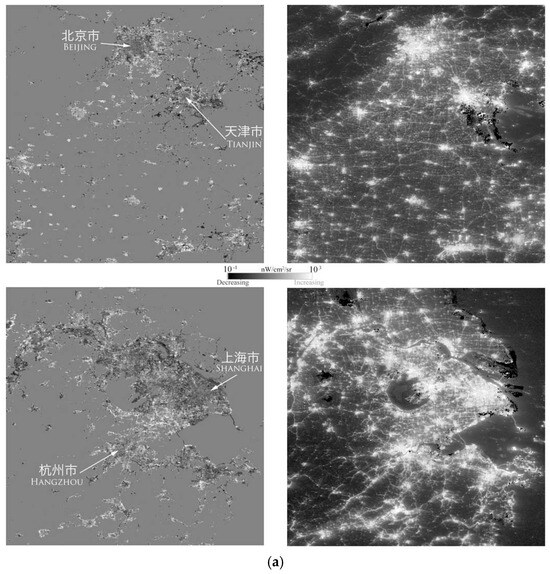
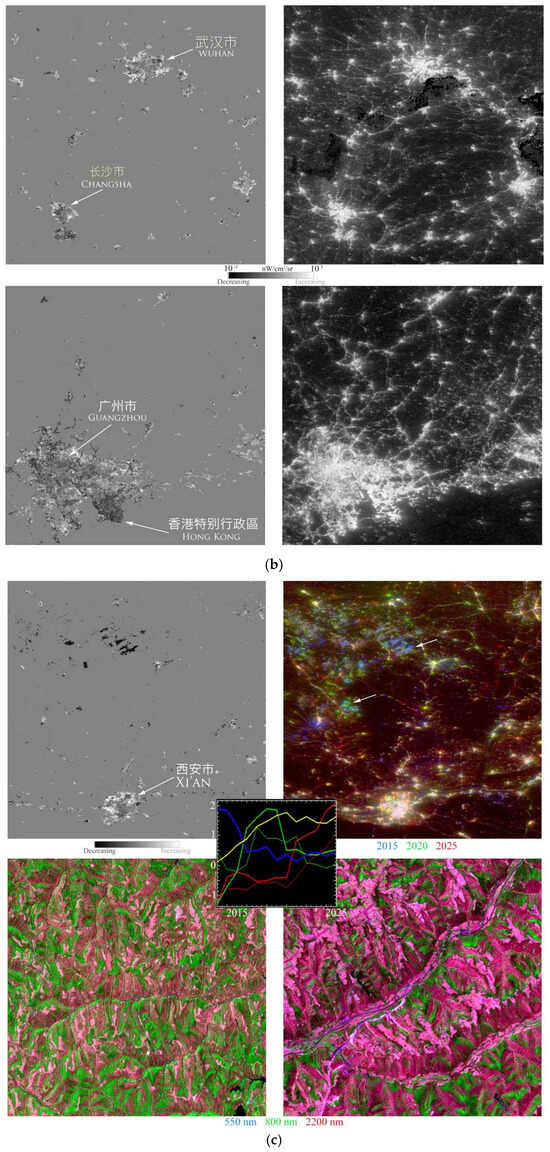
Figure 7.
(a) Decadal luminance change for the North China Plain and Changjiang Delta. In both regions, brightening occurred on peripheries of urban cores and in smaller outlying settlements. (b) Decadal luminance change for the Yangtze River Valley and Pearl River Delta. In both regions, brightening occurred on peripheries of urban cores and in smaller outlying settlements. (c) Decadal night light change for Xi’an, the Wei River Valley, and the Loess Plateau. Brightening occurred on the periphery of the urban core and in smaller outlying settlements, while significant dimming occurred in the vicinity of terrace complexes to the north. Inset brightness trajectories (Log10 nW/cm2/sr) are color-coded for consistency with change colors on tri-temporal composite (UR). Arrows show locations of 10 m Sentinel 2 false color composites (bottom) showing dry bare soil as lighter shades of pink.
It is noteworthy that little brightening is seen in cities of northeastern China beyond the North China Plain or in southern China, aside from the periphery of the Pearl River Delta and some coastal cities. The lack of brightening in the northeast is consistent with the findings of the authors of [25]. The apparent dimming of some larger urban cores, while slight, may be partially attributable to the replacement of brighter incandescent with dimmer LED lighting sources, as seen in the contrast between warmer and cooler color spectra in astronaut photographs [26]. However, this hypothesis cannot be supported or rejected on the basis of broadband luminance observations (i.e., VIIRS) alone and requires further investigation.
A particularly unusual pattern of sequential brightening and dimming is observed on the Loess Plateau north of Xi’an (Figure 7c). The areas where this intermittent brightening and dimming have occurred also showed similar patterns in DMSP data during the early 2000s [13]. Investigations into these and other intermittent light patterns using DMSP and vicarious validation with Google Earth suggest that those on the Loess Plateau were associated with terrace construction in the early 2000s, as evidenced by the presence of heavy construction equipment, which would be required to construct terraces over such large areal extents [27].
Comparing interannual to subannual changes with bivariate luminance distributions and tri-temporal composites reveals relatively little change month to month but considerable change on decadal time scales. This is particularly noteworthy around Wuhan (Figure 8a) and Shanghai (Figure 8b), in that neither of these areas showed any significant month-to-month change during the 2020 and 2022 COVID lockdowns (respectively). What little change is apparent does not conform to the expected pattern of less or dimmer night light during the lockdowns. This apparent contradiction to the conclusions of earlier studies, finding evidence for reduced lighting during lockdowns, can be explained by the disparity between temporally stable bright lights and temporally variable background luminance. Spatially aggregate measures of total luminance contain much larger areas of variable low luminance than stable bright light sources. As a result, studies using individual overpass observations (without temporal averaging) aggregated in space will be particularly sensitive to large areas of low luminance variability unrelated to actual changes in anthropogenic sources. In contrast, the monthly mean composites (Figure 8a,b) clearly show no consistent changes in the stable light distribution before and during lockdowns.
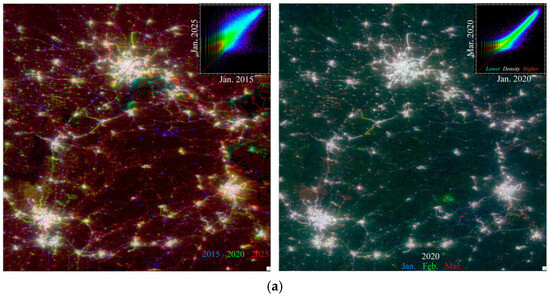
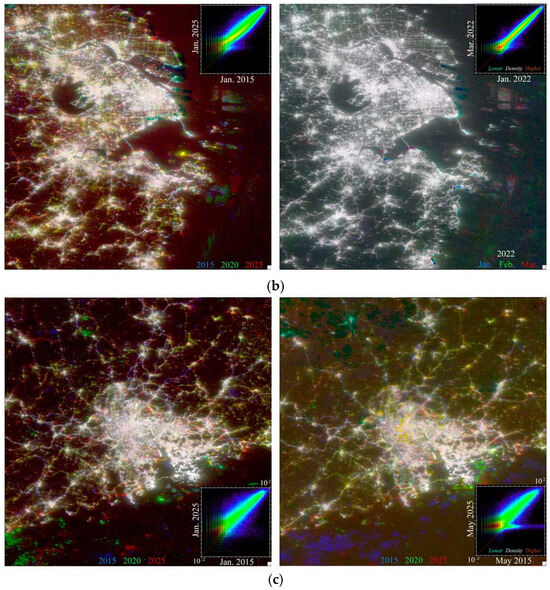
Figure 8.
(a) Decadal and monthly tri-temporal change maps for Wuhan and the Yangtze River Valley in 2020. On both composites, color implies change. While some March brightening (red, right) is seen around Wuhan in 2020, and more extensively around Changsha, there is no detectable dimming (blue, right) in Wuhan (or elsewhere) after January during the COVID lockdowns. In contrast, small settlements outside the urban cores throughout the region have increased in luminance since 2020 (red, left). (b) Decadal and monthly tri-temporal change maps for Shanghai and the Changjiang Delta in 2022. On both composites, color implies change. There is no detectable dimming (blue) in Shanghai (or elsewhere) in early 2022 during the COVID lockdowns. In stark contrast, small settlements and corridors outside the urban cores have increased in luminance since 2015 (yellow) and 2020 (red, left). The most conspicuous changes in both composites occur on lighted ships moored offshore. (c) Decadal tri-temporal change maps for Guangzhou and the Pearl River delta in January and May. In addition to fishing boats offshore, numerous small point changes are seen throughout the region in both months. Increased background luminance noise is apparent for all 3 years in the May composite (right). This is consistent with fewer cloud-free coverages and greater atmospheric scattering at the onset of the monsoon in late May. An identical linear stretch (10−1, 102) nW/cm2/sr was applied to both composites.
Comparing decadal changes in different months highlights the effect of seasonal variations in cloud cover and atmospheric opacity. Figure 8c compares decadal tri-temporal maps for the Pearl River Delta and surroundings. It is immediately apparent from both the tri-temporal maps and bivariate distributions that the level of background luminance varies significantly between January and May in southern China. A comparison of cloud-free coverage maps (Figure 9) for the monthly VIIRS composites confirms that the northward movement of the Intertropical Convergence Zone (ITCZ) between January and May significantly reduces the number of cloud-free coverages per month in all areas impacted by upwelling of the ITCZ and its convergence with the Asian monsoon to produce more extensive cloud cover and precipitation.
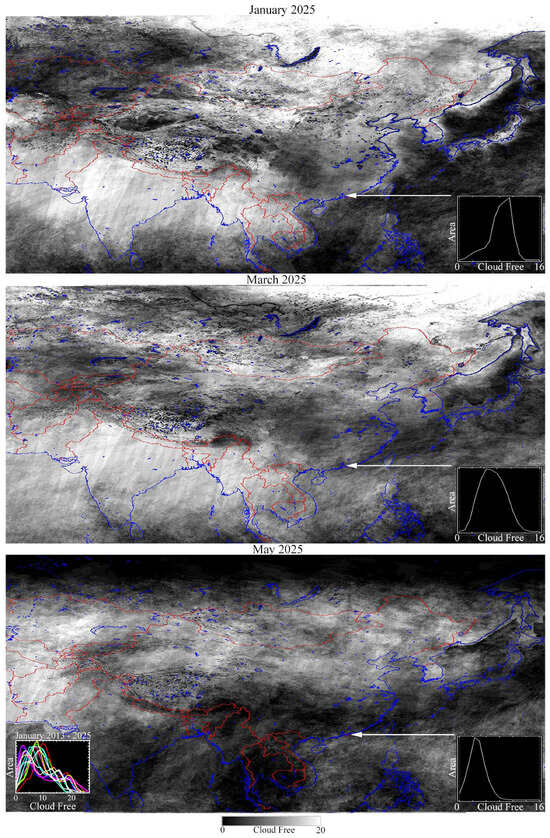
Figure 9.
VIIRS DNB monthly cloud-free coverages for Asia in 2025. By May, the northward movement of the ITCZ produces increased cloud cover and reduced cloud-free coverages at lower latitudes throughout Asia. Inset histograms (right) show distributions of cloud-free pixels for the Pearl River delta region in Figure 8c. Inset histograms for E. China (left) generally has <10 (μ: 8.9, σ: 4.4) cloud-free acquisitions per January.
Astronaut photographs taken from the International Space Station (ISS) provide additional insights into some VIIRS observations. Specifically, the greater spatial resolution of these photos, and high S/N of photos taken under clear sky conditions, illustrate the size and spatial distributions of individual sources below the ~700 m resolution of VIIRS’ DNB. It is apparent from the photos in Figure 10a–c that most light sources are associated with lighted thoroughfares, airports and seaports. While this can be inferred from some monthly VIIRs composites, the astronaut photos show these features explicitly. Similarly, the decameter spatial resolution of the motion-compensated photos taken with the 400 mm telephoto lenses reveals spatial variations in image sharpness likely resulting from heterogeneity in the degree of scattering from tropospheric water vapor, as illustrated in multiple examples in Figure 10a–c. Finally, differences in view geometry and acquisition times can highlight sources of variability like non-vertical façade lighting and local time of day relative to VIIRS’ ~1 AM overpass time.
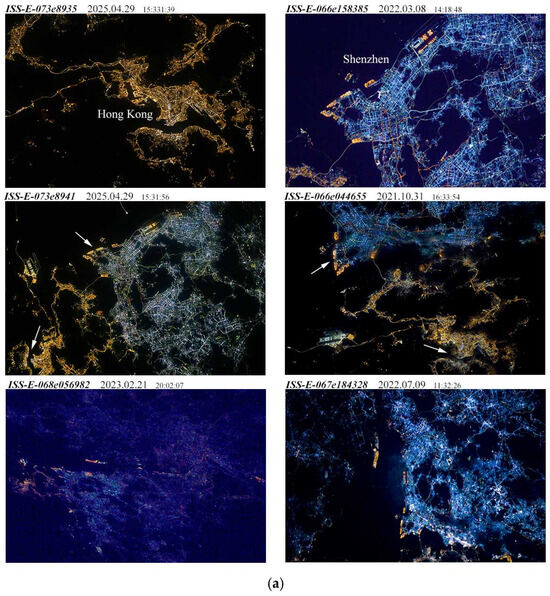
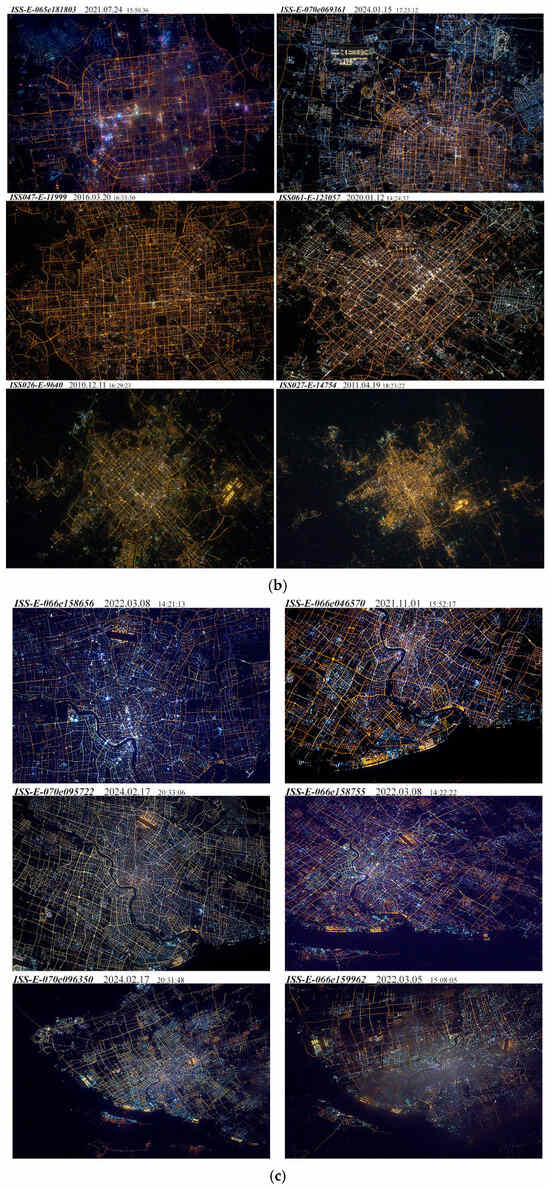
Figure 10.
(a) Astronaut photographs of the Pearl River Delta taken from the International Space Station. All photos shot with motion-compensated Nikon cameras and various focal length lenses. Photos are not calibrated, so they reflect different white balance settings as shot. The 2021 image (center right) shows spatially variable blurring and dimming—likely due to tropospheric water vapor. Different colors and brightnesses of light are due to different incandescent and LED light sources. At decameter resolutions, it is apparent that most lighted areas result from highways, streets, and thoroughfares, as well as airports and seaports. (b) Astronaut photographs of Beijing taken from the International Space Station. All photos were shot with motion-compensated Nikon cameras, but with different focal length lenses. Photos are not raw calibrated, so they reflect different white balance settings as shot. The greater number and brightness of white lights within the four inner ring roads in the 2020 shot may be a combined result of the earlier local time and more oblique view geometry, imaging more illuminated façades and commercial lighting not seen in the near-nadir view 2016 shot taken after midnight local time. Spatially variable blurring and dimming, likely from tropospheric water vapor, is visible throughout the 2021 shot (UL). (c) Astronaut photographs of Shanghai taken from the International Space Station. All photos shot with motion-compensated Nikon D5 cameras and 400 mm lenses. Each photo has been raw calibrated to 2500–3000 K color temperature. The 2022.03.05 image (LR) shows spatially variable blurring and dimming—likely due to tropospheric water vapor. Different colors and brightnesses of light are due to different incandescent and LED light sources. At these decameter resolutions, it is apparent that most lighted areas result from lighted highways, streets, and thoroughfares, as well as airports and seaports.
4. Discussion
All aspects of this analysis highlight the difference between apparent and actual changes in night light sources. This is important because many users of DMSP and VIIRS night light products attribute all observed changes in imaged night light to actual changes in anthropogenic light sources. Multiple examples shown here provide ample evidence to the contrary. Most notably, pervasive variability in low luminance (<10−1 nW/cm2/sr) distributions of monthly averages. Given the averaging effect of tens of individual observations per month, this low luminance variability of the monthly means suggests even greater variability from day to day. Therefore, attributing this low luminance variability to month-to-month changes in anthropogenic light sources is implausible. Particularly given the pervasive stability of higher luminance observations from month to month and year to year. Attributing low luminance variability to anthropogenic processes begs the question of why such variability is not present in higher luminance observations—and why variance of brighter sources diminishes monotonically with increasing brightness. One plausible explanation for this low luminance variability could be temporal variability in atmospheric opacity. Particularly, the effect of tropospheric water vapor, which has been shown to vary considerably in space and time (e.g., [28]). Varying atmospheric opacity would be expected to affect the imaging of dimmer sources more than that of brighter sources for obvious reasons.
Month-to-month changes in the cloud-free coverage maps provided by EOG, along with all VIIRS monthly composites, reveal the effects of this source of month-to-month variability in atmospheric opacity, particularly in monsoon Asia. The January–May decrease in sharpness of the composite images for the Pearl River Delta (Figure 8c) is consistent with increased atmospheric scattering resulting from increases in tropospheric water vapor preceding the onset of the summer monsoon. This type of change in the magnitude of the source signal to atmospheric noise affects the measurement of all light sources, but dimmer sources more so. The concomitant annual decrease in the number of cloud-free acquisitions (Figure 9) for southern China supports this assertion.
In the presence of VIIRS DNB S/N that varies both in space and time, the use of EOF analysis to separate persistent signal from intermittent noise provides independent support for several of the inferences drawn from observations in this analysis. Specifically, that luminance increases revealed in tri-temporal composites are associated with persistent, but variable, year-to-year increases since 2013. The ability of the EOF analysis to separate spatial variations in stable source brightness (PC 1) from decadal change trajectories effectively isolates four fundamental categories of change that can be represented as linear combinations of decadal trends (EOF 2) and decadal extrema (EOF 3), as illustrated in Figure 5 and Figure 6.
The contrast between the low luminance variability and the high luminance stability evidenced by both the bitemporal distributions and the tri-temporal maps in this study, and previously by the authors of [29], provides a possible explanation for the lack of lockdown effects demonstrated in Figure 8a,b. Previous studies based on spatially aggregated measures of VIIRS luminance, with no low luminance thresholding, risk conflating apparent and actual change. Without applying thresholds to exclude the natural variability of low-luminance sources and atmospheric effects, such aggregate measures of change presumably incorporate natural month-to-month low-luminance variability, thereby introducing artifacts resulting from the large areas of low-luminance sources and overglow subject to variable atmospheric opacity. This further highlights the importance of characterizing the full range of luminance and its natural temporal variability before attributing observed changes in measured luminance to actual changes in anthropogenic light sources.
The limitations of using hectometer to kilometer resolution broadband imagery to distinguish actual from apparent change in ANL are primarily related to the spatial scale of aggregation within VIIRS’ ~700 m (and DMSP’s ~5 km) Instantaneous Field of View (IFoV) that determines the effective footprint of individual pixels. Because this IFoV is much larger than the individual point sources of light measured, and incorporates the effects of atmospheric scattering of these sources in the aggregation, the actual light sources give rise to the time variable scattering processes that are a primary source of apparent change. However, the ability of astronauts on ISS to obtain high-quality decameter resolution images with commercially available digital cameras and telephoto lenses suggests that the spatial resolution available to current operational night light mapping and monitoring missions could supplement the hectometer resolution observations of VIIRS. The nature of this tradeoff in spatial, spectral and temporal resolution has been examined in detail by the authors of [30]. Given the uniqueness of ANL and its ability to resolve forms of development that are difficult or impossible to distinguish with optical sensors designed for reflected daytime solar radiance, the potential benefits of future ANL imaging sensors with decameter resolution could be considerable.
5. Conclusions
The objective of this study was to quantify changes in ANL in eastern China since 2013 using VIIRS DNB monthly composites, which was achieved using both bitemporal luminance distributions and spatiotemporal EOF analysis, with results substantiated using tri-temporal composites and decameter resolution ISS astronaut photographs. Despite the caveats given above, the VIIRS monthly composites do provide some robust observations on the spatiotemporal dynamics of ANL in China since 2013.
- Persistent, monotonic increases in ANL brightness have occurred on the peripheries of most large cities and conurbations—as well as in networks of smaller settlements on the North China Plain, the Sichuan Basin and the Yangtze River Valley.
- No lockdown effects are detectable as month-to-month changes of ANL in and around either Wuhan in January–March 2020 or Shanghai in January–March 2022. Both bitemporal luminance distributions and tri-temporal change maps show the vast majority of stable luminance (>~1 nW/cm2/sr) as unchanged—despite the month-long duration of both lockdowns. Furthermore, both bivariate regional luminance distributions show brighter low-luminance (<~1 nW/cm2/sr) tails than before either lockdown.
- Intermittent changes in non-urban ANL observed on the Loess Plateau with DMSP in the early 2000s persist in post-2013 VIIRS monthly composites. Meter and decameter-resolution optical imagery suggest that these changes are associated with extensive large-scale terracing for agriculture.
- Astronaut photos taken from the ISS reveal intermittent spatial variations in atmospheric opacity over Beijing, Shanghai, and the Pearl River Delta—even under otherwise clear atmospheric conditions. These scattering effects, most likely due to tropospheric water vapor, are observed in astronaut photos of ANL worldwide and certainly contribute to variability in lower luminance VIIRS observations.
- Attribution of low luminance variability to month-to-month changes in anthropogenic light sources is generally implausible. Particularly given the pervasive stability of higher luminance observations from month to month and year to year.
Funding
The author acknowledges support from the endowment of the Lamont Doherty Earth Observatory of Columbia University.
Data Availability Statement
All data used in this study are publicly available free of charge from the sources given in the Data section.
Conflicts of Interest
The author declares no conflict of interest.
References
- Croft, T.A. Nighttime images of the earth from space. Sci. Am. 1978, 239, 86–101. [Google Scholar] [CrossRef]
- Elvidge, C.D.; Baugh, K.E.; Kihn, E.A.; Kroehl, H.W.; Davis, E.R. Mapping city lights with nighttime data from the DMSP operational linescan system. Photogramm. Eng. Remote Sens. 1997, 63, 727–734. [Google Scholar]
- Elvidge, C.D.; Baugh, K.E.; Hobson, V.R.; Kihn, E.A.; Kroehl, H.W.; Davis, E.R.; Cocero, D. Satellite inventory of human settlements using nocturnal radiation emissions: A contribution for the global toolchest. Glob. Change Biol. 1997, 3, 387–395. [Google Scholar] [CrossRef]
- Sutton, P.; Roberts, C.; Elvidge, C.; Meij, H. A comparison of nighttime satellite imagery and population density for the continental united states. Photogramm. Eng. Remote Sens. 1997, 63, 1303–1313. [Google Scholar]
- Sutton, P.; Roberts, D.; Elvidge, C.; Baugh, K. Census from Heaven: An estimate of the global human population using night-time satellite imagery. Int. J. Remote Sens. 2001, 22, 3061–3076. [Google Scholar] [CrossRef]
- Elvidge, C.D.; Baugh, K.E.; Kihn, E.A.; Kroehl, H.W.; Davis, E.R.; Davis, C.W. Relation between satellite observed visible-near infrared emissions, population, economic activity and electric power consumption. Int. J. Remote Sens. 1997, 18, 1373–1379. [Google Scholar] [CrossRef]
- Henderson, M.; Yeh, E.T.; Gong, P.; Elvidge, C.; Baugh, K. Validation of urban boundaries derived from global night-time satellite imagery. Int. J. Remote Sens. 2003, 24, 595–609. [Google Scholar] [CrossRef]
- Henderson, J.V.; Storeygard, A.; Weil, D.N. Measuring Economic Growth from Outer Space. Am. Econ. Rev. 2012, 102, 994–1028. [Google Scholar] [CrossRef]
- Nordhaus, W.; Chen, X. A sharper image? Estimates of the precision of nighttime lights as a proxy for economic statistics. J. Econ. Geogr. 2015, 15, 217–246. [Google Scholar] [CrossRef]
- Doll, C.N.H.; Muller, J.P.; Elvidge, C.D. Night-time imagery as a tool for global mapping of socioeconomic parameters and greenhouse gas emissions. Ambio 2000, 29, 157–162. [Google Scholar] [CrossRef]
- Small, C.; Elvidge, C.; Balk, D.; Montgomery, M. Spatial Scaling of Stable Night Lights. Remote Sens. Environ. 2011, 115, 269–280. [Google Scholar] [CrossRef]
- Small, C.; Sousa, D. Spatial Scaling of Land Cover Networks. arXiv 2015, arXiv:1512.01517. [Google Scholar] [CrossRef]
- Small, C.; Elvidge, C.D. Night on Earth: Mapping decadal changes of night light in Asia. Int. J. Appl. Earth Obs. Geoinf. 2013, 22, 40–52. [Google Scholar] [CrossRef]
- Small, C.; Pozzi, F.; Elvidge, C.D. Spatial analysis of global urban extent from DMSP-OLS night lights. Remote Sens. Environ. 2005, 96, 277–291. [Google Scholar] [CrossRef]
- Elvidge, C.D.; Baugh, K.E.; Zhizhin, M.; Hsu, F.C. Why VIIRS data are superior to DMSP for mapping nighttime lights. Proc. Asia-Pac. Adv. Netw. 2013, 35, 62–69. [Google Scholar] [CrossRef]
- Small, C. Multisensor characterization of urban morphology and network structure. Remote Sens. 2019, 11, 2162. [Google Scholar] [CrossRef]
- Miller, S.D.; Straka, W.; Mills, S.P.; Elvidge, C.D.; Lee, T.F.; Solbrig, J.; Walther, A.; Heidinger, A.K.; Weiss, S.C. Illuminating the Capabilities of the Suomi National Polar-Orbiting Partnership (NPP) Visible Infrared Imaging Radiometer Suite (VIIRS) Day/Night Band. Remote Sens. 2013, 5, 6717–6766. [Google Scholar] [CrossRef]
- Small, C.; Sousa, D. Spectroscopic Characterization of Built Environments in China. Remote Sens. 2025, 17, 3642. [Google Scholar] [CrossRef]
- Lorenz, E.N. Empirical orthogonal functions and statistical weather prediction. In Statistical Forecasting Project; MIT: Cambridge, MA, USA, 1956; p. 48. [Google Scholar]
- Preisendorfer, R.W. Principal Component Analysis in Meteorology and Oceanography; Mobley, C.D., Ed.; Elsevier: Amsterdam, The Netherlands, 1988; p. 438. [Google Scholar]
- Bretherton, C.S.; Smith, C.; Wallace, J.M. An intercomparison of methods for finding coupled patterns in climate data. J. Clim. 1992, 5, 541–560. [Google Scholar] [CrossRef]
- von Storch, H.; Zwiers, F.W. Statistical Analysis in Climate Research; Cambridge University Press: Cambridge, UK, 1999; p. 484. [Google Scholar]
- Small, C. Spatiotemporal dimensionality and time-space characterization of multitemporal imagery. Remote Sens. Environ. 2012, 124, 793–809. [Google Scholar] [CrossRef]
- Small, C.; Elvidge, C.D. Mapping Decadal Change in Anthropogenic Night Light. Procedia Environ. Sci. 2011, 7, 353–358. [Google Scholar] [CrossRef]
- Chen, Y. Geographically Heterogeneous Spatial Inequality in the People’s Republic of China: A Luminosity-Based Analysis of Prefectural Cities and Counties. Asian Dev. Rev. 2025, 42, 55–81. [Google Scholar] [CrossRef]
- Small, C. Spectrometry of the Urban Lightscape. Technologies 2022, 10, 93. [Google Scholar] [CrossRef]
- Tan, K.; Small, C.; Xing, X.; Elvidge, C. Multi-temporal Analysis of Urban Growth and Development in China. Proceedings of Fifth International Workshop on the Analysis Of Multi-Temporal Remote Sensing Images 2009 (MultiTemp 2009), Groton, CT, USA, 28–30 July 2009; Civco, D., Ed.; Curran: Groton, CT, USA, 2009; p. 451. [Google Scholar]
- Van Malderen, R.; Pottiaux, E.; Stankunavicius, G.; Beirle, S.; Wagner, T.; Brenot, H.; Bruyninx, C.; Jones, J. Global Spatiotemporal Variability of Integrated Water Vapor Derived from GPS, GOME/SCIAMACHY and ERA-Interim: Annual Cycle, Frequency Distribution and Linear Trends. Remote Sens. 2022, 14, 1050. [Google Scholar] [CrossRef]
- Small, C. Spatiotemporal Characterization of VIIRS Night Light. Front. Remote Sens. 2021, 2, 775399. [Google Scholar] [CrossRef]
- Elvidge, C.D.; Cinzano, P.; Pettit, D.R.; Arvesen, J.; Sutton, P.; Small, C.; Nemani, R.; Longcore, T.; Rich, C.; Safran, J.; et al. The Nightsat mission concept. Int. J. Remote Sens. 2007, 28, 2645–2670. [Google Scholar] [CrossRef]


Disclaimer/Publisher’s Note: The statements, opinions and data contained in all publications are solely those of the individual author(s) and contributor(s) and not of MDPI and/or the editor(s). MDPI and/or the editor(s) disclaim responsibility for any injury to people or property resulting from any ideas, methods, instructions or products referred to in the content. |
© 2025 by the author. Licensee MDPI, Basel, Switzerland. This article is an open access article distributed under the terms and conditions of the Creative Commons Attribution (CC BY) license (https://creativecommons.org/licenses/by/4.0/).