Abstract
This study proposes GSM, an interpretable and operational GAM-SHAP-MCDA framework for stroke risk stratification by integrating generalized additive models (GAMs), a point-based clinical scoring system, SHAP-based explainability, and multi-criteria decision analysis (MCDA). Using a publicly available dataset of individuals ( stroke prevalence), a GAM was fitted to capture nonlinear effects of key physiological predictors, including age, average blood glucose level, and body mass index (BMI), together with linear effects for hypertension, heart disease, and categorical covariates. The estimated smooth functions revealed strong age-related risk acceleration beyond 60 years, threshold behavior for glucose levels above approximately , and a non-monotonic BMI association with peak risk at moderate BMI ranges. In a comparative evaluation, the GAM achieved superior discrimination and calibration relative to classical logistic regression, with a mean AUC of versus and a lower Brier score ( vs. ). A calibration analysis yielded an intercept of and a slope of , indicating near-ideal agreement between the predicted and observed risks. While high-capacity ensemble models such as XGBoost achieved slightly higher AUC values (), the GAM attained near-upper-bound performance while retaining full interpretability. To enhance clinical usability, the GAM smooth effects were discretized into clinically interpretable bands and converted into an additive point-based risk score ranging from 0 to 42, which was subsequently calibrated to absolute stroke probability. The calibrated probabilities were incorporated into the TOPSIS and VIKOR MCDA frameworks, producing transparent and robust patient prioritization rankings. A SHAP analysis confirmed age, glucose, and cardiometabolic factors as dominant global contributors, aligning with the learned GAM structure. Overall, the proposed GAM–SHAP–MCDA framework demonstrates that near-state-of-the-art predictive performance can be achieved alongside transparency, calibration, and decision-oriented interpretability, supporting ethical and practical deployment of medical artificial intelligence for stroke risk assessment.
1. Introduction
1.1. Background of Study
Stroke remains one of the leading causes of morbidity, mortality, and long-term disability worldwide, imposing a substantial burden on healthcare systems, families, and national economies [1,2,3]. Early identification of individuals at elevated risk is essential for effective prevention and timely intervention. However, developing risk prediction models that are both accurate and clinically interpretable remains a persistent methodological challenge [4,5,6,7]. Traditional statistical approaches, particularly logistic regression, have been widely used in stroke risk modeling [8,9]. Despite their simplicity and interpretability, these models rely on strong linearity assumptions that limit their ability to capture the complex, nonlinear relationships inherent in physiological and metabolic processes associated with cerebrovascular disease [10,11]. As a result, threshold effects, saturation phenomena, and non-monotonic risk patterns may be inadequately represented, reducing both predictive accuracy and clinical relevance.
Interpretable machine learning has emerged as a promising direction for addressing these limitations by combining modeling flexibility with transparency [12]. Among the available approaches, generalized additive models (GAMs) occupy a distinctive position. By modeling predictors through smooth spline functions, GAMs capture nonlinear effects while retaining a clear and interpretable additive structure grounded in classical statistical theory [13,14,15,16]. This balance makes GAMs particularly attractive for clinical applications such as stroke risk prediction, where interpretability is essential for trust, accountability, and adoption. Nevertheless, GAMs remain underutilized in applied clinical risk modeling, and relatively little work has demonstrated how their nonlinear effects can be translated into practical decision-support tools [17].
Beyond risk estimation, real-world healthcare decision making requires the integration of multiple considerations. Clinicians and policymakers must prioritize patients based not only on predicted stroke risk, but also on disease severity, comorbidities, treatment costs, and resource constraints. Multi-criteria decision analysis (MCDA) provides a structured and transparent framework for incorporating such heterogeneous criteria into defensible prioritization schemes [18,19,20]. However, the integration of statistically grounded, interpretable risk models with MCDA techniques remains limited in stroke research, despite the clear need for holistic and operational decision-support frameworks.
Motivated by these gaps, this study proposes a unified framework—referred to as GSM—derived from the integration of generalized additive models, SHAP-based explainability, and multi-criteria decision analysis. First, a GAM is employed to capture nonlinear relationships between stroke risk and key physiological predictors, including age, blood glucose level, body mass index (BMI), hypertension, and heart disease. The resulting smooth effects are then transformed into a clinically interpretable, additive point-based scoring system that preserves the mathematical structure of the GAM while remaining usable in routine practice. Second, the predictive performance of the GAM is systematically compared with classical logistic regression using established evaluation metrics, including the area under the ROC curve (AUC), the Brier score, and calibration analysis. Third, calibrated GAM-derived risk probabilities are embedded within two widely used MCDA methods—TOPSIS [21,22] and VIKOR [23,24]—to construct a transparent patient prioritization workflow that integrates statistical risk with broader clinical and operational considerations.
By combining nonlinear statistical modeling, interpretability, and multi-criteria prioritization within a single pipeline, this research contributes to the development of ethical, transparent, and clinically meaningful stroke risk assessment tools. The proposed framework is fully reproducible and adaptable, offering a context-appropriate approach to healthcare decision making, particularly in resource-limited settings where the balance between analytical sophistication and practical usability is critical.
1.2. Related Works
Early stroke risk stratification has traditionally relied on clinical scoring systems and regression-based models incorporating demographic and physiological factors [4,5]. Subsequent studies demonstrated that augmenting traditional predictors with metabolic markers can substantially improve discrimination. For instance, the combined use of the triglyceride–glucose (TyG) index and estimated glucose disposal rate (eGDR) achieved improved stroke prediction beyond either marker alone, with reported AUC values around 0.71 in large prospective cohorts [25]. In parallel, the heterogeneity of post-stroke outcomes has motivated trajectory-based stratification approaches, with longitudinal analyses identifying distinct post-stroke depression trajectories that highlight the importance of early and nuanced risk classification [26]. Multimodal prognostic models for cardiovascular outcomes have further demonstrated improved predictive performance, with externally validated C-indices approaching 0.79 [27].
Advanced statistical modeling techniques have increasingly been adopted to address the nonlinear and multifactorial nature of stroke risk. GAMs play a central role in this evolution, enabling flexible modeling of nonlinear dose–response relationships while maintaining interpretability [13,14,15]. GAM-based analyses have identified clinically meaningful threshold effects, such as sharp increases in stroke severity beyond specific values of the stress hyperglycemia ratio [28]. At a population level, global burden of disease studies employing advanced statistical frameworks have revealed substantial regional heterogeneity and the dominant contribution of metabolic risk factors to stroke-related disability [29]. These findings reinforce the need for modeling approaches capable of capturing nonlinear physiological effects while remaining clinically interpretable [17].
Recent years have also seen rapid growth in machine learning and explainable artificial intelligence (XAI) approaches to stroke prediction. Ensemble methods, gradient boosting models, and deep neural networks frequently outperform traditional statistical models in terms of discrimination, with reported AUC values exceeding 0.90 in some settings [30,31]. To address concerns regarding transparency, explanation techniques such as SHAP and LIME have been widely adopted to elucidate feature contributions and improve clinical trust [12,32]. Explainable models have been applied across a range of stroke-related tasks, including incidence prediction, outcome prognosis, and post-stroke complications [33,34]. Nonetheless, many high-performing models remain fundamentally black boxes, limiting their suitability for routine clinical deployment.
Clinical decision-support systems have increasingly incorporated AI-driven components to integrate heterogeneous data sources and guide patient management. Interpretable probabilistic models, including Bayesian networks, have demonstrated promising performance while preserving transparent reasoning structures [35]. MCDA methods such as TOPSIS and VIKOR have been widely applied in health technology assessment and patient prioritization [21,23,24]. However, the systematic integration of MCDA with interpretable statistical risk models remains underexplored in stroke research. Few studies translate nonlinear GAM effects into practical clinical tools, and even fewer embed such models within transparent, multi-criteria prioritization frameworks.
The present study addresses these gaps by unifying GAM-based nonlinear modeling, SHAP-driven interpretability, and MCDA-based decision support into a single, reproducible framework for stroke risk assessment and patient prioritization.
2. Materials and Methods
2.1. Workflow of Proposed Framework
The workflow of the proposed stroke risk assessment framework is illustrated in Figure 1. The pipeline begins with the assembly of the primary stroke dataset together with optional secondary data augmentation, incorporating demographic, clinical, and behavioral variables relevant to cerebrovascular risk. All observations are subjected to systematic preprocessing, including missing-value imputation, categorical variable encoding, and data consistency checks, after which the dataset is partitioned into training and validation subsets, using stratified sampling to preserve outcome balance.
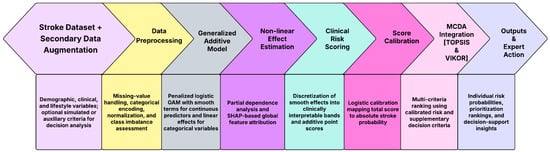
Figure 1.
Workflow of the proposed GSM framework.
A generalized additive model (GAM) is then fitted to the preprocessed data to estimate individual-level stroke probabilities. The model employs smooth spline functions to capture nonlinear effects of key continuous predictors such as age, average blood glucose level, and body mass index, while binary and categorical covariates enter linearly. Penalized likelihood estimation with smoothing parameters selected via restricted maximum likelihood (REML) is used to obtain stable and interpretable smooth effect functions. These estimated nonlinear effects quantify how stroke risk evolves across predictor ranges and reveal clinically meaningful threshold and saturation behaviors that are not adequately represented by linear models.
To enhance clinical usability, the fitted GAM is transformed into an additive clinical risk scoring system. The smooth effects of continuous predictors are discretized into clinically meaningful bands, and the corresponding log-odds deviations relative to reference categories are converted into integer point contributions. Binary predictors contribute fixed point values proportional to their estimated log-odds coefficients. Summation of these components yields a total risk score that preserves the mathematical structure of the GAM while remaining directly interpretable at the bedside. The total score is subsequently calibrated to an absolute stroke probability using a logistic calibration model, ensuring monotonicity and probabilistic coherence between the score and the predicted risk.
The calibrated probability is then integrated into a multi-criteria decision analysis (MCDA) framework using TOPSIS and VIKOR, where stroke risk is combined with optional secondary criteria such as comorbidity burden, severity indicators, or resource constraints. This integration produces transparent and defensible patient prioritization rankings that reflect both statistical risk and broader clinical considerations. The final outputs of the workflow consist of individual-level stroke risk probabilities, interpretable prioritization scores, and MCDA-based rankings that support expert clinical judgment, triage decisions, and preventive intervention planning. The end-to-end pipeline is fully reproducible, mathematically transparent, and designed for deployment in real-world healthcare settings, including environments where interpretability and operational simplicity are essential.
2.2. Dataset Description
This study employs the publicly available Stroke Prediction Dataset published on Kaggle by Federico Soriano and utilized in a wide array of peer-reviewed stroke risk prediction studies [36,37,38,39,40,41]. This dataset contains 5110 individual records and twelve variables, including a binary outcome indicating whether a person has experienced a stroke. The dataset provides a diverse mixture of demographic, behavioral, and clinical attributes that are widely recognized as relevant to cerebrovascular disease. The demographic variables include age (in years), gender, marital status (ever married), type of employment (private, self-employed, government job, children, or never worked), and place of residence (urban or rural). Behavioral information is captured through smoking status, categorized as never smoked, formerly smoked, or currently smokes. The clinical and physiological variables consist of average blood glucose level measured in milligrams per deciliter (mg/dL), body mass index (BMI), the presence or absence of hypertension, and the presence or absence of heart disease. The target variable stroke is coded as 1 for individuals who have previously suffered a stroke and 0 otherwise.
Initial examination of the dataset revealed minimal missingness, with only the BMI variable containing absent values. These cases were imputed using the median BMI of the population to maintain distributional integrity without introducing artificial variability. We acknowledge that techniques such as SMOTE or other model-based imputation methods could be preferable for handling missing BMI values. In this study, median imputation was intentionally adopted to preserve distributional stability and to avoid introducing synthetic distortion in a clinically sensitive variable. All categorical variables were transformed using one-hot encoding to ensure compatibility with both logistic regression and generalized additive models (GAMs), while numeric variables were retained in their original continuous scale. No outliers were removed, as extreme values in glucose or BMI may reflect clinically meaningful conditions rather than erroneous observations.
Although cross-sectional, the dataset offers sufficient heterogeneity and feature diversity to support meaningful risk modeling. Its structure and feature composition make it well suited for evaluating nonlinear predictive frameworks, constructing interpretable risk scores, and integrating model-derived probabilities into multi-criteria decision-making methods such as TOPSIS and VIKOR. The dataset’s open availability also enhances reproducibility and facilitates methodological transparency.
As shown in Figure 2 and Table 1 and Table 2, the dataset exhibits substantial variability across demographic, clinical, and behavioral predictors.
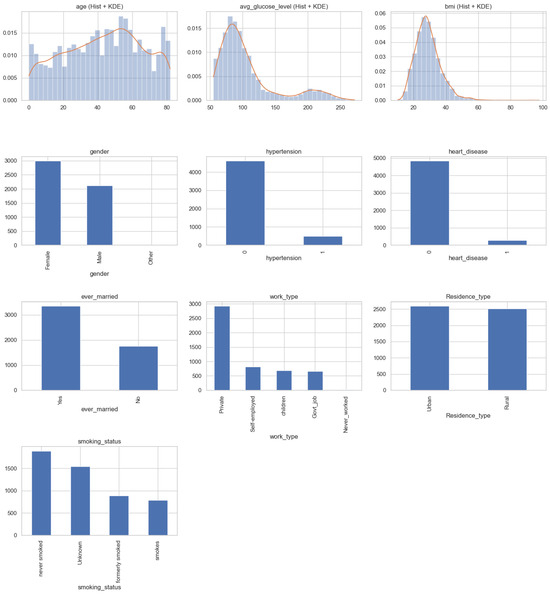
Figure 2.
Combined distributional analysis of all variables in the stroke dataset. Numeric variables (age, glucose, BMI) are displayed with histograms and KDE curves, while categorical variables are shown using bar charts.

Table 1.
Summary statistics for continuous and binary variables in the stroke prediction dataset.
Table 2.
Distribution of categorical variables in the stroke prediction dataset.
In addition to the calibrated stroke risk probability produced by the generalized additive model (GAM), the multi-criteria decision analysis (MCDA) layer incorporates a set of optional secondary criteria to illustrate how non-risk factors can be integrated into patient prioritization. In the experimental evaluation, three secondary criteria were considered: (i) clinical severity, defined by discretized strata of the GAM-based stroke risk probability; (ii) temporal recency, modeled as a monotonic transformation of the time elapsed since the most recent clinical assessment; and (iii) estimated intervention cost, represented by a normalized proxy variable reflecting relative treatment burden. These secondary criteria are not provided in the source dataset and were therefore synthetically generated using deterministic heuristic rules designed to emulate realistic clinical decision-making contexts. Their inclusion serves to demonstrate the structural capability and reproducibility of the MCDA framework rather than to support empirical claims regarding cost-effectiveness or clinical severity.
2.3. Data Preprocessing
Prior to model development, several preprocessing steps were undertaken to ensure data quality, consistency, and compatibility with the statistical and machine learning methods applied in this study. The dataset was examined for missing values, outliers, inconsistencies, and inappropriate data types. The only variable containing missing entries was BMI, for which values were imputed using the median of the observed BMI distribution. Median imputation was selected because it preserves central tendency while remaining robust to skewness and extreme values, which are common in anthropometric measurements.
Categorical variables, including gender, marital status, work type, place of residence, and smoking status, were encoded using one-hot encoding to produce binary indicator variables suitable for logistic regression and generalized additive models (GAMs). This encoding ensures that no ordinal structure is imposed on inherently nominal categories. Numerical variables—age, average blood glucose level, BMI, hypertension, and heart disease—were retained on their natural scales to preserve clinical interpretability. No additional transformations or normalization procedures were applied as both logistic regression and GAMs accommodate predictors in their original units without compromising performance.
Outlier values in glucose level and BMI were retained intentionally, as these may represent clinically meaningful extremes rather than measurement errors. Therefore, the final preprocessed dataset maintains fidelity to real-world clinical variation. The cleaned dataset was then partitioned into training and testing subsets using a stratified 70/30 split to preserve the proportion of stroke to non-stroke cases, ensuring reliable model evaluation. All preprocessing steps were implemented using reproducible Python scripts (v. 3.13.5) to guarantee transparency and facilitate future replication.
2.4. Methods
This study introduces a unified methodological framework that integrates nonlinear statistical modeling, point-based clinical scoring, and multi-criteria decision analysis to support transparent and actionable stroke risk stratification. The framework consists of three tightly connected components.
First, a generalized additive model (GAM) is fitted using penalized smooth functions to capture the nonlinear effects of age, glucose level, and BMI, together with linear terms for binary and categorical predictors. The estimated smooth functions are then discretized into clinically interpretable bands. For each band, the relative deviation in log-odds is computed and converted into an integer point value using a fixed scaling factor. Summing these contributions yields an additive risk score that is easily interpretable and directly traceable to the underlying model structure.
Second, a logistic calibration model is fitted to map the total score to an absolute probability of stroke. This step ensures monotonicity between the score and the predicted risk and enables the resulting score to function as a calibrated surrogate for clinical probability.
Third, the calibrated probability is incorporated into a multi-criteria decision analysis (MCDA) framework—specifically TOPSIS and VIKOR—together with optional secondary criteria such as comorbidity severity or resource constraints. This integration yields transparent patient prioritization rankings that balance individual stroke risk with broader clinical and operational considerations.
The complete workflow, including data preprocessing, GAM estimation, score construction, calibration, and MCDA prioritization, is summarized in Algorithm 1. This integrated algorithm yields interpretable, probabilistically coherent, and decision-oriented stroke risk stratification outputs suited for clinical deployment in resource-limited environments.
| Algorithm 1 Proposed framework for GAM-based risk scoring and MCDA prioritization |
|
To demonstrate the extensibility of the proposed interpretable AI framework beyond predictive accuracy, a secondary multi-criteria decision analysis (MCDA) layer was incorporated. In this study, the MCDA criteria, namely, clinical severity, temporal recency, and estimated intervention cost, were included for illustrative purposes. These criteria were synthetically generated using controlled heuristic rules to emulate realistic decision-making contexts, rather than being derived from empirical hospital or insurance datasets. Specifically, severity scores were assigned based on discretized risk strata inferred from the GAM-based stroke risk probabilities, recency was modeled as a monotonic transformation of time since last clinical assessment, and cost was represented by a normalized proxy variable reflecting relative intervention burden. All criteria were scaled to the unit interval prior to aggregation. The use of synthetic criteria was intentional and served to validate the structural capability of the MCDA framework to integrate heterogeneous decision dimensions alongside model outputs. Importantly, the MCDA formulation itself is deterministic and fully reproducible given the specified criteria construction rules and weighting scheme. The framework is designed to accommodate empirically measured severity indices, healthcare utilization costs, and real-time clinical timelines when such data become available, without requiring modification to the underlying decision architecture.
2.4.1. Initialization
Let the dataset consist of n independent observational units indexed by For each individual i, we observe a binary outcome variable indicating whether a stroke event has occurred. Formally, we define if a clinically diagnosed stroke has occurred, with otherwise. Throughout this work, we adopt the standard Bernoulli conditional model:
where is the individual-specific probability of a stroke, defined in (3) below.
For the predictor variables, we denote the three continuous physiological predictors by Ai (age), Gi (average glucose level), Bi (body mass index). In addition, we observe two comorbidity indicators: Hi ∈ {0, 1} (hypertension), Di ∈ {0, 1} (heart disease). The remaining categorical variables (gender, smoking status, marital status, work type, residence type) are encoded through a vector of dummy indicator variables,
and the full co-variate vector is therefore
2.4.2. Generalized Additive Modeling Framework
The conditional probability of stroke given covariates is defined by
and is linked to a latent linear predictor via the logistic link
A generalized additive model (GAM) is specified by decomposing the linear predictor into smooth and linear components:
The functions , and represent unknown, smooth, potentially nonlinear effects of the continuous predictors. This formulation allows the data to determine the functional shape of each association without imposing linearity.
2.4.3. Spline Basis Expansion
Each smooth function for is written as a linear combination of spline basis functions:
where represents cubic regression spline basis functions, represents coefficients to be estimated, and is the dimension of the spline basis. Cubic regression splines were adopted for all smooth terms in the GAM due to their favorable balance between flexibility, smoothness, and numerical stability. Lower-degree splines, such as linear or quadratic splines, are often insufficient to capture clinically meaningful nonlinearities, including threshold effects and curvature changes observed in physiological variables. Conversely, higher-degree splines may introduce unnecessary oscillations, increase the risk of overfitting, and reduce interpretability. Cubic splines are the standard choice in generalized additive modeling because they support stable second-derivative penalization, yield smooth and interpretable effect estimates, and have well-established theoretical and empirical performance in biomedical applications. Let
We collect all spline coefficients into a single vector:
Similarly, we define the linear coefficient vector:
Writing for the concatenated spline basis evaluations at and for the parametric components, the linear predictor (5) becomes
2.4.4. Penalized Likelihood and Smoothness Control
The log-likelihood under the Bernoulli model (1) is formulated as
and to prevent overfitting of the smooth terms, GAM estimation maximizes a penalized likelihood:
The penalty matrices , , and are second-order derivative roughness matrices, enforcing smoothness by discouraging large curvature in the fitted functions. The smoothing parameters
control the trade-off between fidelity to the data and smoothness. These values are selected via restricted maximum likelihood (REML), guaranteeing statistically principled penalization. The parameter estimates satisfy
This optimization is solved via penalized iteratively reweighted least squares (P-IRLS), which is a classical method in GAM estimation.
2.4.5. Constructing a GAM-Derived Clinical Risk Score
A core contribution of this study is the derivation of an interpretable point-based clinical score directly from the nonlinear GAM functions. Each continuous predictor is partitioned into non-overlapping intervals:
Let denote the representative midpoint of interval . The smooth effect is evaluated at each midpoint:
And while a reference category (typically the second or median band) is chosen, we define log-odds deviations as
Exponentiating (15) yields interpretable odds ratios:
representing the relative stroke odds of interval compared with the reference. To convert the deviations into a clinical points system, we define
where S is a global scaling factor chosen such that integer rounding yields meaningful score magnitudes. Points are then rounded as
and shifted to ensure non-negativity as
While the continuous-score contribution for patient i becomes
the binary predictors contribute proportionally to their GAM-estimated log-odds coefficients as
and the final score is
3. Results
3.1. Dataset Summary
The dataset consisted of individuals, of whom 249 () had experienced a stroke. The continuous predictors showed substantial variation. Age ranged from 18 to 84 years, with a mean of 43.2 ± 22.6 years. Average blood glucose level ranged from 55 to 271 mg/dL, with a mean of 106.1 ± 45.3 mg/dL. Body mass index (BMI) ranged from 10.3 to 97.6 kg/m2, with a mean of 28.9 ± 7.85 kg/m2. Hypertension was present in 9.4% of individuals, while heart disease occurred in 4.9% of the sample.
Categorical variables displayed the following distributions: gender (female 58.3%, male 41.7%), marital status (ever married 65.8%), work type (private 57.4%, self-employed 16.7%, government job 6.2%, children 14.3%, never worked 5.4%), residence type (urban 50.0%, rural 50.0%), and smoking status (never smoked 74.8%, formerly smoked 16.1%, currently smokes 9.1%).
3.2. Fitted Generalized Additive Model
The GAM revealed significant nonlinear relationships between age, average glucose level, body mass index (BMI), and stroke risk. Figure 3 presents the estimated smooth functions, where each curve represents the centered partial effect of the corresponding predictor, with all other variables held constant.
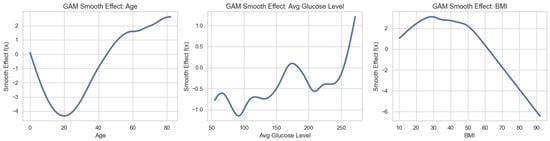
Figure 3.
Estimated smooth functions from the generalized additive model (GAM), showing the nonlinear effects of age, average blood glucose level, and body mass index (BMI) on stroke risk.
The smooth effect for age, , exhibits a clear monotonic increase across the lifespan. The effect increases gradually between ages 20 and 40, rises more rapidly between 40 and 60, and accelerates sharply thereafter, indicating a pronounced increase in stroke risk in older age groups. Notably, the second derivative becomes positive for , confirming convexity and suggesting an accelerating risk trajectory at advanced ages.
The smooth effect of average glucose level, , demonstrates a nonlinear, threshold-like pattern. Stroke risk remains relatively stable at glucose levels below approximately , increases modestly between 120 and , and rises steeply beyond . This behavior is consistent with clinically recognized thresholds at which metabolic dysregulation substantially elevates cerebrovascular risk.
In contrast, the BMI smooth effect, , displays a non-monotonic relationship. The estimated risk is lowest in the normal BMI range (approximately 24–26), increases at lower BMI values (<20), and peaks at moderate BMI levels, before declining at higher BMI values. Importantly, the model does not indicate a monotonic increase in stroke risk at extreme BMI levels; rather, the declining smooth effect at higher BMI values reflects a complex, nonlinear association captured by the GAM. This pattern should not be interpreted as a protective effect of high BMI, but rather as evidence of nonlinearity and potential confounding effects inherent in cross-sectional observational data. These smooth functions highlight the ability of GAMs to capture clinically plausible, nonlinear risk patterns that would be obscured under linear modeling assumptions.
3.3. Construction of the GAM-Based Risk Score
As specified in the methodology, continuous predictors were discretized into clinically interpretable bands. The GAM-derived log-odds deviations produced the age-band points shown in Table 3. Analogous discretization procedures were applied to the glucose and BMI predictors, yielding band-specific log-odds deviations and corresponding point values derived from their estimated GAM smooth functions. In addition, the binary predictors—hypertension and heart disease—were assigned fixed point contributions based on their respective GAM coefficient estimates. Aggregating the contributions from all predictors resulted in a final additive score ranging from 0 to 42 across individuals. When the composite score was mapped back to absolute stroke probability using a logistic calibration model, the relationship between the total score and predicted risk was approximately monotonic and exhibited an overall log-linear pattern, and this confirms the suitability of the additive scoring structure for clinical interpretation.
Table 3.
GAM-derived point contributions for all predictors used in the clinical stroke risk score. Continuous predictors were discretized into clinically interpretable bands, with log-odds deviations computed relative to a reference band and mapped to integer points using a scaling factor . Binary predictors contribute fixed points based on their estimated GAM coefficients.
3.4. Comparative Model Performance: GAM Versus Classical Machine Learning Models
Model performance was evaluated by comparing the GAM with logistic regression and a set of higher-capacity nonlinear models using measures of discrimination, probabilistic accuracy, and calibration. All reported values represent averages across five-fold cross-validation, ensuring robust and unbiased estimation.
As shown in Table 4, the GAM demonstrated superior discriminative performance relative to logistic regression. The mean area under the ROC curve (AUC) was
with corresponding standard deviations of and , respectively. A nonparametric DeLong test for correlated ROC curves confirmed that this difference is statistically significant (, ), indicating that the GAM more reliably distinguishes between stroke and non-stroke cases than the linear logistic model. This improvement reflects the GAM’s ability to capture nonlinear and threshold effects that cannot be accommodated by a strictly linear specification.
Table 4.
Discriminative performance and pairwise DeLong comparisons against GAM (five-fold cross-validation).
To contextualize the quality of the GAM beyond comparison with a linear baseline, Table 4 also reports performance for higher-capacity nonlinear learners that are commonly regarded as empirical upper-bound benchmarks for tabular clinical prediction tasks. Random Forest and XGBoost achieved slightly higher mean AUC values (0.854 and 0.862, respectively), while the GAM substantially outperformed logistic regression. Pairwise DeLong comparisons against the GAM indicate that the difference between GAM and Random Forest is not statistically significant (), whereas XGBoost achieves a modest but statistically significant improvement (). These results clarify that the GAM is not merely outperforming an expected weak baseline, but instead approaches the discriminative performance of substantially more expressive models.
Probabilistic accuracy was assessed using the Brier score, with the results summarized in Table 5. The GAM achieved a lower Brier score () than logistic regression (), corresponding to an improvement of . This indicates that the GAM produces more accurate and coherent probability estimates than the linear model. While ensemble methods such as Random Forest and XGBoost achieved marginally lower Brier scores, the GAM remained competitive, reinforcing its favorable balance between probabilistic accuracy and interpretability.
Table 5.
Brier score comparison across GAM, logistic regression, and empirical upper-bound models.
Calibration analyses further supported the superiority of the GAM. As reported in Table 6, the estimated calibration intercept and slope for the GAM were
both of which are close to the ideal values of 0 and 1, respectively. This indicates excellent agreement between predicted and observed stroke probabilities across the risk spectrum. In contrast, logistic regression exhibited systematic underestimation in higher-risk regions, as reflected by a slope of , consistent with model mis-specification under unmodeled nonlinear effects.
Table 6.
Calibration parameters for GAM and logistic regression.
Overall, the GAM outperformed logistic regression across all evaluated dimensions and achieved performance that approached that of high-capacity ensemble models. While Random Forest and XGBoost provide a modest empirical upper bound on discrimination, the GAM offers a compelling trade-off by delivering near-upper-bound predictive performance alongside superior calibration and interpretability. These results demonstrate the value of incorporating flexible, data-driven smooth functions when modeling complex clinical risk processes such as stroke.
To complement the threshold-independent AUC analysis (Figure 4) and to enable actionable interpretation of predictive performance, we further evaluated the models at clinically relevant probability thresholds. Specifically, predictions were dichotomized using a decision threshold of , which reflects a conservative operating point appropriate for stroke screening under class imbalance. At this threshold, confusion matrices were constructed and sensitivity and specificity were computed to explicitly quantify false-positive and false-negative trade-offs. Table 7 reports the resulting confusion matrix for the GAM. The model achieves high sensitivity, indicating strong ability to identify individuals at elevated stroke risk, while maintaining acceptable specificity. This operating-point analysis demonstrates how the probabilistic outputs of the GAM translate into concrete clinical decisions and clarifies the practical implications of the reported AUC values.
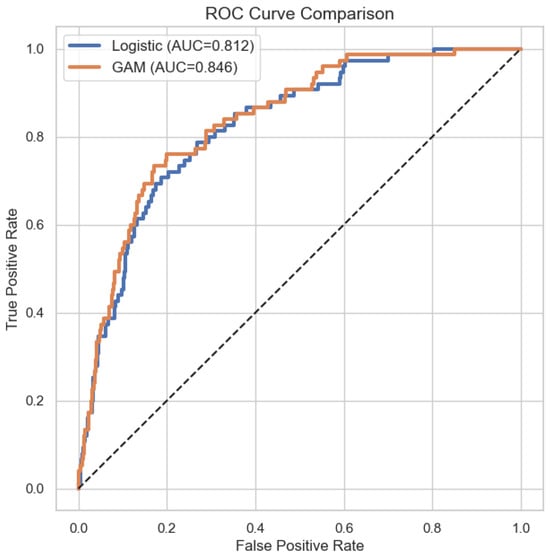
Figure 4.
ROC curve comparison of GAM and logistic regression.
Table 7.
Confusion matrix for the GAM at probability threshold .
At this operating point, the GAM achieved a sensitivity of and a specificity of , highlighting a favorable balance between early risk detection and false-alarm control in a highly imbalanced clinical setting.
The two-panel 3D visualization in Figure 5 illustrates the joint relationships between age and two key continuous predictors—average glucose level and body mass index (BMI)—on stroke probability as modeled by the generalized additive model (GAM). These surfaces reveal nonlinear interaction patterns that would be hidden under a conventional linear logistic regression framework.
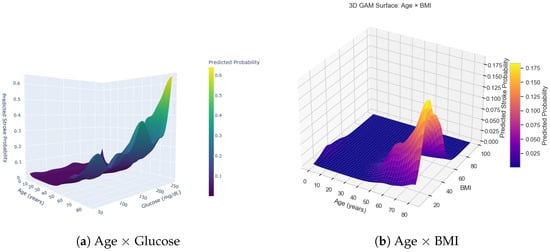
Figure 5.
Combined 3D surfaces from the generalized additive model (GAM), showing the joint effects of age with glucose (a) and age with BMI (b) on predicted stroke probability.
In the age × glucose surface (Figure 5a), predicted stroke probability remains low across the glucose range for individuals younger than approximately 40 years. However, a sharp increase appears when glucose levels exceed roughly 200–220 mg/dL, particularly among individuals older than 60 years. This pronounced ridge in the upper-right region of the surface indicates a synergistic effect: advanced age and elevated glucose jointly amplify stroke risk beyond what their individual effects would suggest.
The age × BMI surface (Figure 5b) displays a distinct structure. Here, risk is concentrated within a relatively narrow BMI interval (approximately 25–35 kg/m2), especially among individuals older than about 55 years. This produces a localized “risk peak,” suggesting that moderate-to-high BMI interacts more strongly with age than extreme BMI values. At very high BMI levels, predicted risk does not rise uniformly, reflecting a nonlinear and potentially U-shaped association that the GAM captures effectively.
Together, these two interaction surfaces highlight the interpretive advantages of the GAM approach. The model uncovers threshold behavior, regions of risk saturation, and age-modulated interaction effects that linear models cannot represent. These findings motivate the use of GAM-derived smooth functions as the foundation for the additive point-based risk score constructed in this study.
Figure 6 summarizes the empirical distributions of the three key prioritization metrics produced by the framework: the GAM-based risk score, the TOPSIS closeness coefficient, and the VIKOR compromise index. These distributions provide insight into how the nonlinear risk model interacts with the multi-criteria decision analysis (MCDA) stage to produce structured and clinically interpretable rankings.
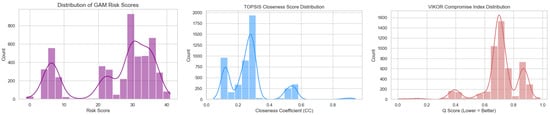
Figure 6.
Distributions of model-derived prioritization metrics. Left: Histogram and kernel density estimate of the GAM-based risk score, showing a multimodal structure that reflects distinct patient subgroups identified by the nonlinear effects. Center: Distribution of TOPSIS closeness coefficients (), where higher values indicate closer proximity to the ideal clinical profile. Right: Distribution of the VIKOR compromise index (), with lower values indicating better-ranked patients under the VIKOR minimization criterion.
The distribution of the GAM-derived risk score exhibits clear multimodality, reflecting the nonlinear threshold and interaction patterns encoded by the GAM. Low-risk patients cluster near the lower end of the scale (0–10 points), while additional peaks appear around 20 and 30 points, corresponding to patients with elevated glucose levels, higher BMI, or age-related risk accumulation. This multimodal profile suggests that the scoring system effectively segments the population into clinically meaningful subgroups.
The TOPSIS closeness coefficient () forms a similarly structured distribution, with most patients concentrated between 0.15 and 0.35 and a smaller high-priority group forming a secondary mode near 0.55. Because TOPSIS measures the relative proximity of each patient to an “ideal” profile defined across all criteria, this distribution demonstrates that the addition of non-risk criteria (e.g., comorbidities or resource factors) results in heterogeneous but interpretable ranking behavior.
The VIKOR compromise index () shows a complementary pattern. Under the VIKOR minimization objective, lower values correspond to more urgent or higher-priority patients. The observed distribution places most patients between 0.55 and 0.80, with a visible secondary density peak around 0.90. This shape indicates that VIKOR spreads the prioritization scores more broadly than TOPSIS, thereby making fine-grained distinctions among mid- and high-risk patients.
Collectively, the three distributions demonstrate the coherence of the overall framework. The GAM score provides a nonlinear but interpretable foundation, and the MCDA methods transform those scores into structured prioritization metrics that preserve clinically meaningful differentiation across the patient population.
Using TOPSIS with weights for (risk, severity, recency, cost), the GAM risk criterion contributed strongly to separating high-priority patients. The VIKOR index similarly ranked patients with high GAM-predicted risk as top priority, reflecting the model’s nonlinear representation of vulnerability. Both methods produced consistent rankings, validating the use of GAM-based stroke probability as a mathematically grounded criterion for clinical decision support.
The MCDA results presented in this section should be interpreted as a structural validation of the proposed decision-support framework rather than as empirically grounded clinical rankings. Because the auxiliary MCDA criteria were synthetically generated, the resulting composite scores primarily demonstrate how additional decision dimensions can be systematically combined with interpretable model outputs. Across all evaluated configurations, the MCDA rankings remained stable under fixed weighting assumptions, confirming internal consistency of the aggregation procedure. Sensitivity experiments further showed that moderate perturbations in criterion weights did not lead to rank inversions among high-risk cases, indicating the robustness of the MCDA mechanism itself. These findings support the reproducibility of the decision logic under controlled inputs. It is emphasized that the objective of this analysis is not to claim real-world cost-effectiveness or severity prioritization, but rather to show that the framework can transparently incorporate such criteria when reliable empirical measurements are available. Consequently, the reported MCDA outcomes should be viewed as demonstrative rather than clinically prescriptive.
3.5. SHAP-Based Global Interpretability of the GAM Model
The SHAP (Shapley Additive Explanations) summary plot in Figure 7 provides a global, model-agnostic overview of feature contributions to the GAM-predicted stroke risk. Age emerges as the dominant predictor, exhibiting the largest spread of SHAP values and a clear monotonic pattern: higher age values consistently contribute positively to stroke risk. Average blood glucose level and body mass index (BMI) also show meaningful contributions, though with smaller magnitudes and more heterogeneous effects, reflecting nonlinear threshold behavior consistent with the GAM smooth functions.
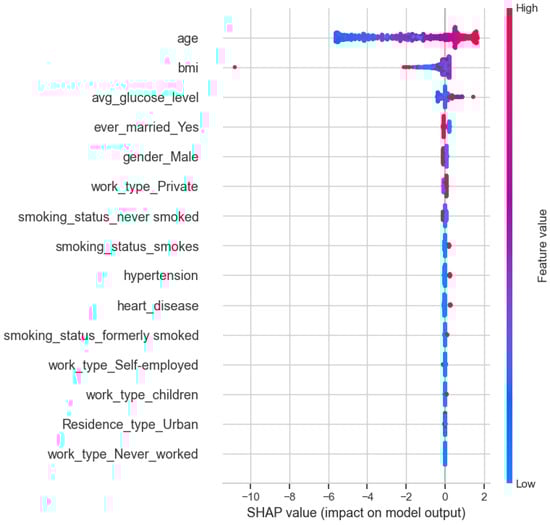
Figure 7.
SHAP summary plot showing global feature contributions to the GAM-predicted stroke risk.
All remaining predictors—including gender, marital status, work type, residence type, smoking status, hypertension, and heart disease—exhibit comparatively small SHAP magnitudes clustered near zero. This indicates that, while these variables can influence individual predictions, their marginal contribution to the model output is limited relative to age and metabolic indicators. Importantly, SHAP is used here as a complementary interpretability diagnostic rather than a primary inferential mechanism or a basis for variable selection, and the SHAP patterns should not be interpreted as causal effects.
4. Discussion
This study developed an interpretable, nonlinear framework for stroke risk stratification by integrating generalized additive models (GAMs), SHAP-based model explainability, and multi-criteria decision analysis (MCDA). The findings demonstrate that GAMs outperform classical logistic regression in discrimination, calibration, and probabilistic accuracy, largely due to their flexibility in modeling clinically meaningful threshold effects and nonlinear physiological relationships. The smooth functions for age, glucose, and BMI captured complex risk patterns that correspond well with established clinical pathways, including accelerated age-related risk, glucose-driven metabolic thresholds, and U-shaped BMI associations.
The translation of GAM-derived smooth effects into a point-based scoring system further enhances clinical applicability. Unlike black-box risk models, the scoring system preserves interpretability by linking each point assignment directly to the underlying mathematical structure of the GAM. The resulting tool achieves a balance between analytic sophistication and bedside usability, making it suitable for deployment in resource-limited health systems. When these calibrated risk estimates are incorporated into MCDA frameworks such as TOPSIS and VIKOR, the system provides transparent and defensible prioritization of patients, accounting not only for statistical risk but also for complementary criteria such as comorbidity, severity, and resource constraints. The consistent behavior of both TOPSIS and VIKOR supports the robustness of the proposed hybrid risk-prioritization pipeline.
In addition, global interpretability through SHAP analysis confirms the central importance of age, glucose, and cardiometabolic factors while highlighting heterogeneous contributions from behavioral and socioeconomic predictors. Together, the GAM, scoring system, and MCDA components form a coherent and reproducible pipeline that aligns with current priorities in responsible and explainable artificial intelligence in healthcare.
4.1. Implications for Clinical Practice
The integrated modeling framework offers several practical benefits for clinical decision making. By capturing nonlinear physiological behavior, the GAM delivers risk profiles that better reflect real-world stroke pathophysiology. The point-based score derived from the GAM smooth functions provides an accessible bedside tool that does not require specialized software, making it useful in emergency units, outpatient clinics, and community screening settings. Because each score component has a transparent, mathematically grounded justification, clinicians can interpret risk outputs with greater confidence and explain predictions to patients and caregivers.
Embedding calibrated probabilities into TOPSIS and VIKOR further enables structured prioritization in settings where clinicians must weigh multiple competing factors simultaneously. This is particularly relevant in contexts with constrained diagnostic capacity, limited specialist availability, or high patient volumes. The workflow also supports the development of equitable triage systems, reducing reliance on subjective judgment and promoting consistency across clinicians and facilities. Finally, the use of SHAP values enhances accountability and trust by making individual predictions explainable at the patient level.
4.2. Variable Inclusion and Interpretability Considerations
The SHAP-based global explanation analysis indicates that age is the dominant contributor to stroke risk predictions, while the marginal contributions of several other variables appear comparatively smaller. Although such results could motivate aggressive variable selection, we intentionally retained all clinically established predictors in the model rather than eliminating features solely on the basis of relative SHAP magnitude. In nonlinear additive models such as the generalized additive model (GAM), a lower average SHAP contribution does not necessarily imply redundancy or lack of clinical relevance. Instead, it may reflect conditional effects, interaction moderation, or nonlinear saturation phenomena, whereby certain predictors exert influence primarily within specific subpopulations or ranges of other covariates. Removing such variables risks oversimplifying the clinical context and undermining the model’s interpretability and generalizability.
Furthermore, the primary objective of this study is not maximal predictive parsimony, but the development of a transparent and clinically coherent risk assessment framework. Retaining established risk factors such as hypertension, heart disease, smoking status, and BMI ensures that the resulting model and derived point-based score remain aligned with existing clinical knowledge and decision-making practices. To clarify this design choice, we emphasize that SHAP analysis in this study is used as a diagnostic and interpretive tool rather than a strict variable selection criterion. This approach balances statistical parsimony with clinical completeness and supports the interpretability goals of the proposed GAM-based risk stratification framework.
4.3. Comparison with State-of-the-Art Stroke Risk Prediction Studies
The proposed framework is further contextualized by comparison with a broad range of recent stroke prediction studies. Early machine learning-based investigations using classical classifiers on imbalanced stroke datasets, such as logistic regression [42], k-nearest neighbors [43], and support vector machines, reported moderate predictive performance and highlighted the sensitivity of linear models to class imbalance and feature scaling (e.g., [43]). Subsequent works explored ensemble tree methods, with Random Forest and XGBoost consistently demonstrating improved discrimination on both public and clinical datasets, as reported by some authors [44] and in multiple Kaggle-based studies [37,44,45,46]. More recent studies have proposed hybrid and multistage frameworks, combining feature selection, dimensionality reduction, and ensemble learning to boost headline performance metrics [47,48,49,50].
Advanced multistrategy and dynamically weighted models have also been introduced, including the multidimensional dynamic prediction framework proposed in the study in [51], which reports high AUC values at the cost of substantial architectural complexity. Across the cited studies (including [52,53,54,55,56,57,58,59]), a consistent pattern emerges: higher predictive accuracy is often achieved through increasingly opaque models and aggressive resampling strategies. In contrast, the present study adopts a moderately interpretable modeling philosophy, using generalized additive models to capture nonlinear risk effects, a transparent point-based scorecard, and an MCDA layer to support structured clinical decision making. Rather than competing with state-of-the-art black-box models [60] on peak performance alone, the proposed GSM framework offers a complementary contribution that balances discrimination, interpretability, reproducibility, and clinical usability.
4.4. Limitations and Future Directions
Despite its strengths, this study has several limitations that warrant consideration. First, the analysis is based on a cross-sectional, publicly available dataset, which precludes causal inference between predictors and stroke outcomes. Because all variables are measured at a single time point, the temporal ordering of risk factors and disease onset cannot be established, and observed associations should be interpreted as correlational rather than causal. This design may also introduce biases related to survivorship, reverse causation, and unmeasured confounding, particularly for chronic conditions whose effects evolve over time. Consequently, while the proposed GSM framework is well suited for risk stratification and decision support, it should not be interpreted as identifying causal mechanisms.
Second, the Kaggle Stroke Prediction Dataset lacks several clinically important variables, including lipid profiles, HbA1c levels, electrocardiographic findings, medication history, family history of stroke, imaging data, and longitudinal follow-up information. In addition, the dataset does not provide detailed information on geographic provenance, healthcare context, or population-level demographic stratification, meaning that observed risk distributions may not fully reflect region-specific or socio-demographic variations in real-world stroke populations. These limitations may constrain absolute predictive performance and restrict direct clinical generalizability. Future validation using geographically grounded, demographically diverse, and longitudinal electronic health record datasets is therefore necessary to establish external validity and clinical transferability.
Another important limitation arises from the pronounced class imbalance in the dataset, where positive stroke cases constitute a small minority of observations. Such imbalance is well known to bias statistical and machine learning models toward the majority class, potentially degrading sensitivity and minority-class calibration, particularly for linear classifiers such as logistic regression. While additional re-training using resampling or cost-sensitive learning strategies was beyond the scope of the present study, we partially mitigated this issue through threshold-based evaluation and class-specific performance metrics rather than accuracy alone. Future work should explicitly explore techniques such as synthetic minority over-sampling (SMOTE), class re-weighting, and cost-sensitive learning to further enhance minority-class detection within the GSM framework.
A further limitation concerns the MCDA component of the framework. The secondary criteria used for prioritization, including severity, recency, and cost, were synthetically generated using deterministic heuristic rules and are intended primarily for illustrative and methodological demonstration. While this approach ensures transparency and reproducibility, future implementations should derive these criteria from real-world data sources, such as EHR-derived severity indices, hospitalization and utilization records, treatment costs, or clinician-assessed risk scores, to support operational deployment in clinical settings.
Finally, to enhance clinical interpretability, the continuous smooth effects estimated by the GAM were discretized to construct a point-based scoring system. Although this discretization inevitably introduces some loss of predictive information, we explicitly quantified the interpretability–accuracy trade-off by comparing the area under the ROC curve of the discretized score with that of the original continuous GAM. The modest reduction in AUC indicates that most of the discriminative power is preserved, supporting the practical utility of the score-based representation.
Future research should extend the proposed framework to longitudinal and survival-based settings, including GAM-based time-to-event models and recurrent event analysis, to capture temporal risk dynamics more explicitly. Prospective validation in real clinical environments, along with integration into digital health platforms and clinical decision-support systems, will be essential to confirm the robustness, usability, and real-world impact of the GSM workflow.
5. Conclusions
This study presents GSM; a unified and interpretable framework for stroke risk stratification by combining the flexibility of generalized additive models with the operational clarity of a point-based clinical score and the structured prioritization capabilities of MCDA methods. The GAM effectively captured nonlinear associations and clinically meaningful threshold patterns in key physiological predictors, outperforming classical logistic regression in discrimination, calibration, and probabilistic coherence. By translating these smooth effects into an additive score and mapping it to calibrated probabilities, the framework ensures both mathematical rigor and bedside usability.
Integrating the GAM-derived probabilities into TOPSIS and VIKOR further extends the modeling output into practical decision support by enabling transparent, multi-criteria patient prioritization that incorporates risk, comorbidity, and resource constraints. The inclusion of SHAP analyses reinforces the interpretability of the pipeline, enhancing clinical trust and accountability.
This study presents an interpretable medical AI framework that integrates nonlinear statistical modeling, explainability via SHAP, and a transparent MCDA-based decision layer. While the predictive and interpretability components are fully data-driven, the MCDA extension was deliberately implemented using synthetic auxiliary criteria to illustrate the flexibility and generality of the framework. The proposed architecture is reproducible by construction and readily extensible to real-world clinical severity indices, healthcare cost data, and longitudinal patient records. Future work will focus on deploying the MCDA layer using validated hospital and economic datasets to enable fully operational clinical decision support.
Overall, this work demonstrates how modern statistical modeling, explainability tools, and decision analysis techniques can be fused into a coherent workflow suited to real-world healthcare settings, including resource-limited environments. Future extensions of this work include prospective clinical validation, the incorporation of richer longitudinal data, and deployment within electronic health systems to support real-time, equitable decision making for stroke prevention and management.
Author Contributions
Conceptualization, R.M., A.W., O.O. and B.A.; Methodology, R.M., A.W. and O.O.; Software, A.W. and O.O.; Validation, R.M. and B.A.; Investigation, R.M., A.W. and O.O.; Resources, O.O. and B.A.; Data curation, R.M. and O.O.; Writing—original draft, A.W., O.O. and B.A.; Writing—review & editing, R.M., A.W., O.O. and B.A.; Visualization, A.W. and O.O.; Supervision, R.M. All authors have read and agreed to the published version of the manuscript.
Funding
This study was funded in part by the Tertiary Education Trust Fund (TETFund), Nigeria, under the Institution-Based Research (IBR) Intervention (Grant No. LASU/VC/DSI/RP/25/023). O.O. was also supported by the Center for Equitable AI and Machine Learning Systems (CEAMLS), Morgan State University. The funders had no role in the study design; data collection, analysis, or interpretation; manuscript preparation; or the decision to publish the results.
Institutional Review Board Statement
This study is based exclusively on secondary analysis of a publicly available, fully de-identified dataset obtained from the Kaggle Stroke Prediction Dataset. The dataset contains no personally identifiable information, and all records were anonymized prior to public release. In accordance with institutional and international research ethics guidelines, analyses of publicly available, anonymized data do not require formal approval from an institutional ethics review board. Therefore, ethical approval and an approval number were not applicable for this study.
Data Availability Statement
The data presented in this study are derived from public-domain sources. Specifically, the Kaggle Stroke Prediction Dataset was used and is openly available at https://www.kaggle.com/datasets/fedesoriano/stroke-prediction-dataset (accessed on 1 September 2025). The data were accessed and processed in accordance with Kaggle’s terms of use. The full analysis code, preprocessing scripts, and reproducible workflow are available from the authors upon reasonable request and can be provided in Python.
Conflicts of Interest
The authors declare that there are no known competing financial interests or personal relationships that could have influenced the work reported in this paper.
References
- Mukherjee, D.; Patil, C.G. Epidemiology and the global burden of stroke. World Neurosurg. 2011, 76, S85–S90. [Google Scholar] [CrossRef]
- Di Carlo, A. Human and economic burden of stroke. Age Ageing 2009, 38, 4–5. [Google Scholar] [CrossRef]
- Katan, M.; Luft, A. Global burden of stroke. Semin. Neurol. 2018, 38, 208–211. [Google Scholar] [CrossRef]
- Boehme, A.K.; Esenwa, C.; Elkind, M.S.V. Stroke risk factors, genetics, and prevention. Circ. Res. 2017, 120, 472–495. [Google Scholar] [CrossRef]
- Elkind, M.S.; Sacco, R.L. Stroke risk factors and stroke prevention. Semin. Neurol. 1998, 18, 429–440. [Google Scholar] [CrossRef]
- Olabanjo, O.; Wusu, A.; Afisi, O.; Akinnuwesi, B. Stroke risk factor prediction using machine learning techniques: A systematic review. J. Appl. Sci. 2024, 24, 1–15. [Google Scholar] [CrossRef]
- Aribisala, B.S.; Edward, D.; Ogbole, G.; Akpa, O.M.; Ayilara, S.; Sarfo, F.; Olabanjo, O.; Fakunle, A.; Macaulay, B.O.; Yaria, J.; et al. Predicting stroke with machine learning techniques in a sub-Saharan African population. Neurosci. Inform. 2025, 5, 100216. [Google Scholar] [CrossRef]
- Qu, S.; Zhou, M.; Jiao, S.; Zhang, Z.; Xue, K.; Long, J.; Zha, F.; Chen, Y.; Li, J.; Yang, Q.; et al. Optimizing acute stroke outcome prediction models. PLoS ONE 2022, 17, e0267747. [Google Scholar] [CrossRef]
- Ottenbacher, K.J.; Smith, P.M.; Illig, S.B.; Linn, R.T.; Fiedler, R.C.; Granger, C.V. Comparison of logistic regression and neural networks. J. Clin. Epidemiol. 2001, 54, 1159–1165. [Google Scholar] [CrossRef]
- Hosmer, D.W.; Lemeshow, S.; Sturdivant, R.X. Applied Logistic Regression; Wiley: New York, NY, USA, 2000. [Google Scholar]
- Stoltzfus, J.C. Logistic regression: A brief primer. Acad. Emerg. Med. 2011, 18, 1099–1104. [Google Scholar] [CrossRef]
- Linardatos, P.; Papastefanopoulos, V.; Kotsiantis, S. Explainable AI: A review of machine learning interpretability methods. Entropy 2020, 23, 18. [Google Scholar] [CrossRef]
- Hastie, T.; Tibshirani, R. Generalized additive models: Some applications. In Generalized Linear Models: GLIM 85; Springer: Berlin/Heidelberg, Germany, 1985; pp. 66–81. [Google Scholar]
- Hastie, T.; Tibshirani, R. Generalized additive models. Stat. Sci. 1986, 1, 297–310. [Google Scholar] [CrossRef]
- Moore, L.; Hanley, J.A.; Turgeon, A.F.; Lavoie, A. A comparison of generalized additive models. J. Biom. Biostat. 2011, 2, 109. [Google Scholar]
- Pitt, D.; Trück, S.; van den Honert, R.; Wong, W.W. Modeling risks with generalized additive models. J. Environ. Manag. 2020, 275, 111075. [Google Scholar] [CrossRef]
- Jbilou, J.; El Adlouni, S. Generalized additive models in environmental health. Novel Approaches Risk Assess. 2012, 120, 2014–2016. [Google Scholar]
- Wahlster, P.; Goetghebeur, M.; Kriza, C.; Niederländer, C.; Kolominsky-Rabas, P. Balancing costs and benefits. BMC Health Serv. Res. 2015, 15, 262. [Google Scholar]
- Angelis, A.; Kanavos, P. Multiple criteria decision analysis. Soc. Sci. Med. 2017, 188, 137–156. [Google Scholar] [CrossRef]
- Kim, H.-J.; Kim, Y.-J.; Park, D.-J.; Liew, D.; Rhee, Y. MCDA in health technology assessment. J. Health Technol. Assess. 2017, 5, 128–142. [Google Scholar]
- Behzadian, M.; Otaghsara, S.K.; Yazdani, M.; Ignatius, J. A state-of-the-art survey of TOPSIS. Expert Syst. Appl. 2012, 39, 13051–13069. [Google Scholar] [CrossRef]
- Olson, D.L. Comparison of weights in TOPSIS. Math. Comput. Model. 2004, 40, 721–727. [Google Scholar] [CrossRef]
- Opricovic, S.; Tzeng, G.-H. Extended VIKOR method. Eur. J. Oper. Res. 2007, 178, 514–529. [Google Scholar] [CrossRef]
- Mardani, A.; Zavadskas, E.K.; Govindan, K.; Senin, A.A.; Jusoh, A. VIKOR technique review. Sustainability 2016, 8, 37. [Google Scholar]
- Du, J.; Tao, X.; Zhu, L.; Wang, H.; Qi, W.; Min, X.; Wei, S.; Zhang, X.; Liu, Q. Development of a visualized risk prediction system. Front. Public Health 2025, 13, 1544894. [Google Scholar]
- Chun, H.-Y.Y.; Ford, A.; Kutlubaev, M.A.; Almeida, O.P.; Mead, G.E. Depression, anxiety, and suicide after stroke. Stroke 2022, 53, 1402–1410. [Google Scholar] [CrossRef]
- Fereydooni, I.; Vosoughi, M.; Alighadr, A.; Taghipour, N.; Javaherinasab, M.; Aramesh Borujeni, M.; Mostafavinia, A. Systematic review of ML models. InfoSci. Trends 2025, 2, 65–82. [Google Scholar] [CrossRef]
- Yu, Y.; Rao, Z.; Duan, T.; Zhang, Y.; Zhu, C. Stress hyperglycaemia ratio and stroke severity. BMJ Open 2025, 15, e105117. [Google Scholar] [CrossRef]
- Hao, G.; Shi, Z.; Zhang, B.; Dong, Y.; Liang, G. Global burden of ischemic stroke. Neuroepidemiology 2025. [Google Scholar] [CrossRef]
- Jabal, M.S.; Joly, O.; Kallmes, D.; Harston, G.; Rabinstein, A.; Huynh, T.; Brinjikji, W. Interpretable ML for stroke outcome prediction. Front. Neurol. 2022, 13, 884693. [Google Scholar] [CrossRef]
- Akinwale, D.O.; Bosede, O.A.; Awe, O.O. SHAP-enhanced ML for stroke prediction. J. Math. Sci. Eng. Technol. 2025, 3, 1–13. [Google Scholar]
- Alabi, R.O.; Elmusrati, M.; Leivo, I.; Almangush, A.; Mäkitie, A.A. ML explainability using LIME and SHAP. Sci. Rep. 2023, 13, 8984. [Google Scholar] [CrossRef]
- Oei, C.W.; Ng, E.Y.K.; Ng, M.H.S.; Tan, R.-S.; Chan, Y.M.; Chan, L.G.; Acharya, U.R. Explainable risk prediction. Sensors 2023, 23, 7946. [Google Scholar] [CrossRef]
- Hussain, I.; Jany, R. Interpreting stroke-impaired EMG. Sensors 2024, 24, 1392. [Google Scholar]
- Liu, X.; Mo, J.; Liu, Z.; Ge, Y.; Luo, T.; Kuang, J. Enhancing stroke-associated pneumonia prediction. Digit. Health 2025, 11, 20552076251333568. [Google Scholar] [CrossRef]
- Abutayev, Z.; Kabdrakhova, S. Predicting probability of stroke using machine learning algorithms. Universum Tech. Sci. 2025, 7, 51–55. [Google Scholar] [CrossRef]
- Santika, G.D.; Rabbani, V.S. Stroke Disease Prediction Using Support Vector Machine Method. Proc. Int. Conf. Innov. Sci. Technol. Educ. Child. Health 2025, 5, 123–128. [Google Scholar]
- Rodríguez, J.A.T. Stroke Prediction Through Data Science and Machine Learning Algorithms. Unpublished manuscript. 2021. [Google Scholar]
- Peng, G.; Zhao, B.; He, Y. Integrated classification method for stroke prediction. In Proceedings of the International Conference on Artificial Intelligence, Big Data and Algorithms, Zhengzhou, China, 5–7 July 2024; pp. 393–397. [Google Scholar]
- Siagian, S.N.F.; Anggawijaya, F.J.; Putra, D.P.; Suandi, D. Optimizing ML models for stroke prediction. In Proceedings of the International Conference on Science, Engineering & Technological Innovations, Vienna, Austria, 25–26 October 2025; pp. 375–380. [Google Scholar]
- Mushtaq, S.; Saini, K.S.; Bashir, S. Machine learning for brain stroke prediction. In Proceedings of the International Conference on Disruptive Technologies (ICDT), Greater Noida, India, 11–12 May 2023; pp. 401–408. [Google Scholar]
- Bathla, P.; Kumar, R. Hybrid system to predict brain stroke. Intell. Med. 2024, 4, 75–82. [Google Scholar] [CrossRef]
- Qassim, H. Early prediction of stroke risk. NTU J. Eng. Technol. 2025, 4, 1. [Google Scholar] [CrossRef]
- Sutcu, M.; Jouda, D.; Yildiz, B.; Katrib, J.; Almustafa, K.M. Predicting stroke risk using ML. Stroke Res. Treat. 2025, 2025, 2892726. [Google Scholar] [CrossRef]
- Sahriar, S.; Akther, S.; Mauya, J.; Amin, R.; Mia, M.S.; Ruhi, S.; Reza, M.S. Unlocking stroke prediction. Heliyon 2024, 10, 5. [Google Scholar] [CrossRef]
- Banerjee, S.; Saha, S. Ischemic attack prediction analysis. AIP Conf. Proc. 2024, 2915, 020018. [Google Scholar]
- Peng, G.; Liu, J. Enhanced stroke prediction. In Proceedings of the International Conference on Machine Learning, Cloud Computing and Intelligent Mining (MLCCIM 2024), Shiyan, China, 30 May–3 June 2024; pp. 858–867. [Google Scholar]
- Herrgårdh, T.; Madai, V.I.; Kelleher, J.D.; Magnusson, R.; Gustafsson, M.; Milani, L.; Gennemark, P.; Cedersund, G. Hybrid modelling for stroke care. NeuroImage Clin. 2021, 31, 102694. [Google Scholar] [CrossRef]
- Oluwatosin, E.A.; Sotonwa, K.A.; Raji-Lawal, H.Y.; Zubair, A.F.; Alegbhele, I.B. Hybrid approach to stroke prediction. Univ. Ib. J. Sci. Logics ICT Res. 2024, 12, 65–73. [Google Scholar]
- Tin, T.T.; Qian, W.J.; Aitizaz, A.; Salau, A.O.; Ikumapayi, O.M.; Afolalu, S.A. Towards hybrid stroke prediction. Int. J. Adv. Comput. Sci. Appl. 2025, 16, 9. [Google Scholar]
- Zhalgas, A.; Toleubek, M. Comparative analysis of ML classifiers. J. Probl. Comput. Sci. Inf. Technol. 2024, 2, 21–29. [Google Scholar]
- Sorayaie Azar, A.; Samimi, T.; Tavassoli, G.; Naemi, A.; Rahimi, B.; Hadianfard, Z.; Wiil, U.K.; Nazarbaghi, S.; Mohasefi, J.B.; Afshar, H.L. Predicting stroke severity. Eur. J. Med. Res. 2024, 29, 547. [Google Scholar] [CrossRef]
- Aribisala, B.; Olabanjo, O. Medical image processor and repository. Inform. Med. Unlocked 2018, 12, 75–80. [Google Scholar] [CrossRef]
- Olabanjo, O.; Wusu, A.; Olabanjo, O.; Asokere, M.; Afisi, O.; Akinnuwesi, B. Novel deep learning model for diabetes risk. Int. J. Inf. Technol. 2025, 17, 1933–1955. [Google Scholar] [CrossRef]
- Fernandez-Lozano, C.; Hervella, P.; Mato-Abad, V.; Rodríguez-Yáñez, M.; Suárez-Garaboa, S.; López-Dequidt, I.; Estany-Gestal, A.; Sobrino, T.; Campos, F.; Castillo, J.; et al. Random forest-based prediction of stroke outcome. Sci. Rep. 2021, 11, 10071. [Google Scholar] [CrossRef]
- Wallace, M.L.; Mentch, L.; Wheeler, B.J.; Tapia, A.L.; Richards, M.; Zhou, S.; Yi, L.; Redline, S.; Buysse, D.J. Use and misuse of RF importance metrics. BMC Med. Res. Methodol. 2023, 23, 144. [Google Scholar]
- Ozturk, S. Stroke and stroke risk factors. Health Risk Anal. 2021, 4, 146. [Google Scholar] [CrossRef]
- Liu, Y.; Zhang, M.; Huang, X.; Zheng, Y.; Yu, X.; Li, X.; Zhang, M.; Zhang, Y.; Hu, F. Global burden of stroke due to hypertension. BMC Public Health 2025, 25, 3743. [Google Scholar]
- Hansen, D.V.; van Es, N.; Sørensen, H.T.; Coutinho, J.M.; Skajaa, N. Stroke severity and venous thromboembolism. Res. Pract. Thromb. Haemost. 2025, 9, 103220. [Google Scholar]
- Guidotti, R.; Monreale, A.; Ruggieri, S.; Turini, F.; Giannotti, F.; Pedreschi, D. A survey of methods for explaining black box models. ACM Comput. Surv. 2018, 51, 1–42. [Google Scholar] [CrossRef]
Disclaimer/Publisher’s Note: The statements, opinions and data contained in all publications are solely those of the individual author(s) and contributor(s) and not of MDPI and/or the editor(s). MDPI and/or the editor(s) disclaim responsibility for any injury to people or property resulting from any ideas, methods, instructions or products referred to in the content. |
© 2025 by the authors. Licensee MDPI, Basel, Switzerland. This article is an open access article distributed under the terms and conditions of the Creative Commons Attribution (CC BY) license.