Abstract
The experimental study was performed to determine the efficacy of a mycotoxin detoxification agent (MS) at a concentration of 0.2% in reducing the toxicity of aflatoxin B1 (AFB1) and ochratoxin A (OTA), alone or in combination, and to examine its effect on performance, pathohistological (PH) changes, and residues of these toxins in the tissues of broiler chicks. A total of 88 broilers were divided into eight equal groups: group C, the control group (fed a commercial diet without any additives); group MS, which received the mycotoxin detoxification agent (MS) (supplemented with 0.2%); group E I (0.2 mg AFB1/kg of diet); group E II (0.2 mg AFB1/kg of diet + MS 0.2%); group E III (1.5 mg OTA/kg of diet); group E IV (1.5 mg OTA/kg of diet + 0.2% MS); group E V (combination of 0.2 mg AFB1/kg, 1.5 mg OTA/kg of diet); and group E VI (combination of 0.2 mg AFB1/kg, 1.5 mg OTA toxin + 0.2% MS). Results show that feed containing AFB1 and OTA, individually or in combination, negatively affects health, production results, and PH changes in tissues, as well as the presence of mycotoxin residues in the liver and breast muscles of poultry. The addition of a new multicomponent preparation for the detoxification of MS mycotoxins in feed with AFB1 and OTA individually and in combination had a positive effect on TM (BW), growth (BWG), consumption and FCR conversion coefficient, and microscopic lesions in organs. The concentration of OTA residues in the liver and chest muscles was significantly lower in chickens fed a diet with the addition of 0.2% MS of the mycotoxin detoxification preparation.
1. Introduction
Cereals are the most vulnerable link in the food production chain for humans and animals. One of the most important problems in grain production is contamination by saprophytic molds in the field as well as in storage. The presence of saprophytic molds can significantly reduce grain yield and quality. Most of the saprophytic molds that contaminate cereals have the ability to create more than 500 different types of mycotoxins in their secondary metabolism through complex metabolic pathways. The danger of mycotoxins threatens both humans and animals due to their spread and circulation in the food chain. Mycotoxins are chemically diverse compounds of low molecular weight [1,2].
They enter the bodies of animals and humans through contaminated feed and food and cause diseases, i.e., mycotoxicosis. The immune systems of humans and animals do not recognize them as a danger, so humans and animals are permanently unprotected from them. Once introduced into the system of animals or humans, such molecules exhibit a range of biological activities, including acute and chronic toxicity, teratogenicity, mutagenicity, and carcinogenicity [1].
In the middle of the 20th century, the first modern mass mycotoxicosis of animals broke out in Great Britain. It was caused by chemical compounds of the bisfuranocoumarin type, later called aflatoxins, originating from the peanut meal that was added to animal feed. So far, 18 types of aflatoxin have been discovered, of which the most important are aflatoxin B1, B2, G1, G2, and M1. Aflatoxins B1, B2, G1, and G2 are direct secondary metabolites of fungi, while aflatoxin M1 is formed by metabolizing aflatoxin B1 [1]. Synthesis of AFB1 will occur if the Aspergillus species grow on corn, provided that the molds themselves have a genetic predisposition for AFB1 synthesis and that there are corresponding external factors met [3,4].
The existence of genes that enable the synthesis of AFB1 is considered under genetic predisposition. A. flavus has 25 identified genes grouped on the 70 kb DNA of chromosome III, which enables the synthesis of the aflatoxin.
The most important way of intake of AFB1 is peroral, that is, through contaminated feed or food. One of the three most important cereals in the world is corn [5]. Maize production in Serbia occupies about 40% of arable land, so that in recent decades, Serbia is considered an important producer and exporter of maize in Europe, but it is also a large source of AFB1 due to global warming and increasingly higher temperatures recorded in the fields during the period of maize growth and maturation [6].
Initial symptoms of AFB1 poisoning in poultry include anorexia, reduction in body mass, growth, egg production, pale skin and mucous membranes, weakness of legs and wings, as well as nervous symptoms. Also, there is a disturbance of lipid metabolism and, consequently, the appearance of steatorrhea, fatty liver, as well as a decrease in the value of triglycerides, cholesterol, and phospholipids in the blood of affected animals.
The mechanism of hepatocellular carcinoma formation in animals fed AFB1 has been described; consequently, the International Agency for Research on Cancer (IARC) classified AFB1 into Group 1A (proven carcinogen for humans and animals, IARC, 2002) [7].
Ochratoxin A (OTA) is a metabolite of storage molds from the genera Aspergillus and Penicillium. It was isolated for the first time in 1965 in South Africa from corn flour. Further research has shown that OTA is a nephrotoxic, hepatotoxic, embryotoxic, teratogenic, and immunotoxic agent. IARC has classified it in Group 2B, a proven carcinogen in laboratory mice and rats, and a potent human carcinogen. OTA causes mold kidney nephrosis in pigs and chronic tubulonephropathy in poultry [8]. Many authors in the 1980s and 1990s linked it to fatal chronic endemic kidney disease in humans. The disease appeared in certain parts of Romania, Bulgaria, Croatia, and Serbia, is called Balkan endemic nephropathy. This etiology has never been scientifically confirmed. Today, the presence of OTA in food is linked to chronic interstitial nephropathy (CIN), as well as the occurrence of urothelial carcinoma and testicular carcinoma in humans.
Chronic poisoning with lower doses of OTA, but over a longer period of time, is most often described. As with all mycotoxins, the clinical picture is atypical. Most often, there is a decrease in the production results of animals, a decrease in body weight, growth, and lower feed consumption, and the stratification of flocks in poultry is a sign of chronic long-term OTA poisoning. Animals ingest OTA through food, most often through contaminated grains (primarily corn and barley), but also corn silage and byproducts of the distillery and bioethanol industry. The appearance and intensity of clinical symptoms in animals suffering from ochratoxicosis depend solely on the concentration of OTA in feed and on the length of exposure to this mycotoxin.
Apart from feed, food is also under constant monitoring for the presence of OTA. Very often, OTA can contaminate cereals for human consumption, dried fruits, spices, wine, coffee, cocoa, and also food of animal origin due to the possible presence of OTA residues in the tissues of animals.
The toxicokinetics, mechanisms of action, and adverse effects of AFB1 and OTA have been extensively studied in detail [9]. Due to the increasingly frequent presence of AFB1 and OTA in animal and human feed, the fight against OTA is focused on two fronts. Development of sensitive analytical techniques and methods of detection, constant monitoring of feed and food, as well as strict compliance with the maximum permissible concentration (MDK) of OTA in feed and food. On the other hand, the strategy of eliminating the harmful effects of OTA calls for the development of a large number of adsorbents and deactivators of mycotoxins that are added to animal feed. Adsorbents are substances that are not resorbed from the intestine and have the ability to physically bind certain chemical compounds, thereby preventing their resorption. In recent times, the possibilities of using organic adsorbents and especially modified mannan oligosaccharides isolated from the inner layer of the cell wall of yeasts, which have a distinct ability to adsorb mycotoxins, have been investigated. Also, the deactivation of mycotoxins by biological means can be defined as their degradation or biotransformation (to less toxic metabolites) by enzymes, which are achieved through the whole cell of a microorganism or an individual enzyme system. Multicomponent preparations for mycotoxin detoxification are increasingly being used. Based on the above-mentioned as well as on our in vitro and ex vivo data, we have opted to evaluate the new mycotoxin detoxifying agent.
2. Materials and Methods
The experiment was performed on a total of 88 one-day-old broilers of Ross 308 provenance, obtained from Robins incubator station, Glavaševa 72, 11420, Glibovac, Serbia, https://robins.rs. The experiment was organized according to a group control system. Broilers were fed according to the Ross 308 production manual, using starter, grower, and finisher feeds. All feeds met or exceeded the nutrient recommendations set by Aviagen Group [10]. For the purpose of this study, broilers were divided into 8 equal groups (n = 11):
The E-I group was fed a regular broiler diet with the addition of AFB1 at a concentration of 0.2 mg/kg of feed.
The E-II group was fed a regular broiler diet with the addition of AFB1 at a concentration of 0.2 mg/kg of feed with 0.2% of the examined detoxification agent MS.
The E-III group was fed a regular broiler diet with OTA at a concentration of 1.5 mg/kg of feed.
The E-IV group was fed a regular broiler diet OTA at a concentration of 1.5 mg/kg of feed with 0.2% of the examined detoxification agent MS.
The E-V group was fed a regular diet with AFB1 at a concentration of 0.2 mg/kg of feed and OTA at a concentration of 1.5 mg/kg of feed.
The E-VI group was fed a regular diet with AFB1 at a concentration of 0.2 mg/kg of feed, OTA at a concentration of 1.5 mg/kg of feed, and 0.2% of the examined detoxification agent MS.
The C group was fed a regular broiler diet.
The MS group was fed a regular broiler diet with 0.2% of the detoxification agent MS.
Feed Preparation
For the preparation of contaminated AFB1 material, the methodology from our study [11] was used.
The preparation of OTA-contaminated material was performed according to the methodology described in our study [12].
The multicomponent mycotoxin detoxifying agent (MS) contains physical adsorption components, like as modified bentonite. Bentonite has been modified through the mechanical incorporation of organic components to alter its surface characteristics, with the aim of improving its adsorptive capacity toward toxins such as ochratoxin A (OTA), fumonisin B1 (FB1), and zearalenone (ZEN), with the addition of Saccharomyces cerevisiae cell wall, and hepatoprotective agent silymarin. These ingredients have been optimized (tested in vitro) to have an optimal effect on animals.
During the six weeks of the experiment, the following parameters were monitored:
- (a)
- Health condition of the animals.
- (b)
- Broiler Body Weight (BW) at the beginning of each week of the experiment.
- (c)
- Feed consumption (by period/group).
- (d)
- Body weight gain (BWG) and Feed Conversion Ratio (FCR).
- (e)
- After 6 weeks, all of the animals were sacrificed by the human (which is allowed for poultry in EU). After sacrifice, a macroscopic examination was performed, and tissue samples were collected for PH examination (intestine, liver, and kidney).
- (f)
- Immediately after sacrifice, organ masses (liver, heart, and spleen) were measured.
- (g)
- Also, the presence and content of AFB1 and AFM1 residues, as well as OTA, in the liver, kidneys, and chest muscles of broilers were determined. Samples for residue testing were taken at the end of the experiment and frozen at a temperature of −20 °C. Determination of the content of AFB1, AFM1, and OTA was performed using the technique of liquid chromatography with mass spectrometry LC/MS-MS.
The analysis of the presence of AFB1, B2, G1, G2, and M1 in the breast muscle and liver was performed as described in our paper [11], while the OTA determination, also in the breast muscle and liver, was performed using the methodology described in the study [13]. All results were statistically analyzed for differences between groups by an analysis of variance (ANOVA), and the Tukey test was used to determine between-group differences. The results were processed using Graph Pad Prism® 5.0 software (Graph Pad Software Inc., San Diego, CA, USA). All values are expressed as the mean X + SE.
3. Results
3.1. Average BW of Broilers
The average BW of broilers during the experimental period is given in Table 1.

Table 1.
Average BW of broilers during the experimental period (g) ± Sx.
On the first day of the experiment, no statistically significant differences were observed between the BW broilers of the experimental and control groups. On the seventh day of the experiment, a statistically significant difference (p < 0.05) was recorded between BW broilers that received 1.5 mg OTA/kg feed and the C group, which received commercial feed without additives during the experiment. On the fourteenth day of the experiment, a statistically significant difference was observed between BW broilers of the E-III group, which received 1.5 mg of OTA in food, and the E-IV group, which received 0.2% MS along with OTA. Broilers of the E-IV group that received OTA and the preparation for detoxification of mycotoxins achieved 25.1% more BW compared to broilers that received 1.5 mg of OTA in food, which can be attributed to the protective effect of the preparation. On the fourteenth day of trial, broilers of the E-V group that received 0.2 mg AFB1 and 1.5 mg OTA/kg of feed achieved the lowest BW. A statistically significant difference at the level (p < 0.05) was detected in relation to the BW broilers of the E-VI group, which received 0.2% MS in their feed in addition to these two toxins. E-VI group broilers achieved 33.4% more BW, due to the protective effect of the MS. The E-V group had a statistically significantly lower BW compared to E-I, E-II, E-III, and C group broilers. The lower BW of the E-V group compared to the other groups of animals is the result of the additive effect of AFB1 and OTA in the feed. On the twenty-first day of experiment, broilers of the E-II group, which received 0.2 mg of AFB1/kg of feed and 0.2% MS, gained 21.77% more BW compared to broilers of the E-I group. A statistical significance at the level (p < 0.01) was described between these groups. Also, we can observe a trend of positive influence of MS on the increase in the BW in broilers of this group compared to the group that received 0.2 mg AFB1/kg feed. A similar trend was observed in broilers of the E-IV group, which were fed 1.5 mg/kg OTA and 0.2% of the tested preparation. Broilers of this group had a statistically significantly higher BW compared to broilers of the E-III group, which received only 1.5 mg/kg OTA (p < 0.05), by 20.1%. Broilers of the E-V group, which received AFB1 and OTA, achieved the lowest TM. Broilers of the E-VI group, which received 0.2% MS, in addition to these two toxins, had a 20.2% higher BW compared to broilers of the E-V group, which can be described as a protective effect of the preparation.
On the 28th day of the experiment, a similar trend of BW growth was observed as on the 21st day of the experiment. Broilers of the E-II group that received 0.2 mg of AFB1 with the addition of MS gained 22.43% more BW compared to broilers of the E-I group. This increase in BW was statistically significant at the (p < 0.01) level. The E-IV group, which received 0.2% MS in addition to 1.5 mg OTA/kg of feed, had a 20.28% higher BW compared to the E-III group broilers, which received only 1.5 mg OTA/kg of feed. This increase was also statistically significant at the (p < 0.01) level. Broilers of the E-V group (906.8 ± 30.84 g) that were fed AFB1 and OTA achieved the lowest BW on the 28th day of the experiment. Broilers of the E-VI group that received 0.2% MS along with the two toxins achieved 23.74% more BW compared to broilers of the E-V group. This difference was statistically significant at the (p < 0.01) level. In broilers of all groups that received the mycotoxin detoxification preparation along with mycotoxins, there was a statistically significant increase in the TM of broilers compared to groups of broilers that only received mycotoxins in their feed. At the same time, we can note that the highest BW in this period was achieved by broilers of the MS group, which received commercial feed with the addition of 0.2% of the tested preparation (1333 ± 39.86 g). On the 35th day of the experiment, the same trend is observed as on the 28th day. Broilers of the experimental groups E-II, E-IV, and E-VI, which received 0.2% MS along with mycotoxins, achieved 20.24, 19.7, and 21.64% higher BW, respectively, compared to the broilers of E-I, E-III, and E-V groups. These BW changes were statistically significant at the (p < 0.05) level. Broilers of the MS group achieved the highest BW, which received 0.2% MS (1990 ± 51.95 g) in addition to commercial feed. At the end of the experimental period on the 42nd day, broilers of the E-II, E-IV, and E-VI groups, which received AFB1, OTA, as well as a combination of both toxins in the feed, had a score of 29.79, 32.88, and 24.66% more BW, respectively, compared to the broilers of E-I, E-III, and E-V groups, which were fed mycotoxins alone. The significant increase in BW in this group of broilers is almost certainly related to the protective effect of the MS preparation. The body weights of groups E-II, E-IV, and E-VI were statistically significantly higher at the level (p < 0.05). Broilers of the MS group, which received 0.2% of the detoxification agent, achieved the highest BW, whose final average BW was 2831 ± 120 g. The difference between the BW of broilers that received 0.2 mg AFB1/kg feed and 0.2% of preparation MS, and the MS group that received 0.2% detoxification agent with commercial feed was only 8 g. This fact indicates a significant influence of the preparation on the recovery of body weights of the broilers fed AFB1 and MS. An important fact is that the broilers of the MS group, which received 0.2% of the preparation in addition to commercial feed, from the 28th day until the end of the experiment, had the highest BW of all broilers of the experimental groups. There are significant indications that this preparation could be used as an additive in commercial broiler fattening as a permitted growth promoter.
3.2. Body Weight Gain (BWG)
Total daily body weight gain is given in Table 2.
Table 2.
Total daily BWG of broilers by stages of the experiment (g).
In the period from 1st to 21st day of experiment, it can be observed that the broilers of E-II, E-IV, and E-VI groups, which received 0.2% MS in addition to mycotoxins, achieved, respectively, 27.89, 27.17, and 19.18% more BWG compared to the broilers of E-I, E-III, and E-V groups, which received only AFB1, OTA, and a combination of these two toxins. This effect can be attributed to the protective effect of the mycotoxin detoxification preparation used. A similar trend can be observed in the period from the 21st to the 35th day of examination. Broilers of the E-II, E-IV, and E-VI groups, which were fed AFB1, OTA, and a combination of both mycotoxins and 0.2% MS, had, respectively, 4.12, 50.47, and 73.09% more growth compared to broilers of the E-I, E-III, and E-V groups. Broilers of the MS Group achieved the highest increase in BWG, which, in addition to the commercial mixture, also received 0.2% MS. Between the 35th and 42nd day of the experiment, almost the same trend of growth distribution is observed, as in the previous phase of the experiment. Broilers of the MS group achieved the highest growth. In this phase of the experiment, they had 17.56% more growth compared to the broilers of the C group. A significant positive trend was observed in the influence of preparations for mycotoxin detoxification on the growth of broilers of the E-II, E-IV, and E-VI groups.
Upon examining the results collectively obtained, the entire fattening period from the 1st to the 42nd day of the experiment, we can gain better insights into the growth of broilers of the experimental and control groups. As in the individual phases of the trial, it is clearly seen here that the broilers of the E-II, E-IV, and E-VI groups, which received 0.2% MS in addition to mycotoxins, achieved, respectively, 42.53, 35.02, and 61.59% more growth compared to the broilers of the E-I, E-III, and E-V trial groups, observed for the entire fattening period.
As shown by the analysis of BW, we can also see here that broilers of the E-II group achieved BW and gains that were almost the same as the broilers of the control groups. This can be attributed to the positive effect of mycotoxin detoxification preparations. MS is formulated to contain two active components for adsorbing mycotoxins, which is probably how most of the AFB1 is eliminated from feed. In this way, it was also made possible for the animals to achieve the mechanism of compensatory growth, which was most noticeable in the last phase of the experiment. Broilers of the E-V group, which received a combination of AFB1 and OTA, achieved the lowest growth during the experiment, but it can also be concluded that the broilers of the E-VI group, which received a combination of these two mycotoxins and 0.2% MS, by the end of fattening, achieved 61.59% more growth compared to broilers of the E-V group. Broilers of the MS group, which received 0.2% of the preparation MS in addition to commercial feed, achieved the highest daily growth for the entire experiment.
3.3. Feed Conversion Ratio (FCR)
The average feed conversion ratio is given in Table 3.
Table 3.
Average feed consumed per bird per day and feed conversion ratio during the study.
Broilers of the control groups (C and MS) consumed a normal amount of feed. On the other hand, the experimental groups of broilers consumed significantly lower amounts of food (E-I, E-III, and E-V) compared to the experimental groups that received 0.2% of the preparation MS (E-II, E-IV, and E-VI) in addition to mycotoxins. The largest amount of food consumed between the 21st and 42nd day was by the KP group, which received 0.2% of MS along with commercial food. The Feed Conversion Ratio (FCR) of food is a good indicator of the success and economic justification of fattening, and represents the ratio of achieved growth and food consumption. The FCR was lower in broilers of the control groups compared to the experimental groups, and is shown for the entire experiment in Table 3. Broilers of the E-II, E-IV, and E-VI groups had, respectively, 25.38, 30, and 54% better FCR compared to broilers of the E-I, E-III, and E-V groups. Broilers of the control groups (MS and C) achieved the best FCR, 1.82 kg.
Observing the complete production results, we can conclude on the basis of all the above that MS, in the amount of 2 kg/t of food, fully delivered the expected results. Since the MS group, which received 0.2% detoxification agent with the highest BW during the experiment, also achieved the highest growth and the highest feed consumption, this preparation, apart from fighting mycotoxicosis, could also be used as a permitted growth stimulator in poultry.
3.4. Relative Mass of Organs
The results of the relative mass of organs at the end of the study are shown in Table 4.
Table 4.
Relative mass of organs (%) of experimental broiler groups on the 42nd day of experiment (%) ± Sx.
Observing the obtained results, we can conclude that on the 42nd day of experiment, the liver mass was statistically significantly higher (p < 0.5) in broilers of the E-I group that received 0.1 mg AFB1/kg of food in comparison to broilers of the E-II group that received AFB1 and 0.2% MS. Also, broilers of the E-V group, which received AFB1 and OTA in their feed, had a significantly higher relative liver mass (p < 0.5), compared to broilers of the E-VI group that received 0.2% MS in their feed along with mycotoxins. These changes in E-I and E-V group broilers are probably due to the high hepatotoxic potential of AFB1. In broilers, the E-II and E-VI groups, which received 0.2% of MS in their feed along with mycotoxins, the relative liver weight values were within physiological limits, which can be attributed to the positive effect of the MS preparation added to broiler feed. A similar trend is observed when looking at the relative weight of the spleen. The relative weight of the spleen was statistically significantly higher (p < 0.5) in the E-I group broilers fed 0.1 mg AFB1/kg feed compared to the E-II group broilers fed AFB1 and 0.2% MS. This fact can also be attributed to the positive effect of the preparation MS, which was added to the feed of broilers of the E-II group.
The broilers of the control group, as well as the group that received toxin-free feed with 0.2% of the tested MS, had a harmonious body structure, properly developed bone and muscle tissue, lively temperament, and good condition. Feathers, skin, and visible mucous membranes were unremarkable. Appetite was good, and feces formed normally. The ability to move actively and the coordination of movements were harmonious, and the muscle tone was uncharacteristic. No pronounced clinical signs of health decline were observed in the experimental groups. It should be emphasized that the groups that consumed contaminated feed, starting from the second week of the experiment, took increased amounts of water compared to the control group. Sporadic diarrhea was observed in a smaller number of individual broilers.
3.5. Pathohistological Changes
The PH changes in the broiler duodenum are given in Table 5.
Table 5.
Pathohistological changes in broiler duodenum.
Pathohistological changes were observed in all tissues of the treated broilers that were fed mycotoxin-contaminated feed with or without the tested mycotoxin detoxification preparation. No PH changes were detected in the duodenum of broilers of the C group that received commercial mixtures for broiler nutrition, nor in the MS group of broilers that also received 0.2% of the tested preparation. PH changes of duodenum are shown in Figure 1.
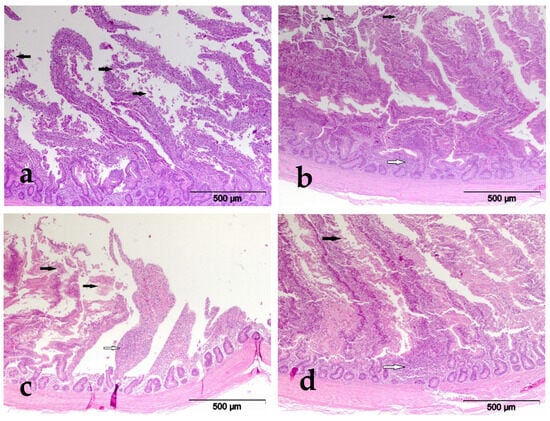
Figure 1.
HE×100. (a) Experimental group I, duodenum, desquamation of the enterocytes (black arrow); (b) experimental group II, duodenum, desquamation of the enterocytes (black arrow), infiltration of the lamina propria with lymphocytes (white arrow); (c) experimental group V, duodenum, desquamation of the enterocytes (black arrow), infiltration of the lamina propria with lymphocytes (white arrow); (d) experimental group VI, duodenum, desquamation of the enterocytes (black arrow), infiltration of the lamina propria with lymphocytes (white arrow).
Broilers of the E-I group, which received 0.2 mg AFB1/kg food, demonstrated duodenal changes in the form of hyperemia of the epithelial lamina in 36.36% of cases, as well as desquamation of the intestinal villi (72.72%) and proliferation of goblet cells in 54.54% of examined animals. In broilers of the E-II group, which were fed 0.1 mg/kg of AFB1 and 0.2% of the tested MS, no hyperemia was detected in the enterocytes, while desquamation of the intestinal villi was recorded in 36.36% of the tested animals. Hyperplasia of goblet cells of the intestinal villi was described only in 18.2% of examined animals. We can assume that the lower prevalence, as well as the absence of some PH changes in broilers of this group compared to the E-I group, is the consequence of the protective effect of the investigated preparation for the detoxification of mycotoxin MS.
In broilers of the E-III group that received 1.5 mg/kg of OTA in feed, changes in enterocytes were observed by PH examination, characterized by desquamation in 72.72% and hyperplasia of goblet cells in 54.54% of examined animals. The same PH changes were recorded in broilers of the E-IV group, which received 0.2% MS preparation in addition to OTA, only in a smaller number of examined animals. Desquamation of enterocytes of the intestinal villi was detected in 36.36% and hyperplasia of goblet cells in 18.18% of examined animals. In broilers of this group, PH changes were recorded in 50% of cases, which is 33.33% fewer animals, and this reduction can be attributed to the protective effect of the preparation for detoxification of mycotoxins. In the duodenum of the broilers of the E-V group, which received the combination of AFB1 and OTA, the following changes were observed: hemorrhages in 60% and hyperemia of the intestinal wall in 40% of the examined animals. Also, desquamation of enterocytes was detected in 50%, as well as proliferation of goblet cells in 70% of the examined animals. In broilers of the E-VI group, which received OTA and 0.2% of the tested MS in feed in addition to AFB1, PH changes were recorded in the form of hemorrhages in the wall of the duodenum in 18.18% of the tested animals, while hyperemia of the wall of the duodenum was not described in any animal of this group. Likewise, desquamation of intestinal villi in 18.18% and hyperplasia of goblet cells in 27.27% of examined animals were described in this group.
Table 6.
Pathohistological changes in broiler liver.
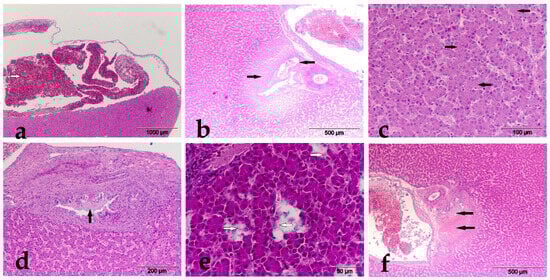
Figure 2.
(a) Experimental group I, liver, massive hemorrhage (white arrow), HE×400; (b) experimental group II, liver, bile duct and pericholangiar necrosis (black arrow), HE×100; (c) experimental group III, liver, intracellular edema (black arrow), HE×400; (d) experimental group IV, liver, necrosis of the bile duct (black arrow), HE×200; (e) experimental group V, liver, cellular hydrops (white arrow), HE×600; (f) experimental group VI, liver, bile duct, and pericholangiar necrosis (black arrow), HE×100.
In broilers of the E-I group that received 0.2 mg AFB1/kg of feed, changes in hepatocytes in the form of cloudy swelling, vacuolar degeneration, and hemorrhage in the parenchyma were detected in 45.45%, 81.81%, and 27.27% of examined animals. Bile duct necrosis and pericholangial necrosis were also detected in animals of the same group, respectively, in 63.63% and 27.27% of examined animals. In broilers of the E-II group, which received 0.2 mg AFB1 and 0.2% MS, changes in hepatocytes were detected in the form of cloudy swelling and vacuolar degeneration in 18.18% and 54.54% of examined animals, respectively. Hemorrhages in the liver parenchyma were not detected in the broilers of this group. In the animals of this group, changes in the form of bile duct necrosis were also described in 18.18% of examined animals, while pericholangial necrosis was described in 27.27% of animals. Broilers of the E-V group, which received a combination of AFB1 and OTA, demonstrated the following PH changes: cloudy swelling and vacuolar degeneration in hepatocytes in 70% and hemorrhages in the parenchyma in 40% of the examined animals. Also, bile duct necrosis was present in 90% of the examined animals, as well as pericholangial necrosis in 60% of the examined animals. In broilers of the E-VI group, which received 0.2% MS along with AFB1 and OTA, PH changes were present in a significantly smaller number of animals compared to broilers of the E-V group. Thus, cloudy swelling and vacuolar degeneration in hepatocytes were present in 45.45% and 9.09% of examined animals, while hemorrhages in the liver parenchyma were not detected in broilers of this group. Bile duct necrosis and pericholangial necrosis were present in 27.27% and 36.36% of examined animals, respectively.
The pathohistological changes in the broiler kidneys are given in Table 7.
Table 7.
Pathohistological changes in the broiler kidneys.
No PH changes were detected in the kidneys of broilers of the E-I group, which received 0.2 mg of AFB1 in the diet, or the broilers of the E-II group that received AFB1 and 0.2% MS in the diet. In broilers of the E-III group, which received 1.5 mg OTA/kg feed, PH changes in the kidneys typical of poultry ochratoxicosis were detected. PH changes manifested in the form of bleeding in the kidney parenchyma in 36.36% of examined animals. The PH changes in the renal tubules were described as tubulonephrosis in the form of intracellular edema and tubulonecrosis in 54.54% of examined animals. Broilers of the E-IV group, which received 0.2% MS preparation with OTA in feed, had the same PH changes described only in a significantly smaller number of animals. Thus, hemorrhages in the kidney parenchyma were detected in 18.18% of animals examined. Tubulonephrosis was described in 36.36% and tubulonecrosis with karyopyknosis, karyolysis, and karyorrhexis of tubulocytes in 27.27% of examined animals. Twice as few animals of this group had PH changes in the kidneys compared to broilers of the E-III group. In broilers of the E-V group, which were fed a combination of AFB1 and OTA, PH changes were detected in kidneys in a large number of animals, probably due to the synergistic effect of the two mycotoxins. Hemorrhages in the parenchyma were detected in 90% of the animals in this group. PH changes in the tubulocytes are described in the form of tubulonephrosis, i.e., intracellular edema in tubulocytes in 80% and tubulonecrosis in 90% of examined animals of this group. The reason that more animals were affected by PH changes in the kidneys compared to the groups that received only OTA is probably the simultaneous effect of AFB1 on liver damage and directing the metabolism of OTA exclusively to the kidneys of broilers. In broilers of the E-VI group, the same PH changes were described as in broilers of the E-V group: a significantly smaller number of animals were affected. In broilers of the E-VI group, hemorrhages in the kidney parenchyma, tubulonephrosis, and tubulonecrosis were described in 27.27% of the examined animals and are shown in Figure 3. A significant reduction in the number of animals affected by PH changes can be attributed to the protective effect of the preparation.
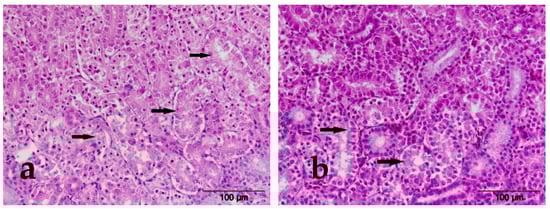
Figure 3.
HE×400. (a) Experimental group III, kidney, tubular necrosis (black arrow); (b) experimental group IV, kidney, tubular necrosis (black arrow).
The presence of aflatoxin residues in broiler tissues is given in Table 8, while OTA residues are shown in Table 9 (liver) and Table 10 (breast muscles).
Table 8.
The presence of AFB1 and AFM1 residues in μg/kg in the chest muscles and liver of broilers.
Table 9.
Presence of OTA residues in μg/kg in the liver of broilers.
Table 10.
The presence of OTA residues in μg/kg in the breast muscles of broilers.
On the forty-second day of experiment, samples were collected to examine the presence and content of AFB1, B2, G1, G2, and AFM1 residues in the liver and chest muscles of broilers using LCMS-MS. Analysis of the tested samples did not detect residues of AFB1, B2, G1, G2, and M1 in the liver and chest muscles of the tested animals. Also, the presence of OTA residues in the collected samples was examined using the same technique.
The concentration of OTA residues in the liver of broilers of the E-III group, which received 1.5 mg OTA/kg feed, was 59.08 μg/kg. Broilers of the E-IV group, which received 0.2% MS in addition to OTA, had 37.74% lower OTA values in the liver, which can be explained by the positive protective effect of the preparation. In broilers of the E-V group, which received a combination of both toxins, the presence of OTA residues in the liver was detected at a concentration of 45.33 μg/kg. Broilers of the E-VI group, which, in addition to both toxins, received 0.2% of the MS preparation, had 39.56% lower values of OTA residues in the liver compared to broilers of the E-V group. This can also be explained by the protective effect of the MS preparation.
Observing the obtained results, we can conclude that 3.140 μg/kg of OTA was detected in the chest muscles of broilers of the E-III group. In broilers of the E-IV group, which received 0.2% of MS preparation in feed in addition to OTA, 48.73% less OTA residues were detected in chest muscles compared to broilers of the E-III group. In broilers of the E-V group, which were fed a combination of both toxins, the presence of OTA residues in chest muscles was also detected at a concentration of 3.047 μg/kg OTA. In broilers of the E-VI group, which, in addition to both mycotoxins, also received 0.2% of the MS preparation, the concentration of OTA in chest muscles was 40.04% lower compared to the concentration of OTA in broilers of the E-V group. This significant decrease in concentration of OTA residues in the chest muscles can be attributed to the protective effect of the MS preparation.
4. Discussion
4.1. Effect of MS on the Performance of Broilers
Mycotoxins are considered one of the most dangerous contaminants in animal feed. Once they enter the food chain of animals, it is difficult to remove them. This study demonstrated the effectiveness of mycotoxin detoxification preparations based on modified bentonite, yeast cell wall, and silymarin in broilers fed AFB1 and OTA. The preparation for detoxification of mycotoxins influenced a partial improvement of production results, reduction in the number and intensity of PH changes in the organs, as well as reduction in the level of mycotoxin residues in edible tissues of broilers.
The group of broilers that received 2 kg/t of the tested preparation MS in addition to commercial feed achieved the best production results of all the groups in the experiment. This indicates positive effects of the preparation in broilers that consumed food without mycotoxins.
The results of this study show a significant negative effect of AFB1 and OTA, as well as their combinations added to broiler feed, on production results. Our findings are in agreement with the findings of the majority of authors who used identical or similar doses of mycotoxins as those applied in our study [11,12,14]. When observing the body weight (BW) of broilers from all experimental groups starting from day 14, a statistically significant decrease in BW was recorded in the groups receiving AFB1, OTA, or their combination in the diet, compared to the groups fed the same contaminated feed supplemented with 0.2% of the mycotoxin decontamination preparation MS.
An interesting novel finding is that broilers in group E-II, which received 0.2 mg/kg of AFB1 together with 0.2% of the MS preparation, achieved final body weights fully corresponding to the production standards for the given provenance. The difference between this group and the control group (C), which was fed commercial feed without any additives, amounted to only 8 g. This encouraging result was most likely achieved due to the carefully selected adsorptive components of the detoxifying preparation, primarily modified bentonite, which exhibits a remarkably high adsorption affinity for AFB1.
Our results are partially consistent with findings reported by others [12,14,15]. When considering the entire experimental period (days 1–42), a more comprehensive overview of broiler growth performance can be obtained. Broilers in groups E-II, E-IV, and E-VI, which received 0.2% MS preparation along with mycotoxins, achieved 42.53%, 35.02%, and 61.59% higher weight gains, respectively, compared to broilers in groups E-I, E-III, and E-V, which did not receive the detoxifying preparation.
The trend observed in body weight analysis can also be noted here—broilers from group E-II exhibited weight gains nearly identical to those of the control group. This outcome may be attributed to the positive influence of the MS detoxification preparation. Furthermore, it appears that the preparation enabled the activation of a compensatory growth mechanism in the treated animals, which was particularly evident during the final phase of the experiment.
The lowest weight gains during the experiment were recorded in broilers from group E-V, which received a combination of AFB1 and OTA in the diet. However, it can also be concluded that broilers in group E-VI, which were fed both toxins along with 0.2% of the MS preparation, achieved 61.59% higher weight gains compared to broilers in group E-V by the end of the fattening period.
The highest average daily gains throughout the entire experimental period were observed in broilers from the MS group, which were fed commercial feed supplemented with 0.2% of the MS detoxification preparation. Our results are partially consistent with the findings reported by others [11,12,14,16].
The most favorable feed conversion ratio (FCR) was recorded in the control (C) and MS groups. The groups of broilers receiving AFB1 and OTA exhibited the poorest FCR; however, group E-VI, which received both toxins in combination with 0.2% of the MS preparation, showed a significant improvement in FCR by the end of the trial—by as much as 64.66%. This improvement can be attributed to the positive effect of the detoxifying preparation. These results are consistent with those of [11,16], and partially in agreement with [12,13].
When observing relative liver weight, it was noted that broilers from groups E-I and E-V, which were fed AFB1 as well as the combination of AFB1 and OTA, exhibited significantly higher relative liver masses compared to broilers from groups E-II and E-VI, which received the same toxins but were also supplemented with the detoxifying preparation MS. The relative liver mass values of these groups were nearly within physiological limits, a result that can be attributed to the beneficial effects of the MS preparation, particularly due to its hepatoprotective component—silymarin. Our findings are consistent with those of [15].
4.2. Effect on Pathohistological Changes in Broiler Tissues
Since neither AFB1 nor OTA possesses cardiotoxic potential, the relative heart mass across all experimental groups did not differ significantly. Changes in organ mass in toxicological studies can be the first indicators of mycotoxin toxicity, but histopathological studies should confirm these results. Also, the positive effect of the detoxification preparation seen here by MS should be confirmed by PH examinations (score of the number and type of lesions) in the examined organs.
Pathohistological (PH) changes in the duodenum and liver were detected in broilers from group E-I, as presented in Table 5 and Table 6 of Section 3, as well as in Figure 2a–f. These changes are associated with the metabolism and biotransformation of AFB1 in poultry. In broilers of group E-II, which received AFB1 along with the MS preparation, PH alterations were also observed in the duodenum and liver, but in a notably smaller number of animals. This indicates that the MS preparation exerted a positive influence by reducing the incidence of changes, although it did not achieve complete restitution of the affected tissues. Our observations are in agreement with other authors [10,11].
In group E-III broilers, which were fed 1.5 mg OTA/kg feed, PH changes were observed in the liver and kidneys, as shown in Table 6 and Table 7 of Section 3. These changes were consistent with the concentration of OTA in the feed and its known pathways of metabolism and biotransformation in poultry. In broilers of group E-IV, PH changes were also detected in the liver and kidneys, but in a significantly smaller number of animals, although complete recovery was not achieved. The reduced number of affected animals can be attributed to the protective effect of the MS preparation. Nevertheless, the preparation did not lead to full restitution of PH changes. Our findings correspond with those reported by [13,15,16].
In broilers of group E-V, which were fed 0.2 mg AFB1 and 1.5 mg OTA/kg, PH changes were detected in the liver and kidneys of a large number of animals, and are shown in Table 6 and Table 7 of Section 3. In broilers of group E-VI, which received both toxins together with the MS detoxifying preparation, changes were observed in a significantly smaller number of animals. However, even under the influence of the MS preparation, complete restitution of changes was not achieved in these groups. The absence of some PH changes, as well as their presence in a smaller number of animals, can be attributed to the protective effect of the added MS preparation. Our results are consistent with the findings of [12].
4.3. Residual Levels of AFB1 and OTA in Broiler Tissues
Mycotoxins present in animal feed can accumulate in edible tissues during processes of metabolism, biotransformation, and excretion, thereby representing a potential risk in ensuring food safety for humans. Within an integrated food safety system, as incorporated in the modern One Health concept of the World Health Organization (WHO), animal feed represents the first critical link in the food safety chain. The level of mycotoxin residues in edible tissues, eggs, milk, and other animal-derived products depends on the concentration of mycotoxins in feed, the species of the animal, duration of exposure, and pathways of metabolism and biotransformation [17].
AFB1 and its naturally occurring metabolites are classified as proven carcinogens for both animals and humans [7]. Therefore, the ALARA principle (As Low As Reasonably Achievable) is applied, and domestic legislation establishes maximal residue limits (MRLs) for both animal feed and edible tissues of poultry.
In our study, the content of AFB1 and AFM1 in the pectoral muscle and liver of the tested animals was determined using confirmatory LC-MS/MS methodology. This technique allows unequivocal confirmation of the presence or absence of AFB1 and its metabolites based on the molecular mass of the parent compound and its fragment ions.
On the 42nd day of the experiment, broilers in groups E-I, E-II, E-V, and E-VI—which received 0.2 mg AFB1, 0.2 mg AFB1 + 0.2% MS preparation, or 0.2 mg AFB1 + 1.5 mg OTA + 0.2% MS preparation, respectively—showed no detectable residues of AFB1 or AFM1. These results are partially consistent with the findings of [11], but contrast with those of [12], who used similar doses of mycotoxins and detoxifying preparations.
The absence of detectable AFB1 residues in groups E-I and E-V may have multiple explanations, including lower feed intake (and thus lower toxin intake), differences in AFB1 metabolism, and the rate of elimination from the organism. This is a very important finding from the perspective of food safety that points us to the positive influence of preparations for detoxification of mycotoxins on reducing the level of mycotoxin residues in foods of animal origin.
The concentration of OTA and its metabolites in animal tissues and plasma depends on the species, dose, and form of the toxin, feed composition, animal health status, and route of toxin entry. In general, OTA has a longer elimination half-life from blood than from tissues, due to its high plasma protein binding affinity [18,19,20]. Tissue distribution of OTA in pigs, rats, poultry, and goats generally follows the order: kidneys > liver > muscle > adipose tissue [21,22].
Observing the results, we can conclude that OTA residues of 3.140 mg/kg were detected in the pectoral muscle of broilers in group E-III. In group E-IV, which received OTA along with 0.2% of the MS preparation, a decrease in OTA residues by 48.73% was detected in the pectoralis muscles compared to broilers in group E-III.
In broilers of group E-V, which were fed a combination of AFB1 and OTA, OTA residues in the pectoral muscle were measured at 3.047 mg/kg. Broilers in group E-VI, which received both mycotoxins together with 0.2% of the MS preparation, exhibited a 40.04% lower concentration of OTA in the pectoral muscle compared to group E-V.
This significant reduction in OTA residues in the pectoral muscle of groups E-IV and E-VI can be attributed to the protective effect of the MS preparation. This is a highly relevant finding for food safety, as domestic regulations set the MRL for OTA in edible tissues of animal origin at 5 μg/kg. These results are consistent with the observations of other authors [17,23].
The concentration of OTA residues in the liver of group E-III broilers on the 42nd day, which were fed 1.5 mg OTA/kg of feed, amounted to 59.08 mg/kg. Broilers of group E-IV, receiving OTA along with 0.2% of the MS preparation, exhibited a 37.74% lower hepatic OTA concentration.
In broilers of group E-V, which received a combination of both toxins, OTA residues in the liver were measured at 45.33 mg/kg. Broilers in group E-VI, which received both toxins together in feed, with 0.2% of the MS preparation, showed a 39.56% reduction in hepatic OTA compared to group E-V.
The observed decrease in OTA concentration in the liver can be explained by the protective effect of the MS preparation, particularly due to its hepatoprotective component, silymarin.
In this study, a slightly higher OTA dose was intentionally applied, in line with the average contamination levels of corn with multiple mycotoxins. A study [6] that analyzed corn and feed for both humans and animals in Serbia reported that in 2022, 29.5% of corn samples were contaminated with OTA and 73.2% with AFB1.
A major concern is the co-contamination of corn samples, as a single sample can contain more than 10 different mycotoxins depending on temperature and humidity, which together may exceed 2 mg/kg. The cumulative effect of multiple mycotoxins can be highly detrimental to animal health. Accordingly, the choice of a detoxification preparation must be carefully tailored to the type of mycotoxin contamination.
5. Conclusions
AFB1 and OTA, both individually as well as in combination, exhibited negative effects on the production performance of broilers (BW, WG, feed intake, and FCR). On the other hand, groups of broilers that received feed supplemented with 0.2% of the MS detoxification preparation alongside the mycotoxins achieved significantly improved production results, even comparable to non-challenged animals. This indicates a complete restitution of body weight in this group, most likely due to the beneficial effect of the preparation, namely the modified bentonite component, which has a high affinity for adsorbing AFB1.
The best production performance (BW and WG) at the end of the trial was recorded in the MS group, which received a commercial diet supplemented with 0.2% MS preparation. This finding suggests that preparation can be safely used as a permitted growth promoter in broiler diets throughout all phases of fattening. Examination of HP changes in target organs revealed that the addition of 0.2% MS preparation significantly reduced the number of pathological lesions in the organs of broilers from these groups.
The groups of broilers that, along with OTA, either individually or in combination, received 0.2% of the MS preparation in their feed showed 48.73% and 40.04% lower OTA residue levels in the pectoral muscles compared to the broilers that received OTA alone or in combination. A similar finding was observed in the liver of broilers that received 0.2% MS along with OTA, either individually or in combination.
Summarizing all the obtained results, it can be concluded that the effect of the preparation in the case of AFB1 was very positive, while a somewhat weaker effect was observed in broilers that received OTA alone or in combination with AFB1 through their feed. Furthermore, the preparation had an excellent impact on the production performance of broilers that were fed toxin-free feed supplemented with 0.2% of the MS preparation.
Author Contributions
J.N.T.—idea and methodology, writing—original draft preparation (part animal performance and residues of AFB1 and ochratoxin toxin); B.P.—data collection and statistical analysis; S.T.—writing—review and editing; D.J.—chemical analysis; M.Đ.—investigation; D.S.—investigation; N.T.—investigation; D.M.—pathohistological analysis; S.R.—investigation, writing—original draft preparation. All authors have read and agreed to the published version of the manuscript.
Funding
The study was supported by the Ministry of Science, Technological Development and Innovation of the Republic of Serbia (Contract number 451-03-136/2025-03/200143).
Institutional Review Board Statement
The protocol and procedure used in this study were reviewed and approved by the Ethics Committee of the Ministry of Agriculture, Forestry and Water Management, the Veterinary Directorate, Republic of Serbia, Approval no. 003089502 2024, approved on 31 October 2024.
Informed Consent Statement
Not applicable.
Data Availability Statement
The original contributions presented in this study are included in the article. Further inquiries can be directed to the corresponding author.
Acknowledgments
We thank INBERG DOO Company Boljevci, Serbia, for their technical support in this study.
Conflicts of Interest
The authors declare no conflicts of interest.
References
- Bhat, R.; Rai, R.V.; Karim, A.A. Mycotoxins in Food and Feed: Present Status and Future Concerns. Compr. Rev. Food Sci. Food Saf. 2010, 9, 57–81. [Google Scholar] [CrossRef] [PubMed]
- Dey, D.K.; Kang, J.I.; Bajpai, V.K.; Kim, K.; Lee, H.; Sonwal, S.; Shukla, S. Mycotoxins in food and feed: Toxicity, preventive challenges, and advanced detection techniques for associated diseases. Crit. Rev. Food Sci. Nutr. 2023, 63, 8489–8510. [Google Scholar] [CrossRef] [PubMed]
- Abbas, H.; Wilkinson, J.; Zablotowicz, R.; Accinelli, C.; Abel, C.; Bruns, H.; Weaver, M. Ecology of Aspergillus flavus, regulation of aflatoxin production, and management strategies to reduce aflatoxin contamination of corn. Toxin Rev. 2009, 28, 142–153. [Google Scholar] [CrossRef]
- Widstrom, N.W. The Aflatoxin Problem with Corn Grain. Adv. Agron. 1996, 56, 219–279. [Google Scholar] [CrossRef]
- Guevara-Gonzalez, R.G.; Chapa-Oliver, A.M.; Mejía-Teniente, L.; Pacheco, I.T.; Vazquez-Cruz, M.A.; Cervantes-Landaverde, J.J.; Preciado Ortiz, R.E.; Moreno-Martinez, E. Genetic Resistance to Drought in Maize and Its Relationship in Aflatoxins Production. In Aflatoxins—Biochemistry and Molecular Biology; Guevara-Gonzalez, R.G., Ed.; InTech: London, UK, 2011; Available online: http://www.intechopen.com/books/aflatoxins-biochemistryand-molecular-biology/genetic-resistance-to-drought-in-maize-and-its-relationship-in-aflatoxins-production (accessed on 2 October 2025).
- Penagos-Tabares, F.; Todorov, A.; Raj, J.; Farkaš, H.; Grubješić, G.; Jakovčevič, Z.; Ćujić, S.; Nedeljković-Trailović, J.; Vasiljević, M. Multi-Mycotoxin Contamination in Serbian Maize During 2021–2023: Climatic Influences and Implications for Food and Feed Safety. Toxins 2025, 17, 227. [Google Scholar] [CrossRef] [PubMed]
- IARC. Traditional Herbal Medicines, Some Mycotoxins, Naphthalene and Styrene. In IARC Monographs on the Evaluation of Carcinogenic Risks to Humans; International Agency for Research on Cancer; Aflatoxins: Lyon, France, 2002; Volume 82, pp. 171–366. [Google Scholar]
- Więckowska, M.; Cichon, N.; Szelenberger, R.; Gorniak, L.; Bijak, M. Ochratoxin A and Its Role in Cancer Development: A Comprehensive Review. Cancers 2024, 16, 3473. [Google Scholar] [CrossRef] [PubMed]
- Ringot, D.; Chango, A.; Schneider, Y.J.; Larondelle, Y. Toxicokinetics and toxicodynamics of ochratoxin A, an update. Chem. Biol. Interact. 2006, 159, 18–46. [Google Scholar] [CrossRef] [PubMed]
- Aviagen Group. 2022. Available online: https://aviagen.com/assets/Tech_Center/Ross_Broiler/Ross-BroilerNutritionSpecifications2022-EN.pdf (accessed on 2 October 2025).
- Stefanović, D.; Marinković, D.; Trailović, S.; Vasiljević, M.; Farkaš, H.; Raj, J.; Tolimir, N.; Radulović, S.; Nešić, V.; Trailović, J.N. Evaluation of Effectiveness of a Novel Multicomponent Mycotoxins Detoxification Agent in the Presence of AFB1 and T-2 Toxin on Broiler Chicks. Microorganisms 2023, 11, 574. [Google Scholar] [CrossRef] [PubMed]
- Tsiouris, V.; Tassis, P.; Raj, J.; Mantzios, T.; Kiskinis, K.; Vasiljević, M.; Delić, N.; Petridou, E.; Brellou, G.D.; Polizopoulou, Z. Investigation of a Novel Multicomponent Mycotoxin Detoxifying Agent in Amelioration of Mycotoxicosis Induced by Aflatoxin-B1 and Ochratoxin A in Broiler Chicks. Toxins 2021, 13, 367. [Google Scholar] [CrossRef] [PubMed]
- Nedeljković-Trailović, J.; Trailović, S.; Resanović, R.; Milićević, D.; Jovanovic, M.; Vasiljevic, M. Comparative Investigation of the Efficacy of Three Different Adsorbents against OTA-Induced Toxicity in Broiler Chickens. Toxins 2015, 7, 1174–1191. [Google Scholar] [CrossRef] [PubMed]
- Vasiljević, M.; Marinković, D.; Milicević, D.; Pleadin, J.; Stefanović, S.; Trailović, S.; Raj, J.; Petrujkić, B.; Trailović, J.N. Efficacy of a Modified Clinoptilolite Based Adsorbent in Reducing Detrimental Effects of Ochratoxin A in Laying Hens. Toxins 2021, 13, 469. [Google Scholar] [CrossRef] [PubMed]
- Bhatti, S.A.; Khan, M.Z.; Saleemi, M.K.; Saqib, M. Aflatoxicosis and ochratoxicosis in broiler chicks and their amelioration with locally available bentonite clay. Pak. Vet. J. 2016, 36, 68–72. [Google Scholar]
- Alharthi, A.S.; Al Sulaiman, A.R.; Aljumaah, R.S.; Alabdullatif, A.A.; Ferronato, G.; Alqhtani, A.H.; Abudabos, A.M. The efficacy of bentonite and zeolite in reducing aflatoxin B1 toxicity on production performance and intestinal and hepatic health of broiler chickens. Ital. J. Anim. Sci. 2022, 21, 1181–1189. [Google Scholar] [CrossRef]
- Alshannaq, A.; Yu, J.H. Occurrence, Toxicity, and Analysis of Major Mycotoxins in Food. Int. J. Environ. Res. Public Health 2017, 14, 632. [Google Scholar] [CrossRef] [PubMed]
- Hagelberg, S.; Hult, K.; Fuchs, R. Toxicokinetics of ochratoxin A in several species and its plasma-binding properties. J. Appl. Toxicol. 1989, 9, 91–96. [Google Scholar] [CrossRef] [PubMed]
- Studer-Rohr, I.; Schlatter, J.; Dietrich, D.R. Kinetic parameters and intraindividual fluctuations of ochratoxin A plasma levels in humans. Arch. Toxicol. 2000, 74, 499–510. [Google Scholar] [CrossRef] [PubMed]
- Li, S.; Marquardt, R.R.; Frohlich, A.A.; Vitti, T.G.; Crow, G. Pharmacokinetics of Ochratoxin A and Its Metabolites in Rats. Toxicol. Appl. Pharmacol. 1997, 145, 82–90. [Google Scholar] [CrossRef] [PubMed]
- Harwig, J.; Kuiper-Goodman, T.; Scott, P.M. Microbial Food Toxicants: Ochratoxins. In CRC Handbook of Foodborne Diseases of Biological Origin, 1st ed.; Rechcigl, M., Jr., Ed.; CRC Press: Boca Raton, FL, USA, 1983; pp. 189–235. [Google Scholar] [CrossRef]
- Ferrufino-Guardia, E.V.; Tangni, E.K.; Larondelle, Y.; Ponchaut, S. Transfer of ochratoxin A during lactation: Exposure of suckling via the milk of rabbit does fed a naturally-contaminated feed. Food Addit. Contam. 2000, 17, 167–175. [Google Scholar] [CrossRef] [PubMed]
- Nedeljković-Trailović, J.; Stefanović, S.; Trailović, S. In vitro investigation three different adsorbents against ochratoxin A in broilers. Br. Poult. Sci. 2013, 54, 515–523. [Google Scholar] [CrossRef] [PubMed]
Disclaimer/Publisher’s Note: The statements, opinions and data contained in all publications are solely those of the individual author(s) and contributor(s) and not of MDPI and/or the editor(s). MDPI and/or the editor(s) disclaim responsibility for any injury to people or property resulting from any ideas, methods, instructions or products referred to in the content. |
© 2026 by the authors. Licensee MDPI, Basel, Switzerland. This article is an open access article distributed under the terms and conditions of the Creative Commons Attribution (CC BY) license.