Abstract
Male turkeys are raised mainly for meat production due to their high carcass yields and good capacity to convert food into meat. However, their carcass characteristics remain poorly understood. The objective of the study was to describe the carcass traits of 45 male native Mexican turkeys raised in the municipality of Champoton, Mexico, using principal component analysis (PCA). Fourteen carcass traits, namely, slaughter weight (SW), hot carcass weight (HCW), cold carcass weight (CCW), dressing percentage (DP), neck weight (NEW), foot weight (FEW), breast weight (BRW), thigh weight (THW), drumstick weight (DRW), wing weight (WIW), back weight (BAW), gizzard weight (GIW), heart weight (HEW), and liver weight (LIW), were collected. Pearson’s correlation analysis revealed strong positive relationships among carcass variables, with the highest correlations observed between CCW and HCW (r = 0.99; p < 0.001), SW and HCW (r = 0.98; p < 0.001), and SW and CCW (r = 0.98; p < 0.001). Hierarchical clustering identified four main groups of variables with similar correlation patterns. Three principal components (PCs) with eigenvalues greater than 1.0 were extracted, explaining 85.48% of the total variance in carcass traits. The first principal component (PC1) contributed 72.81% of the total variation (eigenvalue = 10.19), with high loadings (>0.70) for CCW (0.98), HCW (0.98), SW (0.98), DRW (0.95), BRW (0.91), WIW (0.90), THW (0.89), HEW (0.87), BAW (0.81), and FEW (0.82), representing a general size factor. PC2 explained 6.86% of the variance (eigenvalue = 0.96), characterized by a negative loading for DP (−0.64) and positive loadings for GIW (0.35) and LIW (0.34). PC3 accounted for 5.81% of the variance (eigenvalue = 0.81), with a negative loading for LIW (−0.63) and positive loadings for NEW (0.51) and FEW (0.46). Communality values exceeded 0.85 for all variables, indicating adequate representation in the reduced dimensional space. It was concluded that PCA effectively reduced dimensionality while retaining 85.48% of original information and can be used for the improvement of the carcass traits of male native Mexican turkey breeding programs.
1. Introduction
The turkey (Meleagris g. gallopavo), known in Central America as “Guajolote,” is a native poultry species originally domesticated in Mexico, from where it was exported to the rest of the world, becoming the genetic base of the breeds of turkeys that are known today [1]. Currently, after chickens, the native turkey is the second most abundant poultry species among backyard poultry in Mexico [2].
In commercial and smallholder production systems, male birds of this species are primarily maintained for meat yield objectives, given their superior feed-to-meat conversion efficiency and pronounced carcass development. The economic viability of raising this poultry species relies substantially on this productive attribute. Conversely, female cohorts retain reproductive functions, typically serving breeding or egg incubation purposes within traditional management schemes [1]. In most regions of Central America, the consumption of native turkey meat is high because it is considered a special ingredient in typical traditional dishes, especially at Christmas, New Year’s celebrations, and social–religious festivities. In addition, it is considered a low-fat and highly nutritious meat and therefore a healthy product [3,4]. However, the carcass traits of this poultry genotype have not been thoroughly evaluated.
Principal component analysis (PCA) constitutes a multivariate data reduction technique analogous to exploratory factor analysis. It is designed to compress high-dimensional datasets into fewer synthetic dimensions while preserving interpretable structure and minimizing information deterioration [5,6,7]. This analytical approach generates novel uncorrelated composite variables ordered by their successive variance contributions. Principal components (PCs) simultaneously consider a group of attributes that may be interesting for selection purposes. This analysis can be used in the selection index to simplify the components, because such an index would have few principal components in the place of all the original traits [8]. PCA has been used successfully as a tool for evaluating the body sizes and shapes as well as growth performance of farm animals [7,8,9,10,11]. Pinto et al. [12] used PCA to analyze the performance and carcass traits of chickens, evidencing that the principal component methodology was efficient in evaluating the total variance in the group of studied traits, allowing a drastic reduction in the number of traits to be included in the selection index for breeding purposes.
In this sense, the objective of this study was to describe the carcass traits of male native Mexican turkeys using principal component analysis to reduce the number of traits and understand their relationship for selection and breeding purposes.
2. Materials and Methods
The experimental protocol was approved by the Animal Welfare Committee of the Colegio de Postgraduados, and they complied with the standards for the care and use of animals used for research (Approval folio: COBIAN 002/21).
2.1. Study Population
The study birds were procured from commercial smallholder producers engaging in traditional poultry-farming operations within Champotón municipality, Campeche state (geographic coordinates: 19°21′ N, 90°43′ E; elevation: 10 m.a.s.l.). A total of 45 male native turkey specimens (32–40 weeks of age) were purchased for research purposes. Prior to acquisition, all birds were reared under semi-extensive management systems at their source farms, characterized by comparable housing infrastructure, environmental conditions, and consistent feeding regimens based on raw or nixtamalized corn grain complemented by natural pasture grazing. At the time of purchase, birds were in normal market-ready condition and showed no signs of disease or injury. Following purchase, animals were transported to the research facilities, where they were maintained under identical pre-slaughter conditions for standardization purposes before assessment [13], ensuring dietary consistency throughout the experimental period.
2.2. Slaughtering and Carcass Processing
Pre-slaughter protocol included a 10 h fasting regimen with unrestricted access to drinking water. Live weight documentation was conducted immediately preceding humane euthanasia via exsanguination. All procedures adhered to Mexican Official Norms (NOM-008-ZOO-1994; NOM-009-ZOO-1994; NOM-033-ZOO-1995) establishing ethical requirements for animal slaughter in meat production systems.
2.3. Variables Evaluated
Post-sacrifice processing incorporated thermal treatment via immersion in heated water (60–65 °C, 2 min duration) to facilitate manual feather removal. Following evisceration, warm carcass mass was immediately registered (designated as HCW—hot carcass weight). Chilled carcass measurements (CCW—cold carcass weight) were subsequently obtained after overnight refrigeration of the carcasses at a controlled temperature (4 °C, 24 h period). Dressing percentage (DP) was derived as the proportional contribution of CCW to initial slaughter weight. Carcass separation was conducted according to standardized dissection methodology [14], generating five anatomical sections: pectoral (breast), femoral (thigh), leg (drumstick), wing, and dorsal (back) regions. Complementary measurements encompassed cervical (neck) region, pedal (feet) structures, and visceral organs designated for human consumption (gizzard, myocardium, and hepatic tissue). All mass determinations were made using calibrated electronic instrumentation.
2.4. Statistical Analysis
Preliminary exploratory analysis generated fundamental statistical summaries encompassing measures of central tendency, dispersion indicators, range extremes, and relative variability quantification (coefficient of variation) for each quantitative characteristic. In the normality assessment for continuous variables, we incorporated the Shapiro–Wilk test procedure. All computational processing was conducted in the R statistical environment (version 4.3.0) [15].
2.4.1. Correlation Analysis
Pearson correlation analysis was performed to assess the linear relationships among all quantitative variables in the study. The statistical significance of correlations was determined through two-tailed hypothesis tests, establishing significance levels of p < 0.05 (*), p < 0.01 (**), and p < 0.001 (***). Correlations that did not reach statistical significance (p ≥ 0.05) were identified as “ns” (non-significant).
To visualize the structure of relationships among variables, a heatmap of the correlation matrix was constructed, where color intensity represents the magnitude and direction of correlations. Hierarchical cluster analysis was applied using the complete linkage method in a distance matrix calculated as 1 − |r|, where r represents the Pearson correlation coefficient. This procedure allowed identification of groups of variables with similar correlation patterns, which were represented by dendrograms on both axes of the heatmap. The dendrogram structure was cut into three main groups based on linkage height, allowing identification of variable sets that exhibit highly correlated behaviors.
2.4.2. Principal Component Analysis
To determine the underlying structure of carcass morphometric variables, a principal component analysis (PCA) was performed. Prior to analysis, all variables were standardized (mean = 0, and standard deviation = 1) due to differences in measurement scales among the evaluated characteristics.
The extraction of principal components was performed through decomposition of the correlation matrix, calculating eigenvalues and eigenvectors. Kaiser’s criterion was applied to retain components with eigenvalues greater than 1.0, and this was complemented by analysis of the scree plot to identify the inflection point where explained variance stabilized. Additionally, we considered the cumulative variance criterion, seeking to explain at least 75% of the total variance.
The interpretation of components was based on the factor loadings of each variable, considering absolute values greater than 0.40 to be significant contributions. Variables with loadings greater than 0.70 were identified as highly representative of the corresponding component. The quality of representation of each variable was assessed through cos2 values (squared cosines), where values greater than 0.50 indicated adequate representation in the reduced principal component space.
Visualization of results was performed through biplots, which allowed simultaneous interpretation of relationships among variables and the distribution of individuals in the two-dimensional space defined by the first principal components. This multivariate approach facilitated identification of covariation patterns among carcass characteristics and dataset dimensionality reduction while maintaining the maximum amount of original information.
3. Results
3.1. Descriptive Analysis
Table 1 presents the descriptive statistics (mean, standard deviation, minimum, maximum, and coefficient of variation) for the slaughter weight and carcass traits of 45 male native Mexican turkeys. The mean slaughter weight (SW) was 4756.27 ± 797.43 g, with values ranging from 3465.00 to 6945.00 g. Hot carcass weight (HCW) and cold carcass weight (CCW) averaged 2959.88 ± 640.28 g and 2928.37 ± 636.92 g, respectively, showing the minimal differences between them. The dressing percentage (DP) exhibited a mean value of 61.78 ± 3.43%, ranging from 55.60% to 68.91%.

Table 1.
Descriptive statistics for slaughter weight and carcass traits of male native Mexican turkeys (n = 45).
Among the carcass cuts, breast weight (BRW) showed the highest mean value (949.41 ± 302.18 g), followed by thigh weight (THW), with 517.55 ± 92.95 g, and drumstick weight (DRW), with 476.04 ± 71.46 g. Back weight (BAW) averaged 442.55 ± 208.48 g, while wing weight (WIW) and neck weight (NEW) presented mean values of 385.23 ± 43.88 g and 280.11 ± 82.89 g, respectively. Foot weight (FEW) showed the lowest variability among external parts, with a mean of 159.99 ± 15.00 g.
Regarding visceral organs, gizzard weight (GIW), liver weight (LIW), and heart weight (HEW) averaged 98.55 ± 17.78 g, 74.61 ± 13.32 g, and 20.85 ± 4.49 g, respectively. The coefficient of variation (CV) of carcass traits varied considerably, from low values (CV < 10%) for DP (5.56%) and FEW (9.37%) to moderate values (CV 10–20%) for THW (17.96%), DRW (15.01%), WIW (11.39%), GIW (18.04%), HEW (21.57%), and LIW (17.86%) and high values (CV > 20%) for SW (16.76%), HCW (21.63%), CCW (21.75%), NEW (29.59%), BRW (31.82%), and particularly BAW (47.10%).
3.2. Analysis Correlation
The correlation matrix presented in Figure 1 shows the relationships among 14 carcass variables evaluated in native Mexican turkeys. Of the total 91 correlations analyzed, 89 were statistically significant (p < 0.05), representing 97.8% of the total. The hierarchical clustering analysis identified four main groups of variables with similar correlation patterns.
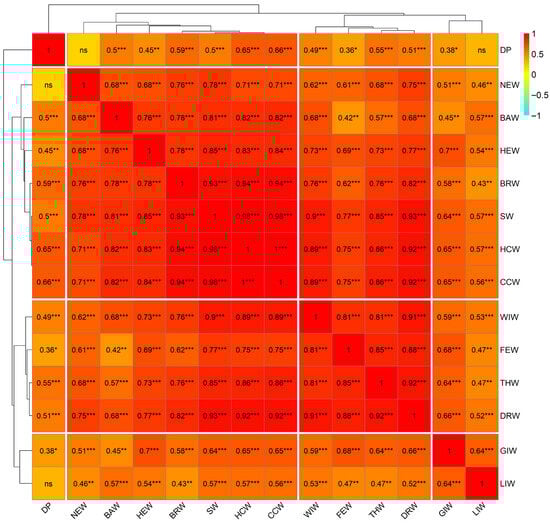
Figure 1.
Pearson’s correlations (r) between carcass traits of male native Mexican turkeys. Significance levels: * p < 0.05; ** p < 0.01; *** p < 0.001; ns = non-significant (p ≥ 0.05).
The first group included variables related to body and carcass weight (SW, HCW, CCW, BRW, THW, DRW, and WIW), which exhibited strong positive correlations with each other, highlighting the relationship between CCW and HCW (r = 0.99, p < 0.001) as well as between SW and HCW (r = 0.98, p < 0.001) and CCW (r = 0.98, p < 0.001). This group also showed highly significant correlations between BRW and SW (r = 0.93, p < 0.001), HCW (r = 0.94, p < 0.001), and CCW (r = 0.94, p < 0.001), indicating that breast weight is closely related to slaughter weight and carcass weight. The second group consisted of BAW, HEW, and NEW, which showed moderate to strong correlations with variables in the first group, particularly HEW and SW (r = 0.85, p < 0.001), HCW (r = 0.83, p < 0.001), and CCW (r = 0.84, p < 0.001). The third group included FEW, which showed strong correlations with DRW (r = 0.88, p < 0.001) and THW (r = 0.85, p < 0.001). The fourth group consisted of the internal organ variables GIW and LIW, which exhibited moderate correlations with each other (r = 0.64, p < 0.001) and with other carcass variables. Notably, DP separated as a variable with a lower degree of association with the rest, showing non-significant correlations with NEW (r = 0.17, p > 0.05) and LIW (r = 0.29, p > 0.05). The dendrogram structure revealed that the variables with the greatest similarity in their correlation patterns were those directly related to body size and muscle development, while internal organ variables and dressing percentage showed greater independence in their behavior.
3.3. Principal Components
Principal component analysis revealed that the first three components explained 85.48% of the total variance in the evaluated carcass traits, representing a satisfactory dimensional reduction for the original set of 14 variables (Table 2). The first principal component (PC1) presented an eigenvalue of 10.19 and explained 72.81% of the variance, indicating a strong general size effect in the analyzed variables, a pattern consistent with previous morphometric studies on poultry. All morphometric variables showed positive factor loadings greater than 0.59 in PC1, with the highest values found for cold carcass weight (0.98), hot carcass weight (0.98), and slaughter weight (0.98), followed by drumstick weight (0.95), breast weight (0.91), and wing weight (0.90), while the most moderate loadings corresponded to gizzard weight (0.73) and dressing percentage (0.59). This configuration suggests that PC1 represents an allometric size factor where overall body growth proportionally determines the development of all the anatomical structures evaluated.
Table 2.
Components, eigenvalues, percentages of variance, and factor loadings after varimax rotation and communalities were applied.
The second component (PC2) explained only 6.86% of the variance, with an eigenvalue of 0.96, characterized mainly by the negative loading for dressing percentage (−0.64) and moderate positive loadings for liver weight (0.34) and gizzard weight (0.35). This factorial structure indicates that PC2 captures variation in the efficiency of live-weight-to-carcass-weight conversion, representing a contrast between individuals with high yield but lower visceral development and those with greater internal organ mass and lower relative yield. The third component (PC3) contributed 5.81% of the variance (eigenvalue = 0.81), distinguished by the negative loading for liver weight (−0.63) and the positive loadings for neck weight (0.51) and foot weight (0.46). Communality values were higher than 0.85 for all variables, with particularly high values for cold carcass weight (0.991), hot carcass weight (0.988), and slaughter weight (0.978), indicating that the variability in carcass traits was adequately represented by the three retained components.
The biplot of PC1 versus PC2 shows the spatial distribution of variables and individuals in the plane defined by the two most important dimensions, which together explained 79.67% of the total variance (Figure 2).
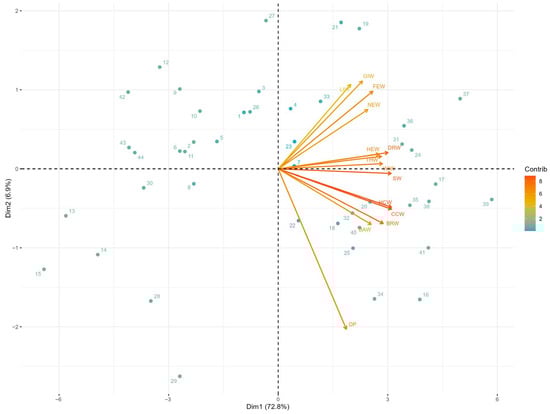
Figure 2.
Biplot the principal component analysis of carcass traits in Mexican turkeys (Meleagris gallopavo): Dimensions 1 vs 2.
The vectors corresponding to body weights and main carcass parts (breasts, thighs, drumsticks, wings, and backs) projected in the same direction on the horizontal axis (PC1), confirming their high positive correlation and contribution to the general size factor. In contrast, the dressing percentage vector projected in the opposite direction on the vertical axis (PC2), evidencing that this variable captures variation independent of absolute body size. The dispersion of individuals along the PC1 axis reflected the variability in the overall sizes of the carcasses, while their distribution on PC2 indicated differences in carcass yield efficiency among individuals of similar sizes. The biplot of PC1 versus PC3 represented 78.62% of the cumulative variance and allowed visualization of an additional contrast in body composition (Figure 3). In this plane, variables associated with internal organs (the liver and gizzard) showed vectors with negative loadings on PC3, while variables related to skeletal parts (the neck and feet) presented positive loadings. This configuration revealed that PC3 captures variation in the relative proportions between visceral mass and musculoskeletal structures, independent of the total body size represented by PC1. The distribution of individuals in this two-dimensional space evidenced heterogeneity in body development patterns, identifying carcasses with a greater proportion of viscera versus those with greater development of structural components.
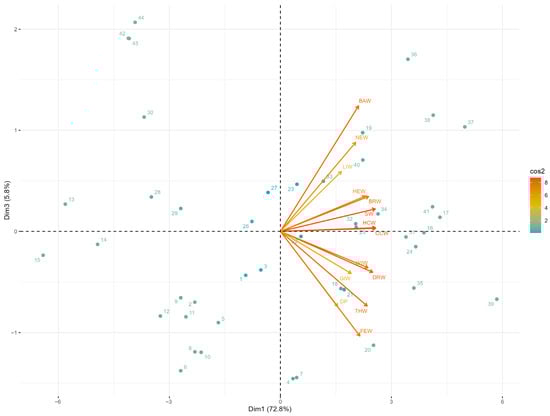
Figure 3.
Biplot the principals component analysis of carcass traits in Mexican turkeys (Meleagris gallopavo): Dimensions 1 vs 3.
4. Discussion
The substantial variability observed in most carcass traits, particularly in HCW, CCW, NEW, BRW, and BAW, could be attributed to the fact that native Mexican turkeys have not been subjected to systematic selection and genetic improvement programs. Consequently, these populations maintain high phenotypic diversity and morphological heterogeneity. These results have important practical implications for genetic improvement programs for native Mexican turkeys, as the high positive correlations between SW and the main carcass variables (HCW, CCW, and BRW) suggest that selection for live weight could simultaneously improve carcass weight and the weight of high-value commercial cuts such as breast. The strong association between BRW and carcass weights indicates that increased breast weight, a commercially important trait, could be achievable through indirect selection via slaughter weight. The grouping of variables into differentiated clusters allows identification of sets of traits that can be considered in an integrated manner in selection indices, reducing the number of variables to be recorded without compromising relevant information on productive performance. Furthermore, the relative independence of dressing percentage (DP) from other variables suggests that this trait should be considered as an independent selection criterion if improving efficiency in converting live weight to carcass weight is desired, as its improvement will not necessarily occur as a correlated response to selection for body weight.
According to Ifeanyichukwu, [16], a loading is the correlation between the original variables and the factors; therefore, the higher the factor loadings, the better the degree to which the variables are characterized by the factors. In their study, Pinto et al. [12] selected five principal components that explained about 93.3% of the total variation in carcass traits of chickens; the first component was called “General weight” because it explained 66% of the total variance, and the eigenvectors were associated with body weight and liver, breast, wing, and thigh weights. Likewise, for the second, third, fourth, and fifth principal components, the largest correlations were observed with respect to gizzard, weight gain, lung, and heart weights; these explained about 7.56%, 6.97%, 6.6%, and 6.18% of the total variance, respectively.
Principal component analysis enabled the identification of general body size as the primary explanatory factor for variation in the carcass characteristics of native Mexican turkeys, a finding consistent with the use of this multivariate technique as a tool for dimensional reduction and feature extraction in avian carcass quality studies [17,18]. The factorial structure obtained, where the first component simultaneously integrates slaughter weight, carcass weights, and breast weight, agrees with previous reports wherein these traits have been identified as main explainers of variability among turkey genotypes [17,19], suggesting that selection for live weight could generate favorable correlated responses in carcass yield and high-value commercial cuts. This strategy acquires particular relevance considering that previous studies have demonstrated the feasibility of predicting carcass characteristics through equations based on body measurements [20], facilitating productive evaluation without the need for slaughter.
The correlation structure observed among carcass characteristics evidences a highly integrated covariation pattern, similar to that reported in discriminant analyses where slaughter weight and carcass weight showed strong positive associations [19]. Breast weight emerged as a key variable within the general size component, an aspect that coincides with its recognition as the commercially most important component of the carcass. The high proportion of lean meat in breasts, thighs, and drumsticks reported in native turkeys [21] supports the commercial potential of these local populations, although they require targeted improvement strategies to optimize high-value cut yields without compromising quality characteristics. The hierarchical grouping of variables with similar correlation patterns suggests that specific sets of traits can be considered in an integrated manner in selection indices, a strategy that would allow reducing the number of variables to be recorded without significant loss of relevant genetic information.
Secondary components captured variation associated with live-weight-to-carcass-weight conversion efficiency and proportions between visceral mass and musculoskeletal structures, aspects that reflect differences in body composition independent of general size. The influence of slaughter age and gender on carcass yield and composition has been documented, highlighting that older males present superior carcass weights and meat quality [22]. Morphometric traits, recognized as useful tools for quantifying body size and shape [23,24], showed patterns evidencing the sexual dimorphism characteristic of the species, a phenomenon that must be considered in the design of sex-differentiated improvement programs to maximize selection responses.
The considerable phenotypic variability observed contrasts markedly with highly selected commercial populations, and it can be attributed to the absence of systematic genetic improvement programs for native Mexican turkeys. This interpretation finds support in genomic studies that evidence differentiation between Mexican turkeys and commercial hybrid strains, with native populations showing adaptive selection for their original environment, while commercial ones exhibit strong directional selection [25]. The variability in genotypes and plumage observed in Mexican domestic turkeys, influenced by climate, domestication methods, and cultural factors [26], represents simultaneously a methodological challenge and a genetic opportunity, as it indicates the presence of exploitable additive variation for artificial selection directed toward specific productive objectives.
The considerable genetic variability observed within the native Mexican turkey population constitutes the foundation for implementing intrapopulation genetic improvement programs that preserve local adaptive characteristics while optimizing productive traits. Feed efficiency, evaluated through feed conversion ratios, has shown to be an effective selection criterion for simultaneously improving growth and carcass characteristics in native turkeys [27], suggesting that incorporating this trait in selection indices would allow genetic progress without compromising the integrity of the native genetic resource. Contemporary data mining and multivariate analysis techniques have enabled the identification of specific sets of quality traits relevant for characterization [28], while genomic approaches through association studies have begun to identify chromosomal regions and candidate genes associated with carcass traits [29,30], tools that could be applied in intrapopulation improvement programs through marker-assisted selection, thereby maintaining the genetic purity of native Mexican populations.
Native turkeys constitute a highly adaptive and nutritional avian genetic resource native to Mexico [31], whose unique anatomical, physiological, and reproductive characteristics represent opportunities to develop integrated feeding and reproduction strategies that improve production while preserving genetic diversity [23]. Correlations between technological and nutritional meat quality traits [32] suggest that genetic improvement could be oriented toward multiple objectives that integrate productivity, quality, and sustainability. Complementary research conducted on the same native Mexican turkey population developed predictive equations based on 10 in vivo morphometric traits applied to 244 birds, utilizing CART analysis to predict body weight through easily measurable field morphological indices (the body condition index, the massiveness index, thoracic perimeter, and body height) [33]. This study characterized 14 post-mortem carcass traits in 45 of these individuals via PCA. The application of principal component analysis has demonstrated effectiveness in reducing the dimensionality of complex variable sets while maintaining biologically relevant information, facilitating the design of genetic improvement programs and conservation strategies for native avian genetic resources that balance productive efficiency with preservation of local adaptability. The explicit integration of field in vivo measurements with post-mortem carcass traits would constitute a priority future direction, enabling development of predictive equations linking pre-slaughter selection with carcass performance.
5. Conclusions
Principal component analysis effectively identified key carcass traits in male native Mexican turkeys, with breast weight, hot carcass weight, slaughter weight, and dressing percentage contributing significantly to phenotypic variation. The results suggest that PCA could be used in breeding programs, where it would allow a severe reduction in the number of traits that need to be recorded to explain the carcass traits. These findings provide a foundation for the development of selection indices that can improve carcass performance in native-turkey-breeding programs. This study will assist turkey farmers in determining the source of shared variability to explain carcass traits. Future research should include genomic analysis to identify genetic markers associated with these traits, incorporate female birds for sex-specific comparisons, and evaluate multi-regional populations to validate these findings and enhance breeding program effectiveness.
Author Contributions
Conceptualization, F.A.C.V. and R.P.S.; methodology, J.B.O. and R.P.S.; software, F.A.C.V. and V.H.G.T.; validation, S.C.V., R.d.l.R.S., and D.A.D.C.; formal analysis, F.A.C.V. and V.H.G.T.; investigation, J.B.O., S.C.V., R.d.l.R.S., and D.A.D.C.; resources, J.B.O. and R.P.S.; data curation, F.A.C.V., S.C.V., and D.A.D.C.; writing—original draft preparation, F.A.C.V. and R.P.S.; writing—review and editing, F.A.C.V., V.H.G.T., and R.P.S.; visualization, F.A.C.V. and V.H.G.T.; supervision, R.P.S. and J.B.O.; project administration, R.P.S.; funding acquisition, R.P.S. All authors have read and agreed to the published version of the manuscript.
Funding
This research received no external funding.
Institutional Review Board Statement
The experimental protocol was approved by the Animal Welfare Committee of the Colegio de Postgraduados, and they complied with the standards for the care and use of animals used for research (Approval folio: COBIAN 002/21, approved on 12 July 2021).
Informed Consent Statement
Not applicable.
Data Availability Statement
All data generated or analyzed during this study are included in this published article.
Conflicts of Interest
The authors declare that they have no competing interests.
References
- Portillo-Salgado, R.; Herrera Haro, J.G.; Bautista-Ortega, J.; Chay-Canul, A.; Cigarroa Vázquez, F.A. Guajolote—A poultry genetic resource native to Mexico. Worlds Poult. Sci. J. 2022, 78, 467–482. [Google Scholar] [CrossRef]
- Romero-López, A.R. The backyard poultry farming in Mexico: History and current situation. Rev. Mex. Cienc. Pecu. 2021, 12, 217–237. [Google Scholar] [CrossRef]
- Cuca-García, J.M.; Gutiérrez-Arenas, D.A.; López-Pérez, E. Backyard poultry farming in Mexico: History and characterization. Agroproductividad 2015, 8, 30–36. [Google Scholar]
- Estévez-Moreno, L.X.; Miranda-de la Lama, G.C. Meat consumption and consumer attitudes in México: Can persistence lead to change? Meat Sci. 2022, 193, 108943. [Google Scholar] [CrossRef] [PubMed]
- Jolliffe, I.T.; Cadima, J. Principal component analysis: A review and recent developments. Philos. Trans. R. Soc. A 2016, 374, 20150202. [Google Scholar] [CrossRef]
- Abdallah, F.D.M. Evaluation of Carcass Characteristics of Japanese Quail Using Principal Component Analysis (PCA). Adv. Anim. Vet. Sci. 2022, 10, 771–778. [Google Scholar] [CrossRef]
- Tyasi, T.L.; Putra, W.P.B. Principal Component Analysis (PCA) in the Body Measurements of Nguni Cows. Pak. J. Zool. 2022, 54, 1–4. [Google Scholar] [CrossRef]
- Valsalan, J.; Sadan, T.; Venketachalapathy, T. Application of multivariate principal component analysis to identify the relation between body measurements and carcass traits in guinea fowl. Trop. Anim. Health Prod. 2020, 52, 2451–2460. [Google Scholar] [CrossRef]
- Yakubu, A.; Ari, M.M. Principal component and discriminant analyses of body weight and conformation traits of Shuwa and Uda sheep in Nigeria. J. Anim. Plant Sci. 2018, 28, 46–55. [Google Scholar]
- Kandoussi, A.; Petit, D.; Boujenane, I. Morphologic characterization of the Blanche de Montagne, an endemic sheep of the Atlas Mountains. Trop. Anim. Health Prod. 2021, 53, 154. [Google Scholar] [CrossRef]
- Zegeye, T.; Belay, G.; Hanotte, O. Multivariate characterization of indigenous cattle populations in East Shewa Zone of Oromia, Central Ethiopia. Trop. Anim. Health Prod. 2021, 53, 212. [Google Scholar] [CrossRef] [PubMed]
- Pinto, L.F.B.; Packer, I.U.; De Melo, C.M.R.; Ledur, M.C.; Coutinho, L.L. Principal components analysis applied to performance and carcass traits in the chicken. Anim. Res. 2006, 55, 419–425. [Google Scholar] [CrossRef]
- Portillo-Salgado, R.; Herrera-Haro, J.G.; Bautista-Ortega, J.; Ortega-Cerrilla, M.E.; Sánchez-Villarreal, A.; Bárcena-Gama, J.R. Descriptive analysis of the local practices for breeding and management of native turkey (Meleagris gallopavo L.) in Campeche, México. Agroproductividad 2018, 11, 88–94. [Google Scholar]
- Hahn, G.; Spindler, M. Method of dissection of turkey carcases. Worlds Poult. Sci. J. 2002, 58, 179–197. [Google Scholar] [CrossRef]
- R Core Team. R: A Language and Environment for Statistical Computing; R Foundation for Statistical Computing: Vienna, Austria, 2023; Available online: https://www.R-project.org/ (accessed on 15 August 2023).
- Ifeanyichukwu, U. Evaluation of body size and conformation traits of Nigerian indigenous chickens reared in an intensive system. Open J. Anim. Sci. 2012, 2, 41–44. [Google Scholar] [CrossRef]
- Salgado Pardo, J.I.; Navas González, F.J.; González Ariza, A.; León Jurado, J.M.; Galán Luque, I.; Delgado Bermejo, J.V.; Camacho Vallejo, M.E. Study of Meat and Carcass Quality-Related Traits in Turkey Populations through Discriminant Canonical Analysis. Foods 2023, 12, 3828. [Google Scholar] [CrossRef]
- González Ariza, A.; Navas González, F.J.; Arando Arbulu, A.; León Jurado, J.M.; Delgado Bermejo, J.V.; Camacho Vallejo, M.E. Variability of Meat and Carcass Quality from Worldwide Native Chicken Breeds. Foods 2022, 11, 1700. [Google Scholar] [CrossRef]
- Salgado Pardo, J.I.; González Ariza, A.; Navas González, F.J.; León Jurado, J.M.; Díaz Ruiz, E.; Delgado Bermejo, J.V.; Camacho Vallejo, M.E. Discriminant canonical analysis as a tool for genotype traceability testing based on turkey meat and carcass traits. Front. Vet. Sci. 2024, 11, 1326519. [Google Scholar] [CrossRef]
- Abdalla, E.; Wood, B.; Baes, C. Accuracy of breeding values for production traits in turkeys (Meleagris gallopavo) using recursive models with or without genomics. Genet. Sel. Evol. GSE 2021, 53, 16. [Google Scholar] [CrossRef]
- Czech, A.; Domaradzki, P.; Niedzielak, M.; Stadnik, J. Nutritional Value and Physicochemical Properties of Male and Female Broad-Breasted Bronze Turkey Muscle. Foods 2024, 13, 1369. [Google Scholar] [CrossRef] [PubMed]
- Popova, T.; Petkov, E.; Ignatova, M.; Vlahova-Vangelova, D.; Balev, D.; Dragoev, S.; Kolev, N.; Dimov, K. Meat Quality of Male Layer-Type Chickens Slaughtered at Different Ages. Agriculture 2023, 13, 624. [Google Scholar] [CrossRef]
- Dudusola, I.O.; Bashiru, H.A.; Awojimi, I. Morphometric traits of turkey (Meleagris gallopavo) as affected by genotype and sex. Nig. J. Anim. Prod. 2020, 47, 77–86. [Google Scholar] [CrossRef]
- López-Pérez, E.; Gallegos-Sánchez, J.; Pro-Martínez, A.; Cuca-García, J.M.; Calderón-Sánchez, F.; Herrera-Barragán, J.A. The native turkey (Meleagris gallopavo): Male morphophysiology. Agroproductividad 2021, 14, 89–96. [Google Scholar] [CrossRef]
- Strillacci, M.G.; Martínez-Velázquez, G. Hybrid Versus Autochthonous Turkey Populations: Homozygous Genomic Regions Occurrences Due to Artificial and Natural Selection. Animals 2020, 10, 1318. [Google Scholar] [CrossRef]
- Domínguez-May, A.V.; Gamba-Galeazzi, A.P.; Burgos-Jiménez, M.N.; Ramírez-Benitez, J.E.; Briceño-Narváez, L.C.; Carrillo-Landell, F.G. The Domestic Turkey (Meleagris gallopavo) in Mexico. Adv. Agric. Hortic. Entomol. 2021, 1, 1–4. [Google Scholar] [CrossRef]
- Pezeshkian, Z.; Mirhoseini, S.; Ghovvati, S.; Ebrahimie, E. Phenotypic evaluation of feed efficiency, growth and carcass traits in native turkeys. J. Cent. Eur. Agric. 2023, 24, 178–189. [Google Scholar] [CrossRef]
- Salgado Pardo, J.I.; Navas González, F.J.; González Ariza, A.; León Jurado, J.M.; Carolino, N.; Carolino, I.; Delgado Bermejo, J.V.; Camacho Vallejo, M.E. Data-Mining Methodology to Improve the Scientific Production Quality in Turkey Meat and Carcass Characterization Studies. Animals 2024, 14, 2107. [Google Scholar] [CrossRef]
- Zhu, X.; Cui, H.; Dong, N.; Liu, L. Estimation of genetic parameters and genome-wide association study for carcass traits in native chickens. Anim. Biosci. 2025, 38, 517–527. [Google Scholar] [CrossRef]
- Basha, H.A.; Abd El Naby, W.S.H.; Ibrahim, S.E.; Elnahas, A.F. Screening for SNPs in MSTN and IGF-2 genes and its Relationship with Body Weight and Carcass Traits in Black Bronze Turkey. Adv. Anim. Vet. Sci. 2022, 10, 1559–1566. [Google Scholar] [CrossRef]
- Cigarroa-Vázquez, F.A.; Granados-Rivera, L.D.; Portillo-Salgado, R.; Ventura-Ríos, J.; Esponda-Hernández, W.; Hernández-Marín, J.A.; Cruz-Tamayo, A.A.; Bautista-Martinez, Y. Fatty Acids Profile and Healthy Lipids Indices of Native Mexican Guajolote Meat Treated to Two Heat Treatments. Foods 2022, 11, 1509. [Google Scholar] [CrossRef] [PubMed]
- Vanderhout, R.; Leishman, E.; Abdalla, E.; Barbut, S.; Wood, B.; Baes, C. Genetic Parameters of White Striping and Meat Quality Traits Indicative of Pale, Soft, Exudative Meat in Turkeys (Meleagris gallopavo). Front. Genet. 2022, 13, 842584. [Google Scholar] [CrossRef] [PubMed]
- Portillo-Salgado, R.; Cigarroa-Vázquez, F.A.; Herrera-Haro, J.G.; Vázquez-Martínez, I. Prediction of body weight of native Mexican guajolotes through morphometric measurements. Inf. Técnica Económica Agrar. 2022, 116, 150–160. [Google Scholar] [CrossRef]
Disclaimer/Publisher’s Note: The statements, opinions and data contained in all publications are solely those of the individual author(s) and contributor(s) and not of MDPI and/or the editor(s). MDPI and/or the editor(s) disclaim responsibility for any injury to people or property resulting from any ideas, methods, instructions or products referred to in the content. |
© 2025 by the authors. Licensee MDPI, Basel, Switzerland. This article is an open access article distributed under the terms and conditions of the Creative Commons Attribution (CC BY) license.