Article

Assessment of the Suitability and Accuracy of Different Methods to Determine the Degree of Photodegradation of High- and Low-Density Polyethylene, Polypropylene, Polyvinyl Chloride, Nylon and Polystyrene Microplastics


by
María Pilar Yeste
1,*,
Saltanat Bergaliyeva
2,3,
Miguel Ángel Cauqui
1,
Miren P. Cajaraville
4 and
Marta Sendra
5
1
Department of Materials Science, Metallurgical Engineering and Inorganic Chemistry, Institute of Research on Electron Microscopy and Materials (IMEYMAT), Faculty of Sciences, University of Cadiz, 11510 Cadiz, Spain
2
Department of Physics and Technology, Al-Farabi Kazakh National University, 050040 Almaty, Kazakhstan
3
Department of Standardization, Certification and Metrology, Institute of Energy and Mechanical Engineering, Satbayev University, 22 Satbayev str., 050013 Almaty, Kazakhstan
4
Department of Zoology and Animal Cell Biology, Faculty of Science and Technology and Research Centre for Experimental Marine Biology and Biotechnology, Plentzia Marine Station PiE-UPV/EHU, University of the Basque Country (UPV/EHU), 48940 Leioa, Spain
5
Department of Genetic Toxicology and Cancer Biology, National Institute of Biology, Večna pot 121, 1000 Ljubljana, Slovenia
*
Author to whom correspondence should be addressed.
Microplastics 2026, 5(2), 62; https://doi.org/10.3390/microplastics5020062
Submission received: 27 November 2025 / Revised: 15 January 2026 / Accepted: 28 February 2026 / Published: 1 April 2026
(This article belongs to the Collection Feature Papers in Microplastics)

Abstract

In an accelerated aging experiment involving a wide range of cumulative UV-B radiant exposures (up to approximately 9.46 × 10³ J cm−2), the degradation state of microplastics was assessed using SEM, FTIR, Raman spectroscopy, and DSC, and correlated with the cumulative UV-B dose. Sunlight-induced photooxidation is a significant weathering mechanism for microplastics. In this study, high-density polyethylene (HDPE), low-density polyethylene (LDPE), polypropylene (PP), polyvinyl chloride (PVC), nylon, and polystyrene (PS) were exposed to UV-B radiation under controlled dry conditions at two irradiance levels (0.06 and 0.6 mW cm−2), covering cumulative UV-B radiant exposures of up to approximately 9.47 × 10³ J cm−2. Degradation was evaluated using SEM, FTIR, Raman spectroscopy, and DSC, and was related to the cumulative UV-B dose (H). The extent and progression of degradation varied significantly among the polymers. Overall, FTIR provided the most sensitive assessment of photooxidative surface changes for HDPE, LDPE, PP, and PS, Raman spectroscopy was most diagnostic for PVC (particularly for dechlorination-related changes), and DSC-derived crystallinity was most informative for nylon. These dose-resolved datasets establish a reproducible reference framework (“degradation library”) to facilitate the comparative assessment of the relative photooxidative aging stage of microplastics under comparable surface UV-driven conditions. Outdoor “sunlight-equivalent” times are reported solely as order-of-magnitude contextualization due to environmental variability.

Graphical Abstract

1. Introduction

Plastics constitute a category of materials that significantly contribute to contemporary society due to their exceptional properties, including moldability, chemical resistance, flexibility, low weight, and effective electrical and thermal insulation, as well as their cost-effectiveness. The most prevalent plastic polymers utilized in daily life include high-density polyethylene (HDPE), low-density polyethylene (LDPE), polypropylene (PP), polystyrene (PS), polyvinyl chloride (PVC), nylon, polyurethane (PU), and polyethylene terephthalate (PET) [1]. Their extensive application is evidenced by projections indicating that global production will reach 30,000 million tons by 2050 [2]. Nevertheless, it is estimated that 40% of these plastics will ultimately be deposited in landfills or discarded directly into the environment as litter [2,3,4].
Due to the hydrophobic nature and substantial molecular weight of the polymeric chains that comprise these materials, their degradation occurs at a notably slow pace. This degradation transpires through various mechanisms, including biodegradation, photodegradation, thermal degradation, and environmental erosion [5,6,7,8]. It is generally posited that exposure of plastic waste to sunlight initiates photochemical weathering [9,10]. Although the body of research on this subject has expanded considerably in recent years, the majority of studies have focused on relatively brief exposure durations, which may not be sufficient for a comprehensive investigation of this inherently slow kinetic process. For instance, Moezzi et al. [11] examined the degradation of Nylon 66 over a period of 20 h, while Wu et al. [12] investigated the photodegradation of polypropylene for 160 h.
Numerous researchers have utilized specific promoters, such as temperature, to accelerate the degradation effects of irradiation [13,14,15,16,17,18]. Notably, Gardette et al. [14] conducted an investigation into the photodegradation of PP over a duration of merely 10 h at 60 °C, successfully identifying alterations in the photocatalysts attributable to photodegradation. Other researchers have examined the influence of various promoters. For example, Daniloska et al. [17] explored the impact of bioactive compounds, specifically 2-aminopyridine and benzocaine, on the photodegradation of HDPE. Grigoriadou et al. [18] observed that certain nanomaterials, such as carbon nanotubes, whether pristine or containing SiO2, possess the capacity to expedite polymer degradation by acting as catalysts in HDPE photooxidation processes. However, despite the successful acceleration of degradation and the consequent reduction in time due to these promoters, such conditions are not typically encountered in natural environments, even though nanomaterials may coexist with plastics in future scenarios. Therefore, it is imperative to conduct appropriate studies to ascertain the actual degradation of plastic polymers under prolonged UV radiation in the absence of any artificial promoters.
The investigation of plastic photodegradation processes offers the potential to ascertain the duration of exposure of specific polymer waste to sunlight-induced degradation. While the characteristics such as shape, color, and size of microplastics and nanoplastics subjected to various environmental factors have been examined in contexts such as water, air, sediments, and biological tissues [19], it is noteworthy that, to the best of our knowledge, the literature does not yet provide a definitive technique for determining the precise duration that specific plastic items have been subjected to environmental weathering.
In this study, we investigated the degradation of microplastics (MPs) under UV-B radiation over a six-month period. The research focused on commonly utilized polymer types, including HDPE, LDPE, PP, PVC, nylon, and PS. The extent of degradation was evaluated using various techniques: Scanning Electron Microscopy (SEM), Fourier Transform Infrared Spectroscopy (FTIR), Raman Spectroscopy, and Differential Scanning Calorimetry (DSC). The study aimed to achieve two objectives: firstly, to compare the degradation duration of these prevalent polymer types over an extended period; secondly, to identify the most effective method for determining the degradation changes occurring in each polymer type tested. The data obtained from this study facilitated the creation of a library that could potentially determine the duration of environmental plastic exposure to sunlight-induced degradation. In this study, we developed a dose-resolved reference framework (“degradation library”) for six common polymers exposed to controlled UV-B irradiation. The library comprises (i) FTIR and Raman spectra acquired at defined cumulative UV-B doses (H), (ii) SEM-based morphological documentation of surface damage, and (iii) degradation trajectories (e.g., oxidation metrics vs. H) that relate analytical markers to aging progression. This resource is intended to support the comparative assessment of the relative photooxidative aging stage of unknown particles under comparable surface UV-driven conditions.

2. Materials and Methods

2.1. Materials and Sample Preparation

HDPE, LDPE, PP, PVC, nylon, and PS sheets, each with a thickness of 2 mm, were procured from Sigma-Aldrich and subsequently cut into disks with a diameter of 5 mm. The use of disks was intended to standardize geometry, ensuring consistent diameter and thickness, thereby minimizing variability in surface area and diffusion length scales across the different polymers. This approach facilitated a reproducible comparison of degradation markers along the UV-B dose series. The design aimed to produce a controlled reference dataset rather than replicate the full morphological diversity of environmental microplastics. According to the supplier’s documentation, the polymer sheets were provided as unfilled and without the addition of UV stabilizers.
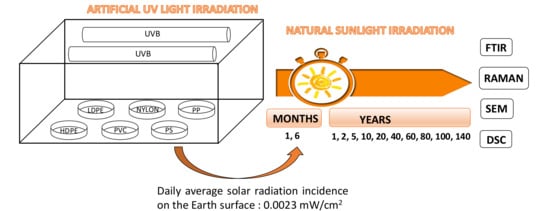
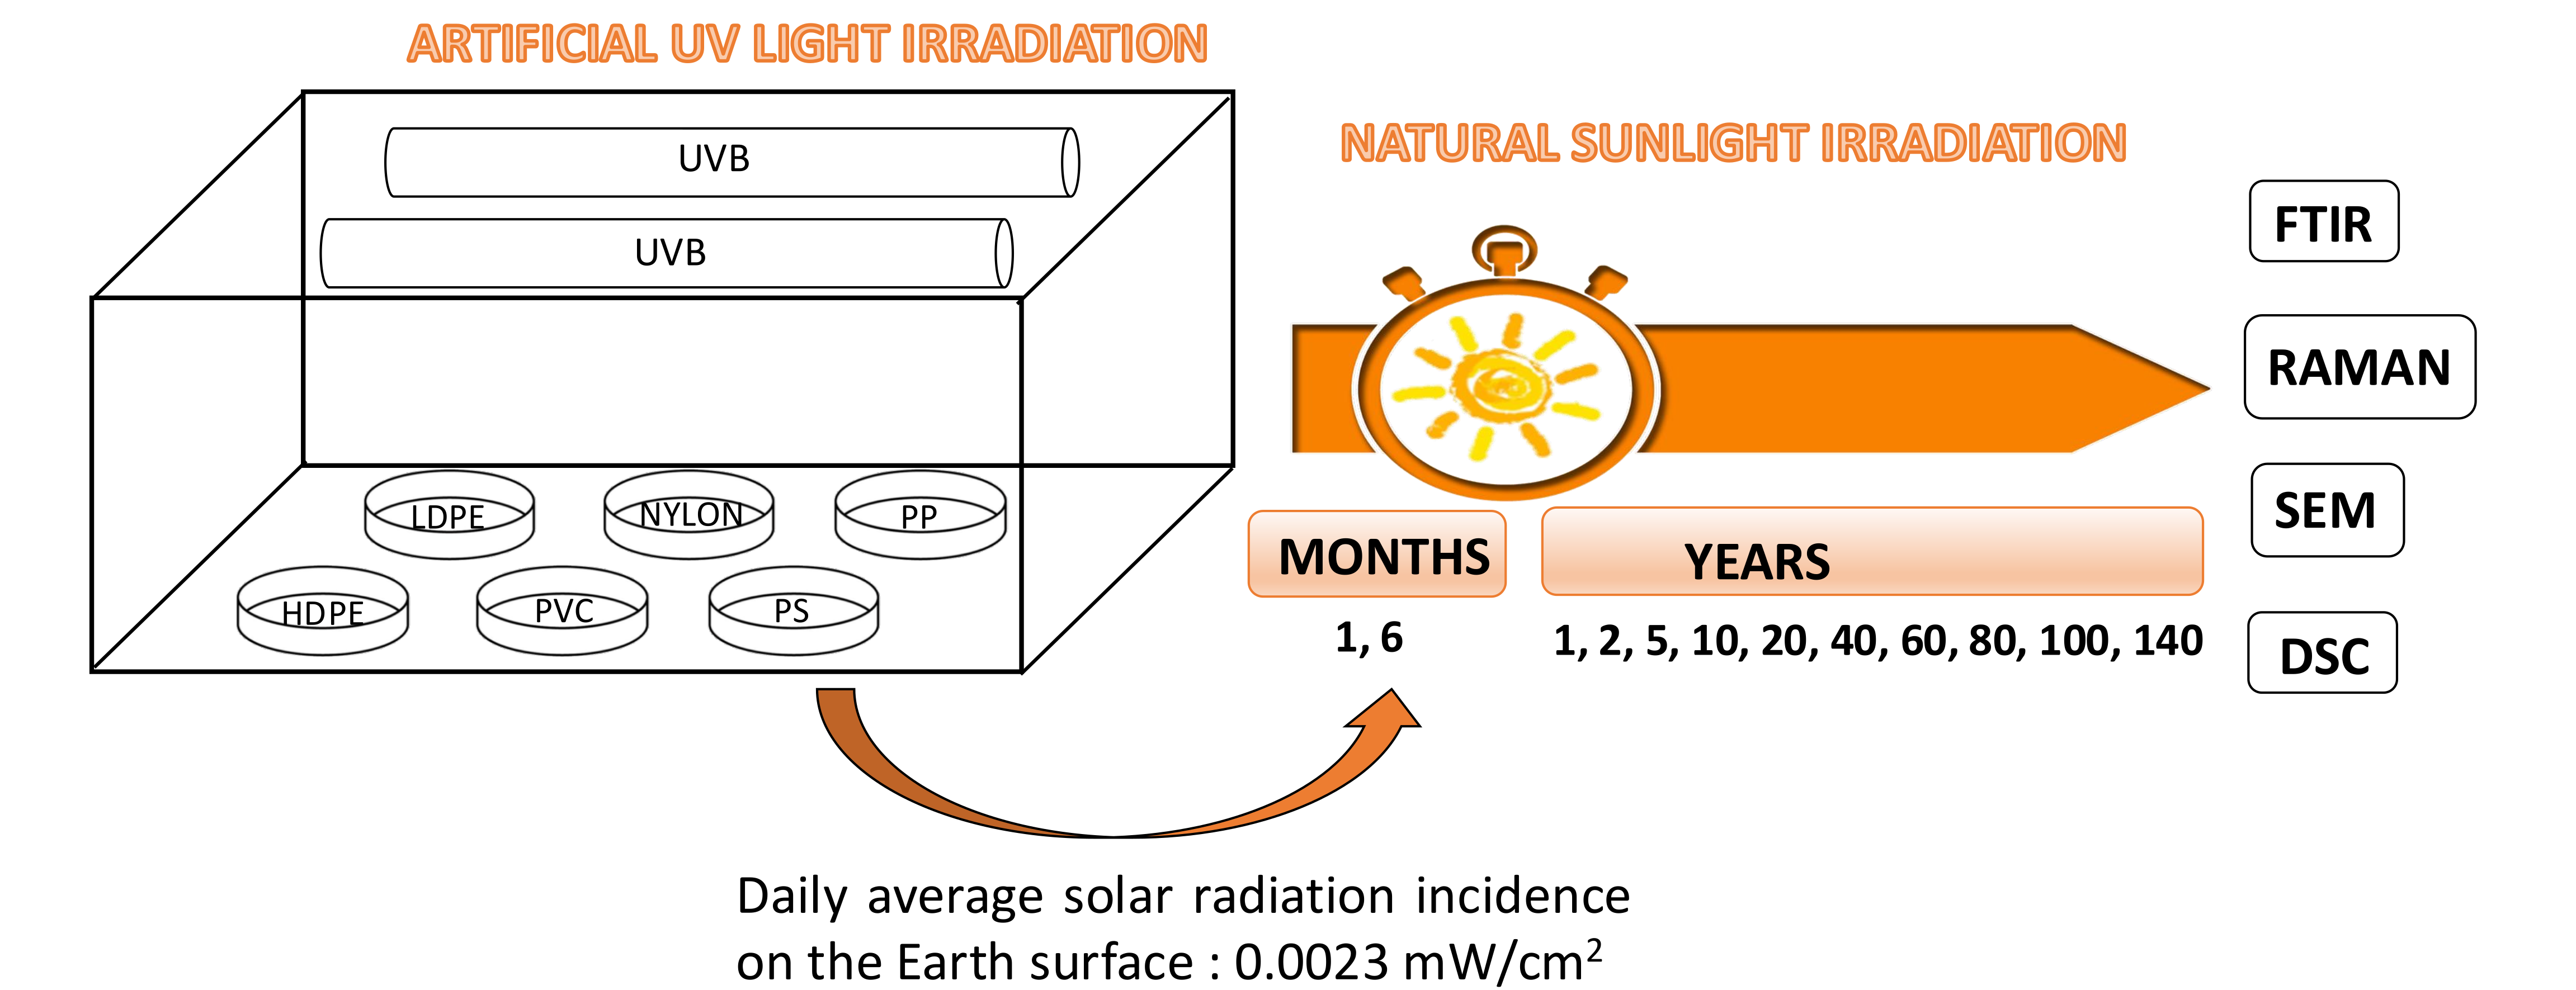
Artificial photooxidation experiments were conducted utilizing UV-B lamps (UVB-150), with the irradiance at the sample plane set to either 0.06 mW cm−2 or 0.6 mW cm−2. These experiments were performed in duplicate. Samples were exposed under dry conditions at a constant distance of 20 cm from the lamps, resulting in polymer series exhibiting progressive degradation at each irradiance level. The exposure durations ranged from 0 to 6 months, with subsamples collected at intervals of 1, 7, 14, and 28 days for the 0.06 mW cm−2 irradiance, and at 7, 14, and 28 days, as well as 2, 3, 4, 5, and 6 months for the 0.6 mW cm−2 irradiance.
UV-B dose (radiant exposure) and “sunlight-equivalent” contextualization. To compare chamber aging with outdoor exposure, we utilized the cumulative UV-B radiant exposure H (J cm−2), calculated as H = ∫E(t)dt ≈ E⋅tH = \int E(t)\,dt\approx E\cdot tH = ∫E(t)dt ≈ E⋅t, where E represents the UV-B irradiance at the sample plane and t denotes the exposure time (continuous irradiation, 24 h day−1). This resulted in values of 5.18, 36.3, 72.6, and 145 J cm−2 for 1, 7, 14, and 28 days at 0.06 mW cm−2, and 363, 726, 1452, 3.16 × 10³, 4.73 × 10³, 6.31 × 10³, 7.89 × 10³, and 9.47 × 10³ J cm−2 for 7, 14, and 28 days, and 2–6 months at 0.6 mW cm−2 (1 month = 30.44 days). According to [20], the daily average solar UV-B irradiance at the Earth’s surface is 0.0023 mW cm−2; based on this, the aforementioned chamber exposures correspond to dose-equivalent outdoor exposure times of approximately 0.86 months, 6.0 months, 1.0 year, and 2.0 years (for 1, 7, 14, and 28 days at 0.06 mW cm−2) and 5.0, 10.0, 20.0, 43.5, 65.2, 86.9, 108.7, and 130.4 years (for 7, 14, and 28 days and 2–6 months at 0.6 mW cm−2).
It is crucial to note that these “sunlight-equivalent” values are intended solely as an order-of-magnitude contextualization and should not be construed as a direct replication of natural environmental aging. Solar UV-B radiation exhibits significant variability based on latitude, season, solar elevation, cloud and aerosol conditions, and shading, and it is attenuated in environmental matrices such as water, dissolved or particulate matter, biofilms, and sediment. Furthermore, co-stressors not replicated in this study, including temperature and humidity, wet–dry cycling, immersion, and surface biofouling, can influence oxidation kinetics and aging pathways. Consequently, throughout this manuscript, we have prioritized the dose metric (H) and employed outdoor time comparisons solely as a contextual reference. All samples were characterized both before and after UV exposure.

2.2. Characterization

Twenty Scanning Electron Microscopy (SEM) images were obtained for each sample type and time point using an FEI Nova Nano SEM 450 microscope. Due to the non-conductive nature of polymers, gold sputtering was applied prior to microscopic examination.
Fourier Transform Infrared (FTIR) spectra in transmission mode were acquired (five per sample and time) using a Bruker Alpha System equipped with OPUS software 8.5. The FTIR spectra were recorded within the range of 400 to 4000 cm−1. Sample preparation involved mixing each polymer with KBr to form pellets. Quantitative data analysis was conducted using Origin software 2025. Prior to analysis, all FTIR spectra underwent baseline correction to mitigate the effects of surface roughness and physical changes in the polymer specimens during degradation. Degradation indices were determined by integrating the area under selected characteristic absorption bands. The oxidative degradation of HDPE, LDPE, PP, and PVC was evaluated using the Carbonyl Index (CI), calculated as the ratio of the integrated area of the carbonyl absorption band to that of a stable internal reference band representative of the polymer backbone. The carbonyl band (C=O), associated with the stretching vibrations of carboxylic acids, ketones, and esters, was integrated over the spectral range of 1650–1820 cm−1. The reference bands for HDPE, LDPE, and PP corresponded to the CH2/CH3 bending vibrations in the 1420–1500 cm−1 region. Conversely, the degradation of nylon and PS primarily involves the loss of their characteristic functional groups, specifically amide hydrolysis in nylon and aromatic ring disruption or chain scission in PS. Consequently, a Structural Loss Index (SLI) was employed to quantify the fraction of the original functional groups that were degraded. For nylon, the Amide II band at 1545 cm−1, attributed to N–H bending and C–N stretching vibrations, was used as the analytical signal and was normalized to the CH2 stretching band at 2940 cm−1. For PS, the aromatic C–H bending vibration at 752 cm−1 was integrated and normalized against the asymmetric CH2 stretching vibration at 2920 cm−1.
Raman spectroscopy was conducted using an NRS 5100 JASCO Spectrometer, equipped with a Nd:YAG laser (532 nm), operating at 4.7 mW power with 10 s measurement intervals. Five spectra were acquired for each sample and time point. An internal normalization method was employed to ensure data comparability and to mitigate experimental artifacts, such as laser fluctuations. Specific characteristic peaks (Ichar), which are sensitive to molecular aging, including crystalline phases or specific functional groups, were identified and normalized against stable reference bands (Iref) inherent to the polymer backbone. The resulting Intensity Ratio (Ichar/Iref) was utilized to quantify the relative chemical and structural changes. Additionally, the Full Width at Half Maximum (FWHM) and Peak Position were extracted using peak-fitting algorithms to assess increases in molecular disorder and changes in bond energy, respectively.
For the Differential Scanning Calorimetry (DSC) measurements, a heat-flux thermomechanical analyzer Q20 from TA Instruments Inc. was employed. Samples, each weighing approximately 3–6 mg, of LDPE, PP, PVC, nylon, and PS were subjected to a heating rate of 10 °C/min, commencing at 40 °C and reaching maximum temperatures of 160, 190, 250, 300, and 350 °C, respectively. The maximum temperature for each polymer was determined based on its specific melting temperature. HDPE was excluded from the DSC analysis because the remaining irradiated mass per time point was below the minimum required for reliable DSC measurements (minimum 10 mg; typical sample mass 15 mg in this study) after subsampling for SEM, FTIR, and Raman, and considering handling losses. Consequently, DSC results were reported for LDPE, PP, PVC, nylon, and PS, while HDPE aging was evaluated using SEM/FTIR/Raman. Additionally, the behaviors of both HDPE and LDPE polymers were similar. All runs were conducted under a nitrogen gas atmosphere to prevent thermo-oxidative degradation. The melting temperature (Tm), Enthalpy of Fusion (∆Hm), and Degree of Crystallinity (Xc) were calculated for LDPE, PP, and nylon.
Library structure and intended use: For each polymer and dose state (H), we have provided the corresponding FTIR/Raman spectra and representative SEM micrographs. Where applicable, we have summarized the spectral evolution using straightforward quantitative markers (e.g., oxidation indices) as a function of H. In practice, an unknown sample can be compared with the library by matching the polymer identity (FTIR/Raman) and subsequently identifying the closest degradation state using the selected spectral markers (and morphology when available). The output is a relative degradation stage within the controlled UV-B dose series rather than an absolute environmental exposure age.

3. Results

3.1. SEM Analysis

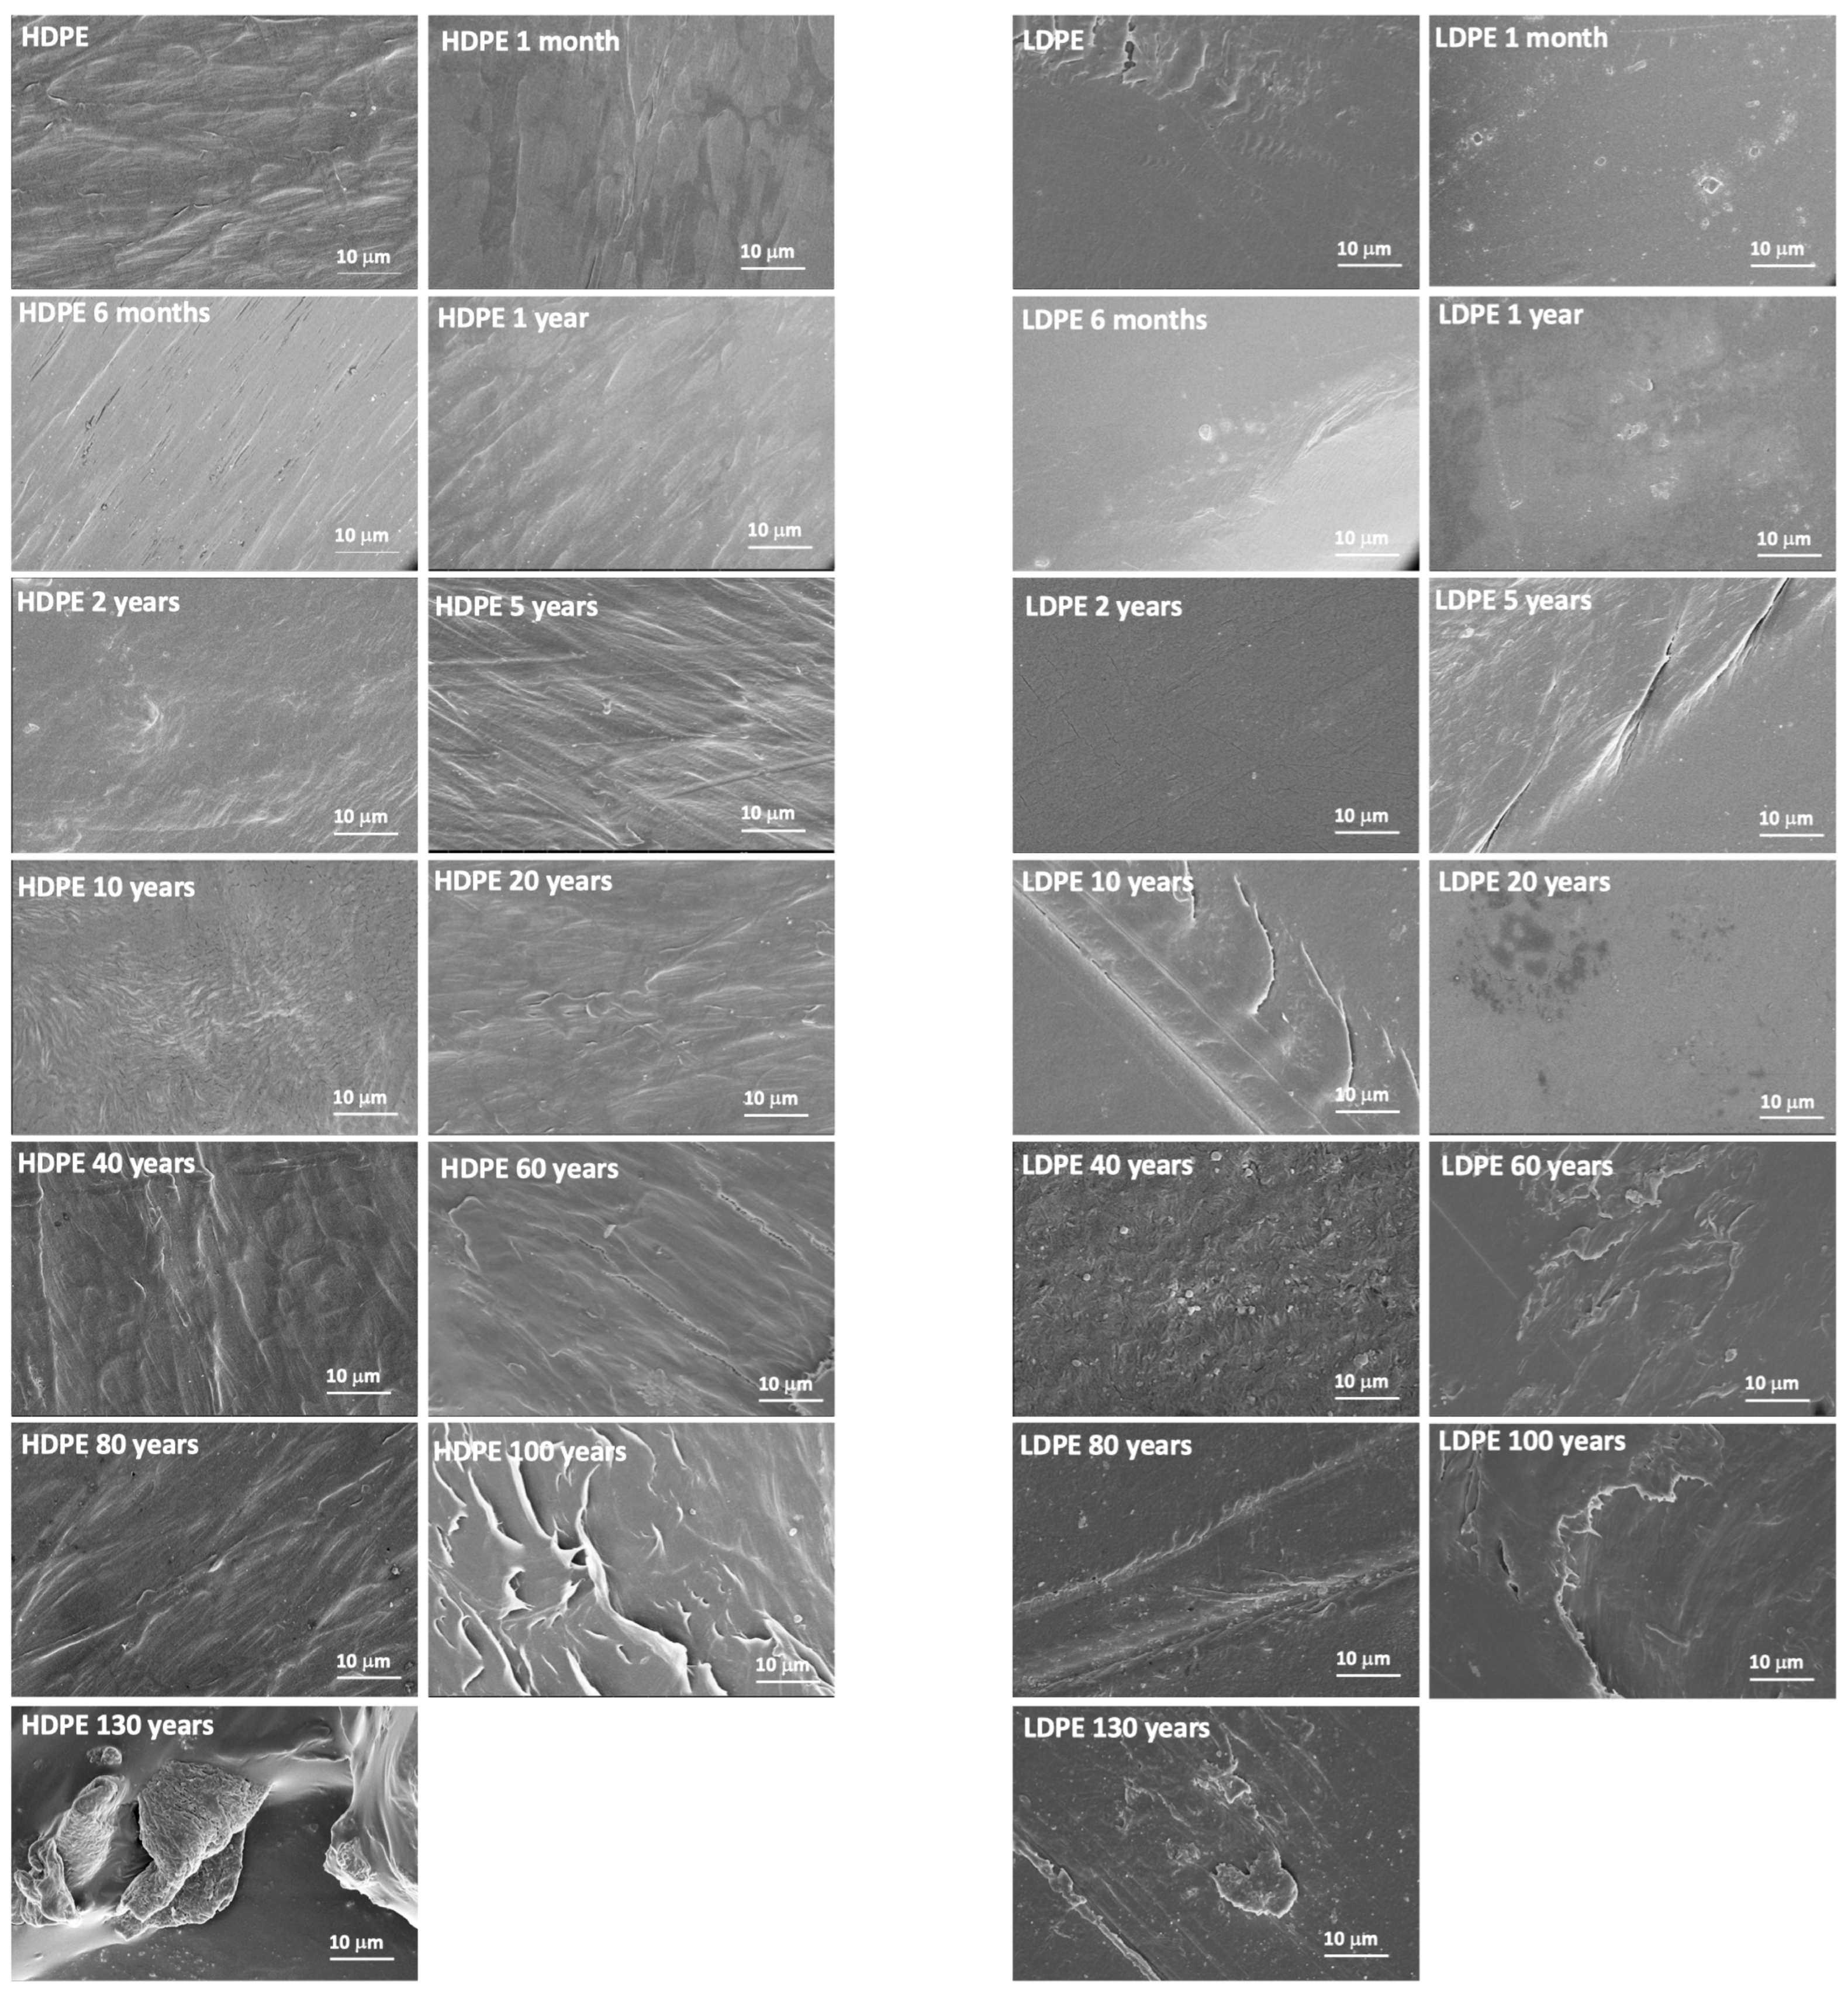
Scanning electron microscopy (SEM) was employed to assess surface degradation at the morphological level. For all microplastics (MPs) examined, degradation increased with prolonged UV irradiation; however, the pattern and intensity of degradation varied according to the polymer type (Figure 1 and Figure S1). Polyethylene (PE) exhibited the least surface degradation, consistent with existing literature [21]. Furthermore, Cai et al. [22] investigated the UV degradation of PE, polypropylene (PP), and polystyrene (PS) over a three-month exposure period, revealing that PE pellets did not exhibit surface cracks, whereas PP and PS pellets did. In our study, even after extended exposure, no cracks were observed in PE pellets. The high-density polyethylene (HDPE) pellets (Figure 1) displayed a rough surface prior to irradiation, likely due to the polymer’s manufacturing process. After approximately 100 years, folds developed, evolving into bumps after approximately 130 years. In the case of low-density polyethylene (LDPE), several folds appeared after 5 years, transforming into bumps after 40 years, which persisted on the pellet surfaces for approximately 130 years. The degradation of nylon and PS was comparable, while the degradation patterns of polyvinyl chloride (PVC) and PP were similar. PP (Figure S1) exhibited folds and bumps after 6 months of exposure. After 80 years, the folds enlarged, and cracks emerged after 100 years. By approximately 130 years, the cracks had widened to over 100 microns, corroborating findings from other studies [22,23]. Dong et al. examined the texture of MPs collected from a region with longstanding plastic processing and recycling industries, suggesting prolonged environmental exposure. Similarly to PP, PVC also developed cracks; however, its degradation pattern differed: after 5 years, bumps were observed, and after 10 years, pits appeared, aligning with other reports [13]. In the aforementioned studies, no cracks were observed, likely due to the shorter degradation times considered. Literature suggests that spherical defects may result from gases generated during macromolecular degradation, indicating extensive polymer decomposition [18]. The dechlorination of PVC, with the formation of HCl, may have contributed to these spherical defects, as discussed below. Additionally, after 80 years of exposure, debris was detected on the surface of PVC pellets.
Nylon and PS exhibited analogous degradation patterns, characterized by the presence of flakes and adhering particles following brief exposure to ultraviolet (UV) radiation. This degradation pattern persisted with prolonged exposure. Similar findings have been documented in the literature for PS, particularly after three months of UV radiation exposure [22]. Both nylon and PS consistently demonstrated the same degradation pattern throughout the exposure period, irrespective of the duration of radiation exposure.

3.2. FTIR Analysis

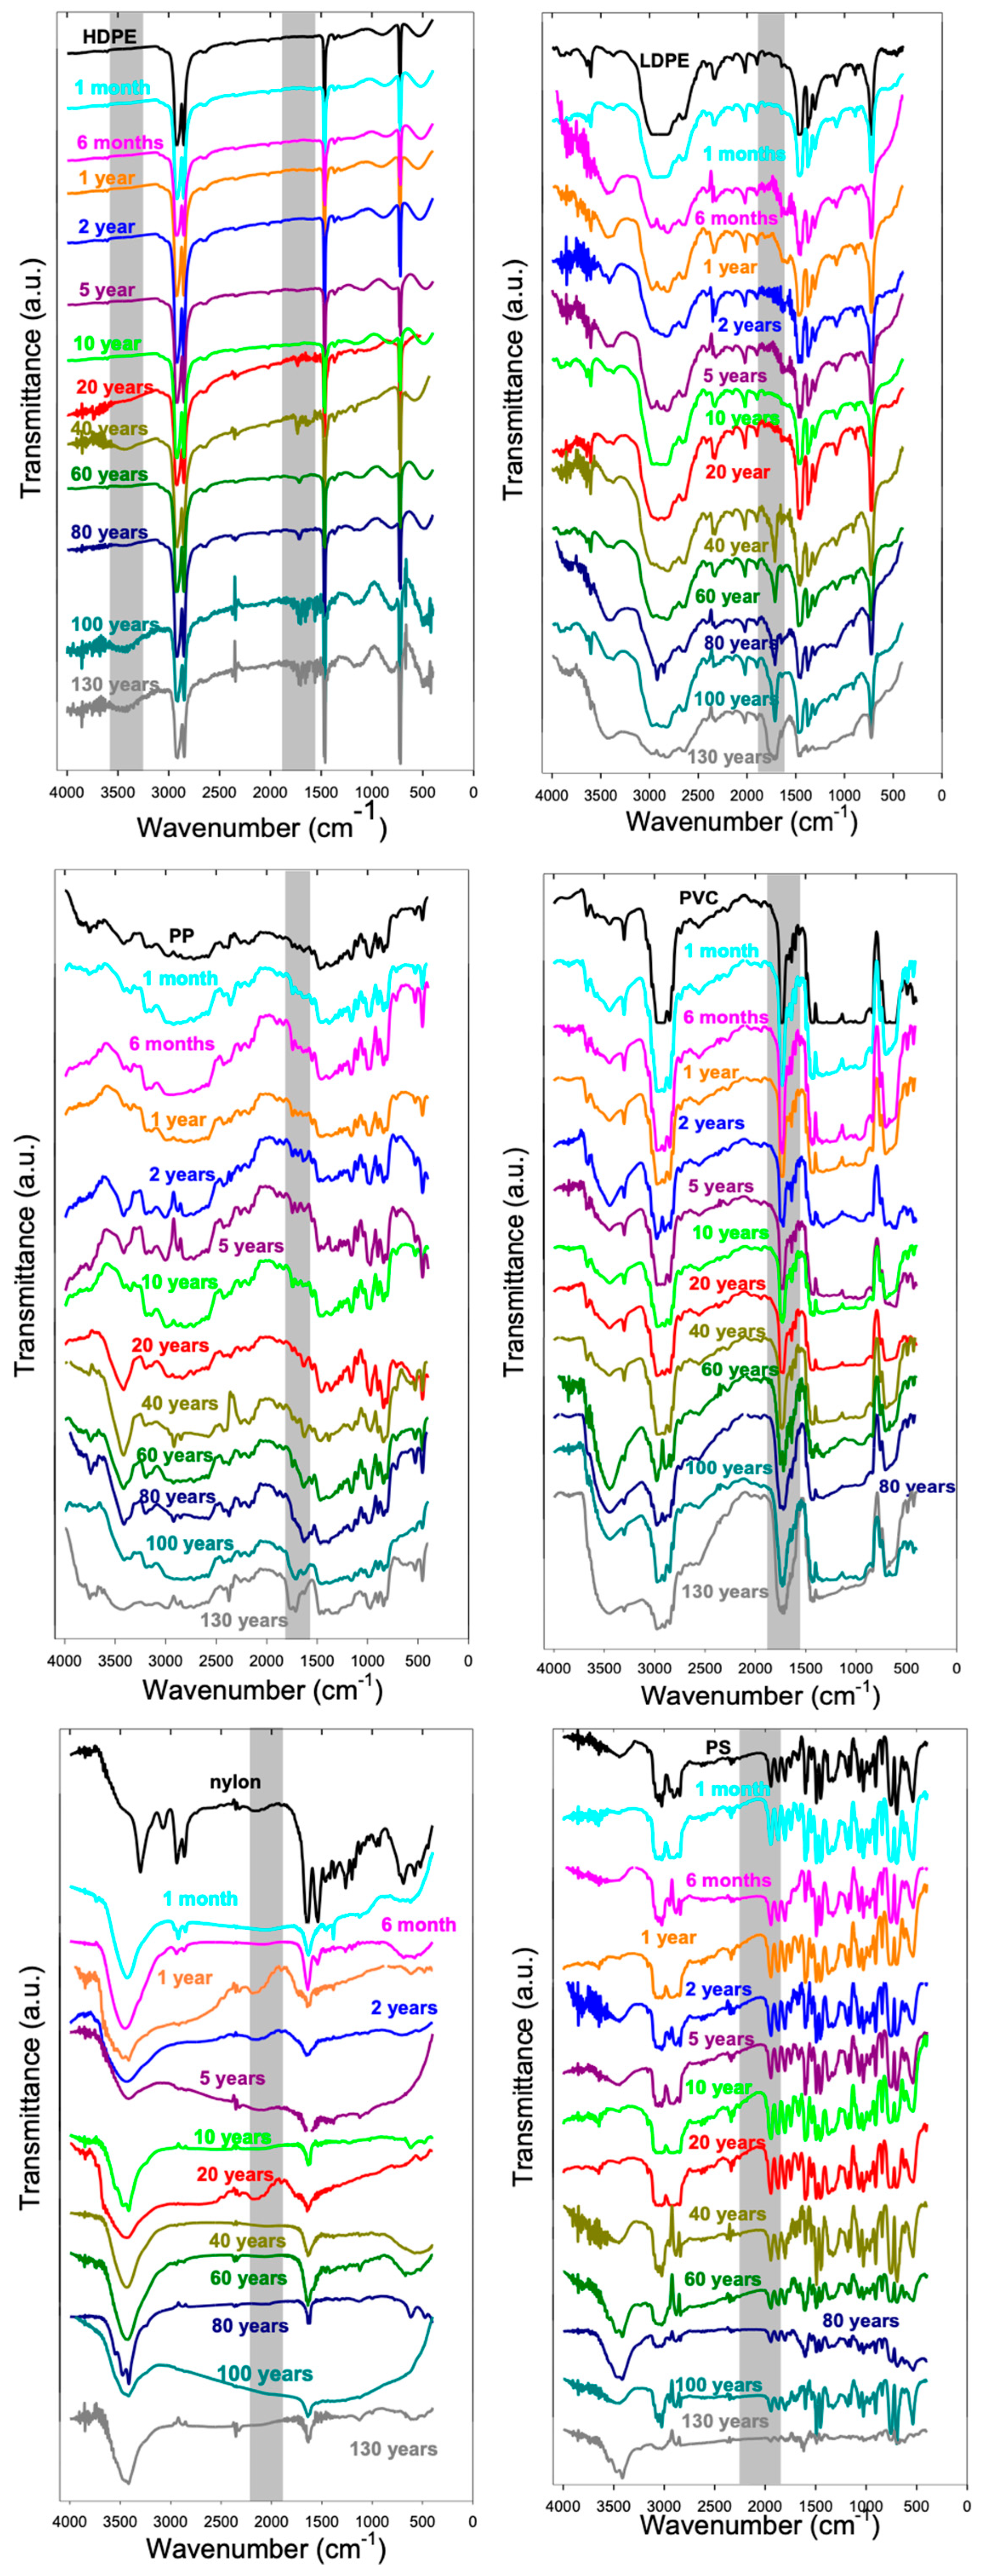
The morphological alterations observed through scanning electron microscopy (SEM) during the photooxidation process were correlated with specific chemical modifications identified via infrared spectroscopy. These modifications included the formation of polar oxidative functional groups, such as hydroxyl and carbonyl groups. The FTIR bands for the non-irradiated polymers were selected based on their characteristic bands, as detailed in Table 1.
Figure 2 illustrates the vibration bands (Table 1) of the CH2 group in non-irradiated HDPE. The SEM analysis indicates that photodegraded HDPE exhibited minimal structural alterations. The modification of the HDPE spectra during photooxidation suggests the formation of esters (1735 cm−1) after 20 years. However, by 60 years, this peak shifted to 1713 cm−1, attributed to the formation of carboxylic acids. After 100 years, this peak broadened to 1640 cm−1, indicating the formation of double bonds. In the hydroxyl frequency range, after 100 years of exposure, a band at 3420 cm−1 was associated with hydrogen-bonded alcohols and hydroperoxides [14]. Although degradation was observed after 20 years of exposure, the new peaks exhibited a relatively small area, indicating a low degree of degradation [28]. The photodegradation of HDPE follows a Norrish type I mechanism, resulting in the formation of carbonyl groups. However, at advanced stages of degradation, a Norrish type II mechanism, characterized by the formation of hydroperoxide species, has been observed [21].
Figure 2 presents the FTIR spectra for LDPE, which closely resembles that of HDPE, although the band positions are not identical (Table 1). Notably, a new peak at 1365 cm−1, corresponding to the bending mode of the –CH3 terminal groups, is absent in the HDPE FTIR spectra. In terms of LDPE photooxidation, while it follows the same degradation mechanism as HDPE—Norrish type I—the degradation pattern differs. Degradation becomes significant at 40 years, marked by a peak at 1713 cm−1 due to the formation of carboxylic acids. Although structural changes in LDPE occur later than in HDPE, this peak, indicative of polymer degradation, is more pronounced, aligning with the degradation pattern observed via SEM and corroborated by other studies [21]. The untreated PP FTIR spectra exhibit absorption peaks corresponding to CH3, CH2, and C-C vibrations (Table 1). From a photochemical oxidation perspective, PP demonstrates lower stability than PE, as the tertiary carbon atoms in PP are more susceptible to free radical attacks [29]. The FTIR spectra of PP reveal a small peak at 1735 cm−1 after 6 months of exposure (carbonyl groups), and this polymer also follows a Norrish Type I degradation mechanism. Additionally, after two years of exposure, a small peak corresponding to a double bond emerges (1640 cm−1) [21]. However, these peaks remain relatively small, only increasing after 60 years of exposure. Unsaturation significantly influences chain scission [21], and the occurrence of chain scission is consistent with the SEM images of PP photodegradation (Figure S1). The FTIR spectra of PVC display characteristic bands corresponding to CH2, CH, and CH near the Cl and C-Cl groups (Table 1). From 40 years onward, a band around 1700 cm−1 intensifies and broadens as double bonds and carbonyl groups form [30]. As previously mentioned, the formation of double bonds may lead to chain scission, and in the case of PVC, cracks are observable in the SEM images (Figure S1). Furthermore, the formation of double bonds and carbonyl groups aligns with the degradation pathway via photogenerated OH as described in the literature [30]. Additionally, after 40 years of exposure, the samples exhibit a yellowish discoloration [31] (Figure S2).
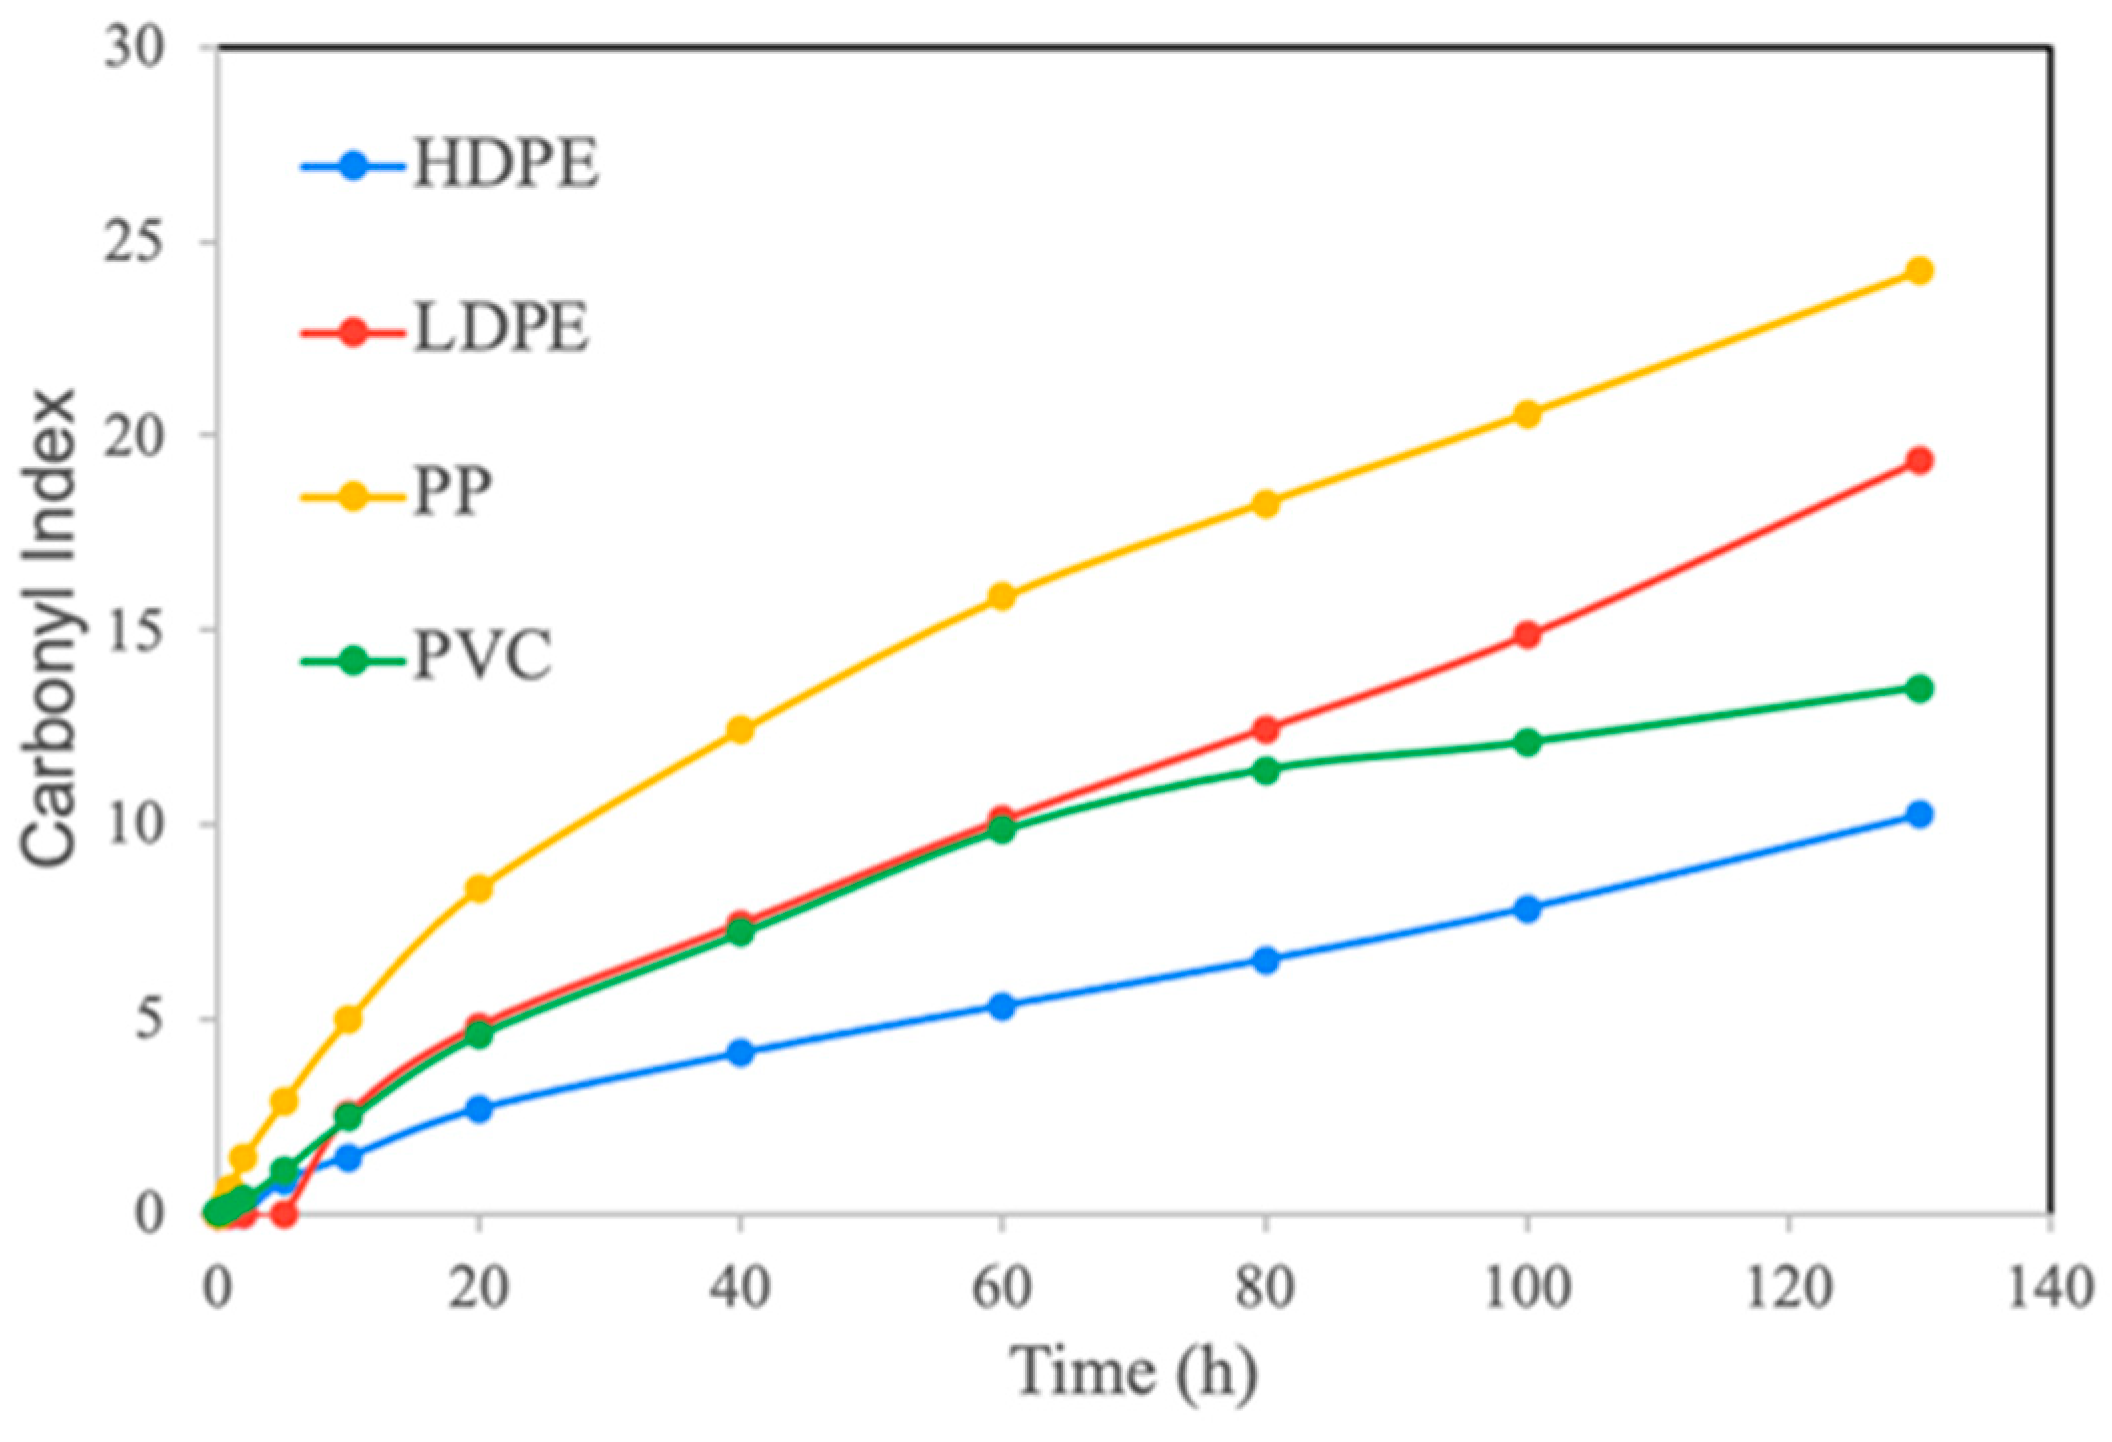
Table S1 and Figure 3 illustrate the temporal evolution of degradation indices for the polymers under study. The progression of the Carbonyl Index (CI) reveals a clear hierarchy of susceptibility to oxidative degradation, ranked as follows: PP; LDPE; PVC; HDPE. Among the materials analyzed, PP exhibited the most pronounced degradation kinetics, reaching a maximum CI value of 24.22 after 130 years. This increased vulnerability is attributed to the presence of tertiary carbon atoms, which promote rapid radical-mediated auto-oxidation and chain scission. In contrast, HDPE demonstrated the greatest resistance to oxidative degradation, with a significantly lower CI of 10.24 over the same exposure period. The high degree of linearity and crystallinity in HDPE effectively restricts oxygen diffusion, thereby limiting the rate of its chemical modification. LDPE displayed intermediate behavior, achieving a CI of 19.34 at 130 years, where branch points served as preferential sites for oxidation initiation. PVC exhibited a comparatively moderate increase in CI (13.5), primarily driven by dehydrochlorination reactions that generated reactive polyene sequences, subsequently facilitating carbonyl group formation. Quantitative comparison indicated that PP accumulated carbonyl-containing degradation products at a rate approximately 2.4 times higher than that of HDPE under identical stress conditions. Overall, these findings underscore molecular architecture and chain branching as the dominant factors governing polymer durability. While HDPE largely preserves its structural integrity over extended timescales, PP reaches critical levels of chemical degradation within the first 15 years of exposure.
Among the polymers examined in this study, PS exhibited significant degradation upon exposure to UV irradiation. This phenomenon can be attributed to its unique possession of a chromophore group. The FTIR spectra of untreated PS revealed vibration bands corresponding to benzene and aliphatic chains (Table 1). Following UV-induced degradation, the FTIR spectra displayed new peaks at 1700 cm−1 (C=O) and 3300 cm−1 (OH) after 40 years of exposure. Furthermore, after approximately 130 years of exposure, a new peak emerged, indicative of doublebond formation. A reduction in the intensity of the characteristic peaks observed at 40 years was noted, and by 140 years, many of these peaks had disappeared [22,32], consistent with degradation mechanisms documented in the literature [33].
Nylon exhibited the highest degree of photodegradation among the polymer types analyzed. The untreated nylon sample displayed peaks at 3420 cm−1 and 3300 cm−1, corresponding to the –NH2 and N-H stretching modes, respectively. The peaks at 2940 and 2865 cm−1 were attributed to the CH2 symmetric and asymmetric stretching vibrations, respectively. The band centered at 1640 cm−1 is associated with amide I, while the bands at 1545 and 1455 cm−1 are linked to amide II, and the band at 1265 cm−1 corresponds to amide III [34]. Following two years of exposure, the characteristic peaks of the secondary and tertiary amines were no longer present in the spectra, accompanied by a reduction in the intensity of the stretching vibration peaks [11]. After 20 years of exposure, the nylon spectra remained unchanged, which may be attributed to the degradation mechanism consistent with the β-C-N hydrogen transfer [35]. The observation that nylon and PS experienced the most significant degradation among the polymers tested aligns with their similar degradation patterns at the morphological level (Figure S1).
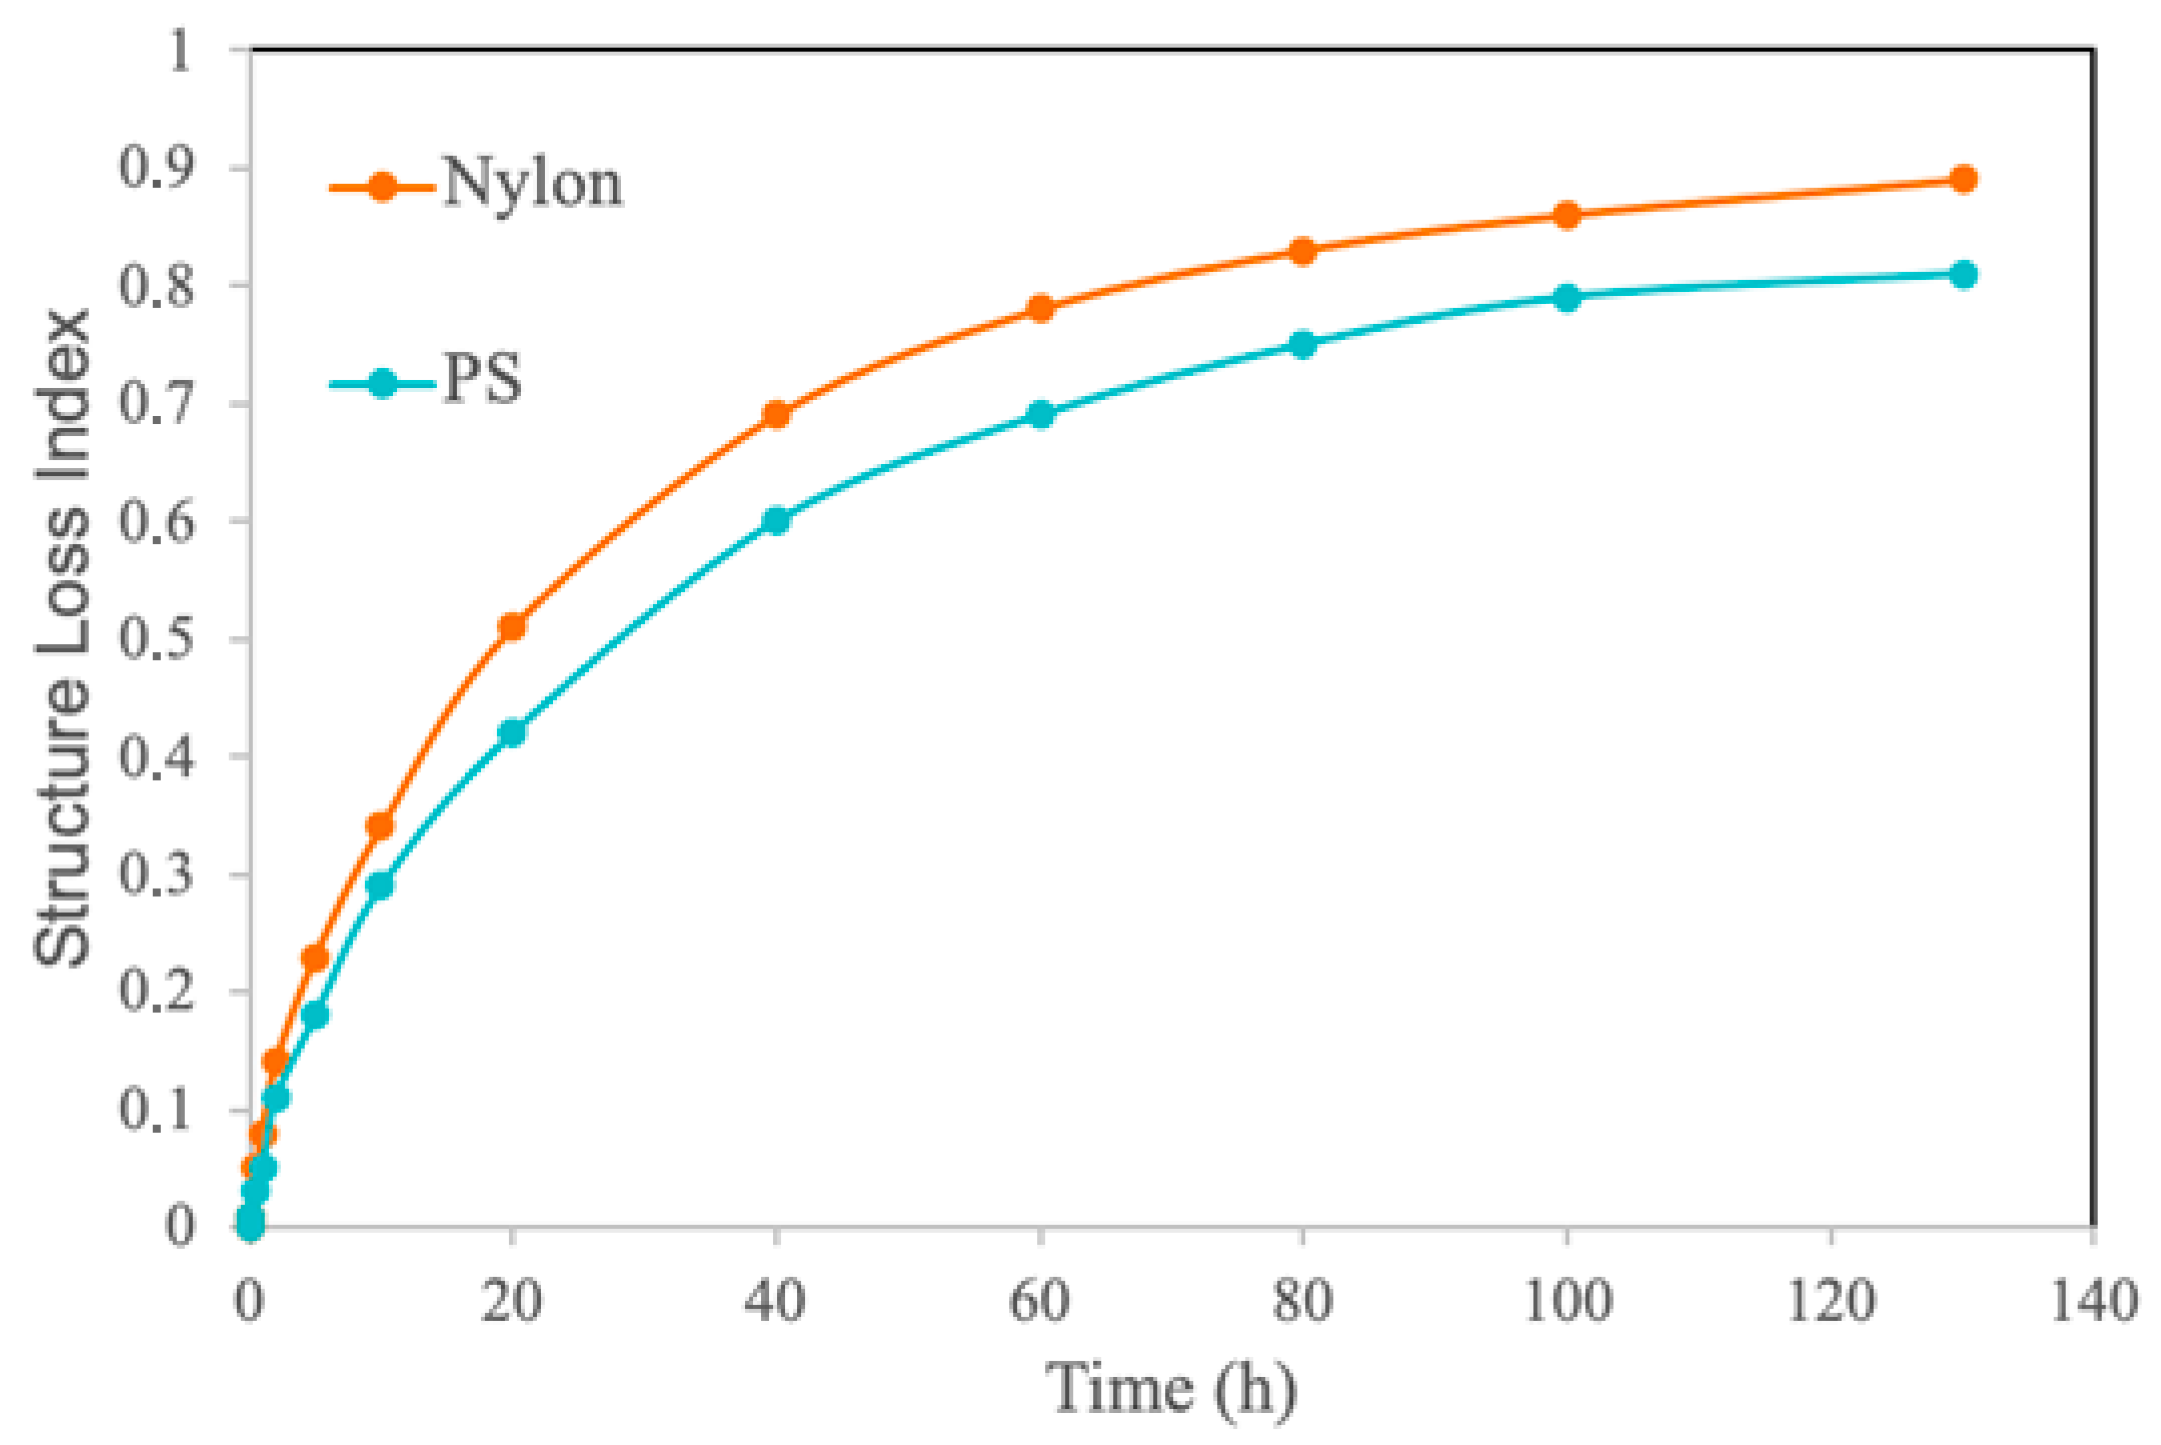
In contrast to the previously examined polymers, where degradation was evaluated through carbonyl growth, the values reported for these two materials correspond to the Structural Loss Index (SLI) (Figure 4). An SLI value of 0 signifies an intact material (control condition), whereas values approaching 1 indicate an almost complete loss of the analyzed functional band (Amide II in Nylon and aromaticity in polystyrene, PS). SLI analysis revealed that nylon experienced more severe degradation than PS, primarily due to the high sensitivity of its amide linkages. After 10 years of exposure, nylon exhibited an SLI of 0.34, compared to 0.29 for PS, corresponding to an initial degradation rate approximately 1.2 times higher. Nylon reached the critical threshold of 50% structural loss by year 20, whereas PS maintained its structural integrity until approximately year 26. After 130 years, the final SLI values reached 0.89 for nylon and 0.81 for PS, reflecting the superior stability of the aromatic rings in PS relative to the progressive chain scission mechanisms dominant in nylon. The FTIR-derived stability ranking (HDPE; LDPE; PVC; PP; PS; Nylon) aligns with the known differences in photoreactivity among polymer backbones. Polyolefins (HDPE/LDPE) possess saturated C–C backbones that absorb weakly in the UV-B region; therefore, photooxidation is typically initiated by trace chromophores/defects (e.g., hydroperoxides, carbonyl impurities, catalyst residues, and unsaturations) formed during processing or early aging, which then drive radical oxidation and carbonyl growth [14,36,37]. Among polyolefins, HDPE generally exhibits higher apparent photostability than LDPE because its higher crystallinity and lower chain branching reduce oxygen permeability and limit reactive amorphous domains, whereas LDPE contains more chain irregularities and amorphous regions that facilitate oxidation [14,38]. PP tends to oxidize more readily than PE because hydrogen abstraction at tertiary carbon sites yields relatively stable tertiary radicals and hydroperoxides. Subsequent hydroperoxide photolysis forms alkoxy radicals that undergo β-scission, and the carbonyl products can further undergo Norrish type I/II reactions, accelerating chain scission and carbonyl accumulation [39,40]. For PVC, UV exposure can trigger dehydrochlorination (HCl elimination), generating conjugated polyenes that absorb more strongly and can undergo further oxidation, producing additional carbonyl-containing species [41,42]. The lower stability observed for PS is expected because the phenyl group acts as an intrinsic chromophore, enabling efficient light absorption and radical formation, which promotes rapid oxidative functionalization (including carbonyl formation) [37,43]. Polyamides (nylon) contain amide chromophores and can undergo photooxidation near the amide functionality (often at α-CH sites), leading to changes in hydroxyl/carbonyl-related features and chain scission/chemi-crystallization. However, interpretation requires caution because the amide bands are intrinsic to the polymer and can overlap with oxidation products [44,45,46].

3.3. Raman Analysis

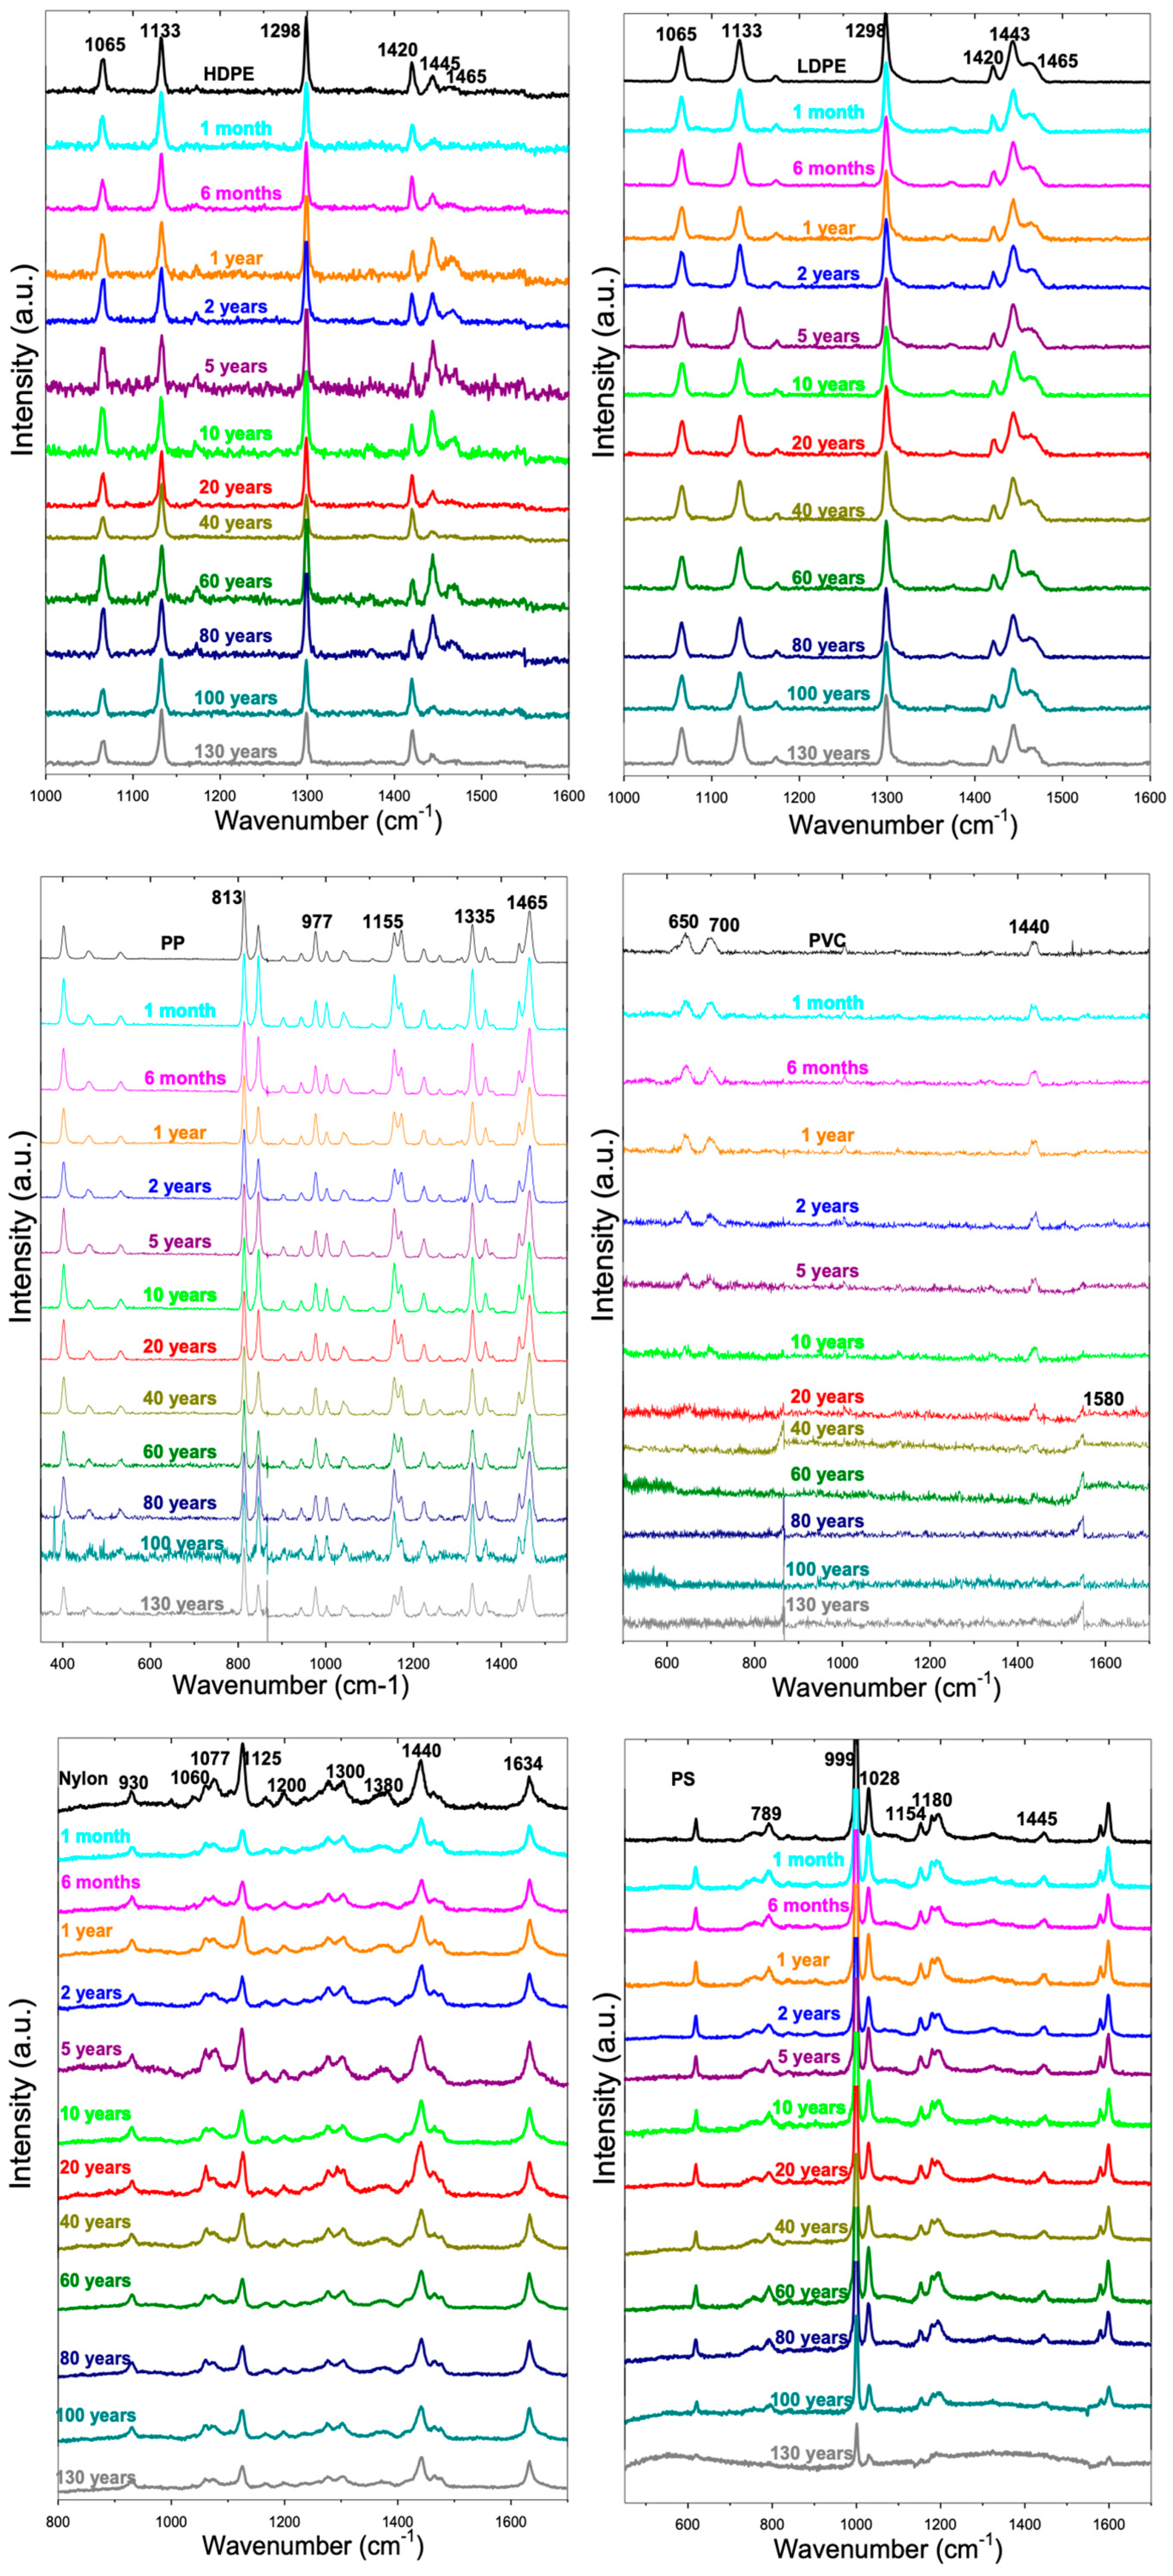
Raman spectroscopy is employed to identify modifications in bulk MPs; however, it is not the optimal method for obtaining information on surface modifications of polymers that are associated with changes in their chemical composition. For instance, the formation of polar oxidative functional groups is readily observable in FTIR spectra but not in Raman spectra. The assignments of the Raman bands corresponding to each polymer type are presented in Table 2.
The bands corresponding to HDPE and LDPE (Figure 5) exhibited the stretching vibration C-C and the bending/stretching vibration CH2 [47]. PE was the sole polymer examined whose bulk form remained unchanged. No shifts in the position of the peaks or changes in the relative intensities between the peaks were observed, consistent with the literature [50]. HDPE was the only PE polymer whose relative intensities in the 1420, 1445, and 1465 cm−1 peaks exhibited slight changes with irradiation time, although no discernible pattern was evident (Figure 5). The primary Raman peaks of PP indicate C-C stretching, CH stretching, CH bending, CH3 bending, CH2 bending, and CH3 asymmetric bending [48]. Significant differences were noted in PP at extended degradation times, where the intensity of the Raman bands diminished. These findings align with those reported by Guo et al. [48], where a reduction in the intensity of PP’s characteristic peaks was observed following UV irradiation, attributed to chain rupture. This is also corroborated by the cracks observed in the SEM images of the PP samples exposed to radiation for approximately 130 years (orderofmagnitude) (Figure S1). Regarding nylon, the most characteristic bands were attributed to the stretching vibrations of C-CO and C-C, the N-H wagging vibration, twisting vibration CH2, wagging vibration CH2, bending vibration CH2, and the stretching vibration of NH amide I [51]. Similarly to the PP samples, the intensity of the spectral peaks decreased after photodegradation, with this reduction being particularly pronounced after prolonged exposure times [52]. Finally, substantial variations were observed in the PS and PVC. The most characteristic bands of PS appeared as a result of the bending vibration of C-H out of plane, benzene ring breathing, symmetric stretching vibration of C-C in the benzene ring, symmetric and asymmetric stretching vibrations of C-C, and bending vibration of CH [49]. After 100 years of exposure, the peak intensities decreased. This reduction was more pronounced after approximately 130 years (order of magnitude) of exposure, when most of the peaks disappeared, leaving only the peak associated with the aromatic ring. The findings align with the FTIR spectra of PS (Figure 2). These results contrast with those reported by Cai et al. [22], who observed only a slight reduction in peak intensity. However, the degradation periods examined in that study were significantly shorter than those in the current investigation. The Raman spectra of the PVC samples exhibited several peaks corresponding to the C-Cl stretching vibration and CH2 bending vibration [23]. After 10 years of exposure, the intensity of the C-Cl bands diminished, and after 40 years, they disappeared entirely, likely due to the dechlorination of the polymer during the degradation process, which imparts a yellowish hue (Figure S2) [31]. This observation is consistent with the pits observed in the PVC SEM images (Figure S1). Furthermore, the yellowish coloration of the degraded PVC samples is attributed to the formation of polyene [53], which resulted in the emergence of a band (1580 cm−1) associated with –C=C– stretching vibration after 20 years of exposure. Additionally, throughout the degradation process, the intensity of the CH2 band decreased, indicating that the PVC degradation mechanism was intramolecular [53].
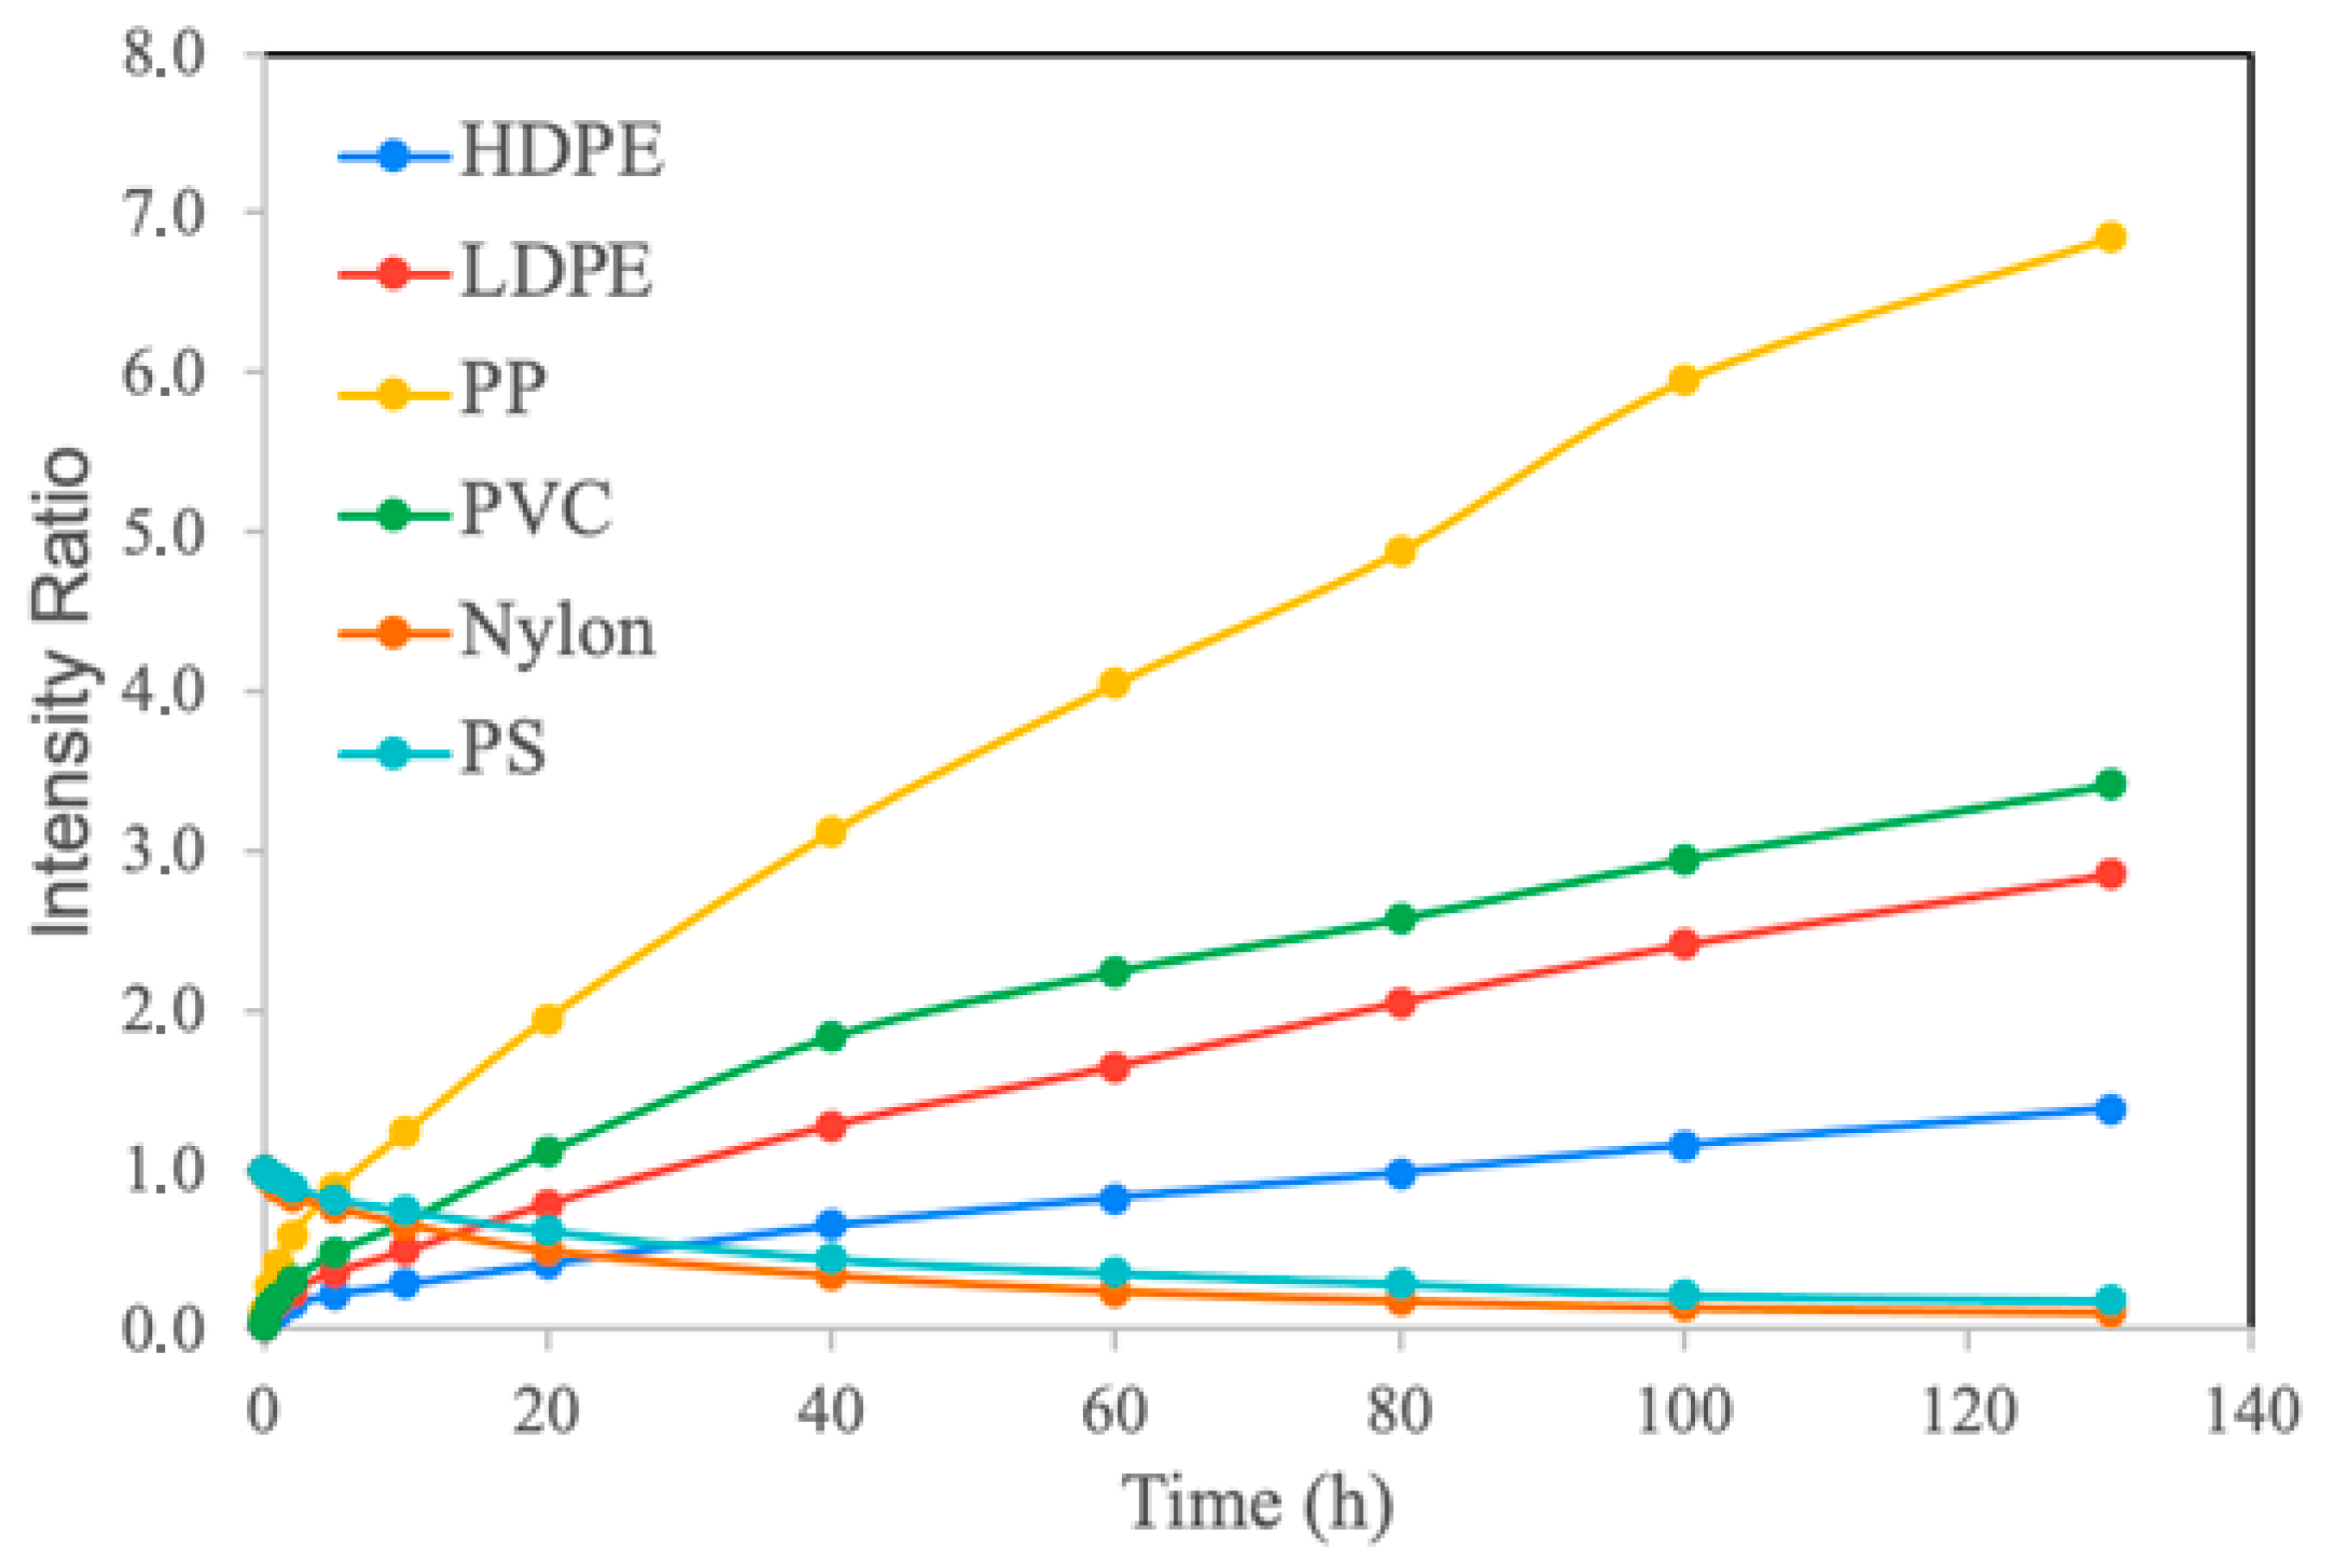
To facilitate a more precise comparison, a quantitative analysis of the spectra was performed. The evolution of the intensity ratios allows for a quantitative evaluation of the degradation of the polymer backbone over a 130-year period. Consistent with the FTIR data, the findings reveal two contrasting kinetic profiles that are directly influenced by the polymer structure: one group is characterized by an increase in unsaturation (polyolefins and PVC), while the other group is marked by a loss of structural integrity (Nylon and PS). The intensity ratios are presented in Figure 6 and Table S2.
For HDPE, LDPE, PP, and PVC, the CH2 bending band at 1440 cm−1 was employed as the internal standard, while the formation of C=C unsaturation at 1640 cm−1 was designated as the characteristic band (I1640/I1440). Due to its linear structure and high crystallinity, HDPE is the most stable polymer in this group, achieving a final intensity ratio of only 1.38. LDPE demonstrated a slightly higher susceptibility to unsaturation formation due to the presence of chain branching, with an intensity ratio of 2.85 after 130 years. PVC followed with a final ratio of 3.42. PP was identified as the most unstable material in this group, with its ratio increasing sharply to 6.85. The presence of a methyl group in each repeating unit generates highly reactive tertiary carbon atoms, significantly accelerating carbon backbone fragmentation. For Nylon and PS, the intensity ratio reflects the survival of their key functional groups under degradation conditions. Values approaching zero indicate a loss of chemical identity of the material. Nylon was the most vulnerable polymer, as its intensity ratio decreased from 1.00 to 0.11. Although undergoing a similar depletion process, PS exhibits higher stability than Nylon, retaining a ratio of 0.18 at the end of the study. The thermodynamic stability of aromatic rings provides a protective “shield” that slows down the main-chain scission.
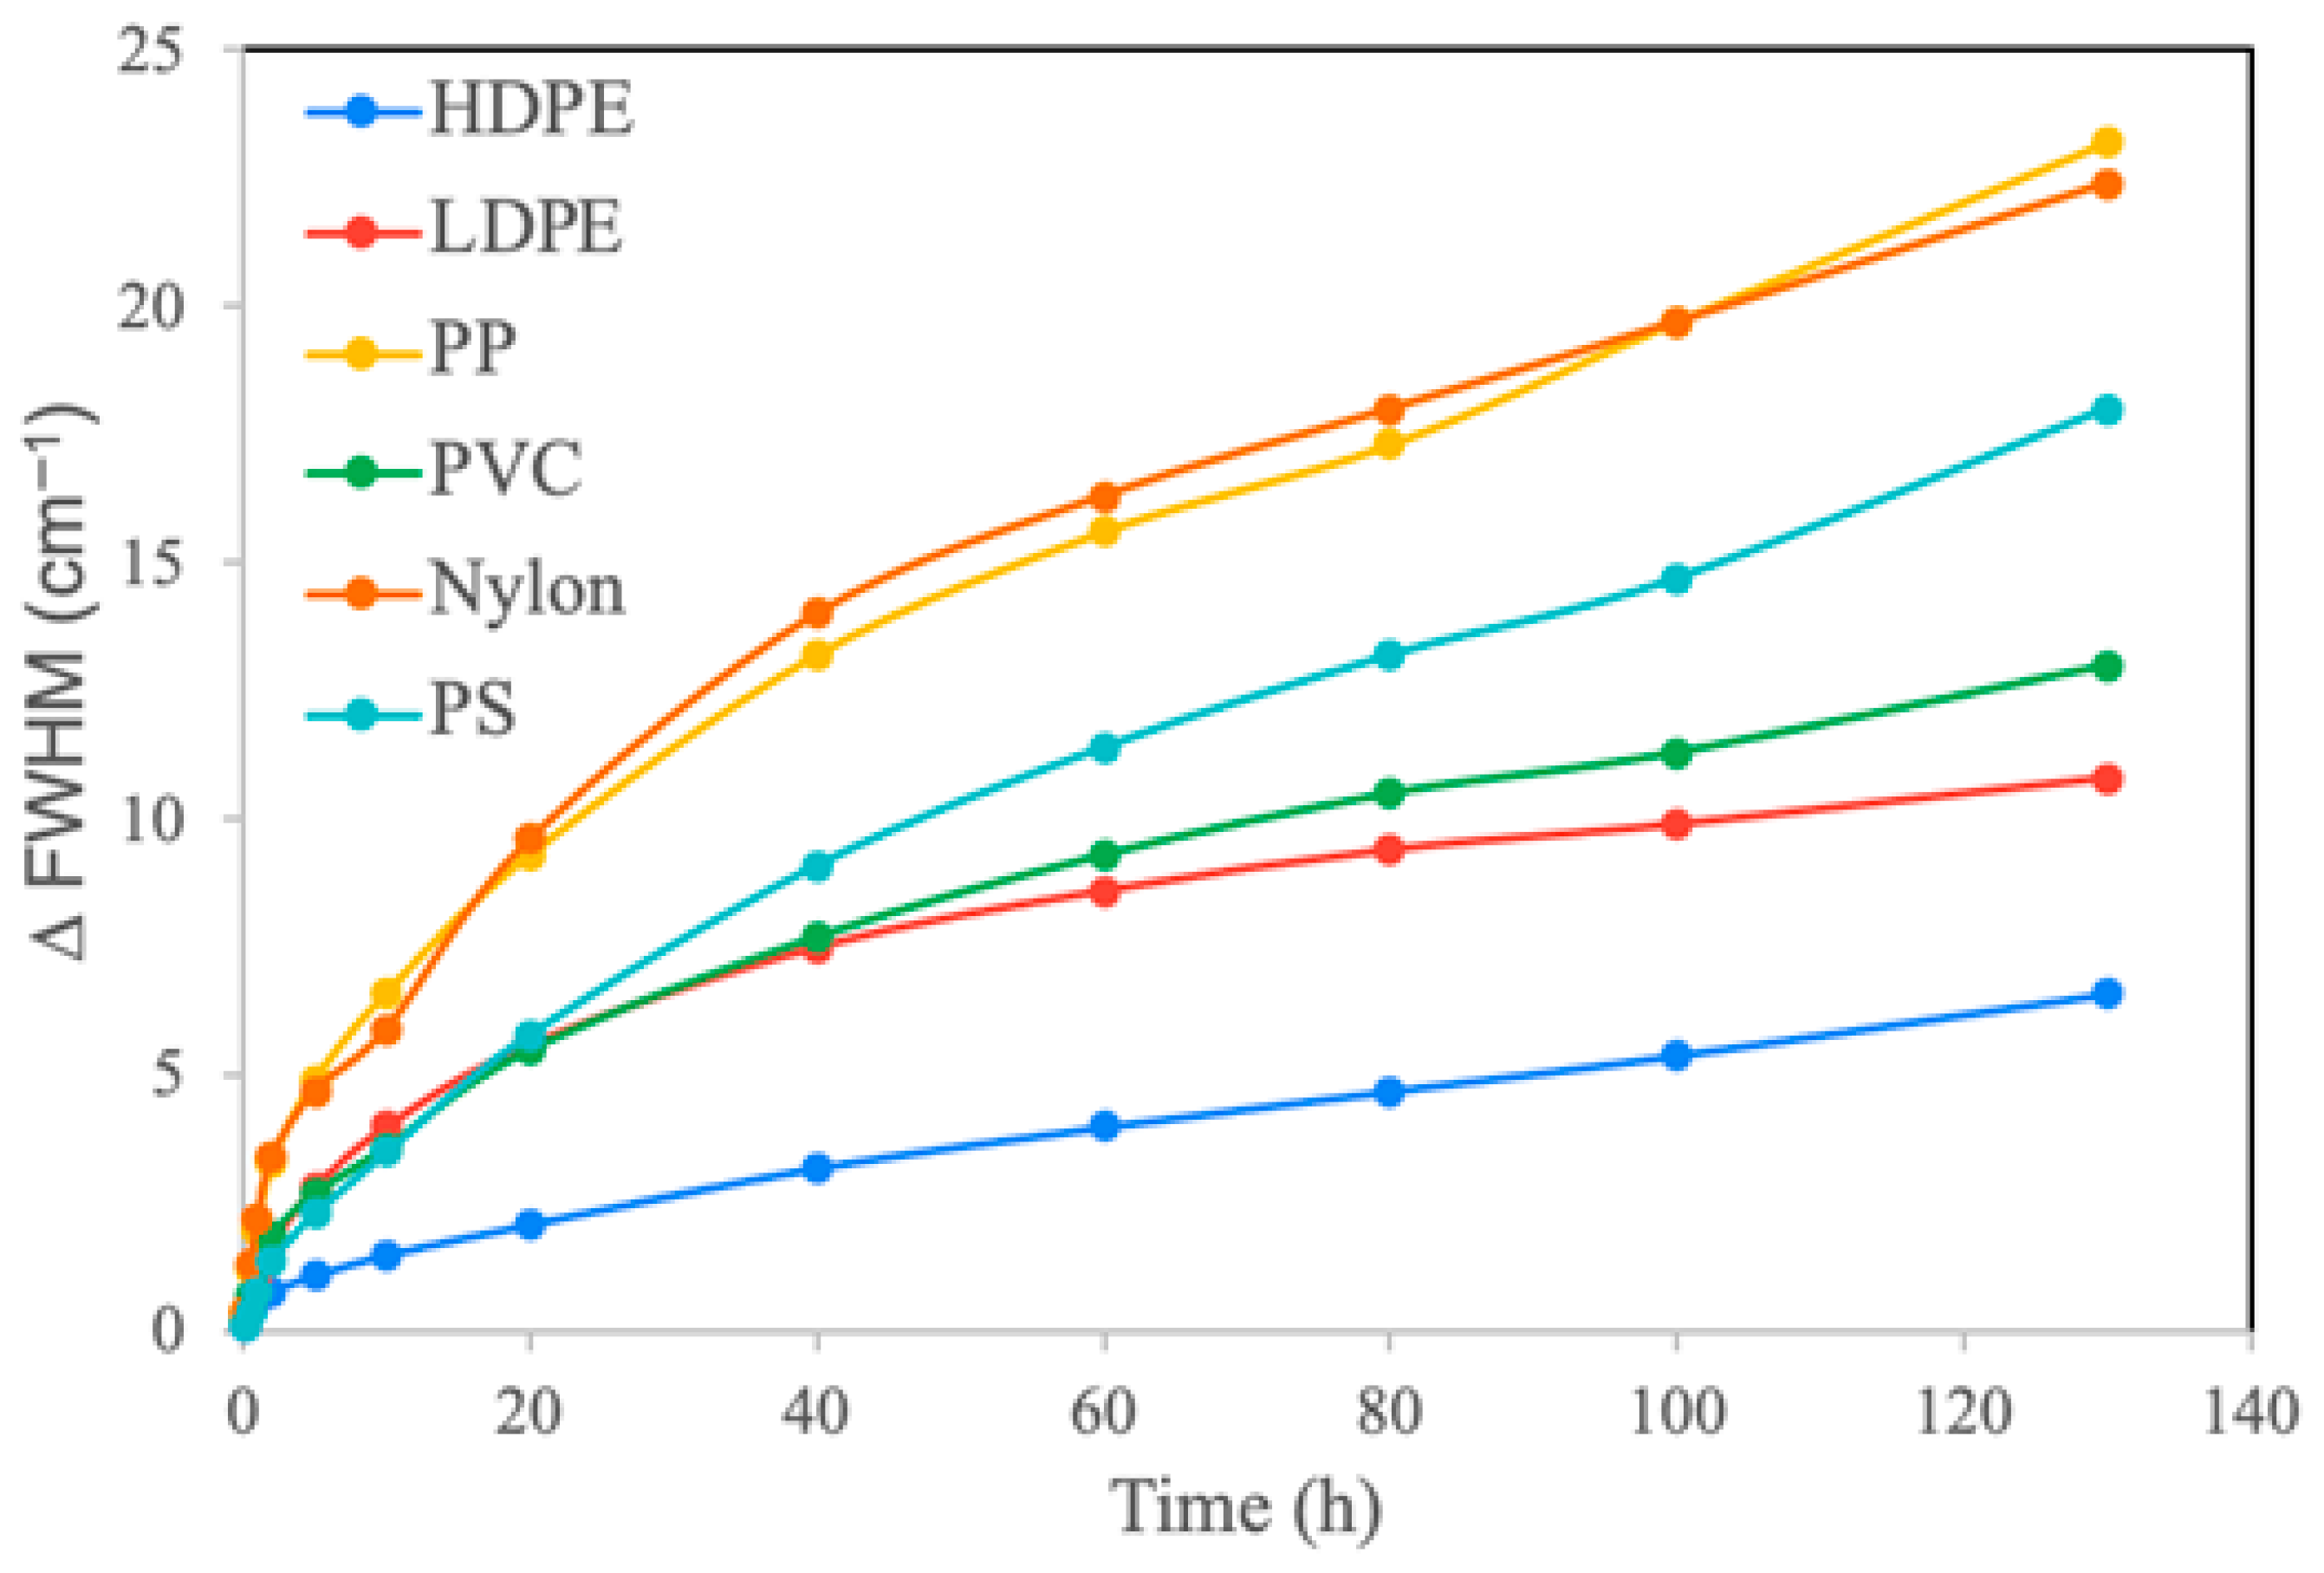
The full width at half maximum (FWHM) of a spectral peak serves as a direct indicator of the degree of order or disorder within the polymer network. Narrower peaks, characterized by lower FWHM values, are indicative of more ordered materials with well-defined crystalline structures. Conversely, as chain scission progresses, the local bonding environment becomes increasingly heterogeneous, leading to peak broadening. Figure 7 illustrates the FWHM values for each polymer as a function of time, while Table S3 presents the increase in peak width relative to the initial value.
The materials Nylon and PP demonstrated the most significant increases in full width at half maximum (FWHM), indicating an almost complete transition to an amorphous state. Specifically, the FWHM for Nylon increased from 12.8 to 35.2 cm−1, while for PP, it rose from 9.2 to 32.4 cm−1. Other materials, such as PS, PVC, and LDPE, also exhibited a notable reduction in molecular order, albeit at a slower pace. In PS, the peak width expanded from 8.4 to 26.4 cm−1, whereas PVC and LDPE attained final values of 23.5 and 19.4 cm−1, respectively. In contrast, HDPE is the sole material that retains an FWHM comparable to that of Nylon or PP in their original state after 130 years. Its linear structure and high density provide physical protection that resists molecular disorder. This remarkable structural stability accounts for the superior long-term durability of HDPE.

3.4. DSC Analysis

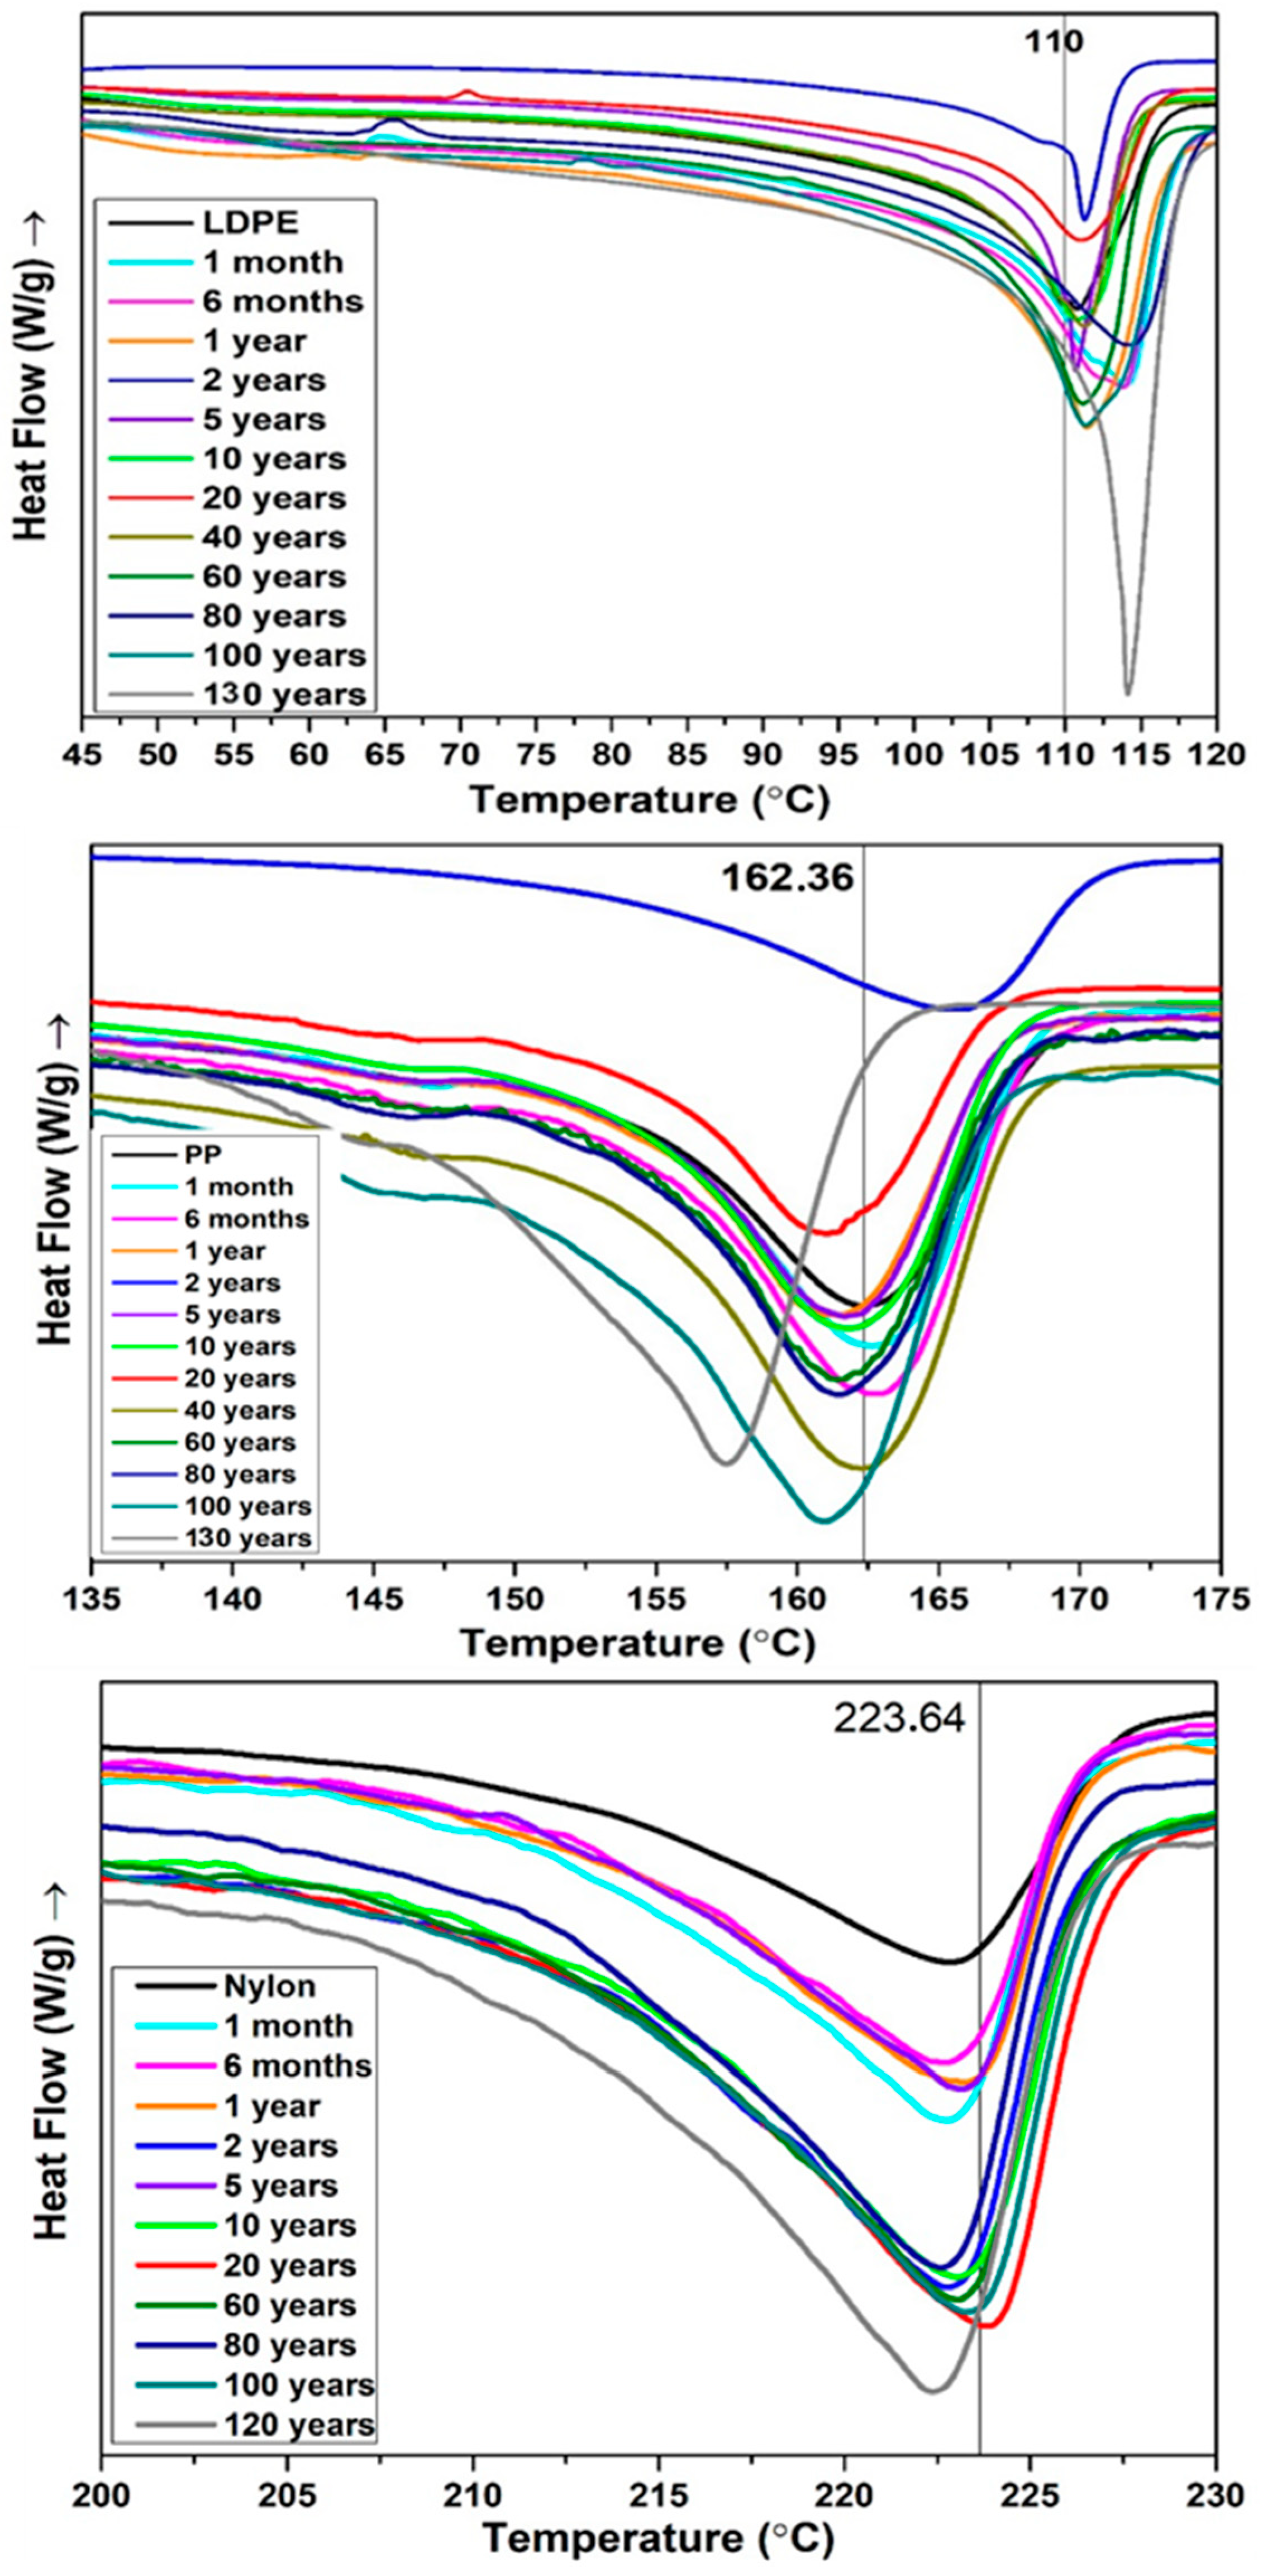
The previously described investigations into the structural alterations occurring during MPs’ exposure to UV radiation were augmented by an analysis of their thermal properties using differential scanning calorimetry (DSC). This analysis primarily aimed to identify any modifications in the crystallinity of the samples. Figure 8 and Figure S3 present the thermographs of the polymer samples subjected to varying durations of UV irradiation. These thermographs facilitated the determination of the melting temperature (Tm) of LDPE, PP, and nylon, as well as their enthalpy of fusion (ΔHm). Conversely, PVC and PS did not exhibit a Tm within the examined temperature range, suggesting that they possess a more amorphous structure compared to the other polymers studied.
In reference to the results of the DSC tests on LDPE, as depicted in Table 3 and Figure 8, no significant differences were observed between the Tm of virgin LDPE and aged specimens. The Tm was found to fracture within the range of 110–114 °C, which aligns with the literature [54,55]. The crystallinity of LDPE was determined using Equation (1):
Xc = ΔHm/ΔHm0
where ΔHm represents the enthalpy of fusion of the aged sample, and ΔHm0 denotes the enthalpy of fusion of a 100% polyethylene sample, quantified as 294 J/g [18,56]. Analysis of the data presented in Table 3 reveals that the crystallinity of LDPE increased following 100 years of UV irradiation, ultimately reaching 43% after approximately 130 years of exposure (orderofmagnitude). This observed behavior aligns with findings reported in the literature.
In the case of PP, the melting temperature (Tm) remained relatively constant, ranging from 161 to 162 °C, for up to 100 years of UV irradiation. However, after approximately 130 years (order of magnitude) of aging, a noticeable decrease in this parameter was observed. This phenomenon can be attributed to the fracture of the PP molecular chains, as previously documented in the literature [12]. The presence of smaller molecules and defects led to a deterioration in the thermal properties of PP, as well as a reduction in its characteristic melting temperature. This observation aligns with SEM images of PP corresponding to approximately 130 years (order of magnitude) of exposure, where fractures were evident (Figure S1).
The degree of crystallinity of the PP samples is detailed in Table 3. The calculations were based on the melting enthalpy of a fully crystalline PP, reported in the literature as 207.1 J/g [16]. Initially, the untreated PP exhibited a crystallinity of approximately 30%. However, following one month of UV irradiation, this value increased significantly, reaching between 37% and 40% and remained at this level until 80 years of aging. Subsequently, the crystallinity (Xc) of the tested PP rose to 50%, indicating an increase of nearly 20%. This phenomenon, commonly referred to as “chemi-crystallization,” has been extensively documented in the context of both thermally and photooxidized PP. It involves the release of segments from the amorphous region, which were unable to crystallize during the initial solidification process, due to chain scissions occurring within the polymer. These segments subsequently reorganize into a crystalline phase during the degradation process [16,57]. In contrast, the melting temperature (Tm) of nylon remained relatively constant across all aged samples, varying only between 222 °C and 224 °C, irrespective of exposure duration. Nevertheless, as illustrated in Table 3 and Figure 4, an increase in exposure time beyond 10 years corresponded with an increase in its melting enthalpy. To ascertain the percentage of crystallinity, the enthalpy of fusion for 100% crystalline nylon 6 is considered to be 188 J/g [58]. Consequently, polymer degradation resulted in an increased crystallinity percentage after 10 years. Similar trends in melting enthalpy and crystallinity have been reported in the literature [36,59].
A limitation of the current dataset is the inability to quantify thermal and crystallinity changes in HDPE using DSC, due to insufficient remaining mass at each irradiated time point.

3.5. Environmental Relevance

The limitations of “sunlight-equivalent” conversions are noteworthy. Natural UV-B radiation at the Earth’s surface exhibits significant spatiotemporal variability, and plastics located underwater or within sediments are subject to substantially reduced UV-B exposure due to strong attenuation by water and dissolved or particulate matter. Reported daily UV-B exposures at sea level can vary widely, even within a single location and season, and decrease rapidly with depth in the water column. Consequently, the chamber exposures utilized in this study should be interpreted as controlled, surface-irradiation aging conditions designed to generate a reproducible degradation gradient, rather than a direct replication of a specific environmental scenario. Furthermore, environmental co-stressors not replicated in this study can alter aging pathways and kinetics. Temperature and humidity influence oxidation rates, oxygen diffusion, and the stability or decomposition of hydroperoxides, while wet–dry cycling and immersion modify UV exposure and mass transport. Biofilms and surface fouling may further shield microplastics from UV-B and alter local chemical conditions, potentially slowing photodegradation or shifting it toward different mechanisms. Therefore, our UV-B dose series should be viewed as a controlled reference for surface photooxidation, to be complemented by field-aged particles in future validation studies. The present UV-B dose library was constructed using standardized disks cut from polymer sheets to control geometry and composition, thereby enabling reproducible, cross-polymer comparison of analytical degradation markers. In contrast, environmental microplastics are irregular in shape and thickness and exhibit a wide range of surface-to-volume ratios, which can strongly influence photooxidation kinetics through UV penetration, oxygen diffusion, and the relative contribution of surface-limited reactions. Additionally, many consumer plastics contain stabilizing additives (e.g., antioxidants, UV absorbers, and hindered amine light stabilizers) that can delay radical propagation and shift the relationship between UV dose and the appearance of oxidation bands in FTIR/Raman. Consequently, the dose-to-degradation mapping reported here should be interpreted as a controlled reference for surface UV-B aging of standardized materials.
Expanding the library to encompass irregular particles and materials containing additives, while benchmarking against field-aged microplastics, represents a crucial advancement for enhancing environmental representativeness. The environmental relevance and scope of the degradation library are significant. The library developed herein comprises a controlled, dose-resolved collection of UV-B aged polymers, designed to establish a reproducible correlation between degradation state and cumulative UV-B radiant exposure (H). It is important to note, however, that microplastics aged in natural environments may undergo aging pathways distinct from those induced by dry, surface UV-B irradiation, due to additional stressors such as thermal cycling, mechanical abrasion, and environmental matrix effects. In aquatic and sedimentary environments, UV-B radiation can be significantly attenuated by water and dissolved or particulate matter, and further altered by surface biofilms, potentially decelerating photooxidation and fostering alternative surface chemistries. Consequently, the current library should be regarded as a reference for surface UV-driven aging under controlled conditions, rather than a direct replication of any specific environmental scenario. Despite these differences, the progression captured by our UV-B dose series aligns with widely reported signatures of environmental weathering (Table S4; [60,61,62,63,64,65]).
Studies comparing artificially aged and environmentally weathered microplastics underscore the emergence and growth of oxidation-related FTIR features, such as carbonyl and hydroxyl bands, and pronounced surface roughening and cracking as common outcomes of aging, although their relative contributions and kinetics are contingent upon polymer type and exposure setting. Notably, previous research also highlights that weathering can substantially alter IR/Raman spectra, and incorporating weathered spectra into reference libraries enhances the identification and interpretation of environmental particles. These observations underscore the utility of our dose-resolved dataset as a structured framework to contextualize the degradation state of unknown samples. Future research should explicitly validate the library by matching field-collected microplastics from defined environments, such as beach strandlines, surface waters, and sediments, to the closest dose state using combined FTIR/Raman markers and morphology [61,62,63,66].
Practical limitations exist under various environmental conditions. While a dose-resolved library offers a reproducible reference for UV-induced aging, its application as a universal “exposure clock” is constrained by the variability of real-world conditions. Surface UV-B intensity and spectral distribution exhibit significant variation with latitude, season, solar elevation, cloud/aerosol conditions, and shading. Additionally, environmental matrices such as water, sediment, and biofilms can significantly attenuate UV-B and alter surface chemistry. Factors such as temperature, humidity, wet–dry cycling, and mechanical abrasion further influence oxidation kinetics and fragmentation pathways. Moreover, environmental microplastics differ in shape/thickness, polymer formulation, and additive packages (e.g., UV stabilizers/antioxidants), which can modify the relationship between dose and spectral change. Consequently, the current library should be regarded as a controlled reference for surface UV-B photooxidation and as a framework that can be extended and validated using field-aged particles and alternative aging scenarios (e.g., immersion, wet–dry cycling, additive-containing materials). The observed stability order (HDPE; LDPE; PP; PVC; Nylon; PS) can be explained by considering (i) the presence/absence of intrinsic chromophores, (ii) the availability of weak C–H bonds (particularly tertiary sites), (iii) morphology-controlled oxygen transport, and (iv) secondary photochemistry of oxidation products (including Norrish reactions). For polyolefins, the saturated backbone is largely transparent to UV-B; thus, degradation is driven by trace chromophores (hydroperoxides/carbonyls/unsaturations and catalyst residues) that absorb above ~290 nm and initiate radical oxidation [36]. The greater apparent stability of HDPE compared to LDPE aligns with the role of semicrystalline morphology: HDPE typically exhibits higher crystallinity and fewer branches, reducing the fraction of oxygen-accessible amorphous material and potentially slowing oxidation kinetics, whereas LDPE contains more chain irregularities and amorphous regions that facilitate oxygen diffusion and radical propagation [14].
PP exhibits lower FTIR stability compared to PE due to the presence of tertiary carbon atoms, which facilitate hydrogen abstraction and the formation of tertiary peroxy radicals and hydroperoxides. The photolysis of hydroperoxides yields alkoxy radicals that readily undergo β-scission, resulting in chain scission and the formation of carbonyl-containing fragments. Notably, the newly formed ketones and other carbonyl products can undergo Norrish type I and II reactions under UV exposure, thereby amplifying fragmentation and oxidation [39]. This mechanistic amplification provides a chemical basis for the accelerated accumulation of carbonyl groups in PP compared to PE under similar UV-B doses. The low stability of PS is anticipated due to its aromatic structure; the phenyl ring acts as an intrinsic chromophore capable of absorbing UV radiation and forming excited states and benzyl-type radicals, which expedite oxygen uptake and the formation of oxidized functionalities, including carbonyl groups, as observable by FTIR [37]. In the case of PVC, the predominant early pathway under light and heat is dehydrochlorination, which generates conjugated polyenes that absorb more strongly and can further react, including oxidation, leading to discoloration and the growth of oxygenated groups. The released hydrogen chloride may also promote autocatalytic dehydrochlorination, which helps explain its relatively low apparent stability in FTIR oxidation markers [41]. For nylon (polyamides), photodegradation is influenced by the amide chromophore (n→π* transitions) and by preferential oxidation at positions adjacent to the amide functionality, with reported formation of additional hydroxyl and carbonyl-containing species, along with concomitant chain scission and chemi-crystallization [46]. Given that nylon contains strong intrinsic carbonyl (amide I) and related bands, changes in FTIR should be interpreted in terms of band evolution and the emergence of new oxidation features rather than merely the presence of carbonyl absorption. Overall, these structure–reactivity considerations support the use of FTIR-based ranking as a chemically meaningful descriptor of relative photooxidative susceptibility within the controlled UV-B dose series employed here [37].

4. Conclusions

Six types of microplastics (MPs), specifically HDPE, LDPE, PP, PS, PVC, and nylon, were subjected to degradation through ultraviolet (UV) exposure for a duration of seven months under controlled conditions simulating approximately 130 years of solar irradiation. The findings indicate that UV radiation induced degradation in all the polymers examined, although the degree of degradation varied according to the type of polymer. Based on the Fourier-transform infrared spectroscopy (FTIR) results, the susceptibility to photodegradation of the polymers can be ranked in ascending order as follows: HDPE, LDPE, PVC, PP, PS, and nylon.
In this study, a variety of techniques were employed to assess polymer degradation, enabling the identification of the most appropriate methods for determining the degradation time specific to each polymer category. The data indicate that HDPE and LDPE are the most stable polymers, as evidenced by their unchanged bulk structures in Raman spectra and consistent melting temperatures measured by DSC, even after prolonged exposure. SEM analysis further corroborated the stability of HDPE and LDPE. However, FTIR spectra revealed surface modifications due to the formation of oxidative functional groups. Consequently, FTIR emerged as the most suitable method for determining the degradation time of PE in environmental conditions among the methods evaluated. For PP, the reduction in intensity of its characteristic peaks in the Raman spectra suggested bulk changes only after the longest exposure period tested, indicating that FTIR is also the most appropriate method for determining its degradation time. Nylon exhibited significant surface alterations, reflected in FTIR spectral changes after just one year of exposure, consistent with morphological changes observed via SEM. Despite these alterations, the bulk structure of nylon remained stable, with Raman spectral changes observable only after approximately 130 years of exposure. Therefore, the percentage of crystallinity appears to be the best indicator of nylon’s degradation time. Regarding PVC, although IR spectroscopy detected some changes, Raman spectroscopy proved to be the most effective method for assessing its degree of degradation, revealing significant changes, including dechlorination. This photodegradation-induced dechlorination affected the polymer’s color, which can also serve as a degradation time marker. Finally, IR spectroscopy was deemed the most appropriate technique for determining PS degradation, as FTIR detected the most significant changes after the shortest exposure times.
The results obtained from this study contribute to the expanding body of literature on the photodegradation of microplastics (MPs) and enhance our understanding of the fate and potential environmental risks associated with MP pollution. Consequently, we have developed a library that serves as a tool for estimating the degradation time of various MPs present in the environment.

Supplementary Materials

The following supporting information is available for download at: https://www.mdpi.com/article/10.3390/microplastics5020062/s1, Figure S1 presents SEM images of non-irradiated PP, PVC, Nylon, PS, and photooxidized polymers after varying exposure durations. Figure S2 illustrates the discoloration of PVC over different exposure periods. Figure S3 provides DSC data for PVC and PS subjected to various durations of UV radiation. Table S1 details the evolution of the Carbonyl Index and Structural Loss Index for the six polymers analyzed over a simulated 130-year period. Carbonyl Index values, monitored for HDPE, LDPE, PP, and PVC, were derived from FTIR results by integrating the area of the carbonyl stretching vibration, normalized against the stable CH2 signal of the polymer backbone. Structural Loss Index values, monitored for Nylon and PS, quantify the relative depletion of the Amide II and aromatic ring breathing signals, respectively. Table S2 outlines the evolution of normalized Raman intensity ratios for the six polymers over a simulated 130-year period. For polyolefins (HDPE, LDPE, PP) and PVC, the ratio (I1640/I1440) tracks the increase in C=C unsaturation. For Nylon and PS, the ratio quantifies the relative depletion of characteristic signals (amide and aromatic ring modes, respectively) relative to the initial structure. All values were normalized using the CH2 signal as a stable internal standard. Table S3 describes the evolution of the Full Width at Half Maximum broadening (FWHM) for the six polymers over a simulated 140-year period. To isolate the effect of degradation on structural order, all values represent the net change relative to the control sample, calculated as ΔFWHM = FWHM tx − FWHM t0. Table S4: Cumulative UV-B radiant exposure was calculated as H ≈ E⋅tH\approx E\cdot tH ≈ E⋅t assuming continuous irradiation (24 h day−1). Outdoor “equivalent years” depend on the chosen reference UV-B climatology and are intended only as order-of-magnitude contextualization.

Author Contributions

Conceptualization, M.P.Y. and M.S.; methodology, M.P.Y. and M.S.; formal analysis, M.P.Y.; investigation, M.P.Y. and S.B.; data curation, M.P.Y. and S.B.; writing—original draft preparation, M.P.Y.; writing—review and editing, M.P.Y., M.Á.C., M.P.C. and M.S.; funding acquisition, M.Á.C. and M.P.C. All authors have read and agreed to the published version of the manuscript.

Funding

This work was supported by the Slovenian Research and Innovation Agency (ARIS) through the ARIS Strategic Projects/Gravitacija Call 2024 (Project No. 25-ARIS-STRP-01), and by the Marie Skłodowska-Curie Actions Postdoctoral Fellowships under the European Union’s Horizon Europe research and innovation programme (Grant Agreement No. 101244206). Additional financial support was provided through project FEDER-UCA-2024-A2-37 (DEGRABIOPLAS), as well as by the Spanish Ministry of Science and Innovation through the project PID2021-128600OB-I00; MCIN/AEI/10.13039/501100011033; ERDF. Additional support was also provided by the Science Committee of the Ministry of Science and Higher Education of the Republic of Kazakhstan (Grant No. AP22684296).

Data Availability Statement

Data supporting this study’s findings are available from the corresponding author upon reasonable request.

Conflicts of Interest

The authors declare that they have no known competing financial interests or personal relationships that could have appeared to influence the work reported in this paper.

Abbreviations

The following abbreviations are used in this manuscript:
HDPEHigh-density polyethylene
LDPELow-density polyethylene
PPPolypropylene
PVCPolyvinyl chloride
PSPolystyrene
SEMScanning Electron Microscopy
FTIRFourier Transform Infrared spectroscopy
DSCDifferential Scanning Calorimetry

References

  1. Siracusa, V.; Blanco, I. Bio-Polyethylene (Bio-PE), Bio-Polypropylene (Bio-PP) and Bio-Poly(ethylene terephthalate) (Bio-PET): Recent Developments in Bio-Based Polymers Analogous to Petroleum-Derived Ones for Packaging and Engineering Applications. Polymers 2020, 12, 1641. [Google Scholar] [CrossRef]
  2. Dai, L.; Karakas, O.; Cheng, Y.; Cobb, K.; Chen, P.; Ruan, R. A review on carbon materials production from plastic wastes. Chem. Eng. J. 2023, 453, 139725. [Google Scholar] [CrossRef]
  3. Bakir, A.; Desender, M.; Wilkinson, T.; Van Hoytema, N.; Amos, R.; Airahui, S.; Graham, J.; Maes, T. Occurrence and abundance of meso and microplastics in sediment, surface waters, and marine biota from the South Pacific region. Mar. Pollut. Bull. 2020, 160, 111572. [Google Scholar] [CrossRef]
  4. Yu, Q.; Hu, X.; Yang, B.; Zhang, G.; Wang, J.; Ling, W. Distribution, abundance and risks of microplastics in the environment. Chemosphere 2020, 249, 126059. [Google Scholar] [CrossRef]
  5. Fotopoulou, K.N.; Karapanagioti, H.K. Degradation of Various Plastics in the Environment. Handb. Environ. Chem. 2019, 78, 71–92. [Google Scholar] [CrossRef]
  6. Yuan, J.; Ma, J.; Sun, Y.; Zhou, T.; Zhao, Y.; Yu, F. Microbial degradation and other environmental aspects of microplastics/plastics. Sci. Total Environ. 2020, 715, 136968. [Google Scholar] [CrossRef]
  7. Yu, J.; Sun, L.; Ma, C.; Qiao, Y.; Yao, H. Thermal degradation of PVC: A review. Waste Manag. 2016, 48, 300–314. [Google Scholar] [CrossRef] [PubMed]
  8. Tamada, J.A.; Langert, R. Erosion kinetics of hydrolytically degradable polymers. Proc. Natl. Acad. Sci. USA 1993, 90, 552–556. [Google Scholar] [CrossRef]
  9. Pickett, J.E.; Gibson, D.A.; Gardner, M.M. Effects of irradiation conditions on the weathering of engineering thermoplastics. Polym. Degrad. Stab. 2008, 93, 1597–1606. [Google Scholar] [CrossRef]
  10. White, J.R. Polymer ageing: Physics, chemistry or engineering? Time to reflect. C. R. Chim. 2006, 9, 1396–1408. [Google Scholar] [CrossRef]
  11. Moezzi, M.; Yekrang, J.; Ghane, M.; Hatami, M. The effects of UV degradation on the physical, thermal, and morphological properties of industrial nylon 66 conveyor belt fabrics. J. Ind. Text. 2020, 50, 240–260. [Google Scholar] [CrossRef]
  12. Wu, H.; Zhao, Y.; Dong, X.; Su, L.; Wang, K.; Wang, D. Microstructural evolution of isotactic polypropylene during photo-oxidation. Polym. Degrad. Stab. 2021, 183, 109434. [Google Scholar] [CrossRef]
  13. Ding, L.; Yu, X.; Guo, X.; Zhang, Y.; Ouyang, Z.; Liu, P.; Zhang, C.; Wang, T.; Jia, H.; Zhu, L. The photodegradation processes and mechanisms of PVC and PET microplastic in aquatic environments. Water Res. 2022, 208, 117879. [Google Scholar] [CrossRef]
  14. Gardette, M.; Perthue, A.; Gardette, J.-L.; Janecska, T.; Pukánszky, B.; Therias, S. Photo- and thermal-oxidation of polyethylene: Comparison of mechanisms and influence of unsaturation content. Polym. Degrad. Stab. 2013, 98, 2383–2390. [Google Scholar] [CrossRef]
  15. López-Martínez, E.D.; Martínez-Colunga, J.G.; Ramírez-Vargas, E.; Sanchez-Valdes, S.; Ramos-de Valle, L.F.; Benavides-Cantu, R.; Rodríguez-Gonzalez, J.A.; Mata-Padilla, J.M.; Cruz-Delgado, V.J.; Borjas-Ramos, J.J.; et al. Influence of carbon structures on the properties and photodegradation of LDPE/LLDPE films. Polym. Adv. Technol. 2022, 33, 1727–1741. [Google Scholar] [CrossRef]
  16. Varghese, A.M.; Rangaraj, V.M.; Luckachan, G.; Mittal, V. UV Aging Behavior of Functionalized Mullite Nanofiber-Reinforced Polypropylene. ACS Omega 2020, 5, 27083–27093. [Google Scholar] [CrossRef]
  17. Daniloska, V.; Blazevska-Gilev, J.; Dimova, V.; Fajgar, R.; Tomovska, R. UV light induced surface modification of HDPE films with bioactive compounds. Appl. Surf. Sci. 2010, 256, 2276–2283. [Google Scholar] [CrossRef]
  18. Grigoriadou, I.; Paraskevopoulos, K.M.; Chrissafis, K.; Pavlidou, E.; Stamkopoulos, T.G.; Bikiaris, D. Effect of different nanoparticles on HDPE UV stability. Polym. Degrad. Stab. 2011, 96, 151–163. [Google Scholar] [CrossRef]
  19. Silva, A.B.; Bastos, A.S.; Justino, C.I.L.; da Costa, J.P.; Duarte, A.C.; Rocha-Santos, T.A.P. Microplastics in the environment: Challenges in analytical chemistry. Anal. Chim. Acta 2018, 1017, 1–19. [Google Scholar] [CrossRef]
  20. Rafieepour, A.; Ghamari, F.; Mohammadbeigi, A.; Asghari, M. Seasonal variation in exposure level of types A and B ultraviolet radiation. Ann. Med. Health Sci. Res. 2015, 5, 129–133. [Google Scholar] [CrossRef] [PubMed]
  21. Ainali, N.M.; Bikiaris, D.N.; Lambropoulou, D.A. Aging effects on LDPE, HDPE, PP and PS under UV irradiation: Decomposition mechanism by Py-GC/MS. J. Anal. Appl. Pyrolysis 2021, 158, 105207. [Google Scholar] [CrossRef]
  22. Cai, L.; Wang, J.; Peng, J.; Wu, Z.; Tan, X. Observation of the degradation of three types of plastic pellets exposed to UV irradiation. Sci. Total Environ. 2018, 628–629, 740–747. [Google Scholar] [CrossRef]
  23. Dong, M.; Zhang, Q.; Xing, X.; Chen, W.; She, Z.; Luo, Z. Raman spectra and surface changes of microplastics weathered under natural environments. Sci. Total Environ. 2020, 739, 139990. [Google Scholar] [CrossRef] [PubMed]
  24. Marcilla, A.; Beltrán, M.I.; Navarro, R. TG/FT-IR analysis of HZSM5 and HUSY deactivation during catalytic pyrolysis of polyethylene. J. Anal. Appl. Pyrolysis 2006, 76, 222–229. [Google Scholar] [CrossRef]
  25. Hedrick, S.A.; Chuang, S.S.C. Temperature programmed decomposition of polypropylene. Thermochim. Acta 1998, 315, 159–168. [Google Scholar] [CrossRef]
  26. Ramesh, S.; Yi, L.J. FTIR spectra of plasticized high molecular weight PVC–LiCF3SO3 electrolytes. Ionics 2009, 15, 413–420. [Google Scholar] [CrossRef]
  27. Olmos, D.; Martí, E.V.; González-Benito, J. New molecular-scale information on polystyrene dynamics in PS and PS–BaTiO3 composites. Phys. Chem. Chem. Phys. 2014, 16, 24339. [Google Scholar] [CrossRef]
  28. Martínez, K.I.; González-Mota, R.; Soto-Bernal, J.J.; Rosales-Candelas, I. Evaluation by IR spectroscopy of the degradation of commercial polyethylene. J. Appl. Polym. Sci. 2021, 138, 50158. [Google Scholar] [CrossRef]
  29. Dimassi, S.N.; Hahladakis, J.N.; Yahia, M.N.D.; Ahmad, M.I.; Sayadi, S.; Al-Ghouti, M.A. Degradation-fragmentation of marine plastic waste. Arabian J. Chem. 2022, 15, 104262. [Google Scholar] [CrossRef]
  30. Wang, C.; Xian, Z.; Jin, X.; Liang, S.; Chen, Z.; Pan, B.; Wu, B.; Ok, Y.S.; Gu, C. Photo-aging of PVC microplastic with natural organic acids. Water Res. 2020, 183, 116082. [Google Scholar] [CrossRef]
  31. Rijavec, T.; Strlič, M.; Cigić, I.K. Plastics in Heritage Collections: PVC degradation and characterization. Acta Chim. Slov. 2020, 67, 993–1013. [Google Scholar] [CrossRef]
  32. Li, Y.; Fan, Y.; Ma, J. Thermal, physical and chemical stability of porous polystyrene-type beads. Polym. Degrad. Stab. 2001, 73, 163–167. [Google Scholar] [CrossRef]
  33. Shi, X.; Chen, Z.; Liu, X.; Wei, W.; Ni, B.J. Photochemical behaviors of microplastics via reactive oxygen species. Sci. Total Environ. 2022, 846, 157498. [Google Scholar] [CrossRef] [PubMed]
  34. Mahdi, H.A. FTIR characterization of neat and UV-stabilized Nylon 6,6 films. J. Pure Appl. Sci. 2011, 24, 86–90. [Google Scholar]
  35. Holland, B.J.; Hay, J.N. Thermal degradation of nylon polymers. Polym. Int. 2000, 49, 943–948. [Google Scholar] [CrossRef]
  36. Huang, Z.; Wang, H. A review on photochemical effects of common plastics and their related applications. J. Polym. Sci. 2024, 62, 969–997. [Google Scholar] [CrossRef]
  37. Chamas, A.; Moon, H.; Zheng, J.; Qiu, Y.; Tabassum, T.; Jang, J.H.; Abu-Omar, M.; Scott, S.L.; Suh, S. Degradation Rates of Plastics in the Environment. ACS Sustain. Chem. Eng 2020, 8, 3494–3511. [Google Scholar] [CrossRef]
  38. Hirsch, S.G.; Barel, B.; Shpasser, D.; Segal, E.; Gazit, O.M. Correlating chemical and physical changes of photo-oxidized low-density polyethylene to the activation energy of water release. Polym. Test. 2017, 64, 194–199. [Google Scholar] [CrossRef]
  39. Lala, D.; Rabek, J.F. Destruction of carbonyl and hydroperoxide groups in oxidised polypropylene: Effect on photo-oxidation. Polym. Degrad. Stab. 1981, 3, 327–332. [Google Scholar] [CrossRef]
  40. Jensen, K.; Aiello, A.; Mitterhofer, S.; Barretta, C.; Oreski, G.; Stafford, C.; Gu, X. Surface photooxidation of polypropylene-based photovoltaic backsheets: A comprehensive spectroscopic investigation. Polym. Degrad. Stab. 2024, 232, 111132. [Google Scholar] [CrossRef]
  41. Yousif, E.; Haddad, R. Photostabilization of poly(vinyl chloride)–Still on the run. J. Taibah Univ. Sci. 2015, 9, 421–448. [Google Scholar] [CrossRef]
  42. Mohammed, A.; El-Hiti, G.A.; Yousif, E.; Ahmed, A.A.; Ahmed, D.S.; Alotaibi, M.H. Protection of Poly(Vinyl Chloride) Films against Photodegradation Using Various Valsartan Tin Complexes. Polymers 2020, 12, 969. [Google Scholar] [CrossRef] [PubMed]
  43. Pinto, L.F.A.; Goi, B.E.; Schmitt, C.C.; Neumann, M.G. Photodegradation of Polystyrene Films Containing UV-Visible Sensitizers. J. Res. Updates Polym. Sci. 2013, 2, 39–47. [Google Scholar] [CrossRef]
  44. Thanki, P.N.; Singh, R.P.; Mathur, G.N. Photo-oxidative degradation of nylon 66 under accelerated weathering. Polymer 1998, 39, 6363–6367. [Google Scholar] [CrossRef]
  45. Fechine, G.J.M.; Rabello, M.S.; Souto-Maior, R.M. Photo-irradiation induced morphological changes in nylon 66. Polymer 2001, 42, 535–538. [Google Scholar] [CrossRef]
  46. Sang, C.; Orimoto, Y.; Aoki, Y. Photodegradation Pathways of Aliphatic Polyamide through Conical Intersection between Ground and Excited States. J. Phys. Chem. A 2024, 128, 8865–8877. [Google Scholar] [CrossRef]
  47. Manoharan, R.; Chadha, S.; Ghiamati, E.; Nelson, W.H. UV-Excited Raman and Resonance Raman Spectra of Synthetic Polymers. Appl. Spectrosc. 1992, 46, 1176–1181. [Google Scholar] [CrossRef]
  48. Guo, X.; Lin, Z.; Wang, Y.; He, Z.; Wang, M.; Jin, G. Monitoring PP degradation under multiple extrusions by Raman spectroscopy. Polymers 2019, 11, 1698. [Google Scholar] [CrossRef]
  49. Stroe, M.; Cristea, M.; Matei, E.; Galatanu, A.; Cotet, L.C.; Pop, L.C.; Baia, M.; Danciu, V.; Anghel, I.; Baia, L.; et al. Optical Properties of Graphene Oxide/Polystyrene Composites. Molecules 2020, 25, 2419. [Google Scholar] [CrossRef]
  50. Kaczmarek, H.; Buffeteau, T.; Sourisseau, C. Photo- and bio-degradation in polyethylene, cellulose and blends studied by ATR-FTIR and Raman. J. Mater. Sci. 2005, 40, 4189–4198. [Google Scholar] [CrossRef]
  51. Menchaca, C.; Álvarez-Castillo, A.; Martínez-Barrera, G.; López-Valdivia, H.; Carrasco, H.; Castaño, V.M. Modification of nylon 6,12 by gamma irradiation. Int. J. Mater. Prod. Technol. 2003, 19, 521–529. [Google Scholar] [CrossRef]
  52. Matsui, H.; Schehr, C.A.; Valentini, J.J.; Weber, J.N. Resonance Raman investigation of Nylon 6,6 model compound degradation. Polymer 2001, 42, 5625–5632. [Google Scholar] [CrossRef]
  53. Ye, L.; Li, T.; Hong, L. Enhanced char formation in PVC thermal decomposition. Mater. Today Commun. 2021, 26, 102186. [Google Scholar] [CrossRef]
  54. Chrissafis, K.; Paraskevopoulos, K.M.; Pavlidou, E.; Bikiaris, D. Thermal degradation mechanism of HDPE nanocomposites. Thermochim. Acta 2009, 485, 65–71. [Google Scholar] [CrossRef]
  55. Valadez-Gonzalez, A.; Cervantes-Uc, J.M.; Veleva, L. Mineral filler influence on HDPE photo-oxidation. Polym. Degrad. Stab. 1999, 63, 253–260. [Google Scholar] [CrossRef]
  56. Kaci, M.; Sadoun, T.; Cimmino, S. Crystallinity measurements of LDPE under natural weathering. Int. J. Polym. Anal. Charact. 2001, 6, 455–464. [Google Scholar] [CrossRef]
  57. Rwei, S.-P.; Ranganathan, P.; Lee, Y.-H. Isothermal Crystallization Kinetics Study of Fully Aliphatic PA6 Copolyamides: Effect of Novel Long-Chain Polyamide Salt as a Comonomer. Polymers 2019, 11, 472. [Google Scholar] [CrossRef]
  58. Yano, S.; Murayama, M. Photo-oxidation of nylon 6 above 300 nm. Polym. Photochem. 1981, 1, 177–190. [Google Scholar] [CrossRef]
  59. Shackleford, A.S.D.; Williams, R.J.; Brown, R.; Wingham, J.R.; Majewski, C. Degradation of Laser Sintered polyamide 12 parts due to accelerated exposure to ultraviolet radiation. Addit. Manuf. 2021, 46, 102132. [Google Scholar] [CrossRef]
  60. Campanale, C.; Savino, I.; Massarelli, C.; Uricchio, V.F. Fourier Transform Infrared Spectroscopy to Assess the Degree of Alteration of Artificially Aged and Environmentally Weathered Microplastics. Polymers 2023, 15, 911. [Google Scholar] [CrossRef] [PubMed]
  61. Fernández-González, V.; Andrade-Garda, J.M.; López-Mahía, P.; Muniategui-Lorenzo, S. Impact of weathering on the chemical identification of microplastics from usual packaging polymers in the marine environment. Anal. Chim. Acta 2021, 1142, 179–188. [Google Scholar] [CrossRef]
  62. Binda, G.; Kalčíková, G.; Allan, I.J.; Hurley, R.; Rødland, E.; Spanu, D.; Nizzetto, L. Microplastic aging processes: Environmental relevance and analytical implications. TrAC Trends Anal. Chem. 2024, 172, 117566. [Google Scholar] [CrossRef]
  63. Phan, S.; Padilla-Gamiño, J.L.; Luscombe, C.K. The effect of weathering environments on microplastic chemical identification with Raman and IR spectroscopy: Part I. Polyethylene and polypropylene. Polym. Test. 2022, 116, 107752. [Google Scholar] [CrossRef]
  64. De Frond, H.; Rubinovitz, R.; Rochman, C.M. μATR-FTIR Spectral Libraries of Plastic Particles (FLOPP and FLOPP-e) for the Analysis of Microplastics. Anal. Chem. 2021, 93, 15878–15885. [Google Scholar] [CrossRef]
  65. Anshari, R.; Tsuboi, M.; Sato, H.; Tashiro, K.; Ozaki, Y. Raman and ATR-FTIR unmask crystallinity changes and carboxylate group and vinyl group accumulation in natural weathering polypropylene microplastics. Sci. Rep. 2025, 15, 2518. [Google Scholar] [CrossRef] [PubMed]
  66. Marica, I.; Pînzaru, S.C. A Raman spectral database of naturally aged plastics: A proof-of-concept study for waste plastic sorting. J. Raman Spectrosc. 2023, 54, 305–313. [Google Scholar] [CrossRef]
Figure 1. SEM images of non-irradiated HDPE, LDPE and photooxidized polymers after different exposure times.
Microplastics 05 00062 g001
Figure 2. FTIR spectra of non-irradiated HDPE, LDPE, PP, PVC, nylon, PS and photooxidized polymers after different exposure times. Shaded regions indicate the FTIR bands exhibiting the greatest changes during aging.
Microplastics 05 00062 g002
Figure 3. Comparative evolution of the Carbonyl Index for HDPE, LDPE, PP, and PVC.
Microplastics 05 00062 g003
Figure 4. Comparative evolution of the Structure Loss Index for HDPE, LDPE, PP, and PVC.
Microplastics 05 00062 g004
Figure 5. Raman spectra of non-irradiated polymers and photooxidized polymers after different exposure times.
Microplastics 05 00062 g005
Figure 6. Comparative evolution of the Intensity Ratio for HDPE, LDPE, PP, PVC, Nylon and PS.
Microplastics 05 00062 g006
Figure 7. Comparative evolution of the Δ FWHM for HDPE, LDPE, PP, PVC, Nylon and PS.
Microplastics 05 00062 g007
Figure 8. DSC of LDPE, PP and Nylon for different times of UV radiation.
Microplastics 05 00062 g008
Table 1. Main adsorption FTIR bands and their assignments.
PolymerBand (cm−1)Assignment
HDPE [20]2915Asymmetric stretching vibration CH2
2848Symmetric stretching vibration CH2
1462Bending vibrations CH2
713Rocking vibrations CH2
LDPE [23]2900Asymmetric stretching vibration CH2
2820Symmetric stretching vibration CH2
1462Bending vibration CH2
1365Bending mode CH3 terminal groups
722Rocking vibration CH2
PP [24]3000–2800Asymmetric stretching vibration CH3; asymmetric stretching vibration CH2; symmetric stretching vibration CH3; symmetric stretching vibration CH2
1470Asymmetric bending vibration CH3
1370Symmetric bending vibration CH3
1162Rotation vibration C-H
985Rocking vibration CH3
970, 835Deformation C-C bonding
PVC [25]2972Asymmetric stretching vibration CH2
2910Symmetric stretching vibration CH2
1440Bending vibrations CH
1250Bending vibrations CH (near Cl)
1100–930C-H stretching bond backbone chain
680–600Bending vibration C-Cl
PS [26]3026Aromatic CH stretching vibration
2920Asymmetric stretching vibration CH2
2850Symmetric stretching vibration CH2
1598Aromatic C=C vinyl group stretching
1492Bending vibration benzene ring
752Bending vibration substituted benzene derivative
Nylon [27]3420NH2 stretching vibration
3300N-H stretching vibration
2940Asymmetric stretching vibration CH2
2865Symmetric stretching vibration CH2
1640Amide I
1545, 1455Amide II
1265Amide III
Table 2. Main Raman bands and their assignments.
PolymerBand (cm−1)Assignment
HDPE, LDPE [35]2881, 2846CH2 asymmetric stretching, CH2 symmetric stretching
1438, 1293CH2 bending
1127, 1060C-C stretching
PP [47]1454CH2 bending, CH3 asymmetric bending
1335CH stretching, CH3 bending
1155C-C stretching, CH bending
977C-C stretching
813C-C stretching
PVC [22]1440CH2 bending
700C-Cl stretching
640C-Cl stretching
PS [48]1445CH bending
1180C-C asymmetric stretching
1154C-C symmetric stretching
1028C-C symmetric stretching in the benzene ring
999benzene ring breathing
789C-H bending (out of plane)
Nylon [49]1630N-H stretching amide I
1440CH2 bending
1380CH2 wagging
1300CH2 twisting
1213N-H wagging
1125, 1077, 1060C-C stretching
930C-CO stretching
Table 3. Melting temperature (Tm), Enthalpy of Fusion (∆Hm) and Degree of Crystallinity (Xc) determined by DSC. Nylon samples simulating 40 years of irradiation were lost accidentally.
SampleLDPEPPNylon
Tm∆HmXcTm∆HmXcTm∆HmXc
°CJ/g%°CJ/g%°CJ/g%
Reference110.8198.133.37162.3663.8330.82223.6462.6433.32
1 month114.0996.9932.99162.8483.1840.16222.9262.0933.03
6 month113.8495.6232.52162.9684.5640.83222.7560.6932.28
1 year111.47105.335.82161.3981.7739.48223.1360.9832.44
2 years111.378.7126.77165.6277.8137.57222.9261.7932.87
5 years110.68100.634.22161.6882.1139.65223.1962.7633.38
10 years110.85100.734.25161.8079.1338.21223.0565.6634.93
20 years111.1791.8931.26161.0581.2839.25224.0364.6534.39
40 years111.36106.736.29162.2878.8638.08---
60 years111.18102.734.93161.3877.2137.28223.1765.9835.10
80 years114.27110.537.59161.1580.2538.75222.7564.9134.53
100 years111.36117.539.97160.9291.5644.21223.3666.3535.29
130 years114.14126.442.99157.49102.349.40222.3866.0035.11
Disclaimer/Publisher’s Note: The statements, opinions and data contained in all publications are solely those of the individual author(s) and contributor(s) and not of MDPI and/or the editor(s). MDPI and/or the editor(s) disclaim responsibility for any injury to people or property resulting from any ideas, methods, instructions or products referred to in the content.