Article

Dynamics of Physiological Changes of Shiga Toxin-Producing Escherichia coli O157:H7 on Romaine Lettuce During Pre-Processing Cold Storage, and Subsequent Effects on Virulence and Stress Tolerance

by
Dimple Sharma
1,
Joshua O. Owade
2,
Corrine J. Kamphuis
1,
Avery Evans
1,
E. Shaney Rump
1,
Cleary Catur
1,
Jade Mitchell
2 and
Teresa M. Bergholz
1,*
1
Department of Food Science and Human Nutrition, Michigan State University, East Lansing, MI 48224, USA
2
Department of Biosystems and Agricultural Engineering, Michigan State University, East Lansing, MI 48224, USA
*
Author to whom correspondence should be addressed.
Appl. Microbiol. 2025, 5(2), 45; https://doi.org/10.3390/applmicrobiol5020045
Submission received: 19 March 2025 / Revised: 16 April 2025 / Accepted: 28 April 2025 / Published: 6 May 2025
(This article belongs to the Special Issue Applied Microbiology of Foods, 3rd Edition)

Abstract

:
If lettuce is contaminated in the field, Shiga toxin-producing E. coli (STEC) O157:H7 can survive through the distribution chain. Prolonged cold storage during transportation may impact pathogen physiology, affecting subsequent stress survival and virulence. Greenhouse-grown Romaine lettuce, inoculated with three STEC O157:H7 strains, was harvested after 24 h and stored at 2 °C for 5 d following 4 h at harvest temperature (9 °C or 17 °C). Culturable, persister, and viable but non-culturable (VBNC) cells were quantified. Virulence was evaluated using Galleria mellonella and acid tolerance at pH 2.5 and tolerance to 20–25 ppm free chlorine were quantified. Colder harvest temperature (9 °C) before cold storage led to greater transformation of STEC O157:H7 into dormant states and decreased virulence in most cases. Increasing length of cold storage led to decreased virulence and acid tolerance of STEC O157:H7 on lettuce, while having no significant effect on chlorine tolerance. These findings highlight that entry of STEC O157:H7 into dormant states during harvest and transportation at cold temperatures leads to decreased stress tolerance and virulence with increasing cold storage. Changes in STEC O157:H7 physiology on lettuce during cold storage can be integrated into risk assessment tools for producers, which can assist in identifying practices that minimize risk of STEC O157:H7 from consumption of lettuce.

1. Introduction

Fresh produce is consumed widely and has been associated with human illnesses due to contamination by pathogens [1,2]. Of all foodborne illnesses linked to identified pathogens that occurred in the U.S. between 1998 and 2020, 9.18% are linked to leafy greens. Romaine lettuce, iceberg lettuce, and other lettuces account for 60.8% of leafy green-associated outbreaks, and 75.7% of leafy green-associated illnesses [2]. It is estimated that 19.8% of Shiga toxin-producing E. coli (STEC) outbreaks from 1998 to 2020 have been associated with Romaine lettuce, resulting in more than 12,000 illnesses annually in the United States [2]. In recent years, multiple STEC outbreaks attributed to Romaine lettuce have been reported [3,4,5,6,7,8,9,10], and some strains associated with these outbreaks have recently been classified as recurring, emerging, or persistent by the CDC [6].
Lactuca sativa L. (lettuce) is the third most consumed crop in the U.S. [11]. The production of leafy greens in the U.S. largely occurs in Arizona (~30%) and California (~70%) [12,13]. After harvesting, lettuce is transported to cooling centers and is chilled [14,15]. Once cooled, field-packed lettuce is transported for distribution and sale. Lettuce designated for further processing is transported to a processing facility and differences in transportation time can occur prior to processing [16,17]. For lettuce processing facilities located outside the West Coast, long haul transportation is used, where the truck temperature is maintained at <5 °C [16,17]. When lettuce is stored at <8 °C, with low relative humidity (<55%), STEC O157:H7 is unable to grow, although it can survive [18,19,20]. STEC O157:H7 can tolerate cold stress when present on lettuce, surviving at 5–6 °C for 10–14 days [21,22], which is within the expected shelf-life of romaine lettuce (12–16 days) [23].
In addition to cold stress, STEC present on lettuce experiences multiple stresses during post-harvest handling. Once lettuce arrives at a processing facility, it is trimmed, cored, cut, washed, centrifuged, and then packaged for further distribution and sale [24]. Sanitizers are included in wash water to reduce cross contamination. Commonly used sanitizers for fresh produce wash water are chlorine, peroxyacetic acid (PAA), and ozone [25,26,27]. All three of these sanitizers pose oxidative stress to microbes, and PAA also poses a low pH stress [26]. STEC O157:H7 levels on lettuce can be reduced by approximately 1.5 to 5 log CFU/g due to sanitizer treatment; this variability is likely due to differences in organic load in the wash water, as well as the potential for bacterial adherence and/or internalization [28,29,30]. STEC O157:H7 that survives on lettuce after washing with sanitizers can persist during cold storage [31]. While studies have shown that STEC on lettuce can survive refrigeration temperatures and exposure to sanitizers during washing, it is not known if the length of time in cold storage prior to washing influences STEC tolerance to wash water sanitizers.
Under unfavorable conditions for prolonged periods of time, bacteria can transition to dormant states, where metabolic activity is reduced [23]. The process of dormancy involves a spectrum of physiological transformations, spanning from actively proliferating cells to stationary phase cells, and culminating in the formation of persister cells or VBNC cells [23]. Persister cells can be formed during the exponential or stationary phase and have the potential to transition out of the persister state or into the VBNC state [23]. E. coli can enter into dormant states during heat treatment [32], which can further induce protein aggregation [33]. Studies have shown that STEC O157:H7 can transform into dormant states such as persister and VBNC cells under pre-harvest conditions on leafy greens [34,35]. When STEC O157:H7 was exposed to 8 °C in the phyllosphere of pre-harvest lettuce, transformation into VBNC cells occurred 8–9 days post-inoculation [36]. In post-harvest conditions, STEC in spinach wash water transformed into persister cells at 15 °C [35]. STEC inoculated into the process water transformed into VBNC cells when process water was treated with chlorine [37]. These studies suggest that STEC can alter its physiological state by entering dormant states when presented with stress, but whether the length of cold storage impacts the entry into dormant states on lettuce is still unknown.
When bacteria experiences cold stress, translation efficiency is reduced due to RNA folding, with other changes such as reduced membrane permeability, lower substrate diffusion rates, and disrupted ion equilibrium [38,39,40]. Activation of the general stress response occurs when temperatures are shifted from 37–35 °C to 25–14 °C [41,42,43]. Various cold shock proteins (CSPs) are involved in adaptation to cold temperatures. A class of CSPs, called the RNA chaperones, keep the RNA single-stranded during initial stages of cold stress [40,44]. At temperatures of 4 °C and 18 °C, cspA and cspG, respectively, are reported to be upregulated in STEC O157:H7 in lettuce lysates [45,46]. Expression of cspH and survival of persisters is known to be associated [46]. CspD is regulated by (p)ppGpp independently of RpoS [47] and is also known to play a role in persister cell formation [48]. This could be one of the pathways that STEC O157:H7 utilizes to enter into the persister state in response to cold stress.
Stresses similar to those imposed on lettuce, as well as entry into dormant states, are known to impact the virulence potential of STEC. STEC O157:H7 on lettuce stored at 4 °C for 9–10 days shows higher expression levels of virulence-related genes stx1, eae, ehxA, and fliC [49,50]. For STEC O157:H7, which entered the VBNC state on lettuce at 8 °C, Shiga toxin was still detected, even when culturable cells were not present, indicating that the STEC retained the potential for virulence [36]. Together, these data demonstrate that cold temperatures can impact STEC O157:H7 VBNC formation and virulence, although it is unclear if the length of time in cold storage on lettuce may influence virulence potential.
Lettuce transported from the West Coast to the East Coast may be held for days at refrigeration temperature during transport prior to processing, likely impacting pathogen physiology [16,17]. Physiological changes such as entering a dormant state can protect cells from environmental stress [23]. While STEC O157:H7 can enter the persister or VBNC state on lettuce [23,34,35,36], the extent to which this occurs during harvest, cooling, and refrigerated transport is unknown. Changes in the physiological state of STEC O157:H7 have the potential to impact risk of illness associated with contaminated lettuce, due to alterations in tolerance to sanitizers in wash water as well as virulence properties. The objectives of this study were to investigate the effect of the length of time in cold storage on (a) the physiological state of STEC O157:H7 on Romaine lettuce; (b) subsequent acid tolerance and chlorine tolerance; and (c) virulence of STEC O157:H7.

2. Materials and Methods

2.1. Experimental Design

Greenhouse grown Romaine lettuce plants were used for this study. Plants in pots were considered pre-harvest and three STEC O157:H7 strains were inoculated individually onto lettuce and incubated in a plant growth chamber. A day later, inoculated plants were harvested and incubated at the harvest temperature for 4 h. Then, they were transferred to cold storage of 2.2 °C for 5 d. The parameters described below were measured before and after harvest temperature and every day for 5 d of cold storage. For each strain evaluated, 3 biological replicates were inoculated onto lettuce plants in duplicate for each sampling point, for a total of 48 lettuce plants for each harvest temperature (9 °C or 17 °C). In total, 288 lettuce plants were inoculated and evaluated (3 strains ×3 biological replicates ×2 technical replicates ×8 sampling points ×2 harvest temperatures).

2.1.1. Greenhouse Propagation of Romaine Lettuce

Romaine lettuce plants, Lactuca sativa var. Solid King (Seedway, Hall, NY, USA) and Parris Island (Gardner’s Basics, Spanish Forsk, UT, USA), were grown in the greenhouse complex at Michigan State University. The temperature was maintained between 18–24 °C with 14/10 h light/dark periods. Miracle Gro potting mixture (Scotts Miracle-Gro, Marysville, OH, USA) was used, along with Peter’s Excel pH low 15-7-25 fertilizer (ICL Fertilizers, George, UT, USA). Plants used for these studies were 45–55-d old.

2.1.2. STEC Strains

Three STEC O157:H7 strains used were obtained from Michigan Department of Health and Human Services (MDHHS) and were associated with the following outbreaks: Yuma, Arizona in 2018 (PNUSAE013458) [9], Central Coast, California in 2018 (PNUSAE019890) [8], and Salinas, California in 2019 (PNUSAE044369) [10].

2.1.3. Selection of Rifampicin-Resistant Isolates

To distinguish inoculated pathogen from native microbes of lettuce, the STEC strains were selected for resistance to rifampicin (Thermo SCIENTIFIC, Waltham, MA, USA) by sequentially exposing them to increasing concentrations of rifampicin as described previously [51]. The strain stocks stored in 15% glycerol at −80 °C were streaked on to Luria Bertani (LB) plates (Invitrogen, Carlsbad, CA, USA) and incubated for 24 h at 37 °C. A single colony was used for incubating 5 mL LB broth with 4 µg/mL rifampicin, which was incubated at 37 °C with shaking for 24 h. A 100 µL aliquot was then transferred to 50 mL LB broth supplemented with 40 µg/mL rifampicin and incubated at 37 °C for 24 h with shaking. Next day, a 100 µL from this culture was transferred to a 50 mL LB broth supplemented with 80 µg/mL rifampicin and grown at 37 °C with shaking for 24 h. The next day, a loopful culture was streaked onto LB plates supplemented with 80 µg/mL rifampicin for confirmation of growth. From the overnight culture, 800 µL was added to 200 µL of 75% glycerol and stored at −80 °C for use throughout the experiments.

2.1.4. Spray Inoculation of Lettuce

For every experiment, rifampicin-resistant bacterial stock cultures from −80 °C were streaked on to tryptic soy agar plates (Neogen, Lansing, MI, USA) supplemented with 80 µg/mL rifampicin (TSA+ rif) and incubated for 24 h at 37 °C. A single colony from the plates was used to inoculate 5 mL LB+ rifampicin broth, which was then incubated at 37 °C for 18 h with shaking at 150 rpm. For subsequent inoculation, a 100 µL culture was inoculated into 100 mL LB+ rifampicin, and incubated for 18 h at 37 °C. The culture was centrifuged at 8000 rpm for 15 min at 4 °C and the pellet was suspended in 50 mL PBS. A hand-held sprayer (Miles Scientific, Newark, DE, USA) was used to spray inoculate the Romaine lettuce plants individually in pots in a biosafety cabinet, with a target of 5.5–6 log CFU/g of STEC O157:H7. It was left to dry for 2 min, and once all the plants were inoculated, they were transferred to a Caron plant growth chamber model 7303-22-1 (Caron, Marietta, OH, USA) at 17 °C for 24 h. Twenty-one plants were inoculated for each strain, each biological replicate, and each harvest temperature.

2.1.5. Lettuce Harvesting

After 24 h at 17 °C in the growth chamber, lettuce plants in pots were removed and the head of lettuce was harvested by cutting at the base with a sterile knife. After harvesting, lettuce heads were placed into 81.2 cm × 50.8 cm × 25.4 cm grated plastic bins (Grainger, Lake Forest, IL, USA) lined with a plastic bag, and these grated bins were wrapped loosely with another plastic bag. They were then returned to the Caron growth chamber at the harvest temperature (9 °C or 17 °C) for 4 h. Harvest temperatures and time were determined from industry supplied data (see Section 2.3).

2.1.6. Cold Storage

The bins with harvested lettuce were transferred to cold storage for 5 d at 2.2 °C. Temperature data were collected from the time of harvest to the last day of cold storage using an external stainless steel temperature probe (Thermo SCIENTIFIC, Waltham, MA, USA).

2.2. Sample Collection

Lettuce samples were collected at the time of inoculation to enumerate culturable cells. For every sampling point, one head of lettuce was used as a unit. A sterile knife was used to chop lettuce on a sterile cutting board. It was first sliced horizontally, then diagonally twice. Samples were collected before harvest, after harvest, and every day at the same time during each day of 5 d of cold storage. The parameters measured at these time points were culturable cells, injured cells, persister cells, VBNC cells, acid tolerance, chlorine tolerance, and virulence, as described below.

2.2.1. Culturable Cells

To measuring culturable cells, 10 g of inoculated lettuce was homogenized in Seward STOMACHER 400 (Seward, Worthing, UK) for 1 min in a 7.5″ × 12″ filter Whirl-Pak stomacher bag containing 90 mL of phosphate buffer saline (PBS) solution at pH 7.2. A 100 µL sample was used to make appropriate dilutions and plated onto TSA+ rif plates. Plates were incubated at 37 °C for 18–20 h.

2.2.2. Injured Cells

Injured cells were measured at every sampling point. A 100 µL sample was taken from the PBS and inoculated lettuce slurry as described in Section 2.2.1, and appropriate dilutions were made. Dilutions were plated onto selective media of MacConkey Sorbitol + rif on plates. Plates were incubated at 37 °C for 18–20 h. The cells that were counted using MacConkey Sorbitol + rif plates were the cells that were not injured. The cells that did not survive out of a total of culturable cells were injured cells. Injured cells were calculated by subtracting the number of surviving cells from the number of culturable cells and expressed as a percentage.

2.2.3. Persister Cells

The minimum inhibitory concentration (MIC) of antibiotic ciprofloxacin for the STEC O157:H7 strains was determined based on the concentration of ciprofloxacin at which cell growth did not occur. This was calculated by measuring turbidity during 18 h incubation at 37 °C using a plate reader (Molecular Devices, San Jose, CA, USA). MIC was measured for each strain individually. The MIC for PNUSAE013458 is 0.064 ng/µL, for PNUSAE019890 and PNUSAE044369 is 0.128 ng/µL. The 10× MIC for the identification of persister cells is calculated to be 0.64 ng/µL for PNUSAE013458, and 1.28 ng/µL for PNUSAE019890 and PNUSAE044369.
The methodology for measuring persister cells was adapted from the method described by Thao et al. [35]. An aliquot of 1 mL in an Eppendorf tube was taken from the homogenate of 10 g of inoculated lettuce and PBS as described in Section 2.1 and was exposed to 10× MIC of ciprofloxacin. This was done by adding 5 µL of 1000× concentrated stock solution of ciprofloxacin, i.e., 0.64 mg/mL or 1.28 mg/mL, depending upon the strain. This mixture was incubated at 37 °C for 3 h with shaking at 150 rpm. Later, a 3 mL syringe with a removable filter head (Sterilitech, Aurburn, WA, USA) with a 0.22 µm filter (Isopore, Millipore Sigma, Burlington, MA, USA) was used capture the bacterial cells. The filter was then added to 1 mL of PBS solution and vortexed (Thermofisher Scientific, Waltham, MA, USA) at 2000 rpm for 3 min to suspend the cells in PBS solution. Appropriate dilutions were made and plated on TSA+ rif plates.

2.2.4. VBNC Cells

A 10 mL sample was taken from inoculated lettuce and PBS homogenate as described in Section 2.1 and centrifuged at 10,000 rpm at 8 °C for 10 min. The supernatant was discarded, and 1 mL of PBS solution was added to suspend the cells by mixing with a pipette and shaking. To make the final concentration of 50 µM, 3.125 µL of propidium monoazide (PMA) (Biotium, Freemont, CA, USA), and 250 µL of PMA enhancer (Biotium, Freemont, CA, USA), was added to the cell suspension. The samples were stored in the dark before exposure to UV light for 30 min in a PMA-LiteTM device (Biotium, Fremont, CA, USA). This is a LED light box that photoactivates the samples treated with photoreactive devices such as PMA, that crosslinks with dead cell DNA, and will only let live cell DNA amplify. Every 10 min, the tubes that were kept in the PMA-LiteTM device were vortexed in minimum lighting at 2000 rpm for 5 s.
To confirm that the PMA concentration effectively discriminated between viable and dead cells, a control sample of inactivated cells was included. Cells from the three strains were collected by centrifugation, suspended in 1 mL of 70% ethanol for inactivation, and vortexed for one minute. PMA and PMA enhancer were added at the same concentrations as in test samples, and the mixture was exposed to photoactivation as described above. Optimal PMA concentration was confirmed when no amplification was observed by qPCR, and culturable counts yielded non-detects.
A Powerlyzer kit (Qiagen, Germantown, MD, USA) was used for DNA extraction. The samples to be sent to Michigan State University (MSU) core genomics facility for quantitative PCR (qpCR), were prepared by adding SYBR green (Qiagen, MD, USA), qPCR grade water (ThermoSCIENTIFIC), primers targeting ORF Z3276 gene [52] viz., forward—5′-GCACTAAAAGCTTGGAGCAGTTC and reverse—5′-AACAATGGGTCAGCGGTAAGGCTA in the ratio of 10:6:2. A 2 µL sample was added to this working solution of 18 µL, which was read in QuantStudio 7 Flex qPCR (Thermo Fisher SCIENTIFIC, Waltham, MA, USA) at MSU core genome facility. These data were used for calculating the total number of viable cells using standard curves (R2 > 90%), previously prepared with known cell concentrations.

2.2.5. Acid Tolerance

This method utilizes synthetic gastric fluid (SGF) [53] at pH 2.5. The SGF is freshly prepared 1 h prior to the experiment and serves as a representative simulation of the acidic environment found in the human stomach. Ten grams of lettuce was added to a stomacher bag and 90 mL SGF was added to that bag. It was homogenized for 1 min at 230 revolutions per minute (rpm) speed in filter bag in a Seward STOMACHER 400 (Weber SCIENTIFIC, Hamilton, NJ, USA). Serial dilutions were made and plated on TSA+ rif plates, to enumerate the initial level of cells. These inoculated lettuce containing bags were incubated at 37 °C for 2 h. After incubation, appropriate dilutions were made from the bag and plated on TSA+ rif plates, which were incubated at 37 °C for 24 h before enumeration.

2.2.6. Chlorine Tolerance

For test samples, 40 g of inoculated lettuce was added in a mesh bag and the bag was dropped in 1 L of 0.05M KH2PO4 solution (pH 6.8) and exposed to 20–25 ppm of chlorine solution (XY-12) for 30 s. Free chlorine was measured using an ORION AQUAfast AQ3700 instrument (Thermo SCIENTIFIC, Waltham, MA, USA) with the test kit-AC2071. Chlorine was measured before and after the lettuce bag was dropped in the 1 L solution. After chlorine exposure, the lettuce in the mesh bag was placed in a stomacher bag, and 90.4 µL solution of sodium thiosulfate was added to neutralize the chlorine. For the negative control, 40 g of inoculated lettuce was added to 160 mL of 0.05 M KH2PO4 solution. Appropriate dilutions were made and plated on TSA+ rif plates, which were incubated at 37 °C for 24 h before enumeration.

2.2.7. Virulence Assays

The virulence of STEC O157:H7 strains was determined using killing assays of Galleria mellonella larvae (Speedway, WI). These methods were adapted from another research paper [54]. G. mellonella larvae that arrived within 5–7 d were used for the assay and were stored at 15 °C until the time of experiments. To perform the baseline assays for determining LD50 (lethal dose at which 50% population is killed), G. mellonella larvae were injected with each bacterial strain. In this case, a total of 10 larvae were used for each strain, each harvest temperature, and each of the three biological replicates. The inoculum was prepared by streaking the bacterial freezer stocks to a TSA+ rif plate, overnight incubation at 37 °C, inoculating 5 mL TSB with one single colony from the overnight grown culture, incubating the inoculated broth at 37 °C for 18 h at 150 rpm shaking, centrifuging at 8000 rpm for 10 min, and resuspending in PBS solution. Bacterial dilutions were made ranging from 102 to 108 cells/mL for larvae inoculations. Larvae were inoculated at the third posterior pro-leg with insulin syringes with a TRIDAK STEPPER. Ten larvae each were pierced with an empty needle, and with PBS solution, used as negative controls. After inoculation, the larvae were incubated at 37 °C for 5 d in the dark. They were scored every 24 h ± 0.5 h, counting the number of live larvae that were pale yellow. The dead black larvae were removed every time, while counting. These larvae did not respond to any stimulation [55]. These baseline data were collected for each strain in three biological replicates, and later used as an input for Probit regression model analysis to calculate the LD50 [56]. LD50 values were used to choose the optimum inoculum during the experiment for three strains and two harvest temperatures, which was 20 mL sample and a 1/10th dilution of sample. The LD50 values for the Yuma 2018, Central Coast 2018 and Salinas 2019 strains were 4.5, 6, and 6.7 log CFU/g respectively. During the experiments, from the inoculated lettuce and PBS homogenate from 2.2.1, 1 mL and 1/10th dilution of the same was used to inoculate larvae with 20 µL solutions. Larvae pierced with an empty insulin needle and with PBS were used as negative controls. The virulence assays were conducted in three biological replicates for each strain and each harvest temperature.

2.3. Industry Supplied Data

Time and temperature profile data were sourced from an industry partner, detailing the harvesting, transport and cooling conditions of Romaine lettuce. Temperature probes were placed in harvest bins and the temperature was recorded from the time of harvest to the time of cooling. The time and temperature profile data were collected for 3 yr and 2 mo (February 2016 to April 2019). Of the collected datapoints, 5615 were for Romaine lettuce grown and harvested in the Salinas, California growing region, and 4623 for the Yuma, Arizona growing region. The data were analyzed in the R programming language [57] for summaries and probability distributions of the data. The temperature and times for harvesting, transportation and cooling were first checked for outliers and distributions using boxplots and histograms, respectively. Using the group function, the median, upper and lower quartile of these data were generated for the different locations. Differences in the time and temperature data for the two locations were evaluated using pairwise tests, and where the data were not normal, Mood’s median test was used. Time taken to cool the lettuce at the cooling center was generated from the difference between the time at the start of cooling and at the end of cooling. Time taken from harvest to cooling was computed by calculating the difference between the time at the end of harvesting and the start of cooling.

2.4. Data Analysis

2.4.1. Generating Standard Curve for the VBNC Cells

To generate standard curves for qPCR, different bacterial concentrations (108, 107, 106, 105 and 104) were prepared. The culture was prepared as described in Section 2.2.1 and then diluted to make appropriate dilutions. The above-mentioned dilutions of the bacteria were added to stomacher bags containing 10 g of lettuce. PBS was added to make the liquid portion up to 90 mL including the inoculations. Samples were homogenized at 230 rpm for 1 min in Seward STOMACHER 400 (Weber SCIENTIFIC, Hamilton, NJ, USA), and 10 mL sample was collected, which was then centrifuged at 10,000 rpm for 10 min at 8 °C. The pellet was suspended in 1 mL of PBS, 250 µL of PMA enhancer (Biotium, USA), and 3.125 µL and 4.688 µL of PMAxx dye (Biotium, Fremont, CA, USA) to make the final concentration of the dye up to 50 µM and 75 µM, respectively, out of 20 mM stock solution. Samples were held in the dark for 10 min and exposed to UV light for 30 min with vortexing after every 10 min at 2000 rpm for 5 s. DNA extraction and qPCR master mix preparation were performed as described in Section 2.2.4, and sent to MSU core genome facility for performance of QuantStudio 7 Flex qPCR (Thermo Fisher Scientific). Samples at concentrations of 108, 106, and 104 were plated to collect plate count data. A standard curve (R2 > 90%) plotting plate count data against qPCR data was prepared for each strain, comprising three biological replicates.

2.4.2. Statistical Analyses

All the statistical analyses of the microbial data were performed in R programing language [57]. Log Nt/No or counts at (log) at time (t) days from the baseline (time 0 days) were calculated using the culturable counts to describe changes due to chlorine and acid. Response variables including fraction of VBNC and percentages of persister states were also calculated. The length of cold storage, harvest temperature (9 °C or 17 °C), and each strain were analyzed as independent variables. Package dplyr was used to group the response variables by independent variables [58]. Normality of the data was tested using Wilk’s Shapiro test and outliers were visualized using box plots. Assumptions of homogeneity of variance of the response variables were tested using Levene’s test. Correlations between microbial counts and time, VBNC fraction and time, and persister percentage and time were analyzed. ANOVA was used to test whether harvesting conditions at different temperatures and strains influenced the culturable counts, injured cell percentages, persister cell percentages, VBNC counts, acid tolerance, and chlorine tolerance. Statistically different means were separated using Tukey’s honest significant difference (HSD) test. Two-way analysis of covariance (ANCOVA) was used to test the main effects and the interaction of harvest temperature and strain type on microbial behavior. Estimated marginal means (emmeans) of the Package emmeans [59] was utilized to separate statistically different (p < 0.05) means. In cases where the assumptions of ANCOVA were violated, linear modeling using the lm function was used. Regression tree analysis was performed to check the effect of independent variables on microbial behavior [60]. Virulence was analyzed using binomial logistic regression, with survival as the count for pathogens that were alive after 4 d, and all three independent variables were evaluated.

3. Results

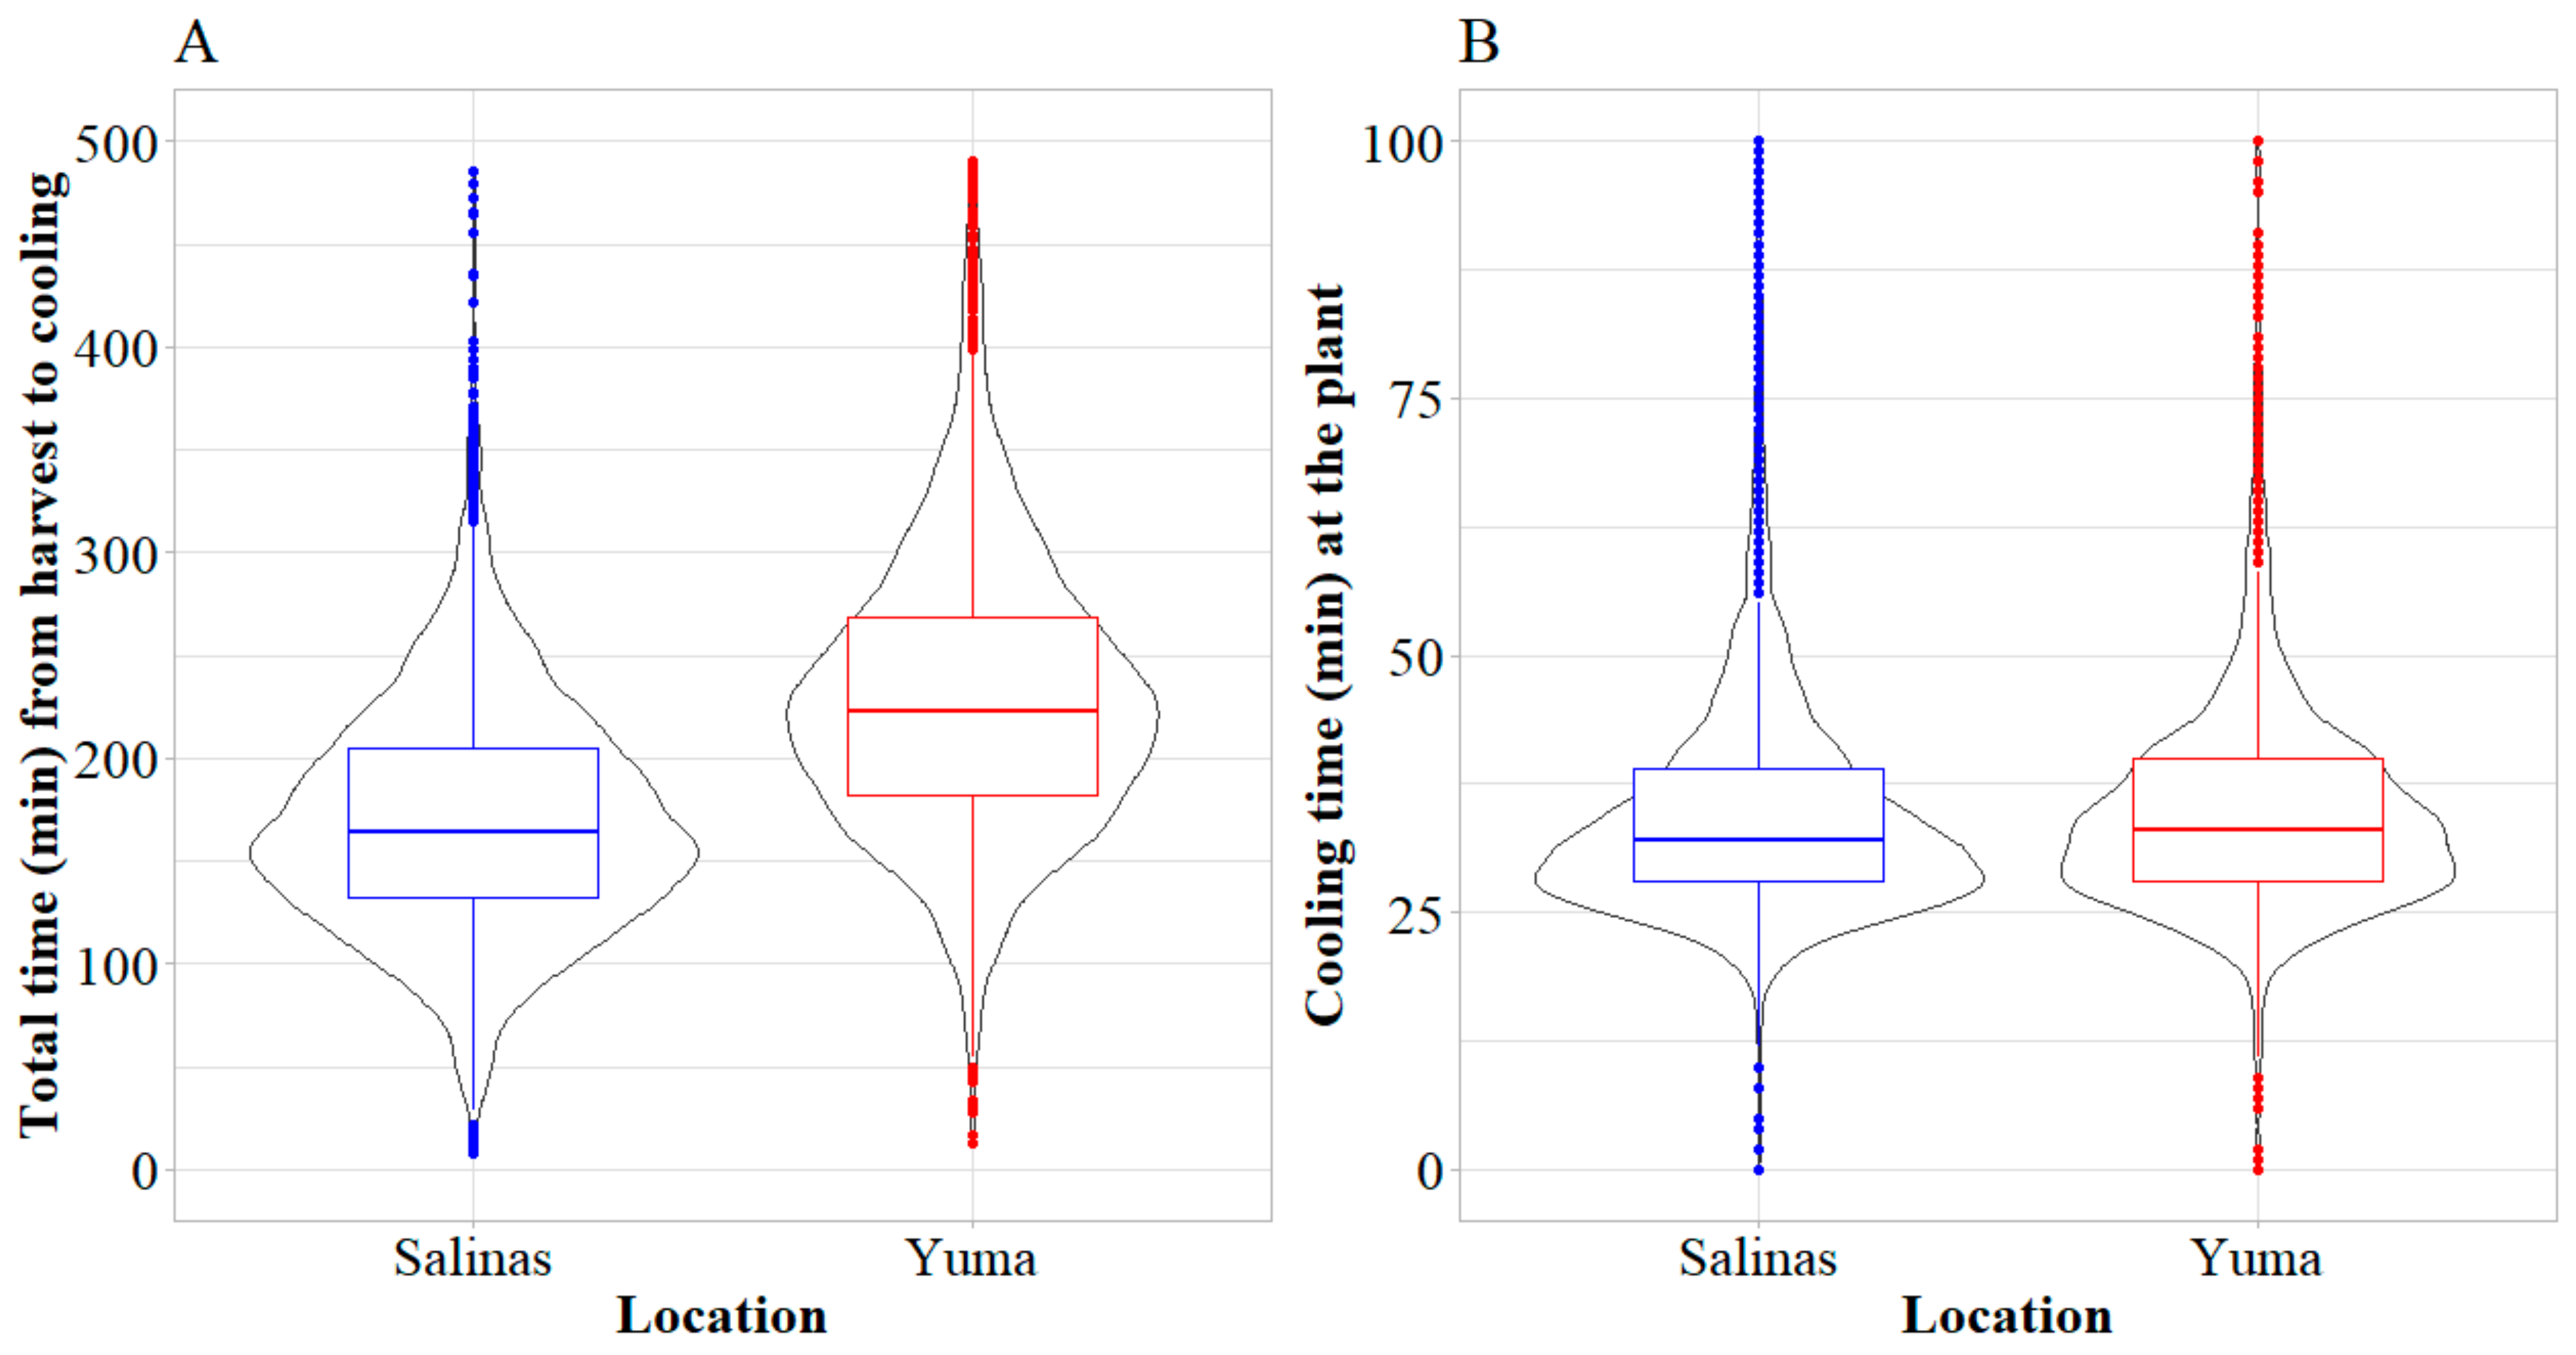
3.1. Harvest Temperatures and Cut-to-Cool Times of Romaine Lettuce from Salinas and Yuma Growing Regions

Lettuce harvested from the Salinas growing region had significantly higher median bin temperatures, 14.4 °C, than those from the Yuma growing region, 12.00 °C (p < 0.001, Mood’s median test, Figure 1A). The median temperature at the end of cooling of lettuce from the Salinas region was 1.38 °C, which was statistically different from that of the Yuma region, which was 1.50 °C (p < 0.001, Mood’s median test, Figure 1B). The time from the end of harvest to the start of cooling is called the cut-to-cool time. The cut-to-cool time for Romaine lettuce harvested from the Salinas growing region (163 min) was significantly lower (p < 0.001, Mood’s median test) than that for lettuce from the Yuma growing region (232 min), see Figure 2A. While statistically different (p < 0.001, Mood’s median test, Figure 2B), the median time taken to cool Romaine lettuce from the Yuma growing region was 33 min, which similar to that from the Salinas growing region at 32 min.

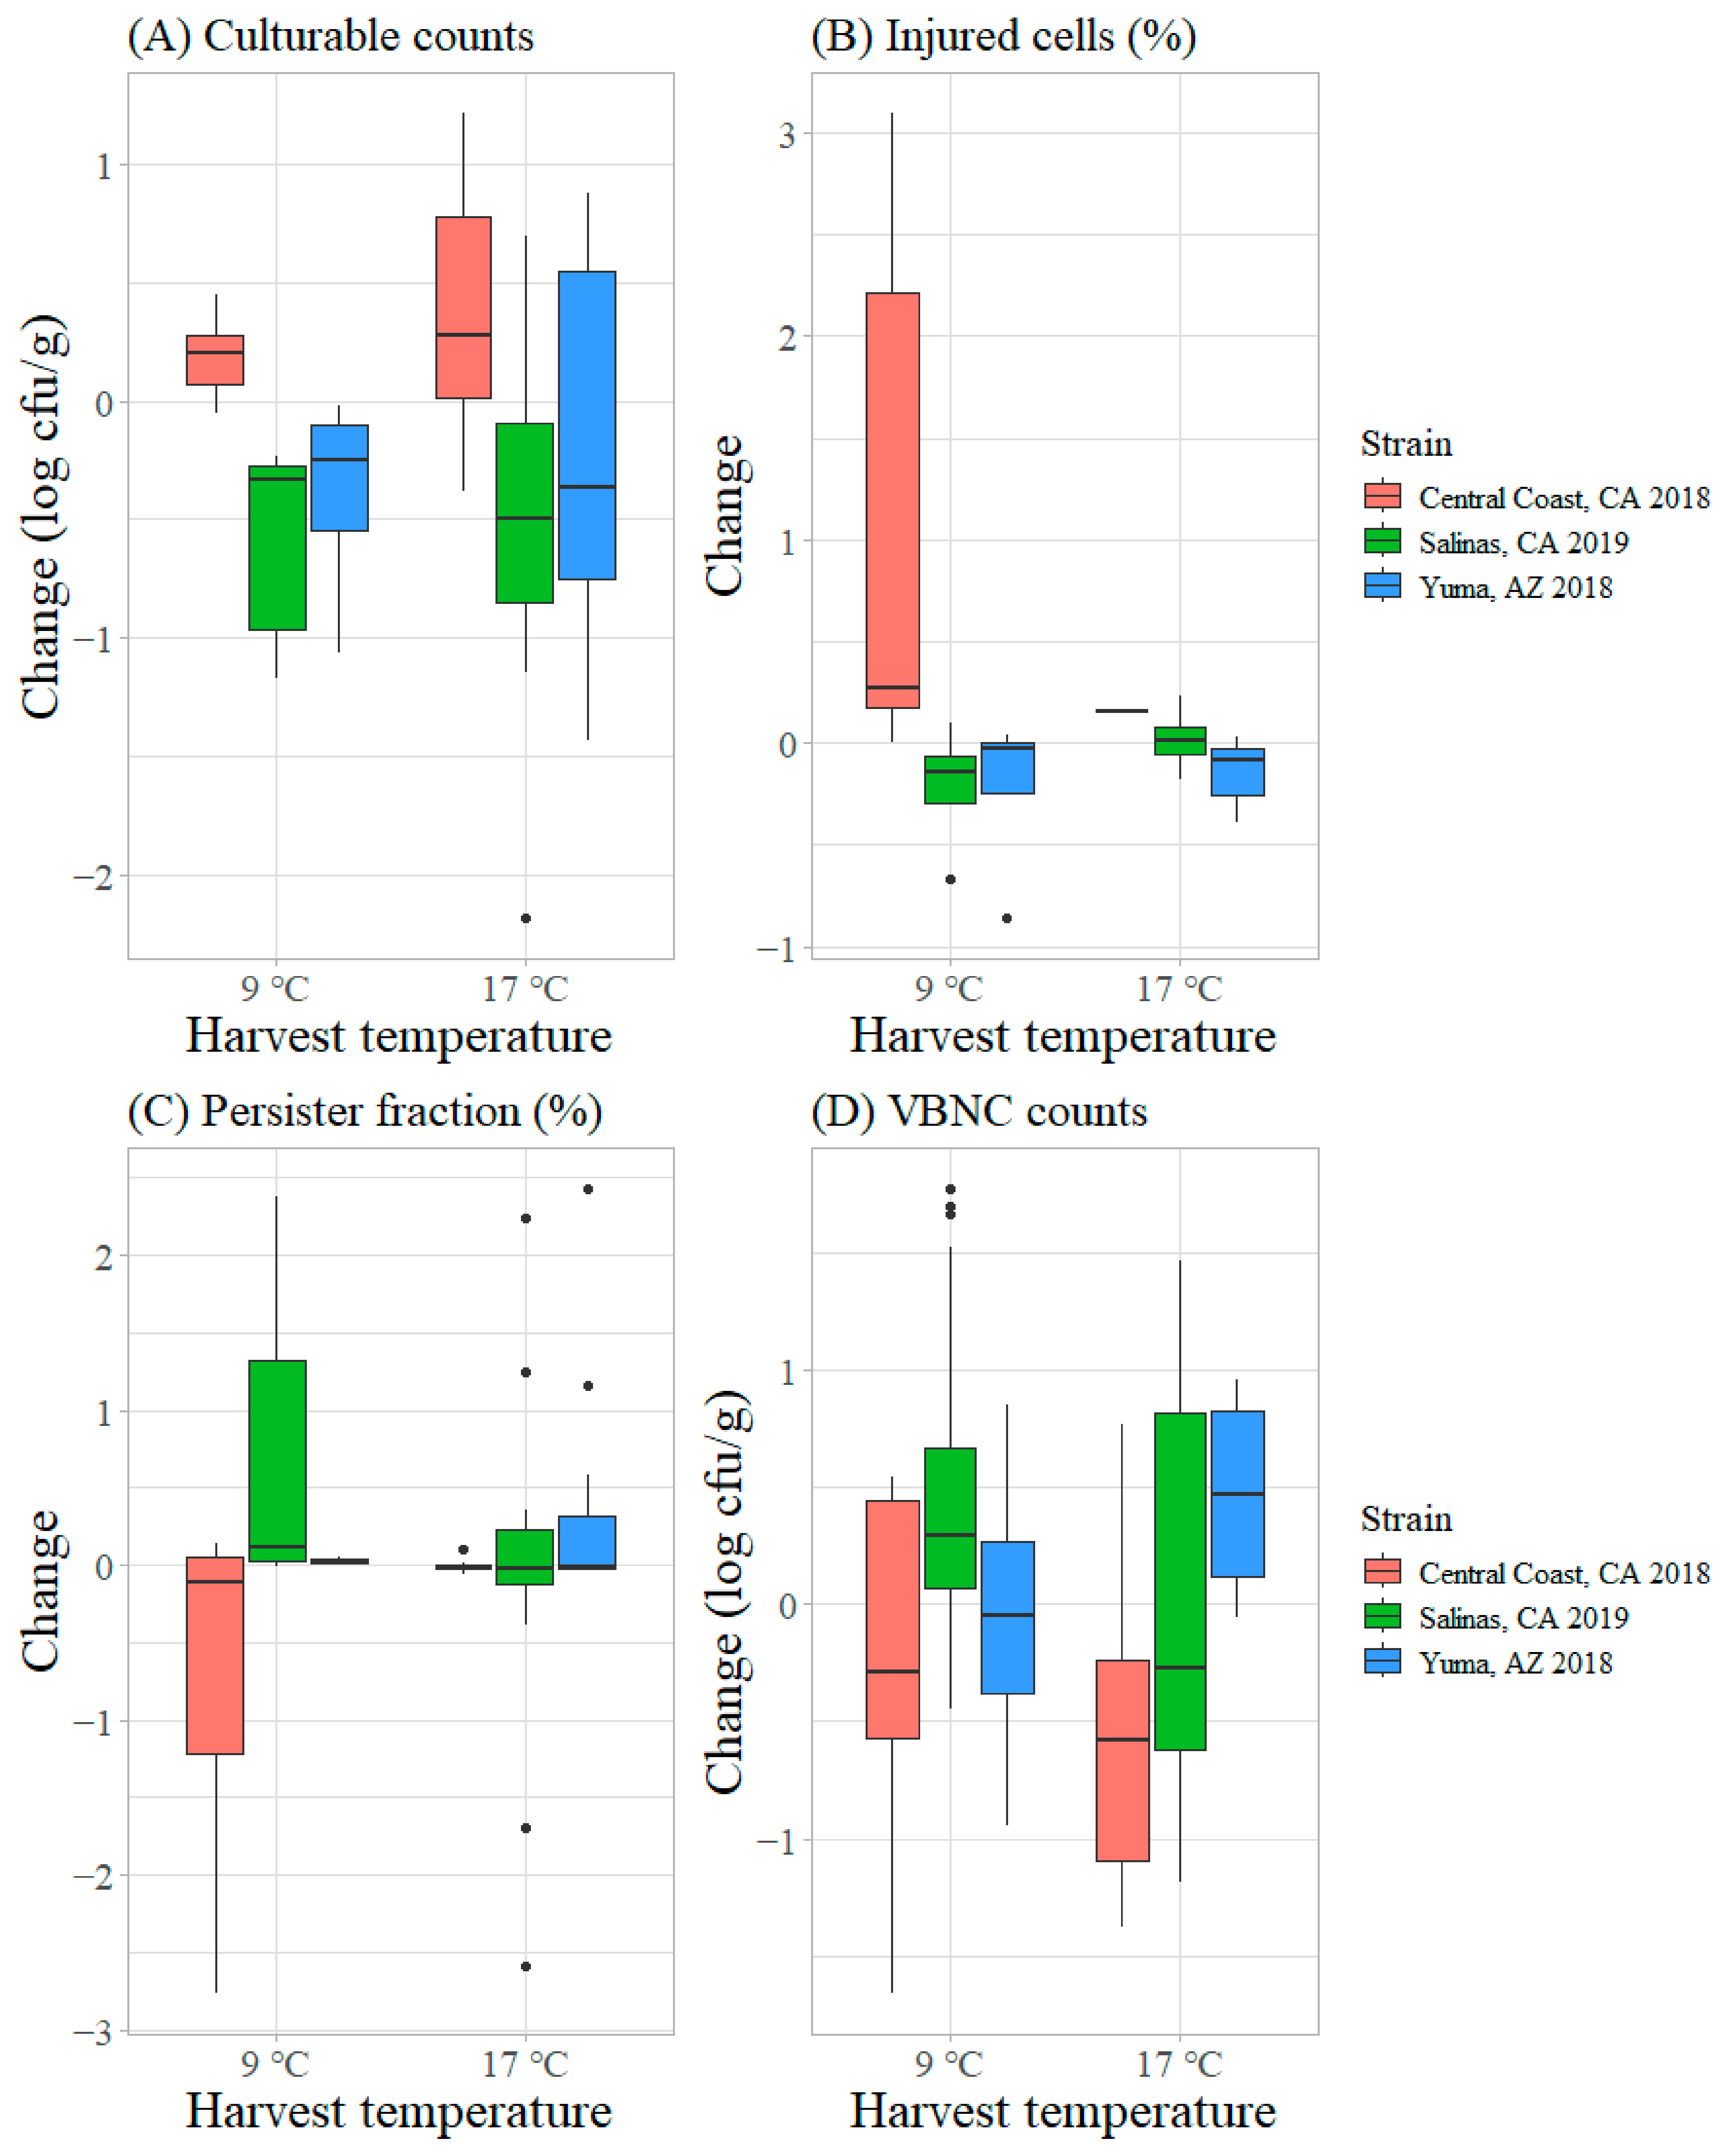
3.2. Behavior of STEC O157:H7 on Inoculated Romaine Lettuce at the Two Harvest Temperatures from Cut to Cool

3.2.1. Transitions in Physiological States of STEC O157:H7 on Inoculated Lettuce

To assess the effects of harvest temperature on STEC O157:H7 physiology, we selected the harvest temperatures (9 °C or 17 °C) representing the 25th and 75th percentiles from the Yuma and Salinas growing regions, respectively. For the experiment, the cut-to-cool time of 240 min was selected, which was similar to the median cut-to-cool time for Romaine lettuce from the Yuma growing region. The greenhouse grown lettuce was inoculated with the different STEC O157:H7 strains and lettuce was incubated at the selected harvest temperatures for 240 min before cooling.
The geometric means of culturable counts of STEC O157:H7 on harvested Romaine lettuce were 4.25–6.57 and 4.16–5.02 log CFU/g for the three strains at 9 and 17 °C, respectively. The average percentages of injured cells were 26.5 (sd = 12.4) to 81.1% (sd = 25.5) and 58.6 (sd = 24.3) to 72.7% (sd = 22.6), the average percentages of cells in the persister state were 2.4 (sd = 2.47) to 20.0 (sd = 7.95) and 6.7 (sd = 9.64) to 18.9 (sd = 20.1), and the average VBNC cell counts were −0.47 (sd = 0.7) to 0.54 (sd = 1.00) and −0.37 (sd = 0.56) to 0.99 (sd = 0.54) log CFU/g after harvest at 9 and 17 °C, respectively. The effect of harvest temperature and strain on the physiological state was statistically evaluated using factorial ANOVA tests, accounting for the interactions. For changes in culturable and injured cells, significant differences (p < 0.05, ANOVA) were observed among the strains (Figure 3A,B). The change in persister percentages and VBNC counts were dependent on strain and harvest temperature, as evidenced by a significant interaction (p < 0.05, ANOVA; Figures S1 and S2). The Yuma outbreak strain had greater changes in culturable and injured cells compared to the Central Coast outbreak strain (Figure S3). The Salinas 2019 outbreak strain had a significantly higher persister percentage and amount of VBNC cells compared to that of the Central Coast 2018 outbreak strain on lettuce harvested at 9 °C (Figure 3C,D). For lettuce harvested at 17 °C, the Yuma outbreak strain had a higher amount of VBNC cells compared to the Central Coast 2019 outbreak strain.

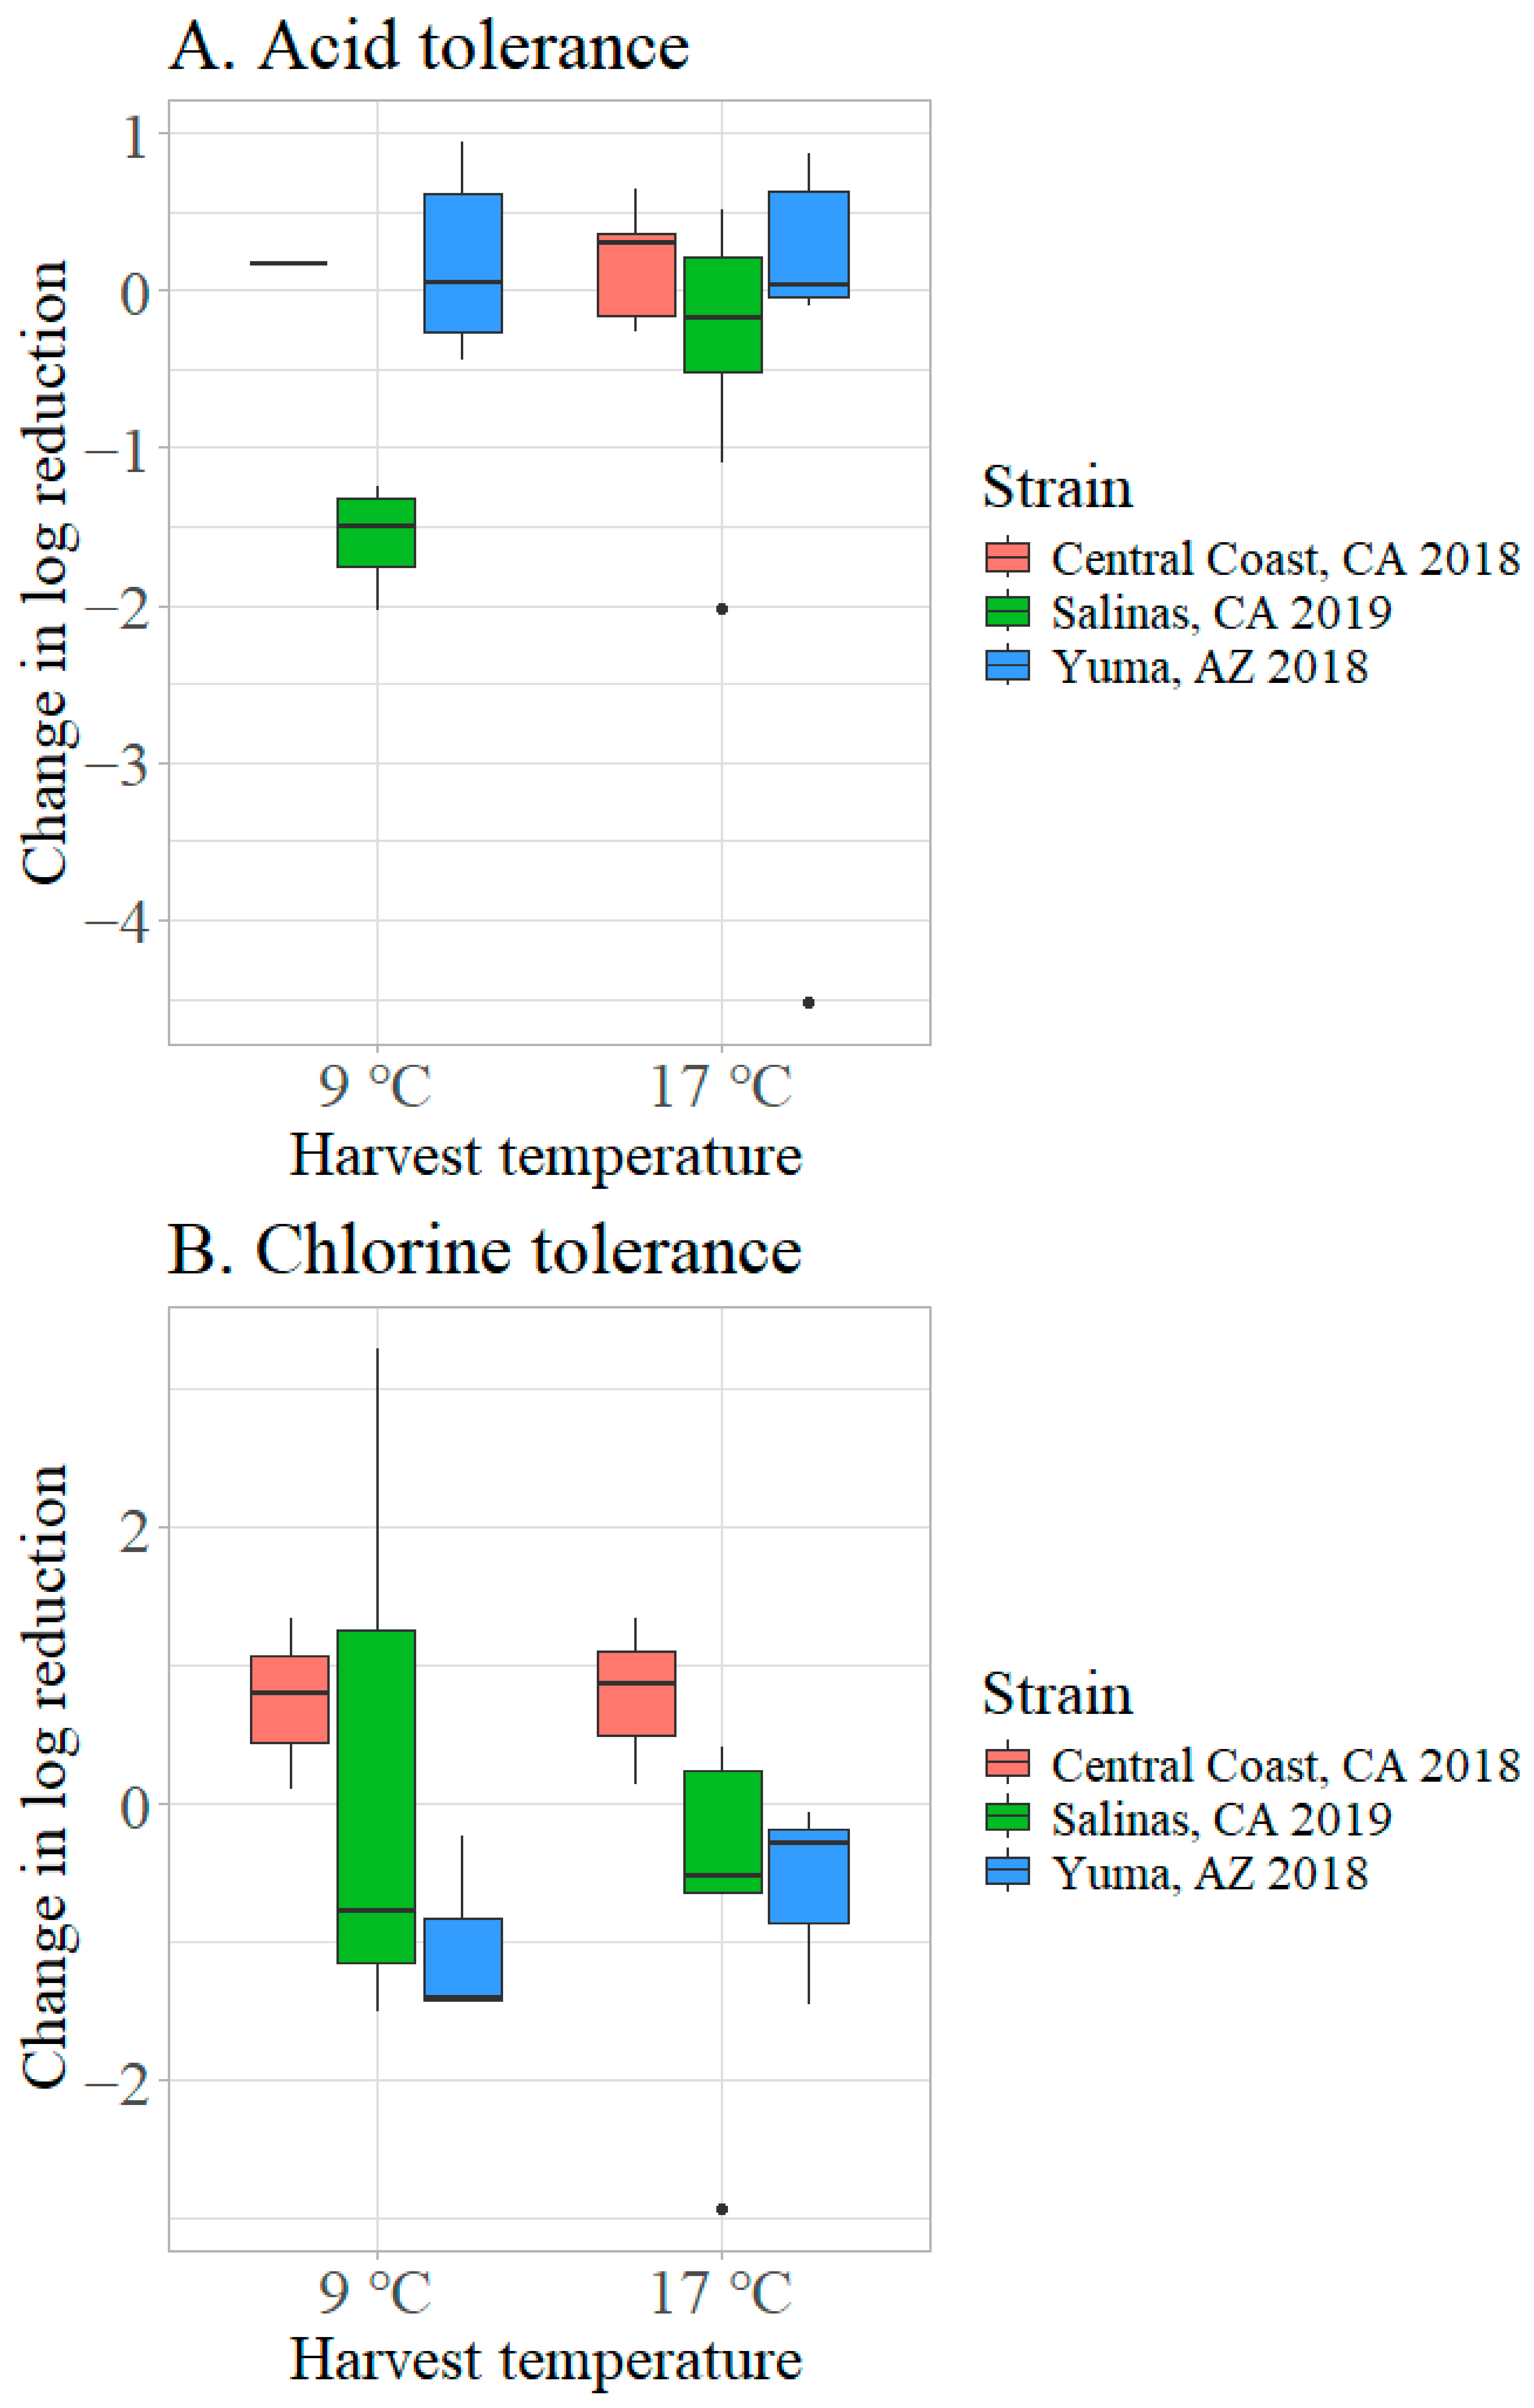
3.2.2. Effect of Harvest Temperature on Acid and Chlorine Tolerance of STEC O157:H7 on Inoculated Lettuce

To quantify changes in acid and chlorine tolerance, the change in log values as Nt/N0 was over the 4 h period was calculated. The change in log reduction was computed as the difference of the LRV at harvest (0 h) and after 4 h of incubation at harvest temperatures (9 and 17 °C). Median log reduction values due to chlorine and acid treatments were reported for the Central Coast outbreak strain (0.17 and 0.30), the Salinas 2019 outbreak strain (−1.50 and −0.18), and the Yuma 2018 outbreak strain (0.05 and 0.04) at 9 °C and 17 °C harvesting temperatures, respectively (Figure 4). Despite the variations, strain and harvest temperature did not significantly (p > 0.05, ANOVA) affect the change in log reduction due to acid and chlorine treatments. The interaction of harvest temperature and strain did not significantly (p > 0.05, ANOVA) affect the change in log reduction due to acid nor chlorine treatments.

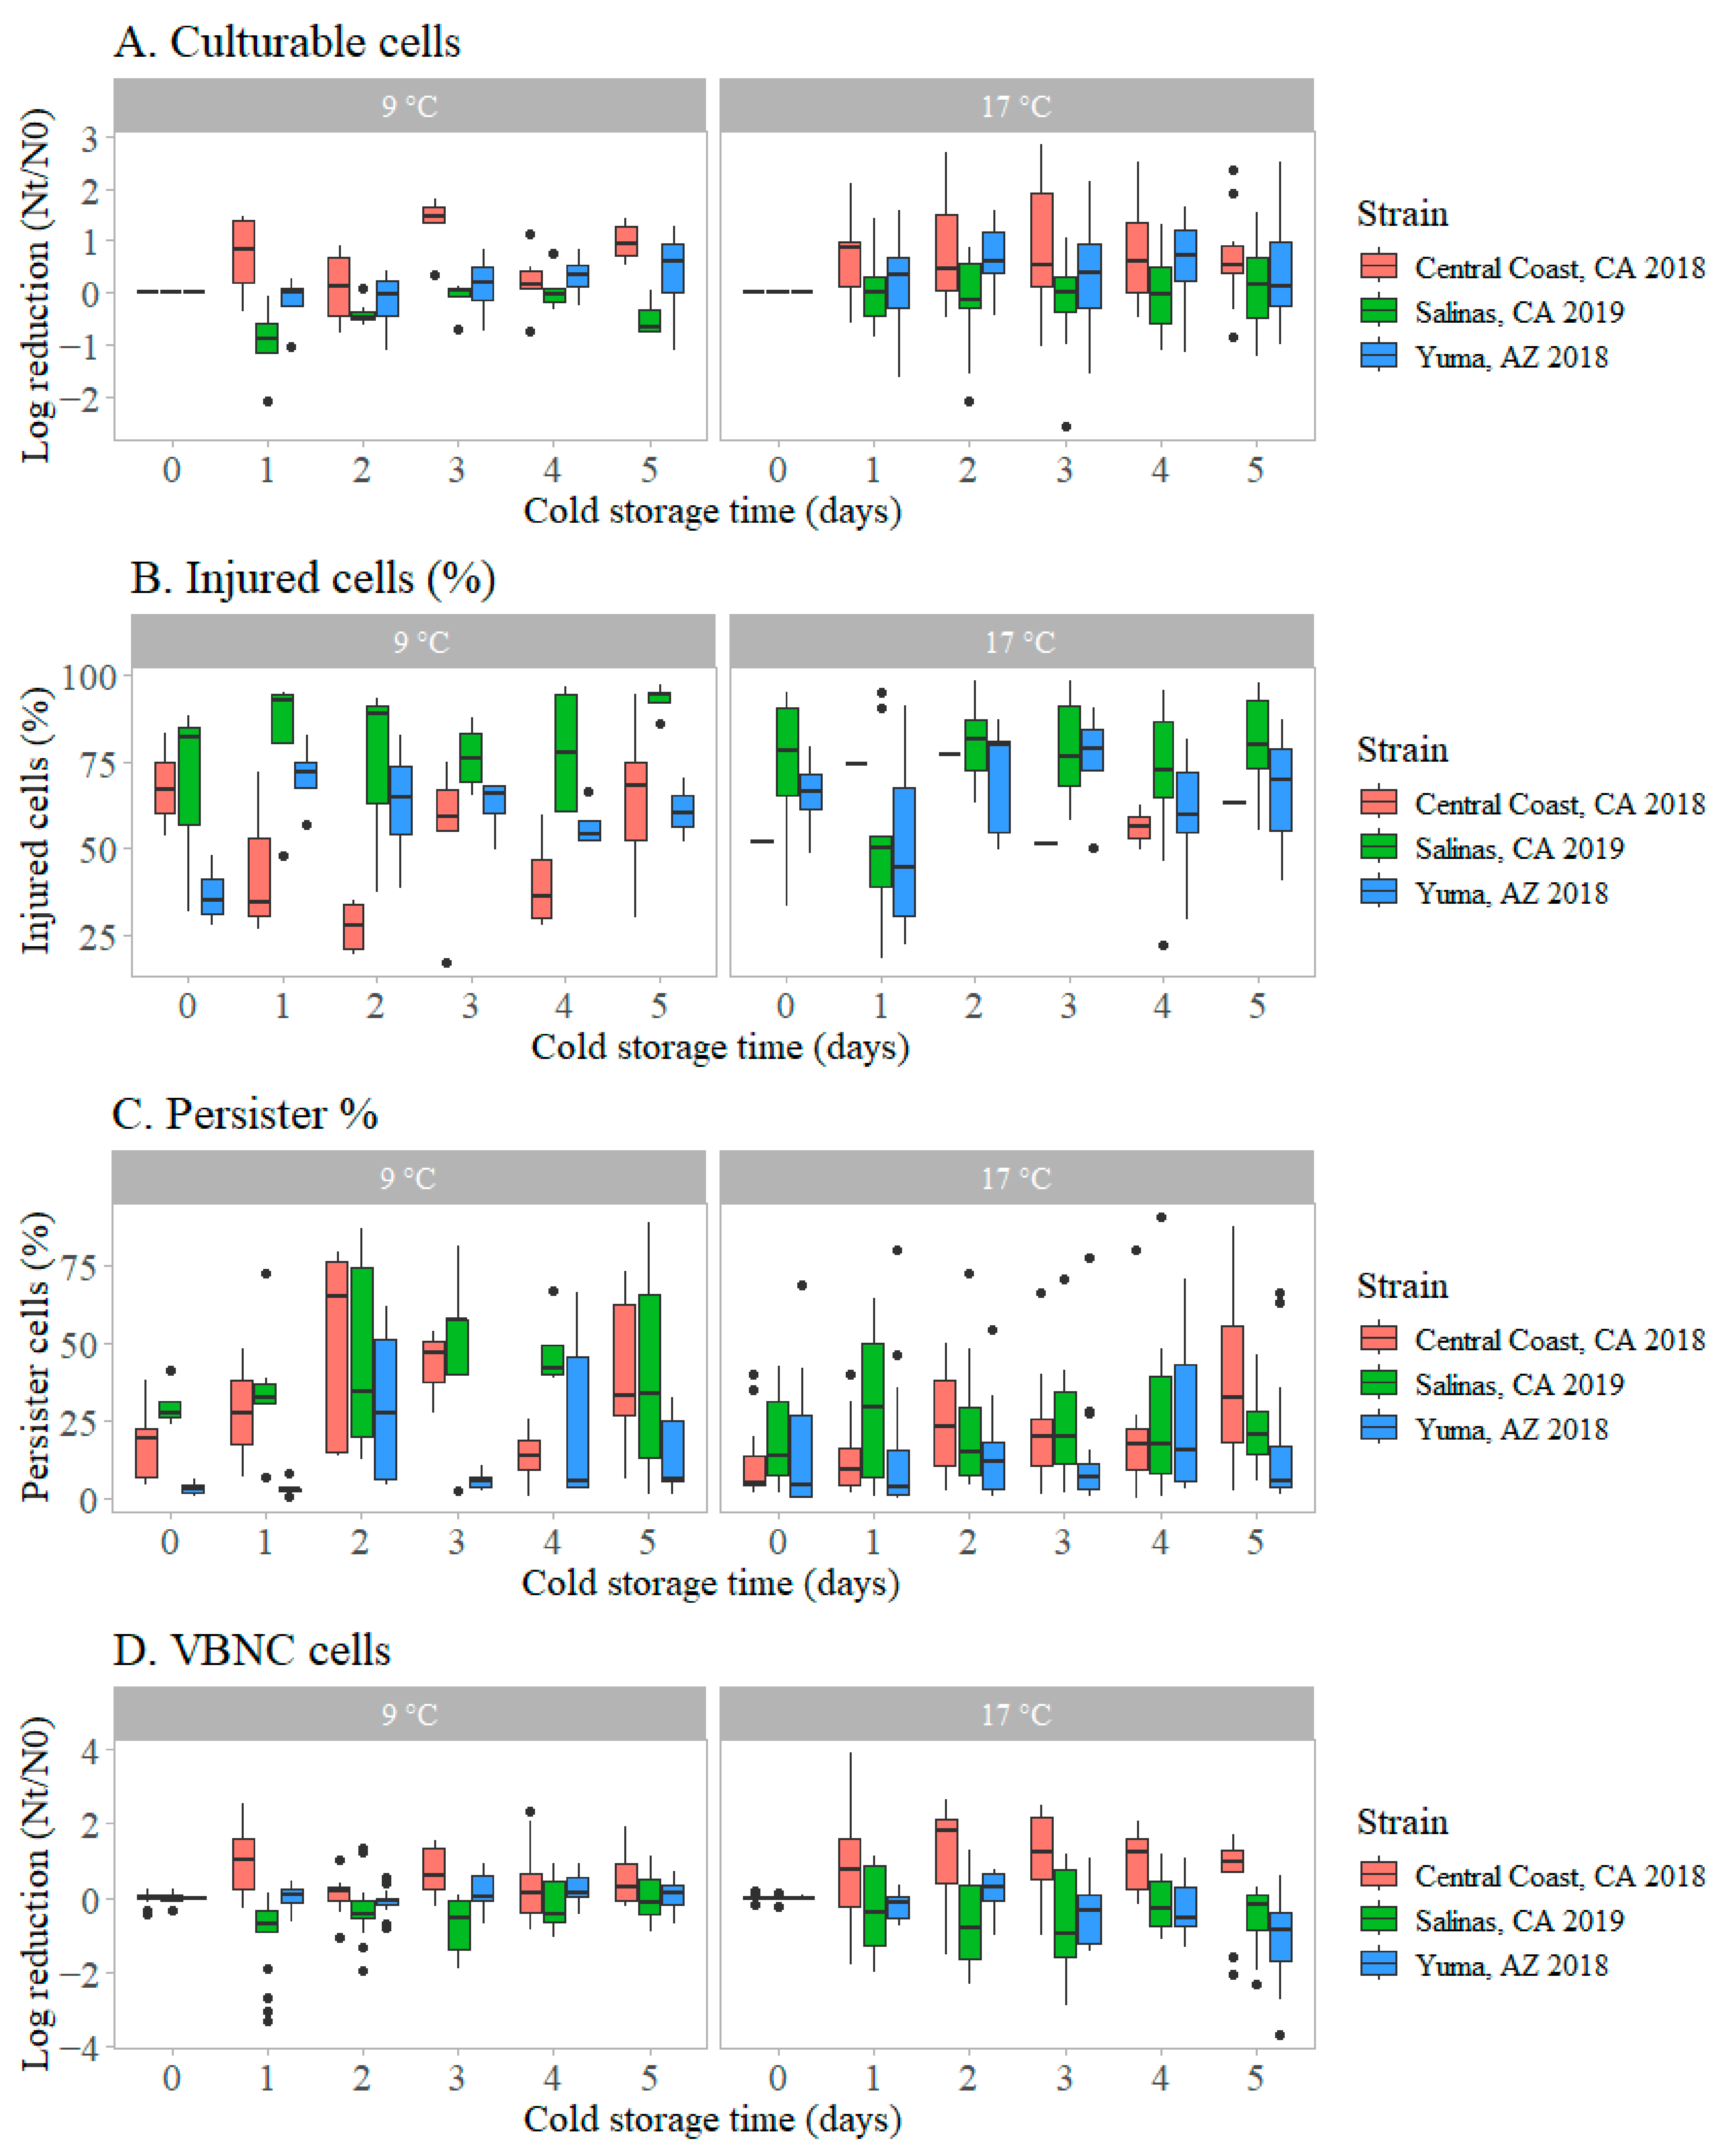
3.3. Transitions in Physiological States of STEC O157:H7 on Romaine Lettuce During Cold Storage

3.3.1. Changes in Culturable Cells During Cold Storage

This study assessed the changes in STEC O157:H7 culturable cells on Romaine lettuce during cold storage by computing the log reduction over the period, calculated with day 0 as the baseline. Strains from the Central Coast outbreak and Yuma outbreak consistently showed higher median log reduction values over the cold storage period for Romaine lettuce harvested at 9 and 17 °C compared to day 0 (Figure 5A). Correlation analysis of the log reduction in culturable cells over the period of storage showed a weak relationship between reduction and harvest temperature at 9 (r = −0.1) and 17 °C (r = −0.1). Analysis of covariance (ANCOVA) with days as a covariate was used to assess the effect of the interaction between harvest temperature and strain on the culturable cells during cold storage. The interaction of harvest temperature and strain did not significantly (p > 0.05) affect the levels of the culturable cells on stored lettuce. However, the main effects of strain (η2 = 0.14, 95% CI = 0.09, 1.00) and harvest temperatures (η2 = 0.01, 95% CI= 0.00, 1.00) significantly (p < 0.05, ANCOVA) influenced the change in culturable cells. The Central Coast outbreak strain had significantly (p < 0.05, ANCOVA) higher log reduction values compared to other strains over the period of cold storage for lettuce harvested at both temperatures (Figure S4). For the other strains, harvest temperature had no significant (p > 0.05, ANCOVA) effect on the log reduction of culturable cells during cold storage.
To assess the effect of harvest temperature, cold storage days, strains and their interactions on log reduction of culturable cells, a regression tree analysis was used. Optimal pruning of the tree was performed using a defined complexity parameter (CP), known to determine how deep a tree will grow, and cross-validation error (xerror): a CP that minimized the xerror was selected to optimally account for explained variance. The tree had three splits optimally explaining the variance of culturable cells during cold storage (CP = 0.01, xerror = 0.856). While regression trees have the disadvantage of variation in the splits, bootstrapping (n = 100) was used to minimize variation in establishing the most important factors explaining variance in the culturable cells. Number of cold storage days accounted for 56.1% of the variance and was the most important factor explaining the reduction in culturable cells (Figure S5). Regardless of the harvest temperature, lettuce inoculated with the Central Coast 2018 outbreak strain and stored for >1 day averaged the highest log reduction (0.72 log CFU/g, probability = 0.24), followed by the Yuma 2018 outbreak strain in cold storage for same time (0.34 log CFU/g, probability = 0.27); see Figure 6. The lowest log reduction was reported for the Salinas 2019 outbreak strain regardless of storage time (−0.11 log CFU/g, probability = 0.38).

3.3.2. Transition of STEC O157:H7 Cells to the Injured State During Cold Storage

The median value of injured cells on day 0 was 66.4% (95% CI = 31.6%, 91.1%) while that after 5 d of cold storage was 72.7% (95% CI = 41.9%, 96.9%). Whereas the median value of injured cells on lettuce harvested at 9 °C was 62.5% (95% CI = 26.8%, 94.6%), that on lettuce harvested at 17 °C was 71.6% (95% CI = 27.9%, 95.8%); see Figure 5B. The median values of injured cells for strains from the Central Coast, Salinas and Yuma outbreaks were 52.3% (95% CI = 21.0%, 78.7%), 78.6% (95% CI = 32.7%, 97.1%) and 65.1% (95% CI = 28.4%, 86.9%), respectively. There were weak correlations (r ≤ 0.1) between injured cells and cold storage times at both 9 and 17 °C temperatures.
Regression methods were used to assess the combined effect of harvest temperature, strain and cold storage days on the percentage of injured cells. Different combinations of factors were incorporated into regression models, and the best fitting combinations were selected using the corrected Akaike Information Criterion (AICc). The selected model inputs were evaluated for their effect on the injured cells. Strain significantly (p < 0.001) affected the transition to injured cells during cold storage (Figure 7). In the Salinas outbreak strain, significantly (p < 0.05) more cells transitioned into injured cells than in the Central Coast strain.
The response variable, injured cells, was transformed into the interval (0, 1) and the factors of strain, harvest temperature and cold storage days evaluated using beta regression. A confidence interval of beta coefficient > 0 or <0 denote significant (p < 0.05) effect, whereas a confidence interval including 0 is not significant (p > 0.05). Strain was transformed into a dummy variable with the Central Coast 2018 outbreak strain as a baseline category.

3.3.3. Transition of Microbial Cells into the Persister State During Cold Storage

The median persister percentage increased from 8.78% (95% CI = 0.7%, 42.0%) on day 0 to 19.6% (95% CI = 1.5%, 74.4%) after 5 d of cold storage. The median values of persister cells on lettuce harvested at 9 and 17 °C were 24.4% (95% CI = 2.03%, 78.2%) and 13.3% (95% CI = 0.8%, 64.9%), respectively. The outbreak strains from Central Coast 2018, Salinas 2019 and Yuma 2018 had median persister percentages of 18.6% (95% CI = 1.7%, 68.3%), 24.6% (95% CI = 2.2%, 73.7%) and 6.57% (95% CI = 0.8%, 63.6%), respectively, over the cold storage period. Lettuce harvested at 9 °C had relatively higher persister percentage for all strains over the cold storage period compared to that harvested at 17 °C (Figure 5C).
Spearman rank correlation tests showed weak correlations between persister percentage and cold storage days for lettuce that was harvested either at 9 °C (r = 0.12) or 17 °C (r = 0.14). Regression analysis was conducted to evaluate the combined effects of strain, harvest temperature and cold storage period on transition to persister state. With increasing cold storage days, the persister formation also increased (beta = 0.082, p = 0.009); see Figure 8. On the other hand, increasing harvest temperature to 17 °C had a negative impact (beta = −0.046, p = 0.002) on persister formation. Strain differences also affected the formation of persisters. Fewer persister cells were formed by the Yuma 2018 outbreak strain than Central Coast 2018 outbreak strain (beta = −0.046, p < 0.001). The interaction of the factors did not significantly (p > 0.05) affect the formation of persisters during cold storage.

3.3.4. Transition of Microbial Cells to the VBNC State During Cold Storage

Log increase for the VBNC cells during the cold storage period ranged from −3.62 to 3.90. Whereas on lettuce harvested at 9 °C, a change of 0.002 log CFU/g was reported in VBNC over the cold storage period, lettuce harvested at 17 °C had −0.01 log. Among the strains, the Central Coast 2018 outbreak strain had the highest increase of 0.284 logs across the period of storage, while Yuma 2018 and Salinas 2019 outbreak strains had −0.269 and −0.003 logs, respectively. Over cold storage, the Central Coast 2018 outbreak strain had a relatively higher increase in transition to VBNC cells than other strains (Figure 5D). Correlation tests for trends of transition to VBNC showed that period of storage was not correlated to formation of the dormant cells at either harvest temperature 9 °C (r = 0.03) or 17 °C (r = −0.11). ANCOVA tests showed that the interaction of harvest temperature and strain significantly (p < 0.001) affected the formation of VBNC cells. The Central Coast 2018 outbreak strain had increased VBNC formation during cold storage compared to the Yuma 2018 and Salinas 2019 outbreak strains (Figure S6, η2 = 0.19 [95% CI = 0.15, 1.00]). The Yuma 2018 outbreak strain showed higher formation of VBNC cells at 9 °C than at 17 °C.
Regression tree analysis showed that the variance in VBNC formation was optimally explained by 8 splits (CP = 0.01, xerror = 0.78; Figure 9). The highest formation of VBNC cells during cold storage occurred for the Central Coast 2018 outbreak strain, stored for ≥1 day on lettuce harvested at 17 °C (1 log, probability 0.12). The least formation of VBNC cells (−1.1 logs, probability = 0.19) was reported for the Yuma 2018 outbreak strain on produce that was harvested at 17 °C and stored for ≥5 days. Cold storage days accounted for 47.6% of the variance in the formation of VBNC cells (Figure S5).

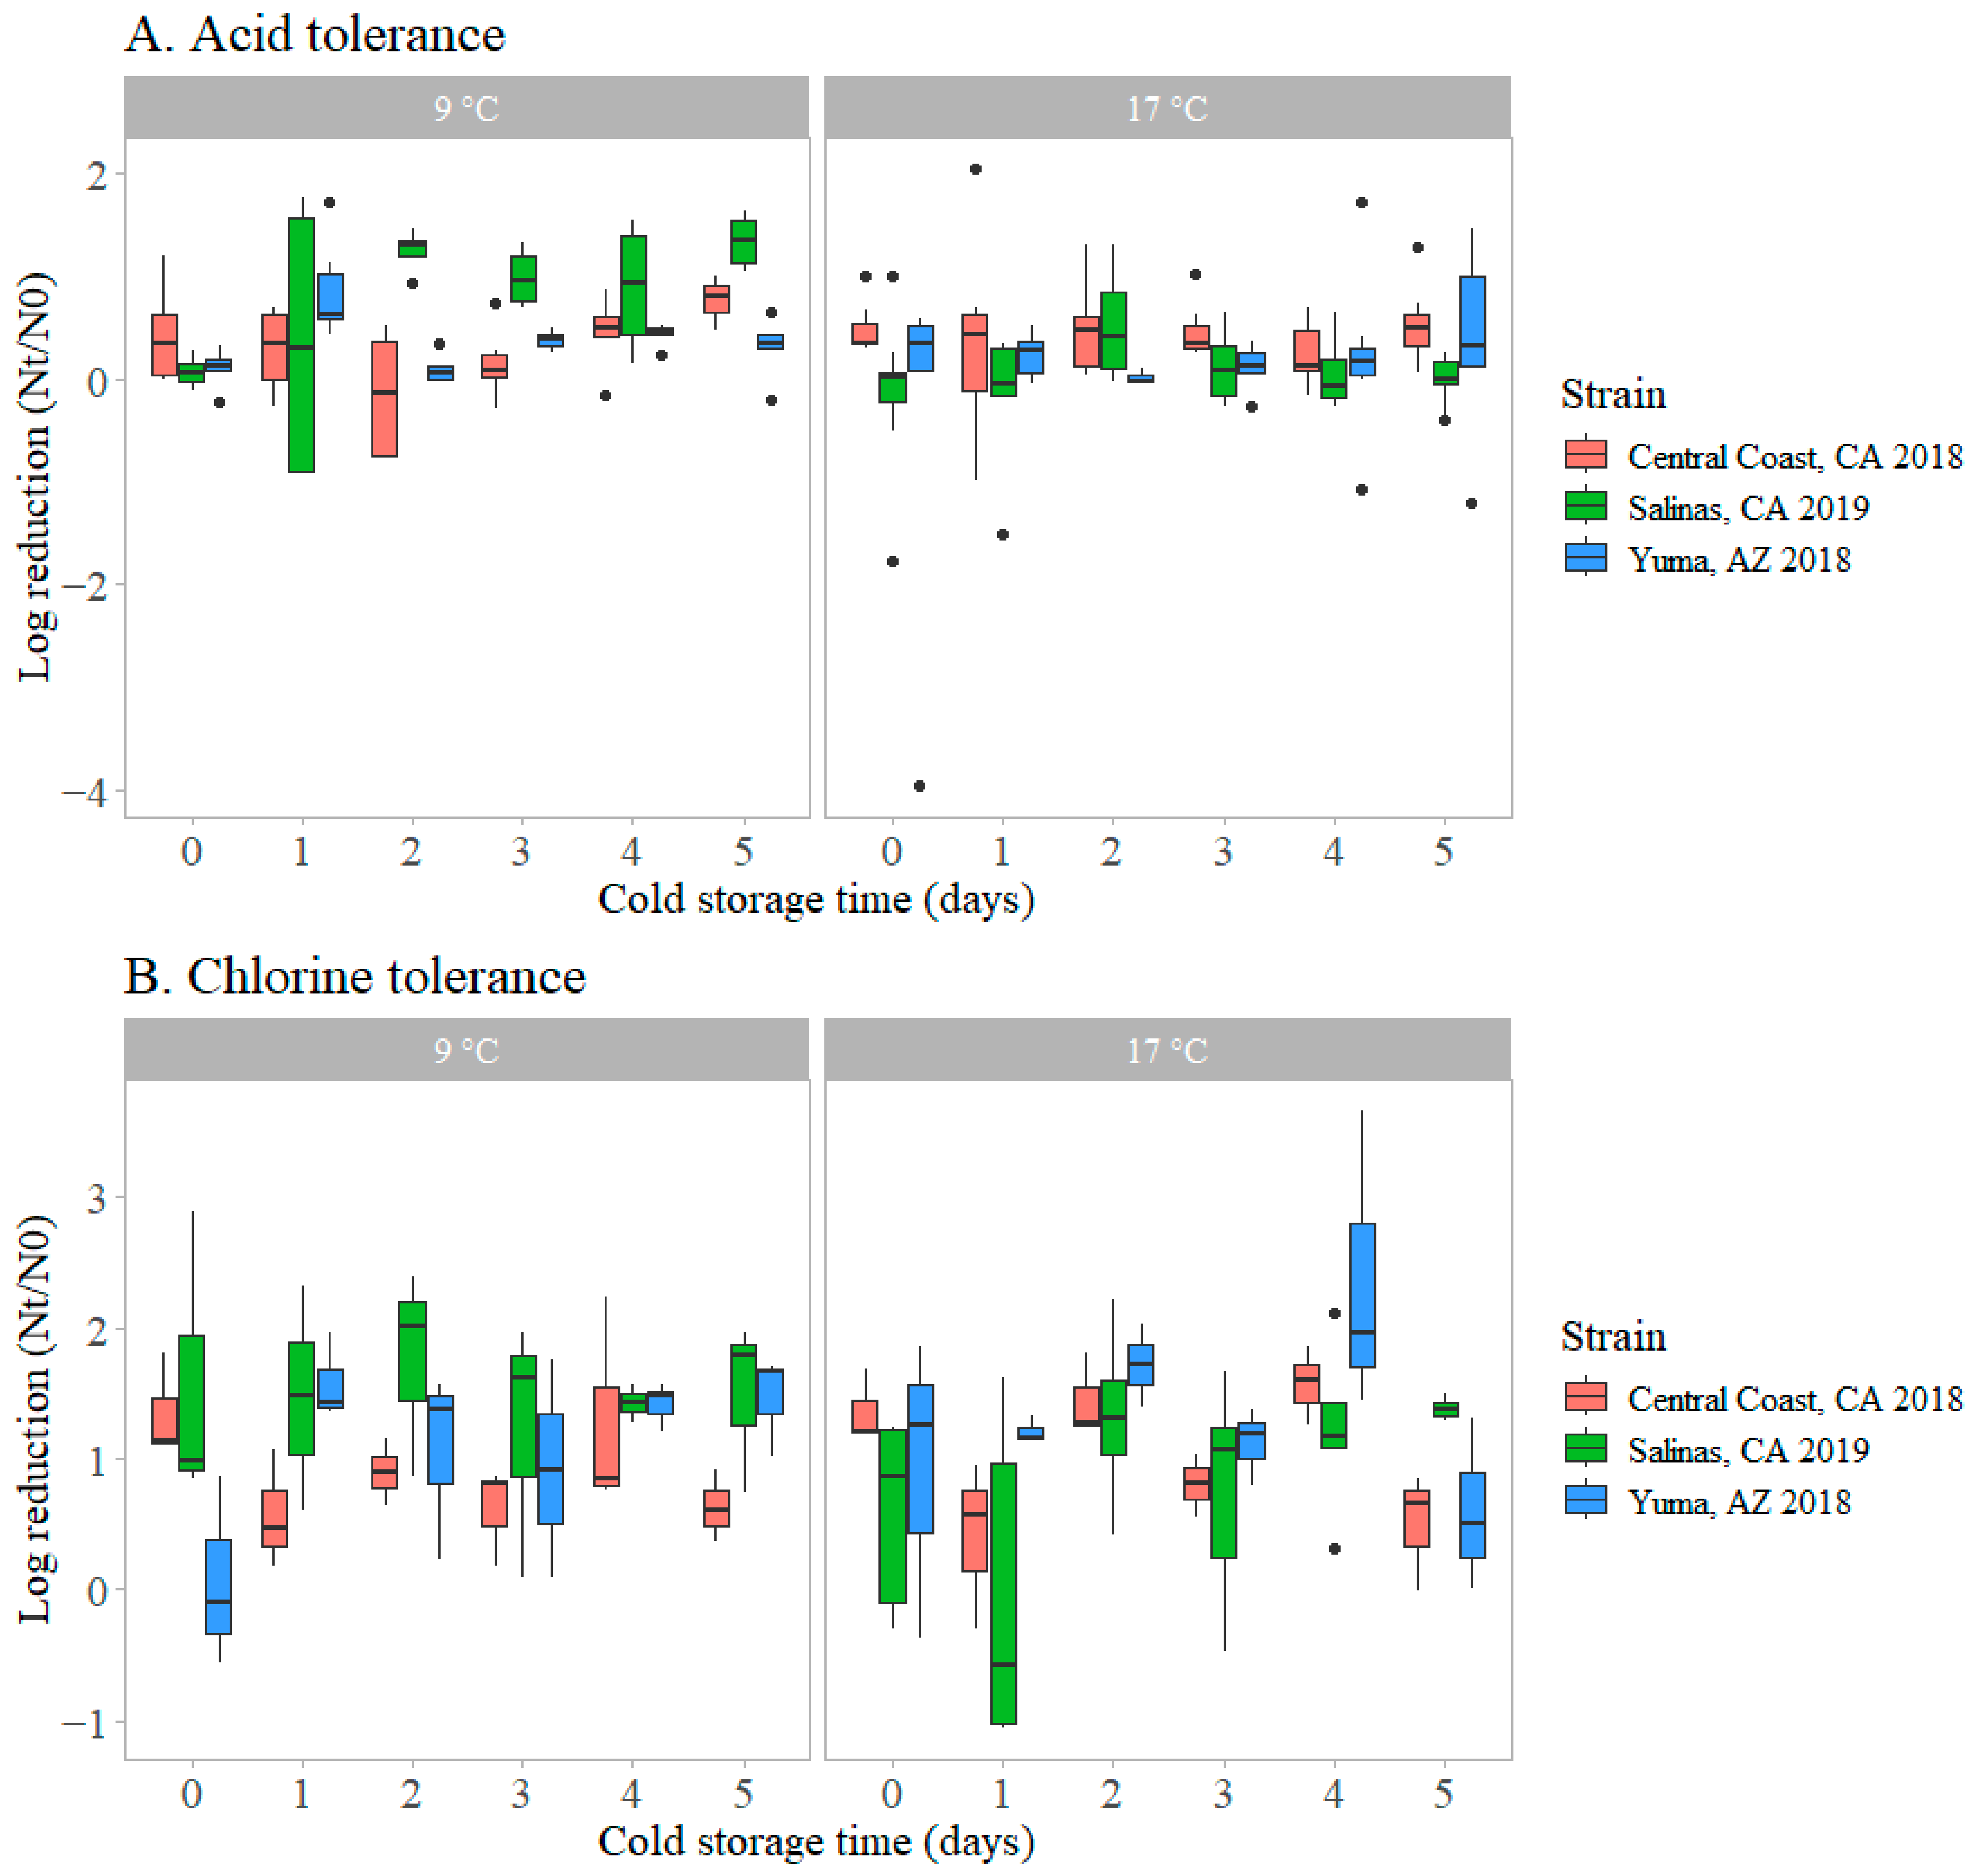
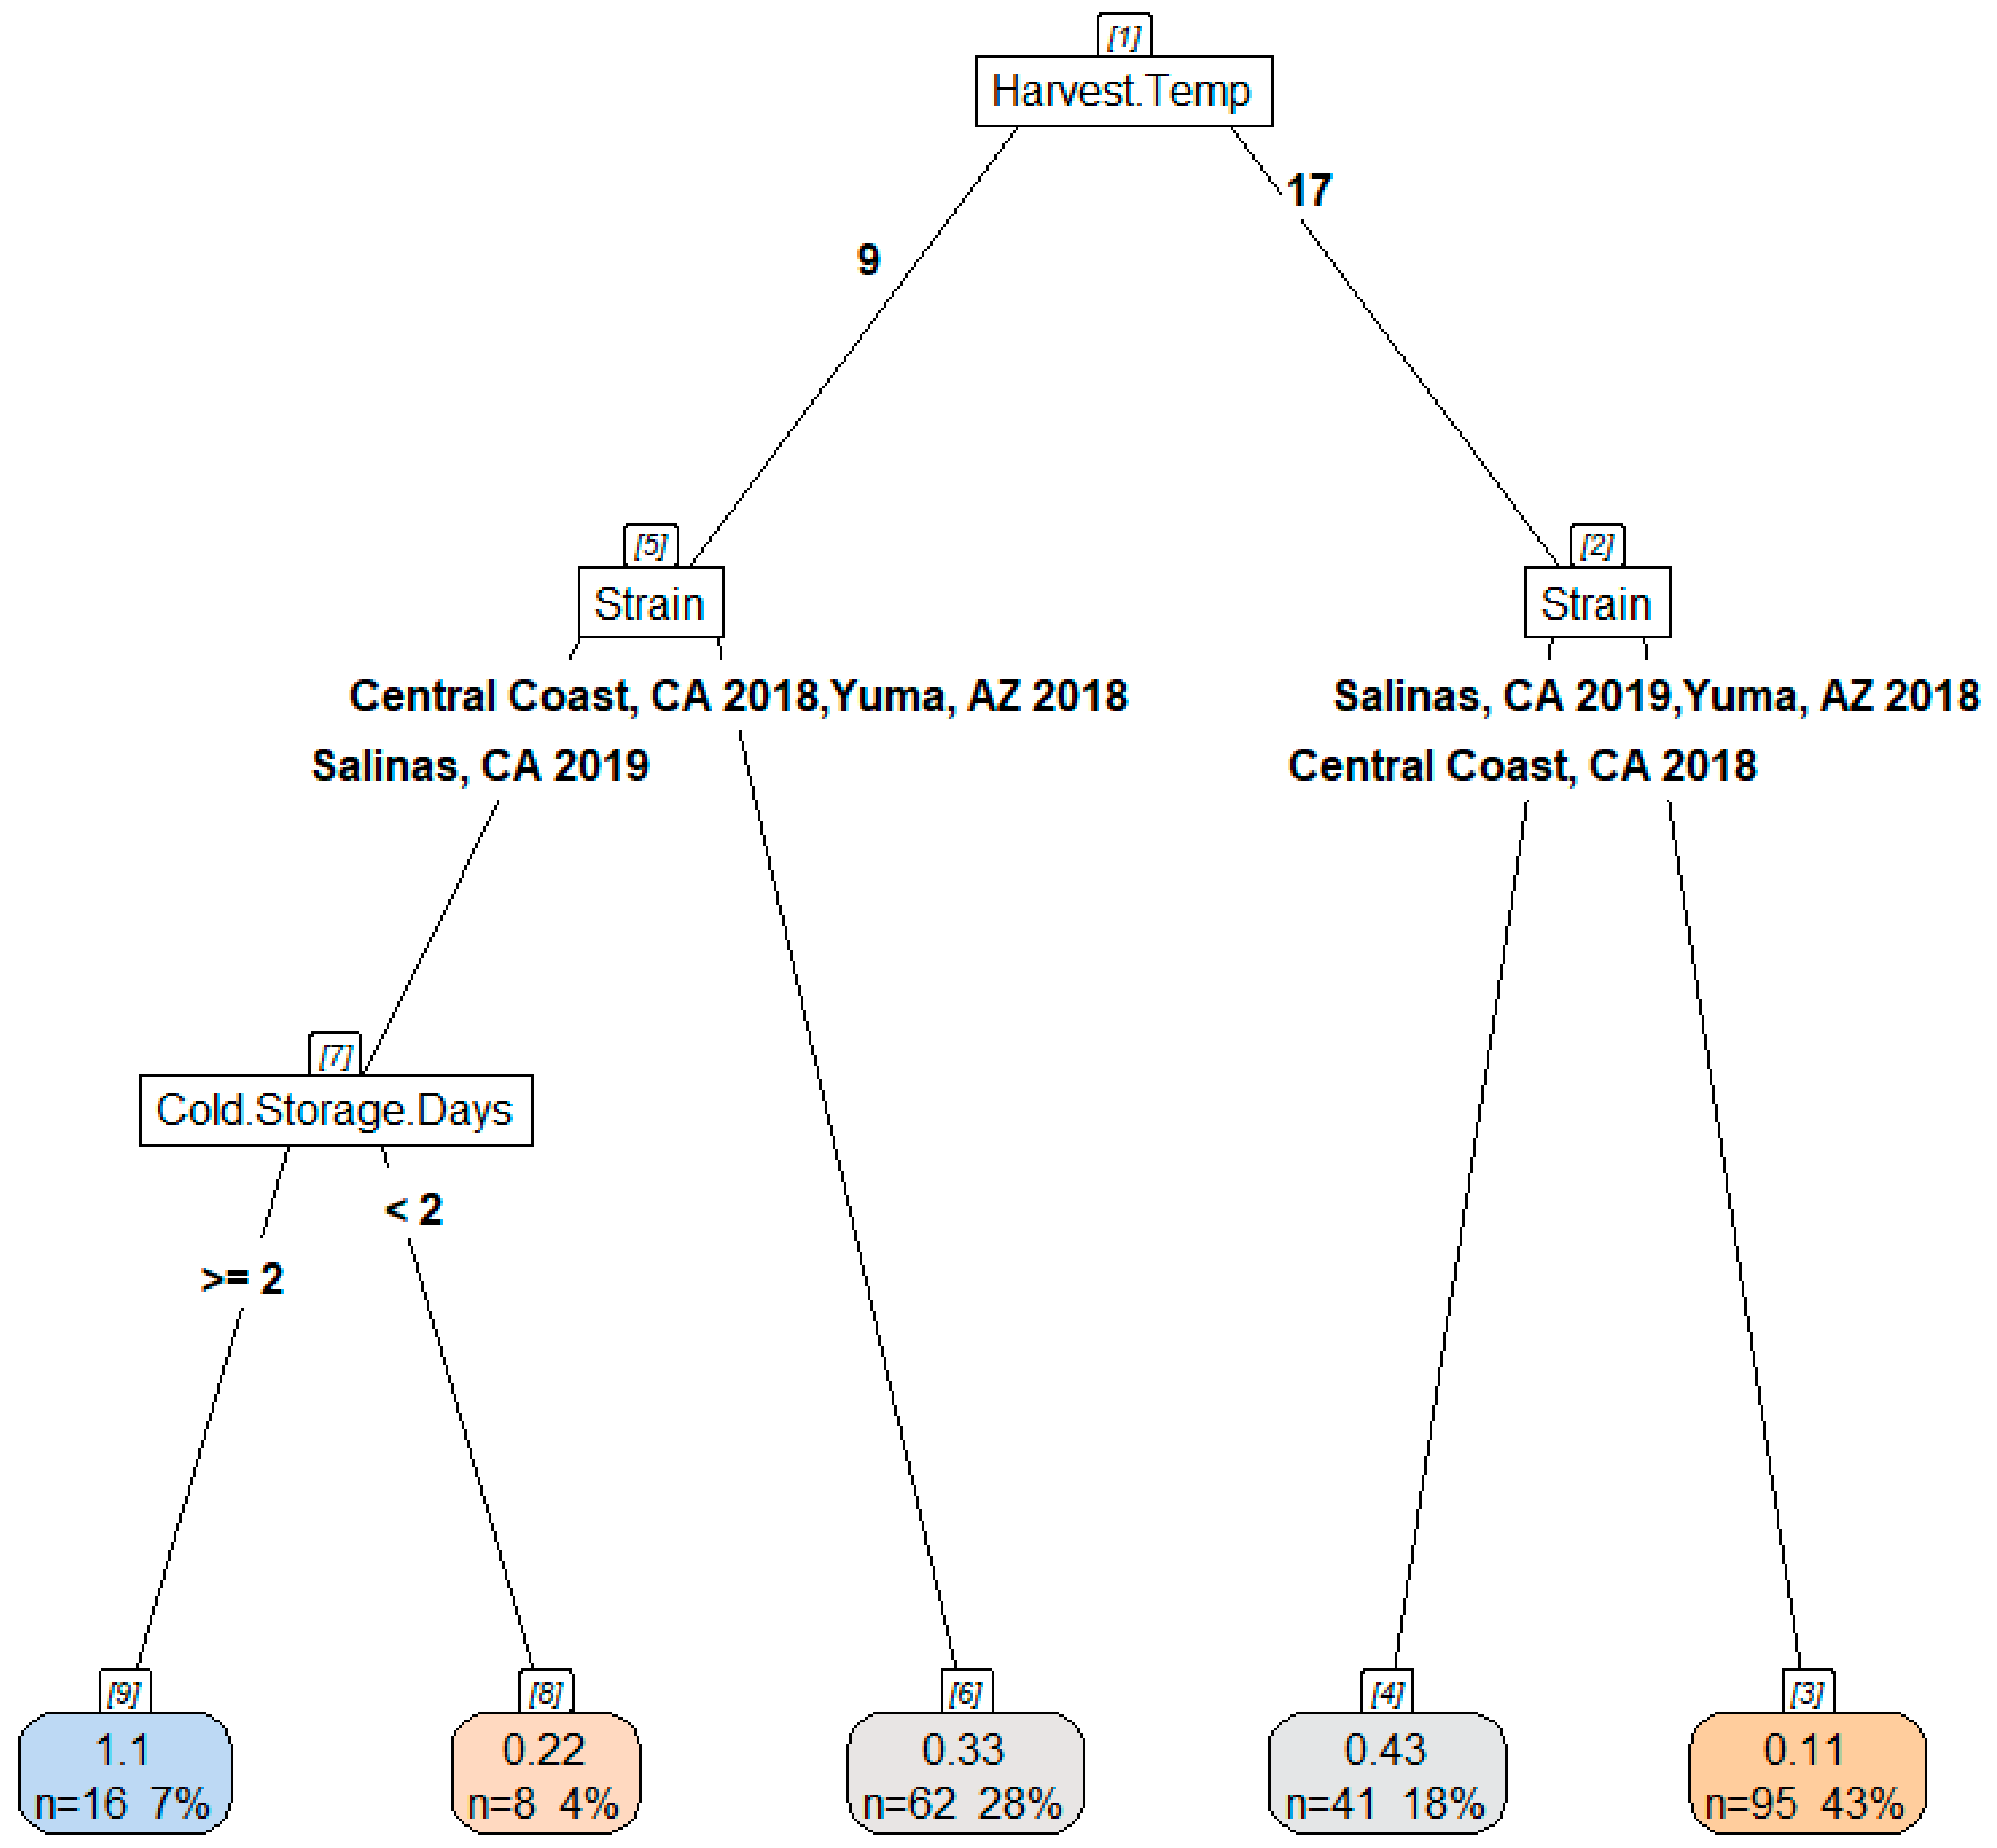
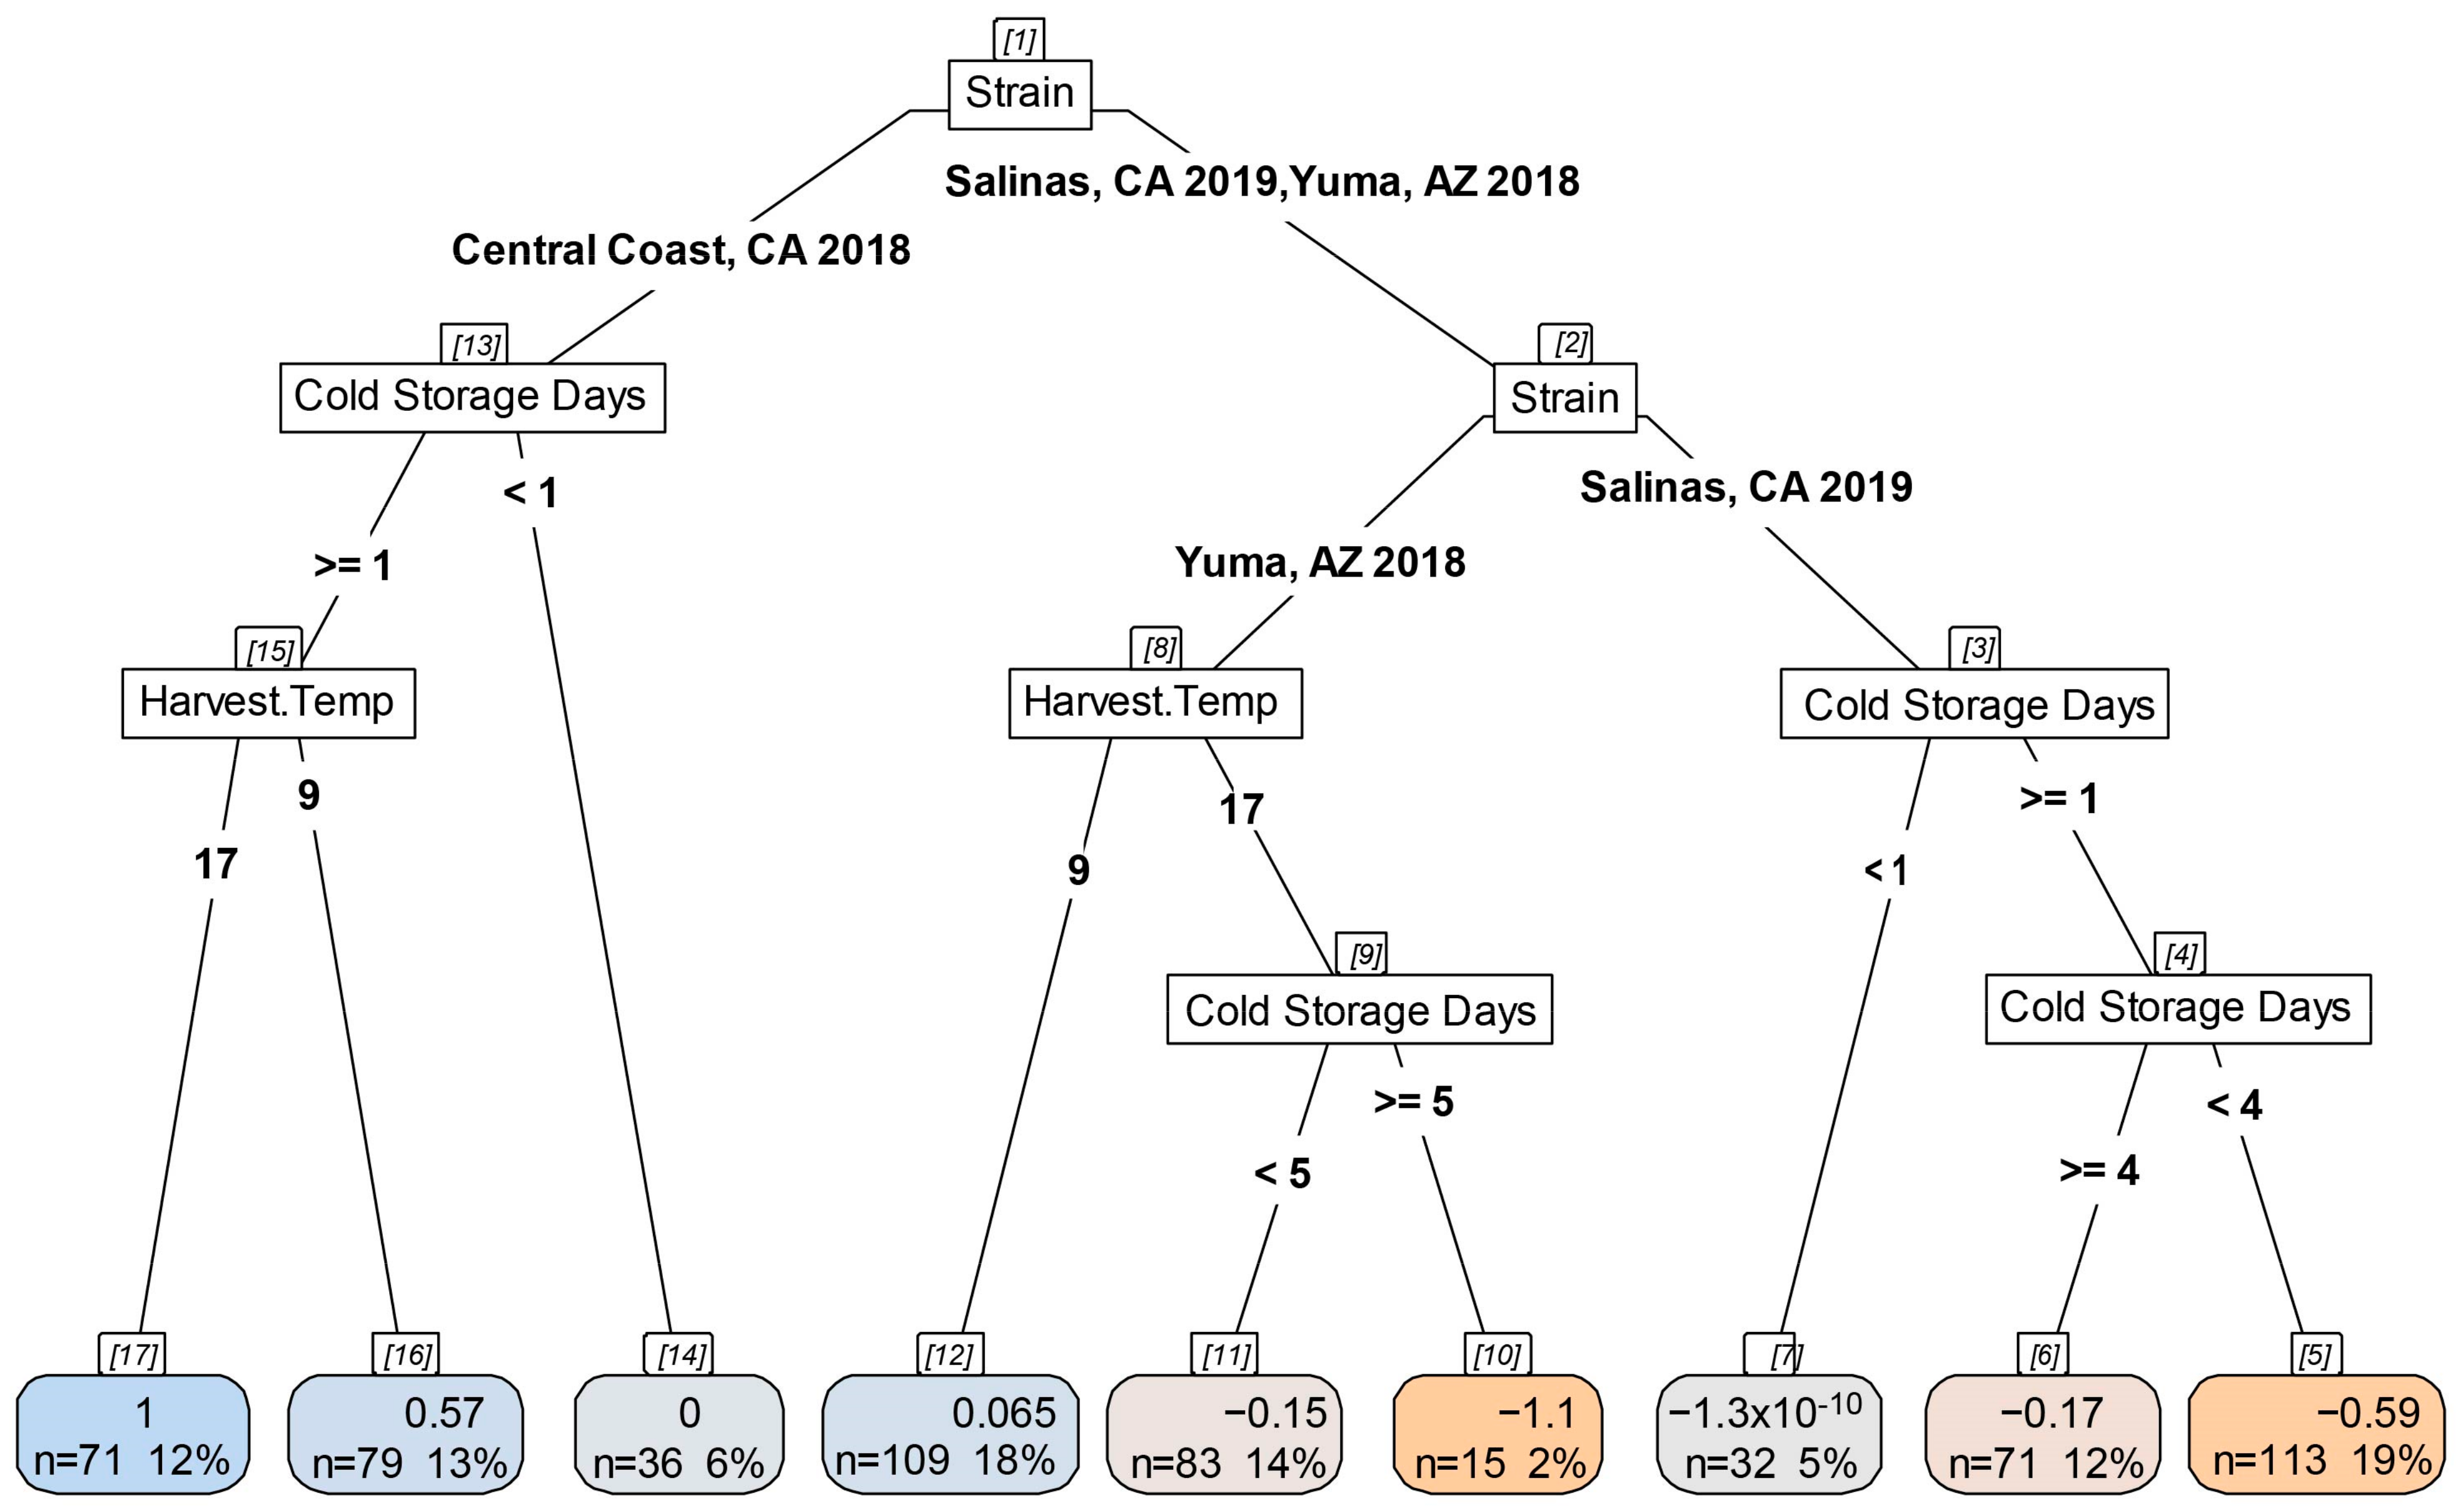
3.4. Acid and Chlorine Tolerance of STEC O157:H7 on Inoculated Lettuce During Cold Storage

The median log reduction due to acid treatment for all the strains increased from 0.18 (95% CI = −0.48, 0.97) on day 0 to 0.32 (95% CI = −0.35, 1.37) at 5 d of cold storage. The log reduction values due to acid treatment according to strain and harvest temperature were as shown in Figure 10. There were weak to no correlations between cold storage days and log reduction due to acid treatment, for lettuce harvested at either 9 °C (r = 0.28) or 17 °C (r = 0.02). The interaction of harvest temperature and strain significantly (p < 0.001, ANCOVA, η2 = 0.08 [95% CI = 0.03, 1.00]) affected the log reduction due to acid treatment during cold storage. The Salinas 2019 outbreak strain had significantly higher log reduction at 9 °C (0.81) than at 17 °C (0.07) [η2 < 0.01, 95% CI = 0.00, 1.00], see Figure S7. Regression tree analysis optimally explained the variance in the increase in log reduction in 6 splits (CP = 0.017, xerror = 0.950). The Salinas 2019 outbreak strain on lettuce harvested at 9 °C had the highest increase (1.1, probability = 0.07) under cold storage (≥2 days); see Figure 11. The Central Coast 2018 outbreak strain had the lowest log reduction due to acid treatment during cold storage (0.11, probability = 0.43). Cold storage day explained the highest variance (49.3%) of change in log reduction due to acid treatment (Figure S5).
The median log reduction due to chlorine treatment increased from 0.93 (95% CI = −0.34, 1.91) on day 0 to 1.01 (95% CI = −0.00, 1.80) at 5 days of cold storage. Partial correlations accounting for the chlorine concentrations showed weak relationship between cold storage days and log reduction due to chlorine treatment at 9 °C (0.08) and 17 °C (0.19). ANCOVA analysis with chlorine concentration as a covariate showed that harvest temperature and strain did not significantly (p > 0.05) affect the log reduction due to chlorine treatment (Figure S8). The effects of harvest temperature, strain and cold storage with chlorine concentration as a covariate were assessed using regression trees (Figure 12). Produce that was inoculated with outbreak strains Salinas 2019 and Yuma 2018 and stored for >2 days in cold storage after chlorine washing (>20 ppm) had the highest log reduction (1.8, probability = 0.07). Produce that was stored for ≥2 days in the cold had higher log reduction than that stored in the cold for <2 days. Concentration of chlorine (41.9%) and cold storage days (31.3%) accounted for the highest variance in the change in log reduction due to chlorine treatment (Figure S5).

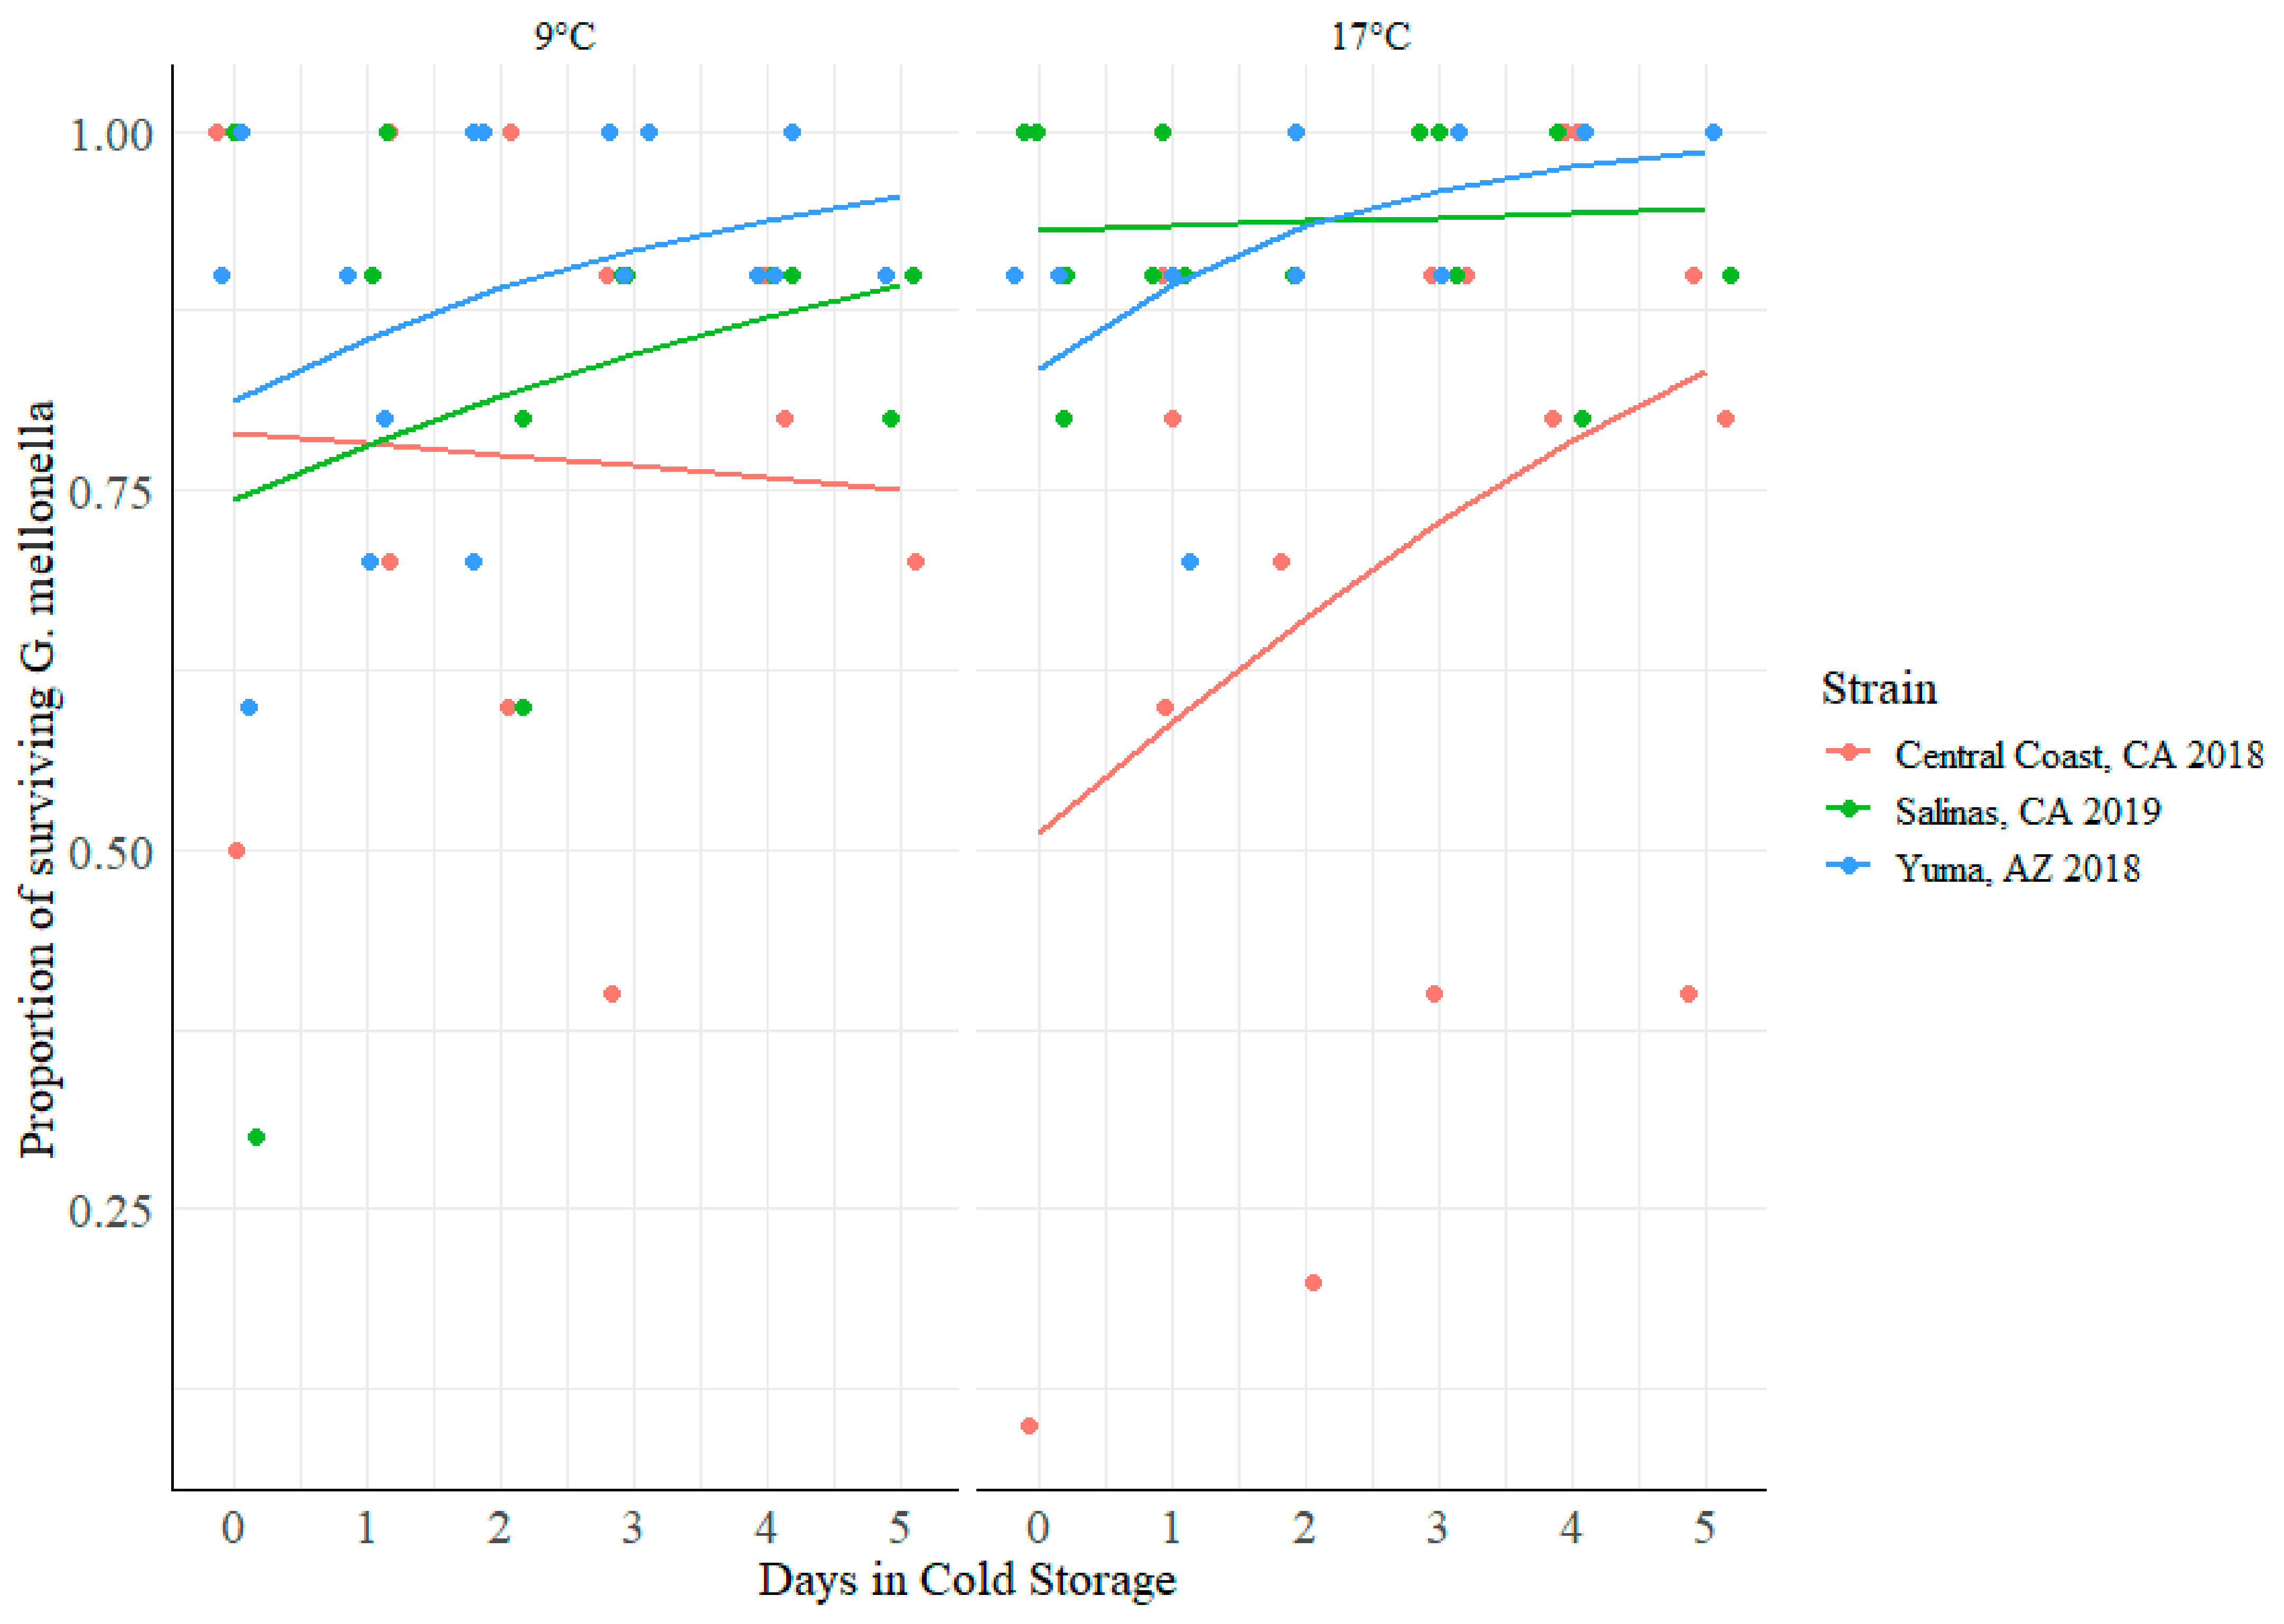
3.5. Impact of Cold Storage and Harvest Temperature on Virulence of STEC O157:H7

Binomial logistic regression with counts for survival of the G. mellonella larvae as the response variable was used to evaluate the effects of strain, harvest temperature and cold storage time on virulence. Strain specific differences from lettuce harvested at different harvesting temperatures over the cold storage period are as shown in Figure 13. The Central Coast 2018 outbreak strain on lettuce harvested at 9 °C and stored for 0 days was the baseline group. Larvae from the baseline group (day 0) were more likely (odds = 3.76, p < 0.001) to survive compared to larvae inoculated with STEC from lettuce held in cold storage over extended periods of time. Lower survival of the larvae (odds = 0.276, p = 0.015) occurred when the STEC O157:H7 inoculum was from lettuce harvested at 17 °C rather than at 9 °C (Figure S9). The time in cold storage and strain differences did not significantly (p > 0.05) affect the larvae survival rates. Interaction was reported between the strains and harvesting temperatures. Better survival (odds = 16.8, p = 0.001) of larvae was seen when they were inoculated with the Salinas 2019 outbreak strain from lettuce harvested at 17 °C compared to the baseline group.

4. Discussion

4.1. Changes in Physiology During Cut-to-Cool Were Minimal, While Significant Differences in Physiology Occurred During Cold Storage

Cold storage is used for storage and transportation of perishable foods including fruits and vegetables [61,62,63]. Refrigeration poses cold stress [64], so any pathogens present on those foods need to adapt to cold stress in order to survive. The optimal growth temperature of E. coli is 37 °C, and its growth is impaired under 21 °C and stops at 7.5 °C [65]. When the temperature shifts from optimal to low, bacterial cell growth is arrested [66]. During that temperature shift, phenotypic changes in bacteria happen, such as alterations in cell membrane, change in translational and transcriptional machinery, production of cold shock acclimation proteins [67], and expression of RpoS [68]. In STEC O157:H7, activation of genes related to the barrier function of the outer membrane, polysaccharide synthesis, and curli production increases [69]. In addition to these responses, STEC can enter dormant states on exposure to lower temperatures [35,36]. In inoculated field water at 15 °C, approximately 10–23% of the overall population of four STEC strains were seen to transform into persister cells [35]. When inoculated onto lettuce leaves, STEC O157:H7 maintained culturability at 16 °C, but entered the VBNC state when lettuce was stored at 8 °C [36]. Here, we utilized 2 °C to represent refrigerated storage of lettuce. The impacts of temperature shifts were evaluated by the two different harvest temperatures, which did have an effect on the entry of different STEC O157:H7 strains into dormant states. When inoculated lettuce was harvested at 9 °C compared to at 17 °C, a greater proportion of the Salinas 2019 outbreak strain entered the persister and VBNC states during cold storage, a trend similarly observed for VBNC cell formation in the Yuma 2018 outbreak strain. It may be that exposure to a lower temperature during harvest could prime the pathogen to better adapt to cold stress by enabling entry into dormant states. Taken together, our data and previous research demonstrate that STEC O157:H7 enters dormant states as part of the adaptation to cold stress.

4.2. Increasing Cold Storage Time Led to Reduced Acid Tolerance

STEC O157:H7 is very tolerant to low pH [70,71,72], with minimal decrease in cell numbers after 5 h at pH 2.5 [64]. Cold stress negatively impacts acid tolerance in STEC O157:H7, as 4 wk of cold stress of 4 °C and pH 5.5 prior to exposure to pH 1.5–2 in tryptic soy broth led to decreased tolerance [73]. In this study, STEC O157:H7 was stressed through comparatively low pH and low temperature for 4 wk prior to the actual treatment of pH 1.5–2.0, whereas our study only used low temperature stress over time. With our research, we found that cold storage led to decreased tolerance to pH 2.5, where cold storage of 2 days or more led to higher log reduction values for the Salinas 2019 outbreak strain, showing that acid tolerance decreases as duration of cold storage increases.

4.3. Increasing Cold Storage Time Did Not Influence Chlorine Tolerance

STEC O157:H7 can survive on leafy greens even after washing with chlorine-based sanitizers [28,29,74,75,76]. The duration for which the pathogen remains on pre-harvest lettuce leaves has been shown to increase tolerance to post-harvest chlorine washing. A 90 s chlorine exposure led to 3.79–5.37 log reduction of STEC O157:H7 in wash water of inoculated fresh-cut leafy greens [28]. In a study where lettuce was inoculated with STEC O157:H7, significantly lower reductions in a chlorine-based wash water were seen at 3 and 5 days post-inoculation compared to 1 day post-inoculation [74]. In our study, we found that STEC O157:H7 on lettuce stored in the cold for 5 days was able to survive chlorine treatment, with change in log reductions ranging from 0.58–1.8 log CFU/g, and that chlorine tolerance varied over the length of cold storage. One of the differences between the two studies is that cold stress was not applied in the study by Tyagi et al., which could lead to the differences in findings.

4.4. Increasing Cold Storage Time Led to Decreased Virulence in G. mellonella

Even as sudden temperature fluctuations lead to production of heat and cold shock proteins to protect bacterial functions, shifts in temperature can also lead to the production of bacterial virulence factors [77]. Stress response and virulence genes such as rpoS, stx1, and osmY have been shown to be highly expressed during cold shock transition from 37 °C to 4 °C or 7.5 °C [46,78]. At longer cold storage temperatures, for cells inoculated on leafy greens, virulence genes such as iha, stx2A, and eae have increased expression [49,50]. In lettuce lysate, a cold shock of 10 min or 1 h led to increased expression of stx1A [78]. Shiga toxins have a cytotoxic effect, and cytotoxicity is an aspect of virulence that can be quantified in laboratory studies. A study in tissue culture cells showed that stressed STEC O157 cells had higher cytotoxicity than non-stressed controls [79]. This study also showed that chlorine-, starvation-, acid-, or oxidative-stressed STEC O157 cells have higher survival during cold storage of 4 wk at 8, 12, and 16 °C compared to non-stressed cells [79].
We assessed relative virulence in our study with the insect model Galleria mellonella. Mammalian models of infection can raise ethical issues, generally are limited to small samples sizes, and are costly, and insect models provide an alternative representation of the innate immune response to pathogens. G. mellonella is a common insect model that is used to investigate bacterial pathogenesis, including STEC O157:H7 [55,57]. Our data shows that, in the Central Coast 2018 outbreak strain, there was a positive relationship between survival of larvae and cold storage, meaning that the virulence decreased with cold storage. This means that cold transportation of lettuce is likely to decrease virulence of STEC O157:H7 if it happened to contaminate lettuce. Our results are different from those reported in the previous study on cytotoxicity for stressed STEC O157 cells, although it is important to note that the previous research was conducted in cell culture rather than a more complex model host [79]. Previous studies have shown that cold temperature leads to increased virulence of gene expression, but only the effect of short-term shock has been evaluated on virulence phenotypes. Similar to our findings, a recent study showed decreased virulence of STEC O157:H7 in G. mellonella following refrigerated storage of sprouts [80].

4.5. Strains Affected the Variability in the Physiological, Tolerance, and Virulence Response of the Strains

The strains that we used belong to different phylogenetic categories. The Central Coast 2018 and Salinas 2019 outbreak strains are more closely related to each other than to the Yuma outbreak strain, which belongs to the REPEXH01 category [3]. The Central Coast 2018 outbreak strain belongs to Clade 1, and the Salinas 2019 strain belongs to Clade 2 of REPEXH02 [6]. A recent study showed that a REPEXH01 strain had a lower persister cell formation and a higher VBNC cell formation compared to a REPEXH02 strain [81]. A similar trend was seen with our data, where the Yuma outbreak strain had a lower persister cell formation, and a higher VBNC cell formation compared to the Salinas strain. The Central Coast 2018 outbreak strain had the least increase in LRV during chlorine treatment, meaning that it was able to tolerate chlorine stress. Another study has shown that these REP strains, including Central Coast, CA 2018, and Salinas, CA 2019 outbreak strains, can form stronger biofilms, and exhibit a higher tolerance to gastric acid stress compared to other non-REP strains [82,83]. Taken together, these data suggest differences in stress tolerance and entry into dormant states among REPEXH01 and REPEXH02 strains.

4.6. Limitations of the Study

Our study focused on three STEC O157:H7 strains from recent outbreaks linked to Romaine lettuce to determine the impact of cold storage on physiological changes among these strains. Including additional strains as an outgroup for comparison could determine if these findings differ for strains not associated with leafy greens. We evaluated stress tolerance and virulence responses for STEC O157:H7 only on lettuce, so we cannot determine if the effects observed were simply due to changes in temperature, or a combination of association with the lettuce and changes in temperature. To discern inoculated strains from background microbes, we utilized rifampicin-resistant isolates. We did not compare the virulence or stress tolerance of the rifampicin-resistant strains to the parental strains that were rifampicin-susceptible, but research shows that rifampicin-resistant strains acted similarly compared to rifampicin-susceptible strains when presented with stress [35,84,85]. Studies that have determined exposure levels of O157:H7 have reported them to be usually quite low (<100 cells) [86], and the levels that were used here were designed to facilitate enumeration of cells in dormant states, which is similar to previous research [35,87]. While allowing measurement of persister and VBNC cells, this does not allow us to account for any density dependent effects on stress tolerance or virulence.

5. Conclusions

Our study aimed to understand the microbial dynamics that occur when pathogenic cells such as STEC O157:H7 are exposed to temperature shifts during harvesting and storage. These findings can inform the assessment of risks posed by STEC O157:H7 on lettuce. We found that both low harvest temperatures and prolonged cold storage increased the transition of STEC O157:H7 into dormant states. This transition poses a risk of underestimating pathogen survival when microbial concentrations in lettuce are evaluated, which is important for more accurate risk modeling. Our study highlights the need to account for conditions that promote dormancy when using such data in QMRA. Furthermore, we demonstrated that the efficacy of sanitization processes, such as chlorine washing to minimize post-harvest cross-contamination, is influenced by the exposure of pathogens to temperatures at harvest or during storage. We also established that increasing the duration of cold storage did not result in evidence of increased strain virulence. Future risk assessments should therefore not only consider the effects of harvesting and cold storage temperatures on STEC O157:H7 die-off or growth but also account for physiological changes that could otherwise lead to an underestimation of risks. Entry into dormant states also poses a risk, as in routine culturing, only viable cells are considered. We concluded that colder harvest temperature followed by cold storage led to a higher transformation of STEC O157:H7 into dormant states. Length of cold storage led to greater reduction of STEC O157:H7 due to acid treatment, but not chlorine treatment. These results demonstrate that forward processing of lettuce does not lead to increased risk of STEC O157:H7 survival or stress tolerance.

Supplementary Materials

The following supporting information can be downloaded at: https://www.mdpi.com/article/10.3390/applmicrobiol5020045/s1, Figure S1: Post-hoc tests for pairwise comparison of the interactive effect of strain and harvesting temperature on VBNC cells of STEC O157:H7 on Romaine lettuce. Figure S2: Post-hoc tests for pairwise comparison of the interactive effect of strain and harvesting temperature on persister percentage of STEC O157:H7 on Romaine lettuce. Figure S3: Pairwise comparison of the effect of strain on the on the injured and culturable cells of STEC O157:H7 during incubation of Romaine lettuce at harvesting temperature. Figure S4: Pairwise comparison of the predicted log reduction values of the culturable cells for different strains in lettuce harvested at different temperatures. Figure S5: Most important factors explaining the variance in (A) culturable and (B) VBNC cells and (C) acid and (D) chlorine tolerance. Figure S6: Pairwise comparison of the predicted increase in VBNC cells for different strains in lettuce harvested at different temperatures. Figure S7: Pairwise comparison of the predicted increase in log reduction due to acid treatment. Figure S8: Pairwise comparison of the predicted increase in log reduction due to chlorine treatment. Figure S9: Odd ratios for the factors affecting the survival of G. mellonella after inoculation with STEC cells from cold stored lettuce.

Author Contributions

Conceptualization, T.M.B. and J.M.; methodology, D.S. and J.O.O.; formal analysis, D.S. and J.O.O.; investigation, D.S., J.O.O., C.C., A.E., C.J.K. and E.S.R.; writing—original draft preparation D.S. and J.O.O.; writing—review and editing, T.M.B., J.M., D.S. and J.O.O.; visualization, D.S. and J.O.O.; supervision, T.M.B.; funding acquisition—T.M.B. and J.M. All authors have read and agreed to the published version of the manuscript.

Funding

The funding for this study was made possible by The Center for Produce Safety and the U.S. Department of Agriculture’s (USDA) Agricultural Marketing Service through grant AM21SCBPCA1002.

Data Availability Statement

Data are available on request to the authors.

Acknowledgments

We would like to thank Church Brothers Farms in Salinas, CA, for their Romaine harvest temperature data.

Conflicts of Interest

The authors declare no conflicts of interest.

Abbreviations

The following abbreviations are used in this manuscript:
VBNCViable But Non-Culturable
STECShiga toxin-producing E. coli
HUSHemolytic Uremic Syndrome
PAAPeroxyAcetic Acid
MDHHSMichigan Department of Health and Human Services
LBLuria Bertani
TSATryptic Soy Agar
RifRifampicin
PBSPhosphate Buffer Saline
MICMinimum Inhibitory Concentration
PMAPropidium MonoAzide
MSUMichigan State University
qpCRQuantitative Polymerase Chain Reaction
SGFSynthetic Gastric Fluid
EmmeansEstimated Marginal Means
E. coliEscherichia coli
CPComplexity Parameter
xerrorCross-validation Error
AICcAkaike Information Criterion

References

  1. Berger, C.N.; Sodha, S.V.; Shaw, R.K.; Griffin, P.M.; Pink, D.; Hand, P.; Frankel, G. Fresh Fruit and Vegetables as Vehicles for the Transmission of Human Pathogens. Environ. Microbiol. 2010, 12, 2385–2397. [Google Scholar] [CrossRef] [PubMed]
  2. Yang, X.; Scharff, R. Foodborne Illnesses from Leafy Greens in the United States: Attribution, Burden, and Cost. J. Food Prot. 2024, 87, 100275. [Google Scholar] [CrossRef] [PubMed]
  3. Koutsoumanis, K.; Allende, A.; Alvarez-Ordóñez, A.; Bover-Cid, S.; Chemaly, M.; Davies, R.; De Cesare, A.; Herman, L.; Hilbert, F.; Lindqvist, R.; et al. Pathogenicity Assessment of Shiga Toxin-Producing Escherichia coli (STEC) and the Public Health Risk Posed by Contamination of Food with STEC. EFSA J. 2020, 18, e05967. [Google Scholar] [CrossRef]
  4. FDA. Factors Potentially Contributing to the Contamination of Romaine Lettuce Implicated in the Three Outbreaks of E. coli O157:H7 During the Fall of 2019. Available online: https://www.fda.gov/food/outbreaks-foodborne-illness/factors-potentially-contributing-contamination-romaine-lettuce-implicated-three-outbreaks-e-coli (accessed on 12 August 2024).
  5. Bottichio, L.; Keaton, A.; Thomas, D.; Fulton, T.; Tiffany, A.; Frick, A.; Mattioli, M.; Kahler, A.; Murphy, J.; Otto, M. Shiga Toxin–Producing Escherichia coli Infections Associated with Romaine Lettuce—United States, 2018. Clin. Infect. Dis. 2020, 71, e323–e330. [Google Scholar] [CrossRef]
  6. Chen, J.C.; Patel, K.; Smith, P.A.; Vidyaprakash, E.; Snyder, C.; Tagg, K.A.; Webb, H.E.; Schroeder, M.N.; Katz, L.S.; Rowe, L.A.; et al. Reoccurring Escherichia coli O157:H7 Strain Linked to Leafy Greens–Associated Outbreaks, 2016–2019—Volume 29, Number 9—September 2023—Emerging Infectious Diseases Journal—CDC. Emerg. Infect. Dis. 2023, 29, 1895–1899. [Google Scholar] [CrossRef]
  7. CDC. Multistate Outbreak of Shiga Toxin-Producing Escherichia coli O157:H7 Infections Linked to Leafy Greens (Final Update) | E. coli. Available online: https://archive.cdc.gov/www_cdc_gov/ecoli/2017/o157h7-12-17/index.html (accessed on 12 August 2024).
  8. Center for Disease Control CDC. E. coli Outbreak Linked to Romaine Lettuce B—Investigation Updates | E. coli Infections Linked to Romaine Lettuce | November 2018 | E. coli. 2018. Available online: https://archive.cdc.gov/www_cdc_gov/ecoli/2018/o157h7-11-18/updates.html (accessed on 23 July 2024).
  9. Center for Disease Control CDC. E. coli Outbreak Linked to Romaine Lettuce A—Advice | Investigation Notice: Multistate Outbreak of E. coli O157:H7 Infections April 2018 | E. coli. 2018. Available online: https://archive.cdc.gov/www_cdc_gov/ecoli/2018/o157h7-04-18/advice-consumers.html#print (accessed on 23 July 2024).
  10. Center for Disease Control CDC. E. coli Outbreak Linked to Romaine Lettuce—Investigation Updates | E. coli Infections | November 2019 | E. coli. 2019. Available online: https://archive.cdc.gov/www_cdc_gov/ecoli/2019/o157h7-11-19/updates.html (accessed on 23 July 2024).
  11. Sinkel, D. Good Agriculture Practices for Lettuce. Available online: https://www.nifa.usda.gov/sites/default/files/resource/Lettuce%20Good%20Agricultural%20Practices508.pdf (accessed on 30 April 2025).
  12. Lettuce Production and Trade—Rural Migration Blog. Migration Dialogue. Available online: https://migration.ucdavis.edu/rmn/blog/post/?id=2699 (accessed on 25 July 2024).
  13. USDA ERS USDA ERS—Chart Detail. Available online: https://www.ers.usda.gov/data-products/chart-gallery/gallery/chart-detail/?chartId=89157 (accessed on 25 July 2024).
  14. Smith, R.; Cruz, S.; Benito, S. Leaf Lettuce Production in California. Available online: https://anrcatalog.ucanr.edu/pdf/7216.pdf (accessed on 30 April 2025).
  15. Gombas, D.; Gorny, J. Commodity Specific Food Safety Guidelines for the Lettuce and Leafy Greens Supply Chain, 1st ed.; International Fresh-Cut Produce Association: Washington, DC, USA, 2006. Available online: https://www.fda.gov/media/77279/download?attachment (accessed on 30 April 2025).
  16. Brown, W.; Ryser, E.; Gorman, L.; Steinmaus, S.; Vorst, K. Transit Temperatures Experienced by Fresh-Cut Leafy Greens during Cross-Country Shipment. Food Control 2016, 61, 146–155. [Google Scholar] [CrossRef]
  17. Gu, G.; Ding, Q.; Redding, M.; Yang, Y.; O’Brien, R.; Gu, T.; Zhang, B.; Zhou, B.; Micallef, S.A.; Luo, Y. Differential Microbiota Shift on Whole Romaine Lettuce Subjected to Source or Forward Processing and on Fresh-Cut Products during Cold Storage. Int. J. Food Microbiol. 2024, 416, 110665. [Google Scholar] [CrossRef]
  18. Khalil, R.K.S. Effect of Abusive Storage Temperatures on Growth and Survival of Escherichia coli O157:H7 on Leafy Salad Vegetables in Egypt. LWT-Food Sci. Technol. 2016, 65, 954–962. [Google Scholar] [CrossRef]
  19. Choi, S.; Bang, J.; Kim, H.; Beuchat, L.R.; Ryu, J. Survival and Colonization of Escherichia coli O157:H7 on Spinach Leaves as Affected by Inoculum Level and Carrier, Temperature and Relative Humidity. J. Appl. Microbiol. 2011, 111, 1465–1472. [Google Scholar] [CrossRef]
  20. Owade, J.O.; Bergholz, T.M.; Mitchell, J. A Review of Conditions Influencing Fate of Shiga Toxin-producing Escherichia coli O157:H7 in Leafy Greens. Compr. Rev. Food Sci. Food Saf. 2024, 23, e70013. [Google Scholar] [CrossRef]
  21. Luo, Y.; He, Q.; McEvoy, J.L. Effect of Storage Temperature and Duration on the Behavior of Escherichia coli O157:H7 on Packaged Fresh-cut Salad Containing Romaine and Iceberg Lettuce. J. Food Sci. 2010, 75, M390–M397. [Google Scholar] [CrossRef]
  22. Leonard, S.R.; Simko, I.; Mammel, M.K.; Richter, T.K.S.; Brandl, M.T. Seasonality, Shelf Life and Storage Atmosphere Are Main Drivers of the Microbiome and Escherichia coli O157:H7 Colonization of Post-Harvest Lettuce Cultivated in a Major Production Area in California. Environ. Microbiome 2021, 16, 25. [Google Scholar] [CrossRef] [PubMed]
  23. Ayrapetyan, M.; Williams, T.; Oliver, J.D. Relationship between the Viable but Nonculturable State and Antibiotic Persister Cells. J. Bacteriol. 2018, 200, 1–15. [Google Scholar] [CrossRef] [PubMed]
  24. King, A.D.; Magnuson, J.A.; Török, T.; Goodman, N. Microbial Flora and Storage Quality of Partially Processed Lettuce. J. Food Sci. 1991, 56, 459–461. [Google Scholar] [CrossRef]
  25. Baur, S.; Klaiber, R.; Hammes, W.P.; Carle, R. Sensory and Microbiological Quality of Shredded, Packaged Iceberg Lettuce as Affected by Pre-Washing Procedures with Chlorinated and Ozonated Water. Innov. Food Sci. Emerg. Technol. 2004, 5, 45–55. [Google Scholar] [CrossRef]
  26. USDA. Peracetic Acid Processing. 2000. Available online: https://www.ams.usda.gov/sites/default/files/media/Peracetic%20Acid%20Technical%20Report%20Handling.pdf (accessed on 30 April 2025).
  27. National Agricultural Library. Use of Ozone to Enhance the Safety of Produce. Available online: https://www.nal.usda.gov/research-tools/food-safety-research-projects/use-ozone-enhance-safety-produce (accessed on 2 September 2024).
  28. Davidson, G.R.; Kaminski-Davidson, C.N.; Ryser, E.T. Persistence of Escherichia coli O157:H7 during Pilot-Scale Processing of Iceberg Lettuce Using Flume Water Containing Peroxyacetic Acid-Based Sanitizers and Various Organic Loads. Int. J. Food Microbiol. 2017, 248, 22–31. [Google Scholar] [CrossRef]
  29. Davidson, G.R.; Buchholz, A.L.; Ryser, E.T. Efficacy of Commercial Produce Sanitizers against Nontoxigenic Escherichia coli O157:H7 during Processing of Iceberg Lettuce in a Pilot-Scale Leafy Green Processing Line. J. Food Prot. 2013, 76, 1838–1845. [Google Scholar] [CrossRef]
  30. Saldaña, Z.; Sánchez, E.; Xicohtencatl-Cortes, J.; Puente, J.L.; Girón, J.A. Surface Structures Involved in Plant Stomata and Leaf Colonization by Shiga-Toxigenic Escherichia coli O157:H7. Front. Microbiol. 2011, 2, 119. [Google Scholar] [CrossRef]
  31. Wang, J.; Wang, S.; Sun, Y.; Li, C.; Li, Y.; Zhang, Q.; Wu, Z. Reduction of Escherichia coli O157:H7 and Naturally Present Microbes on Fresh-Cut Lettuce Using Lactic Acid and Aqueous Ozone. RSC Adv. 2019, 9, 22636–22643. [Google Scholar] [CrossRef]
  32. Zhang, B.; Fu, Y.; Wang, F.; Yang, J.; Pan, Z.; Huang, M.; Shen, K.; Shen, C. Multidrug-Resistant Enteroaggregative Escherichia coli (EAEC) Enters Dormant State during Heat Treatment: A Potential Hazard in Municipal Sludge. Environ. Pollut. 2022, 305, 119312. [Google Scholar] [CrossRef]
  33. Leinberger, F.H.; Cassidy, L.; Edelmann, D.; Schmid, N.E.; Oberpaul, M.; Blumenkamp, P.; Schmidt, S.; Natriashvili, A.; Ulbrich, M.H.; Tholey, A. Protein Aggregation Is a Consequence of the Dormancy-Inducing Membrane Toxin TisB in Escherichia coli. mSystems 2024, 9, e01060-24. [Google Scholar] [CrossRef] [PubMed]
  34. Munther, D.S.; Carter, M.Q.; Aldric, C.V.; Ivanek, R.; Brandl, M.T. Formation Escherichia coli O157:H7 Persister Cells in the Lettuce Phyllosphere and Application of Differential Equation Models To Predict Their Prevalence on Lettuce Plants in the Field. Appl. Environ. Microbiol. 2020, 86, e01602-19. [Google Scholar] [CrossRef] [PubMed]
  35. Thao, S.; Brandl, M.T.; Carter, M.Q. Enhanced Formation of Shiga Toxin-Producing Escherichia coli Persister Variants in Environments Relevant to Leafy Greens Production. Food Microbiol. 2019, 84, 103241. [Google Scholar] [CrossRef]
  36. Dinu, L.D.; Bach, S. Induction of Viable but Nonculturable Escherichia coli O157:H7 in the Phyllosphere of Lettuce: A Food Safety Risk Factors. Appl. Environ. Microbiol. 2011, 77, 8295–8302. [Google Scholar] [CrossRef]
  37. Truchado, P.; Gómez-Galindo, M.; Gil, M.I.; Allende, A. Cross-Contamination of Escherichia coli O157:H7 and Listeria monocytogenes in the Viable but Non-Culturable (VBNC) State during Washing of Leafy Greens and the Revival during Shelf-Life. Food Microbiol. 2023, 109, 104155. [Google Scholar] [CrossRef] [PubMed]
  38. Zhang, Y.; Gross, C.A. Cold Shock Response in Bacteria. Annu. Rev. Genet. 2021, 55, 377–400. [Google Scholar] [CrossRef]
  39. Phadtare, S.; Inouye, M. Genome-Wide Transcriptional Analysis of the Cold Shock Response in Wild-Type and Cold-Sensitive, Quadruple-Csp-Deletion Strains of Escherichia coli. J. Bacteriol. 2004, 186, 7007–7014. [Google Scholar] [CrossRef]
  40. Keto-Timonen, R.; Hietala, N.; Palonen, E.; Hakakorpi, A.; Lindström, M.; Korkeala, H. Cold Shock Proteins: A Minireview with Special Emphasis on Csp-Family of Enteropathogenic Yersinia. Front. Microbiol. 2016, 7, 1151. [Google Scholar] [CrossRef]
  41. White-Ziegler, C.A.; Um, S.; Pérez, N.M.; Berns, A.L.; Malhowski, A.J.; Young, S. Low Temperature (23 °C) Increases Expression of Biofilm-, Cold-Shock- and RpoS-Dependent Genes in Escherichia coli K-12. Microbiology 2008, 154, 148–166. [Google Scholar] [CrossRef]
  42. King, T.; Kocharunchitt, C.; Gobius, K.; Bowman, J.P.; Ross, T. Global Genome Response of Escherichia coli O157:H7 Sakai during Dynamic Changes in Growth Kinetics Induced by an Abrupt Temperature Downshift. PLoS ONE 2014, 9, e99627. [Google Scholar] [CrossRef]
  43. Kocharunchitt, C.; King, T.; Gobius, K.; Bowman, J.P.; Ross, T. Integrated Transcriptomic and Proteomic Analysis of the Physiological Response of Escherichia coli O157:H7 Sakai to Steady-State Conditions of Cold and Water Activity Stress. Mol. Cell. Proteom. 2012, 11, M111.009019. [Google Scholar] [CrossRef] [PubMed]
  44. Jiang, W.; Hou, Y.; Inouye, M. CspA, the Major Cold-Shock Protein Escherichia coli, Is an RNA Chaperone. J. Biol. Chem. 1997, 272, 196–202. [Google Scholar] [CrossRef]
  45. Crozier, L.; Hedley, P.E.; Morris, J.; Wagstaff, C.; Andrews, S.C.; Toth, I.; Jackson, R.W.; Holden, N.J. Whole-Transcriptome Analysis of Verocytotoxigenic Escherichia coli O157:H7 (Sakai) Suggests Plant-Species-Specific Metabolic Responses on Exposure to Spinach and Lettuce Extracts. Front. Microbiol. 2016, 7, 1088. [Google Scholar]
  46. Kennedy, N.M.; Mukherjee, N.; Banerjee, P. Escherichia coli O157:H7 Cells Exposed to Lettuce Leaf Lysate in Refrigerated Conditions Exhibit Differential Expression of Selected Virulence and Adhesion-Related Genes with Altered Mammalian Cell Adherence. J. Food Prot. 2016, 79, 1259–1265. [Google Scholar] [CrossRef] [PubMed]
  47. Yamanaka, K.; Fang, L.; Inouye, M. The CspA Family in Escherichia coli: Multiple Gene Duplication for Stress Adaptation. Mol. Microbiol. 1998, 27, 247–255. [Google Scholar] [CrossRef]
  48. Kim, Y.; Wang, X.; Zhang, X.; Grigoriu, S.; Page, R.; Peti, W.; Wood, T.K. Escherichia coli Toxin/Antitoxin Pair MqsR/MqsA Regulate Toxin CspD. Environ. Microbiol. 2010, 12, 1105–1121. [Google Scholar] [CrossRef]
  49. Sharma, M.; Lakshman, S.; Ferguson, S.; Ingram, D.T.; Luo, Y.; Patel, J. Effect of Modified Atmosphere Packaging on the Persistence and Expression of Virulence Factors of Escherichia coli O157:H7 on Shredded Iceberg Lettuce. J. Food Prot. 2011, 74, 718–726. [Google Scholar] [CrossRef]
  50. Carey, C.M.; Kostrzynska, M.; Thompson, S. Escherichia coli O157:H7 Stress and Virulence Gene Expression on Romaine Lettuce Using Comparative Real-Time PCR. J. Microbiol. Methods 2009, 77, 235–242. [Google Scholar] [CrossRef]
  51. Sharma, D.; Kraft, A.L.; Owade, J.O.; Milicevic, M.; Yi, J.; Bergholz, T.M. Impact of Biotic and Abiotic Factors on Listeria monocytogenes, Salmonella enterica, and Enterohemorrhagic Escherichia coli in Agricultural Soil Extracts. Microorganisms 2024, 12, 1498. [Google Scholar] [CrossRef]
  52. Li, B.; Chen, J.Q. Real-Time PCR Methodology for Selective Detection of Viable Escherichia coli O157:H7CELLS by Targeting Z3276 as a Genetic Marker. Appl. Environ. Microbiol. 2012, 78, 5297–5304. [Google Scholar] [CrossRef]
  53. Beumer, R.R.; De Vries, J.; Rombouts, F.M. Campylobacter Jejuni Non-Culturable Coccoid Cells. Int. J. Food Microbiol. 1992, 15, 153–163. [Google Scholar] [CrossRef] [PubMed]
  54. Cardenas-Alvarez, M.X.; Townsend Ramsett, M.K.; Malekmohammadi, S.; Bergholz, T.M. Evidence of Hypervirulence in Listeria monocytogenes Clonal Complex 14. J. Med. Microbiol. 2019, 68, 1677–1685. [Google Scholar] [CrossRef] [PubMed]
  55. Scalfaro, C.; Iacobino, A.; Nardis, C.; Franciosa, G. Galleria Mellonella as an in Vivo Model for Assessing the Protective Activity of Probiotics against Gastrointestinal Bacterial Pathogens. FEMS Microbiol. Lett. 2017, 364, fnx064. [Google Scholar] [CrossRef] [PubMed]
  56. Finney, D.J.; Stevens, W.L. A Table for the Calculation of Working Probits and Weights in Probit Analysis. Biometrika 1948, 35, 191–201. [Google Scholar] [CrossRef]
  57. The CRAN Team. Community Ecology Package. 2022. Available online: https://cran.r-project.org/web/packages/vegan/vegan.pdf (accessed on 30 April 2025).
  58. Wickham, H.; François, R.; Henry, L.; Müller, K.; Vaughan, D. Dplyr: A Grammar of Data Manipulation. R Package Version 1.1.2. Computer Software. 2023. Available online: https://dplyr.tidyverse.org/ (accessed on 30 April 2025).
  59. Searle, S.R.; Speed, F.M.; Milliken, G.A. Population Marginal Means in the Linear Model: An Alternative to Least Squares Means. Am. Stat. 1980, 34, 216–221. [Google Scholar] [CrossRef]
  60. Therneau, T.; Atkinson, B.; Ripley, B. Rpart: Recursive Partitioning and Regression Trees. R Package Version 4.1-15. Available online: https://cran.r-project.org/web/packages/rpart/rpart.pdf (accessed on 30 April 2025).
  61. James, S.J.; James, C.; Evans, J.A. Modelling of Food Transportation Systems—A Review. Int. J. Refrig. 2006, 29, 947–957. [Google Scholar] [CrossRef]
  62. Zhao, Y.; Zhang, X.; Xu, X. Application and Research Progress of Cold Storage Technology in Cold Chain Transportation and Distribution. J. Therm. Anal. Calorim. 2020, 139, 1419–1434. [Google Scholar] [CrossRef]
  63. Qi, T.; Ji, J.; Zhang, X.; Liu, L.; Xu, X.; Ma, K.; Gao, Y. Research Progress of Cold Chain Transport Technology for Storage Fruits and Vegetables. J. Energy Storage 2022, 56, 105958. [Google Scholar] [CrossRef]
  64. Russell, N.J. Bacterial Membranes: The Effects of Chill Storage and Food Processing. An Overview. Int. J. Food Microbiol. 2022, 79, 27–34. [Google Scholar] [CrossRef]
  65. Strocchi, M.; Ferrer, M.; Timmis, K.N.; Golyshin, P.N. Low Temperature-Induced Systems Failure in Escherichia coli: Insights from Rescue by Cold-Adapted Chaperones. Proteomics 2006, 6, 193–206. [Google Scholar] [CrossRef]
  66. Barria, C.; Malecki, M.; Arraiano, C.M. Bacterial Adaptation to Cold. Microbiology 2013, 159, 2437–2443. [Google Scholar] [CrossRef] [PubMed]
  67. Yamanaka, K. Cold Shock Response in Escherichia coli. J. Mol. Microbiol. Biotechnol. 1999, 1, 193–202. [Google Scholar]
  68. Vidovic, S.; Mangalappalli-Illathu, A.K.; Korber, D.R. Prolonged Cold Stress Response of Escherichia coli O157 and the Role of RpoS. Int. J. Food Microbiol. 2011, 146, 163–169. [Google Scholar] [CrossRef] [PubMed]
  69. King, T.; Vockler, C.J.; Allnutt, T.R.; Fegan, N. Transcriptomic Response of Escherichia coli O157 Isolates on Meat: Comparison between a Typical Australian Isolate from Cattle and a Pathogenic Clinical Isolate. Food Microbiol. 2019, 82, 378–387. [Google Scholar] [CrossRef] [PubMed]
  70. Jordan, K.N.; Oxford, L.; O’Byrne, C.P. Survival of Low-PH Stress by Escherichia coli O157:H7: Correlation between Alterations in the Cell Envelope and Increased Acid Tolerance. Appl. Environ. Microbiol. 1999, 65, 3048–3055. [Google Scholar] [CrossRef]
  71. Tosun, H.; Gönül, Ş.A. The Effect of Acid Adaptation Conditions on Acid Tolerance Response of Escherichia coli O157:H7. Turk. J. Biol. 2005, 29, 197–202. [Google Scholar]
  72. Choi, S.H.; Baumler, D.J.; Kaspar, C.W. Contribution of Dps to Acid Stress Tolerance and Oxidative Stress Tolerance in Escherichia coli O157:H7. Appl. Environ. Microbiol. 2000, 66, 3911–3916. [Google Scholar] [CrossRef]
  73. Elhanafi, D.; Leenanon, B.; Bang, W.; Drake, M.A. Impact of Cold and Cold-Acid Stress on Poststress Tolerance and Virulence Factor Expression of Escherichia coli O157:H7. J. Food Prot. 2004, 67, 19–26. [Google Scholar] [CrossRef]
  74. Tyagi, D.; Kraft, A.L.; Smith, S.L.; Roof, S.E.; Sherwood, J.S.; Wiedmann, M.; Bergholz, T.M. Pre-Harvest Survival and Post-Harvest Chlorine Tolerance of Enterohemorrhagic Escherichia coli on Lettuce. Toxins 2019, 11, 675. [Google Scholar] [CrossRef]
  75. Garcia, A.; Mount, J.R.; Davidson, P.M. Ozone and Chlorine Treatment of Minimally Processed Lettuce. J. Food Sci. 2003, 68, 2747–2751. [Google Scholar] [CrossRef]
  76. Abnavi, M.D. Chlorine Decay and Pathogen Cross Contamination Dynamics in Fresh Produce Washing Process; Cleveland State University: Cleveland, OH, USA, 2021; ISBN 979-8-53557-758-6. [Google Scholar]
  77. Ramarao, N.; Nielsen-Leroux, C.; Lereclus, D. The Insect Galleria mellonella as a Powerful Infection Model to Investigate Bacterial Pathogenesis. J. Vis. Exp. 2012, 70, e4392. [Google Scholar] [CrossRef]
  78. Allen, K.J.; Lepp, D.; McKellar, R.C.; Griffiths, M.W. Examination of Stress and Virulence Gene Expression in Escherichia coli O157:H7 Using Targeted Microarray Analysis. Foodborne Pathog. Dis. 2008, 5, 437–447. [Google Scholar] [CrossRef] [PubMed]
  79. Yoo, B.K.; Liu, Y.; Juneja, V.; Huang, L.; Hwang, C.-A.; Desk, S. Effects of Stresses on the Growth and Cytotoxicity of Shiga-Toxin Producing Escherichia coli in Ground Beef and Spinach. SDRP J. Food Sci. Technol. 2016, 1, 37–43. [Google Scholar]
  80. Ali, M.G.; Abdelhamid, A.G.; Yousef, A.E. How Colonizing Alfalfa Sprouts Modulates the Virulence of Shiga Toxin-Producing Escherichia coli. Int. J. Food Microbiol. 2025, 428, 110972. [Google Scholar] [CrossRef]
  81. Carter, M.Q.; Carychao, D.; Bono, J.L. Comparative Analyses of Persistence Traits in Escherichia coli O157:H7 Strains Belonging to Different Clades Including REPEXH01 and REPEXH02 Strains. Front. Microbiol. 2024, 15, 1501956. [Google Scholar] [CrossRef]
  82. Yang, Y.; Yan, X.; Haley, B.J.; Li, C.; Nou, X. Genomic Comparison of Reoccurring, Emerging, and Persistent (REP) Shiga Toxin-Producing Escherichia Coli O157:H7. Foodborne Pathog. Dis. 2024. [Google Scholar] [CrossRef]
  83. Yang, Y.; Yan, X.; Redding, M.; Gu, G.; Luo, Y.; Patel, J.; Nou, X. Biofilm Formation of Escherichia coli O157:H7 Strains Associated with Recent Reoccurring Lettuce Outbreaks. Food Microbiol. 2025, 128, 104728. [Google Scholar] [CrossRef] [PubMed]
  84. Ko, K.Y.; Geornaras, I.; Byelashov, O.A.; Paik, H.; Kim, K.; Sofos, J.N. Thermotolerance of Rifampicin-Resistant Escherichia coli O 157: H 7 Derivatives and Their Parental Strains in a Broth System. J. Food Saf. 2016, 36, 3–10. [Google Scholar] [CrossRef]
  85. Akhtar, M.; Maserati, A.; Diez-Gonzalez, F.; Sampedro, F. Does Antibiotic Resistance Influence Shiga-Toxigenic Escherichia coli O26 and O103 Survival to Stress Environments? Food Control 2016, 68, 330–336. [Google Scholar] [CrossRef]
  86. Michino, H.; Araki, K.; Minami, S.; Takaya, S.; Sakai, N.; Miyazaki, M.; Ono, A.; Yanagawa, H. Massive Outbreak of Escherichia coli 0157:H7 Infection in Schoolchildren in Sakai City, Japan, Associated with Consumption of White Radish Sprouts. Am. J. Epidemiol. 1999, 150, 787–796. [Google Scholar] [CrossRef]
  87. Machado-Moreira, B.; Richards, K.; Abram, F.; Brennan, F.; Gaffney, M.; Burgess, C.M. Survival of Escherichia coli and Listeria Innocua on Lettuce after Irrigation with Contaminated Water in a Temperate Climate. Foods 2021, 10, 2072. [Google Scholar] [CrossRef] [PubMed]
Figure 1. Average temperature of Romaine lettuce in the bins at harvest (A) and after cooling (B). Boxplots represent 5615 and 4623 datapoints for samples collected from the Salinas and Yuma growing regions, respectively. The median temperature of Romaine lettuce in bins at the time of harvest was 13.55 °C (min = −10.00, max = 31.77 °C).
Applmicrobiol 05 00045 g001
Figure 2. Harvest-to-cool time (A) and time taken to cool Romaine lettuce at the cooling plants (B) for Romaine lettuce harvested from two different growing regions. Boxplots represent 5615 and 4623 datapoints for samples collected from Salinas and Yuma growing regions, respectively.
Applmicrobiol 05 00045 g002
Figure 3. Boxplots representing (A) change in culturable cells, (B) injured cell percentage, (C) persister cell percentage, and (D) VBNC cells at 4 h after harvest. X- axis shows harvest temperature. Culturable cells and VBNC cells are shown as change in log CFU/g, whereas persister cells, and injured cells are shown as change in percentages on Y-axis. Solid boxplots represent 25th and 75th percentile of the data. Outliers are shown by solid dots. Each boxplot represents one strain with at least three biological replicates and two technical replicates.
Applmicrobiol 05 00045 g003
Figure 4. Boxplots representing (from top) change in log reduction of culturable cells due to (A) exposure to pH 2.5 for 2 h, and (B) exposure to chlorine for 30 s. X- axis shows harvest temperature. Y- axis shows change in reduction in log CFU/g. Solid boxplots represents 25th and 75th percentile of the data. Outliers are shown by solid dots. Each boxplot represents one strain with at least three biological replicates and two technical replicates.
Applmicrobiol 05 00045 g004
Figure 5. Boxplots representing culturable cells (A), injured cell percentage (B), persister cell percentage (C), and VBNC cells (D) during 5 days of cold storage. Culturable cells and VBNC cells are shown as reduction (log CFU/g), and persister cells, and injured cells are shown as percentages (%) on Y-axis. Solid boxplots represent the 25th and 75th percentile of the data. Outliers are shown by solid dots. Each boxplot represents one strain with at least three biological replicates and two technical replicates.
Applmicrobiol 05 00045 g005
Figure 6. Regression tree analysis of the combined effect of harvest temperature, strain and cold storage period on the log reduction of culturable cells over cold storage period. The criteria used in splitting the trees are indicated for each decision node and the relative probability of each decision indicated as a %.
Applmicrobiol 05 00045 g006
Figure 7. Beta coefficients from beta regression model evaluating the effect of strain, harvest temperature and cold storage period on injured cells. Statistical significance (*) was established when the confidence interval was not equal to zero and the computed effect size of the model (R2) was 0.236. The baseline categories for strain was Central Coast, CA 2018.
Applmicrobiol 05 00045 g007
Figure 8. Effects of harvest temperature, strain and cold storage period on the formation of persister cells in lettuce. The computed effect size (R2) for the model was 0.152. Persister fraction is presented as a proportion (0, 1) and the analysis was conducted using the beta regression function. Significant (*) values < 0 indicate decreasing persister formation with increasing values, whereas significant values > 0 indicate increasing persister formations with increasing values. Strain was transformed into a dummy variable with the Central Coast 2018 outbreak strain as a baseline category.
Applmicrobiol 05 00045 g008
Figure 9. Regression tree analysis of the combined effects of harvest temperature, strain and cold storage period on the formation of VBNC cells over the cold storage period. The criteria used in splitting the trees are indicated for each decision node and the relative probability of each decision indicated as a %.
Applmicrobiol 05 00045 g009
Figure 10. Boxplots of the changes in acid (A) and chlorine (B) tolerance of the STEC O157:H7 cells in leafy greens stored under cold temperature over 5 days. Acid and chlorine tolerance were measured as difference in log reduction due to acid and chlorine treatment, respectively, from 0 days of cold storage. Solid boxplots represent 25th and 75th percentile of the data. Outliers are shown by solid dots. Each boxplot represents one strain with at least three biological replicates and two technical replicates.
Applmicrobiol 05 00045 g010
Figure 11. Regression tree analysis of the combined effects of harvest temperature, strain and cold storage period on the change in log reduction values due to acid treatment. The criteria used in splitting the trees are indicated for each decision node and the relative probability of each decision indicated as a %.
Applmicrobiol 05 00045 g011
Figure 12. Regression tree analysis of the combined effects of harvest temperature, strain and cold storage period on the change in log reduction values due to chlorine treatment. The criteria used in splitting the trees are indicated for each decision node and the relative probability of each decision indicated as a %.
Applmicrobiol 05 00045 g012
Figure 13. Survival of G. mellonella larvae inoculated with STEC O157:H7 from produce harvested at two different temperatures and stored in the cold over five days. The points are the observed values of the proportion of the surviving G. mellonella larvae, and the line is the fitted predicted values from the binomial logistic regression model. The computed pseudo R2 for the model were McFaden 0.18 and Nagelkerke’s R2 0.538.
Applmicrobiol 05 00045 g013
Disclaimer/Publisher’s Note: The statements, opinions and data contained in all publications are solely those of the individual author(s) and contributor(s) and not of MDPI and/or the editor(s). MDPI and/or the editor(s) disclaim responsibility for any injury to people or property resulting from any ideas, methods, instructions or products referred to in the content.

