Article

Scabies in Mexico, 2004–2024: A Spatiotemporal Analysis of a Neglected Tropical Disease

by
Osiel González Dávila
Secretaría de Ciencias, Humanidades, Tecnología e Innovación, Universidad Autónoma de Aguascalientes, Aguascalientes 20100, Mexico
Parasitologia 2026, 6(3), 30; https://doi.org/10.3390/parasitologia6030030
Submission received: 2 April 2026 / Revised: 25 May 2026 / Accepted: 4 June 2026 / Published: 10 June 2026

Abstract

Human scabies, caused by Sarcoptes scabiei var. hominis, is a neglected tropical disease with a significant public health burden worldwide. This retrospective study analyzed the spatiotemporal epidemiology of scabies in Mexico from 2004 to 2024 using national surveillance data. A total of 1,500,348 cases were reported. Children were disproportionately affected, with the highest crude incidence rates in the 0–4 age group. Females had higher incidence than males across all age groups, except in the 0–4 and ≥65 years age groups. Temporal trends were assessed using joinpoint regression on age-standardized incidence rates. Joinpoint regression identified two joinpoints in 2012 and 2017 for both sexes. Among males, the age-standardized incidence rate decreased from 2004 to 2012 (APC = −5.75%), increased from 2012 to 2017 (APC = 19.00%), and decreased from 2017 to 2024 (APC = −20.86%), with an AAPC of −6.02% (p < 0.001). Among females, a similar pattern was observed (APC = −5.94%, 18.23%, and −20.83%, respectively), with an AAPC of −6.24% (p < 0.001). Both sexes showed a significant net decrease in scabies incidence over the study period, despite a transient increase between 2012 and 2017. Spatial analyses revealed statistically significant spatial clustering, with persistent hot spots in the southeast, the Yucatán Peninsula, the Gulf of Mexico coast, and the Pacific Coast. These findings highlight the persistent burden of scabies in Mexico and the need for targeted public health interventions in high-incidence regions and among vulnerable populations.

1. Introduction

Human scabies is a parasitic skin infestation caused by the mite Sarcoptes scabiei var. hominis and represents a major public health concern worldwide [1,2,3]. The World Health Organization (WHO) recognized scabies as a neglected tropical disease (NTD) in March 2017, during the tenth meeting of the Strategic and Technical Advisory Group for Neglected Tropical Diseases (STAG-NTD) [4,5]. Scabies is considered the most common NTD with cutaneous manifestations [6]. Prevalence is higher among children, the elderly and in immunocompromised people [1,7]. In low-endemicity settings, transmission typically requires prolonged skin-to-skin contact, whereas in highly endemic settings, even brief contact in overcrowded conditions may suffice [7]. Risk factors for scabies infestation include overcrowding, sharing of beds or clothing, and limited access to water and sanitation [8,9]. These conditions may be further exacerbated during drought periods, increasing the risk of transmission [10,11]. Among the climate factors suggested to affect scabies incidence, higher relative humidity has been associated with increased incidence, while higher temperatures have been negatively associated with it [12,13]. Higher annual rainfall, higher aridity index, and higher air humidity have also been positively associated with scabies incidence [14]. Some studies have identified seasonal variation in scabies incidence, with winter reporting the highest incidence [15,16,17,18,19]. Scabies incidence has been reported to fluctuate over time, with some authors describing recurrent epidemic waves at intervals of 7, 15, or 30 years, sometimes referred to as the “seven-year itch” [20,21,22]. Sociodemographic characteristics have also been linked to scabies incidence, including sex, age, and household composition, among others [23,24,25,26]. While scabies predominantly affects underprivileged communities in tropical areas, it has a global distribution, with outbreaks reported in affluent nations and within institutional settings such as nursing homes, prisons, and childcare facilities [2,7,27]. Globally, scabies is estimated to affect 206.6 million people at any given time and accounts for approximately 622.5 million new cases annually [28]. Socioeconomic inequalities and limited access to healthcare among vulnerable populations play a significant role in the persistence and transmission of scabies [2]. The social stigma associated with scabies, limited public awareness, and inadequate diagnosis and treatment hinder control efforts and perpetuate the burden of scabies [29]. Scabies was formally included in the WHO Roadmap for Neglected Tropical Diseases 2021–2030, focusing on control rather than elimination, and aiming to reduce the burden of disease [30,31].
Some historians maintain that scabies was introduced to the Americas as part of the Columbian Exchange after 1492 [32]. However, the existence of scabies in Mexico during the pre-Columbian period is supported by Bernardino de Sahagún’s reference to Xipe Totec, an Aztec deity believed to cause scabies in his General History of the Things of New Spain [33], and by colonial accounts describing indigenous remedies for this condition [34,35]. In Mexico, scabies is not a disease subject to immediate mandatory reporting, but it is reported as part of routine epidemiological surveillance (weekly and annual reporting) [36]. The clinical practice guideline, Diagnosis and Treatment of Scabies, establishes the national standard for clinical decision-making in Mexico. It was published in 2012; prior to its publication, there was no nationally standardized document for diagnosing scabies. The guideline establishes that diagnosis is made clinically, based on nocturnal pruritus and characteristic skin burrows, with the detection of the parasite, feces, or eggs required for conclusive diagnosis [37]. According to the Ministry of Health’s Operational Definitions of Diseases Subject to Routine Surveillance, a probable case is defined as a person who exhibits signs or symptoms suggestive of the disease under surveillance. A confirmed case is a case that meets the criteria for diagnosis and has positive laboratory test results [38]. Despite this regulatory and clinical framework, studies on the epidemiology of scabies in Mexico are scarce. Previous studies have shown that scabies incidence exhibits epidemic waves, seasonal variation, and differences by age group and sex. Based on these findings, it is hypothesized that similar patterns would be observed in Mexico, with recurrent epidemic waves, seasonal variation driven by climatic factors, and differences in incidence by age group and sex. Therefore, this study aims to describe the spatiotemporal epidemiology of scabies in Mexico from 2004 to 2024 and to determine whether these patterns are observed in national surveillance data.

2. Materials and Methods

2.1. Data Source

The Mexican Health Ministry, through the General Directorate of Epidemiology (GDE), publishes the morbidity yearbooks that contain the data on new cases of scabies (ICD-10 code B86) for the period 2004–2024, analyzed in this study [39]. The most recent yearbook available at the time of this study was the 2024 edition. Conventional surveillance of new cases of disease is carried out operationally using the SUIVE-1 data collection form. Conventional reporting begins at the medical unit with the completion of the Daily Outpatient Consultation Registry form. The hospital epidemiologist, the statistician, and the medical care coordinator must compile the daily outpatient consultation reports weekly, review the daily diagnostic findings, and record the diagnosed disease in the appropriate field of the SUIVE-1 form; the data must be forwarded to the corresponding health jurisdiction. At the state-level epidemiology department of the Ministry of Health, information processed within the health jurisdictions is validated. The Directorate of Epidemiological Information within the General Directorate of Epidemiology (GDE) reviews and validates each state’s database; if inconsistencies are found, the state official in charge will be asked to provide clarification, and, if warranted, the data will be corrected. Once the report is validated, it is disseminated through the electronic and print media produced by the GDE [40]. The clinical practice guideline establishes that diagnosis is made clinically, based on nocturnal pruritus and characteristic skin lesions in typical locations. Skin burrows are a pathognomonic sign. Conclusive diagnosis requires detection of the parasite, feces, or eggs through procedures such as skin scraping, shave biopsy, low-power microscopy, dermatoscopy, and a tetracycline fluorescence test [37]. Scabies cases in morbidity yearbooks are disaggregated by month, year, state, and demographic factors (age groups and sex). State-level mid-year population denominators from the National Population Council (CONAPO) were used to estimate annual incidence rates (per 100,000 persons) [41]. Morbidity yearbook data are available at: https://epidemiologia.salud.gob.mx/anuario/html/index.html (accessed on 9 March 2026).

2.2. Statistical Analysis

New scabies cases and crude incidence rates per 100,000 persons were analyzed annually and by age group and sex using Stata 16. Age information was missing in 2749 records (0.17% of the total). To address this, these cases were redistributed across age groups proportionally, using the age distribution of cases with complete data, under the assumption that age data were missing completely at random. A complete-case analysis was then conducted as a sensitivity analysis to assess the robustness of the findings under different assumptions about missing age data. To assess seasonal variation in scabies incidence, monthly case counts were aggregated across the study period (2004–2024) and grouped into four seasons: spring (March–May), summer (June–August), fall (September–November), and winter (December–February). Normality of the seasonal distribution was assessed using the Shapiro–Wilk test. A one-way ANOVA was used as the primary test for seasonal differences, with a Kruskal–Wallis test conducted as a sensitivity analysis to validate findings when normality assumptions were not met. This analysis was intended as an exploratory approach to assess broad seasonal patterns in aggregated national surveillance data, rather than as a definitive model of seasonal transmission dynamics. The female-to-male incidence rate ratio (IRR) was estimated with 95% confidence intervals (CIs) using the exact method. For all analyses, statistical significance was set at p < 0.05.
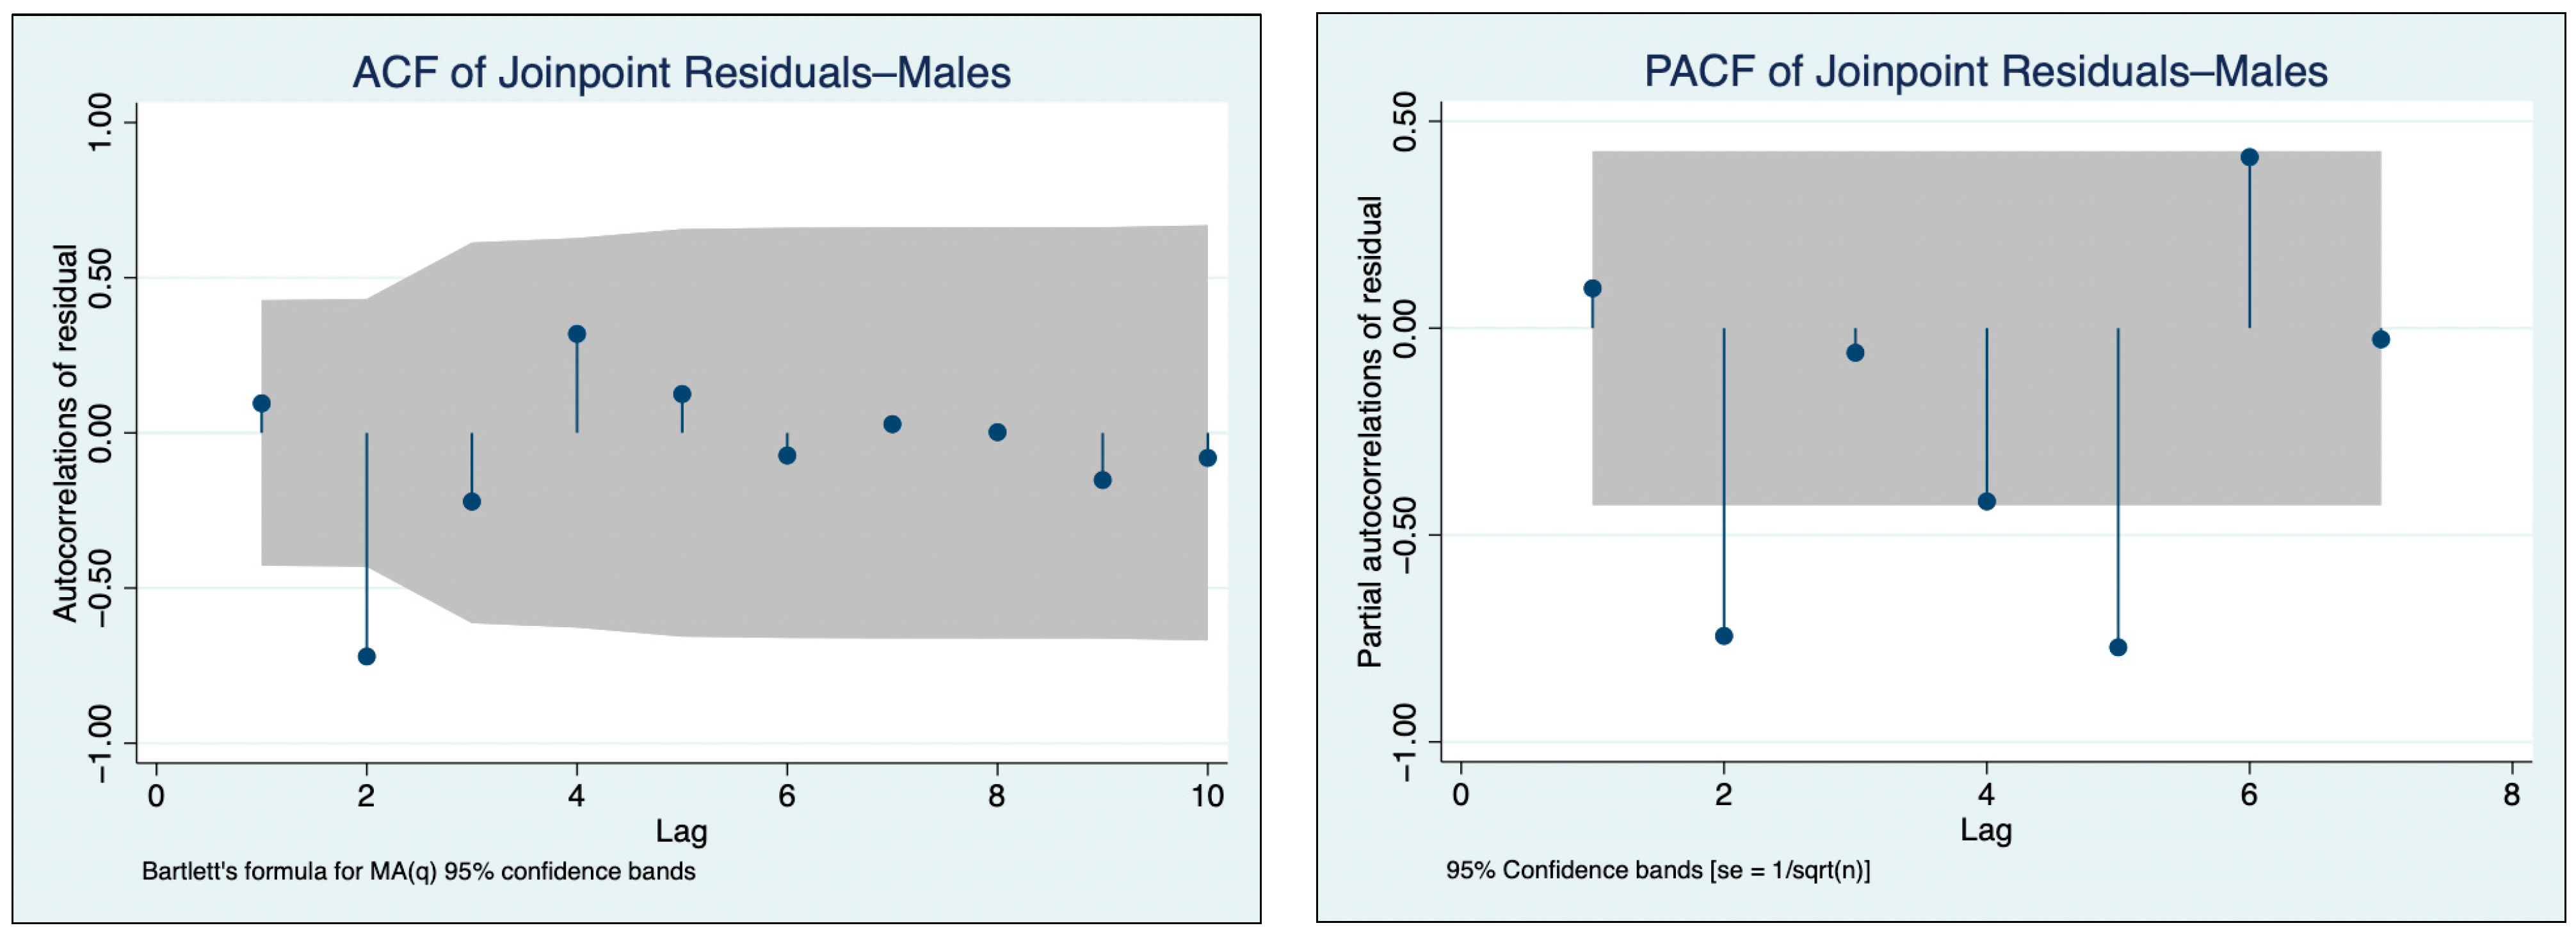
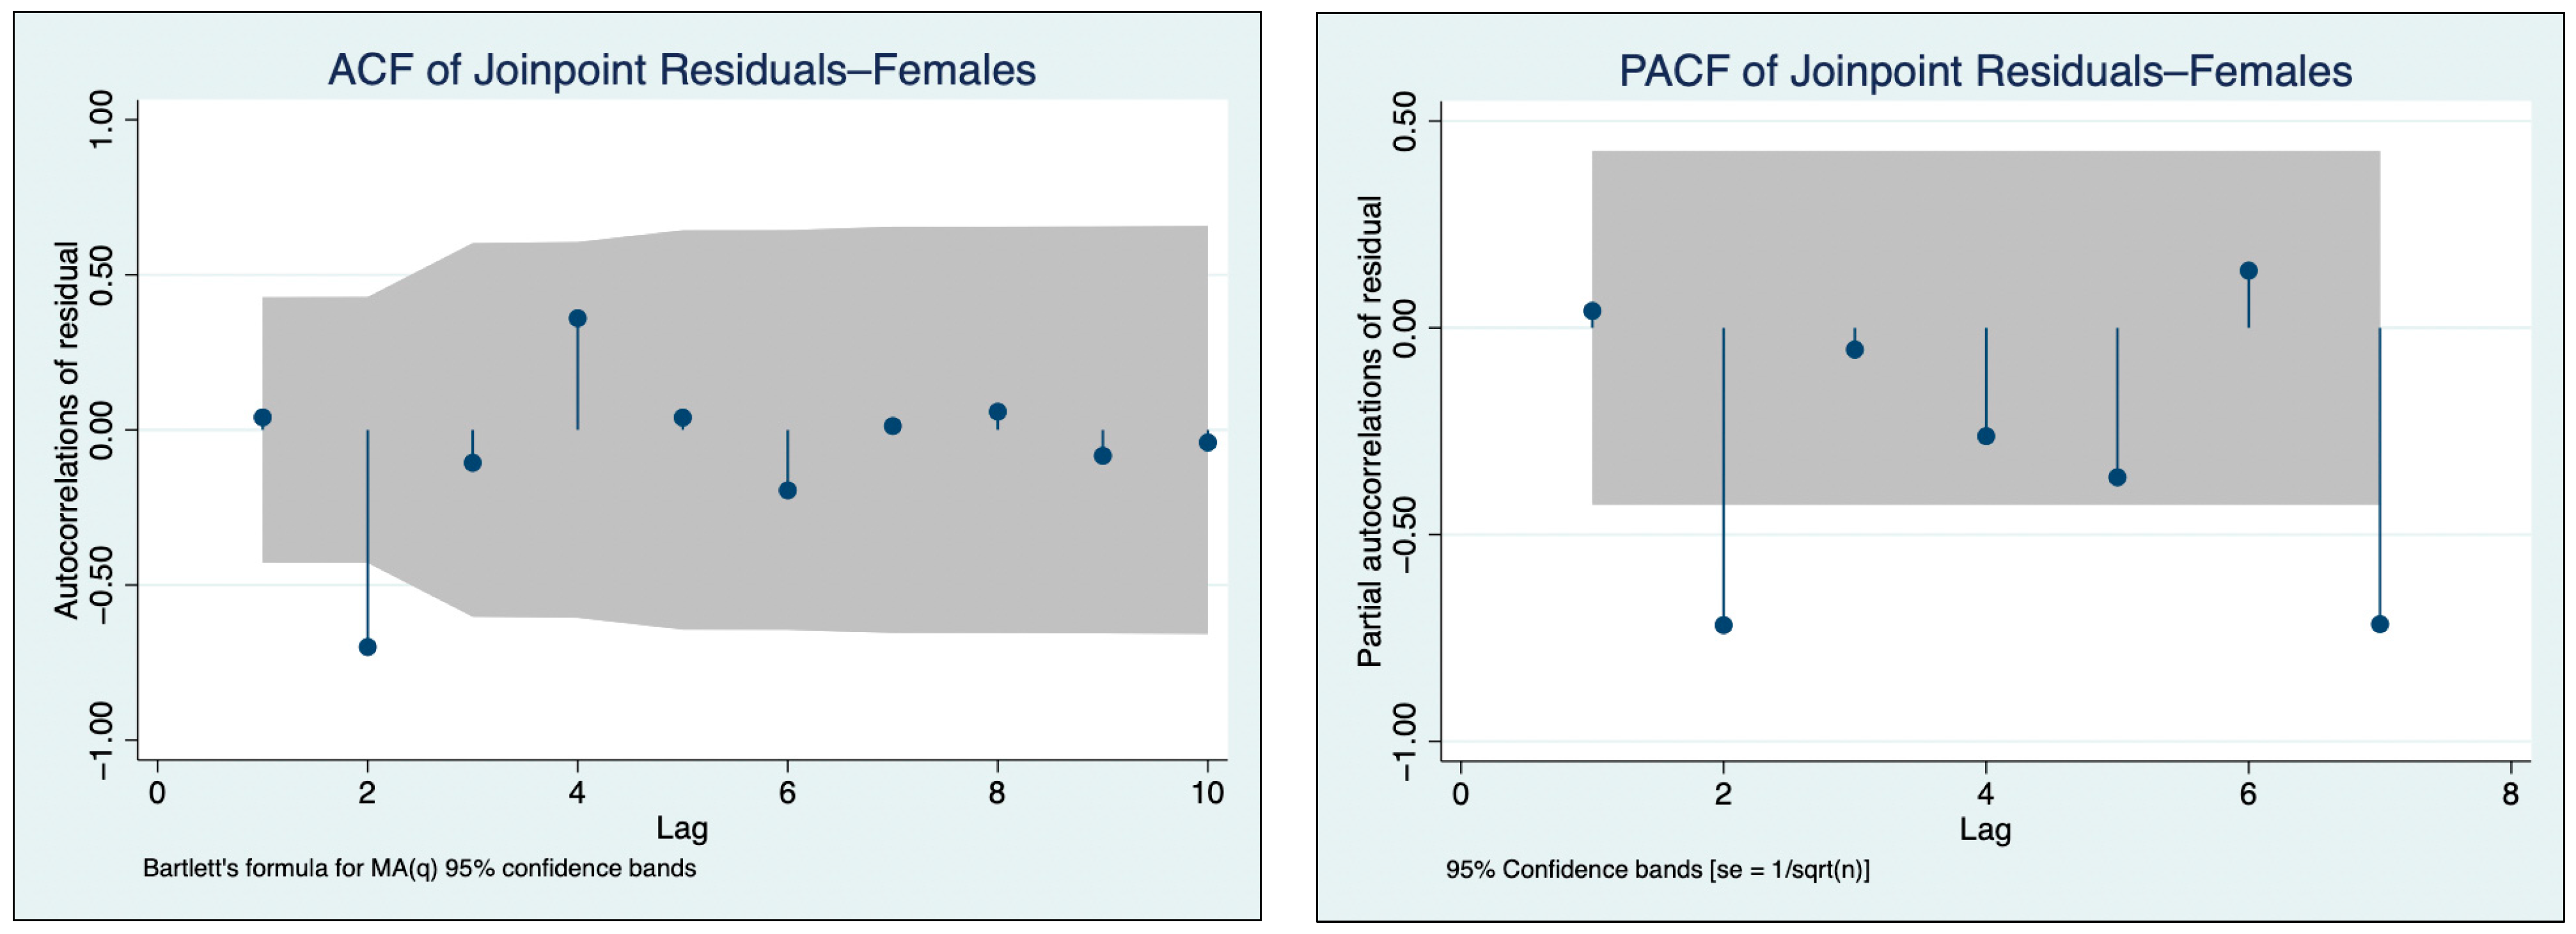
For national temporal trend analyses, annual age-standardized incidence rates (ASRs) per 100,000 person-years were estimated through direct standardization using the WHO World Standard Population (2000–2025) as the reference population [42]. Temporal trends in national scabies incidence were assessed using joinpoint regression analysis, which estimated the annual percentage change (APC) and average annual percentage change (AAPC) with 95% CIs, by sex. This method fits multiple connected line segments to the data, identifying points where the direction or magnitude of a trend changes significantly over time. The permutation test was applied to identify the optimal number of joinpoints. All joinpoint analyses were conducted using the Joinpoint Trend Analysis Software, version 6.0.0 [43]. Residual autocorrelation diagnostics were performed on the final joinpoint model residuals separately for males and females (n = 21 time points each). The Durbin-Watson statistics were 1.80 (males) and 1.90 (females), both close to the null value of 2.0, indicating no first-order serial autocorrelation. The inspection of the ACF and PACF plots revealed that in both sexes the only isolated spike exceeding the 95% confidence bands occurred at lag 2, with no evidence of geometric decay or systematic cutoff patterns that would be characteristic of a true autoregressive or moving average process.
For state-level analyses, average age-standardized incidence rates per 100,000 person-years were estimated for three periods defined by the joinpoint regression analysis: 2004–2012, 2013–2017, and 2018–2024, using the same direct standardization approach with the WHO World Standard Population (2000–2025) as the reference population, enabling valid comparison of state-level rates across periods of different durations and demographic compositions. Choropleth maps of the average age-standardized incidence rate by state were produced using ArcGIS Pro 3.6.2. Spatial autocorrelation analyses were subsequently conducted to assess the geographic clustering of scabies incidence, as described in the following section.

2.3. Spatial Autocorrelation Analysis

The Global Moran’s I index was calculated to assess whether the incidence of scabies exhibited a random, clustered, or dispersed spatial distribution across Mexican states in each of the three periods identified in the joinpoint regression analysis (2004–2012, 2013–2017, and 2018–2024). Moran’s I ranges from −1 to 1. A positive value (I > 0) indicates positive spatial autocorrelation, meaning high values cluster near other high values and low values near other low values. A negative value (I < 0) indicates negative spatial autocorrelation, meaning high values tend to be located near low values, reflecting a dispersed spatial pattern. When neither pattern is present, values are assumed to be randomly distributed. A Global Moran’s I is considered statistically significant when the Z-score is higher than 1.96 and the p-value is less than 0.05, indicating the presence of spatial autocorrelation [44,45].
Subsequently, the Local Moran’s I (Anselin Local Moran’s I) was calculated to identify statistically significant spatial clusters and outliers of scabies average annual incidence rate per 100,000 person-years for each of the three periods identified in the joinpoint regression analysis (2004–2012, 2013–2017, and 2018–2024). Local Moran’s I classifies each spatial unit into one of four cluster types: High–High, indicating a state with high incidence surrounded by states with high incidence; Low–Low, indicating a state with low incidence surrounded by states with low incidence; High–Low, indicating a state with high incidence surrounded by states with low incidence; and Low–High, indicating a state with low incidence surrounded by states with high incidence. High–High clusters are considered hot spots and Low–Low clusters are considered cold spots [44,46]. Both analyses were conducted in ArcGIS Pro 3.6.2.

3. Results

3.1. Descriptive Analysis

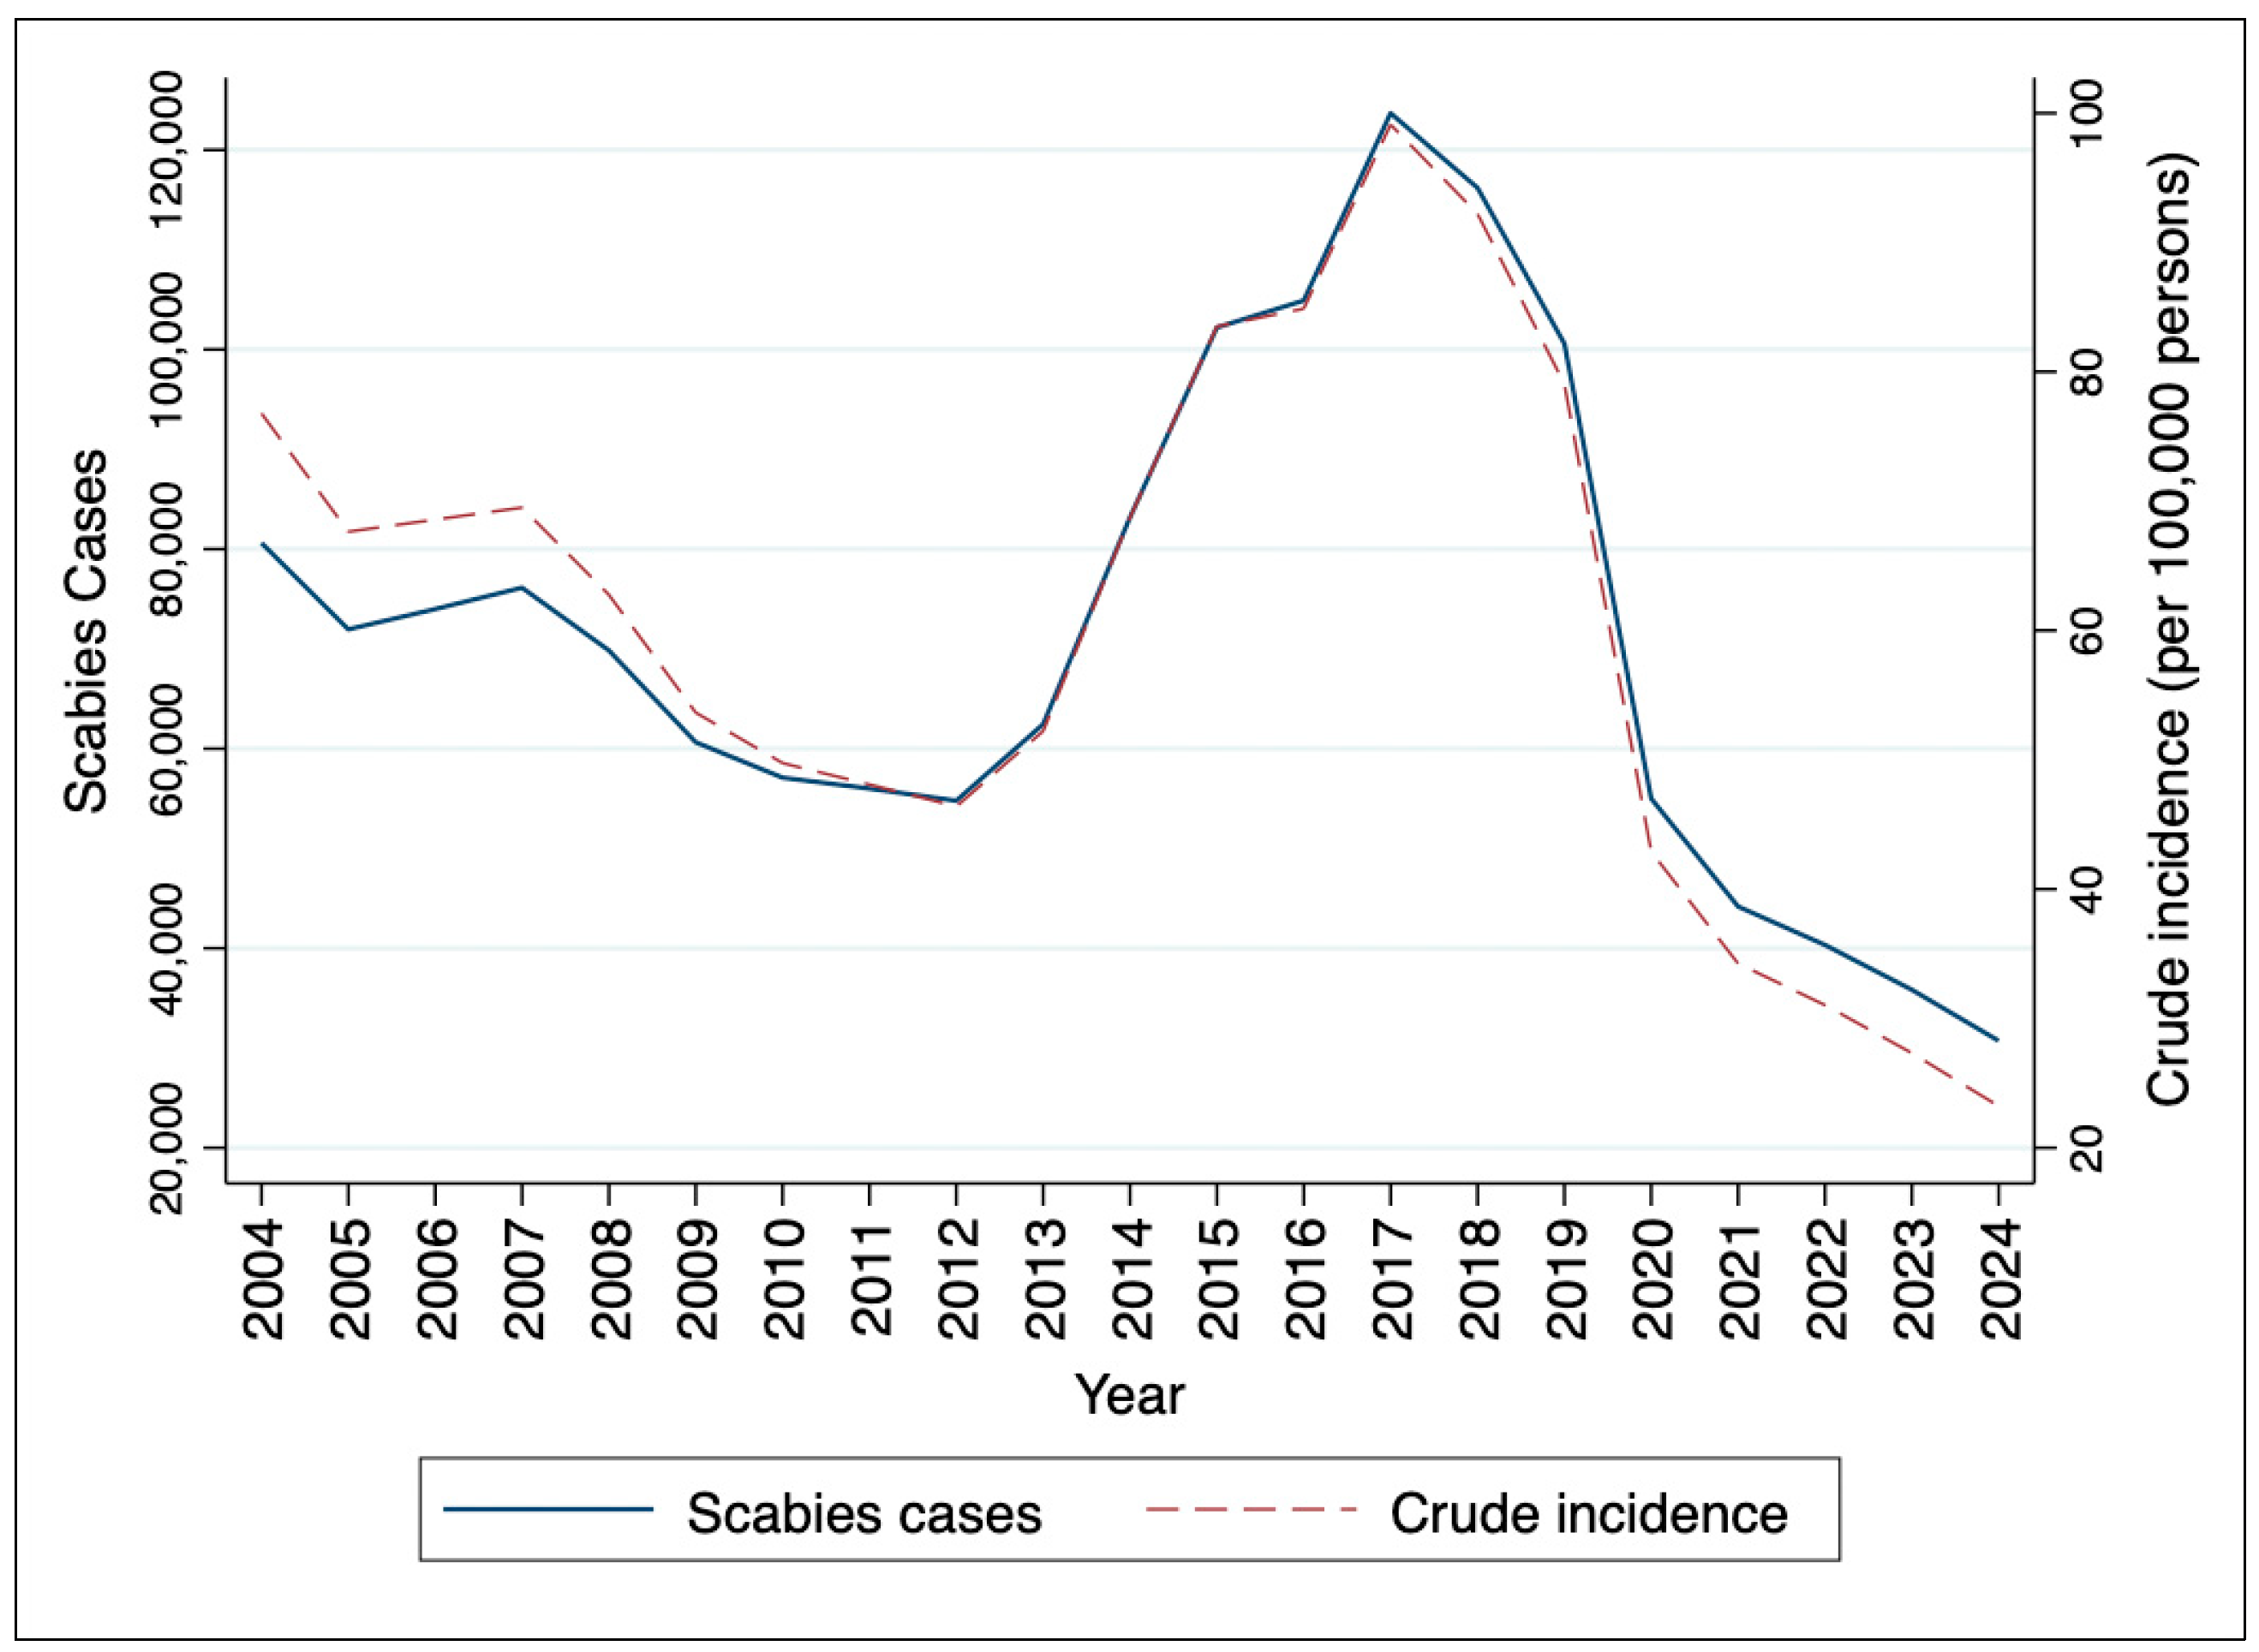
In Mexico, 1,500,348 cases of scabies were reported during the study period (2004–2024). The median number of cases per year was 69,843 (95% CI: 55,143–84,543). The highest number of cases was reported in 2017 (123,675) and the lowest in 2024 (30,732). The crude scabies incidence rate (per 100,000 persons) decreased from 76.79 in 2004 to 23.23 in 2024, reaching a maximum of 99.12 in 2017 (Figure 1). The median incidence rate was 62.77 per 100,000 persons (95% CI: 46.88–78.65) over the study period. Figure 1 shows notable variations in the temporal trends of the overall scabies incidence rate; therefore, a joinpoint regression analysis was conducted to assess them.

3.2. Joinpoint Regression Analysis

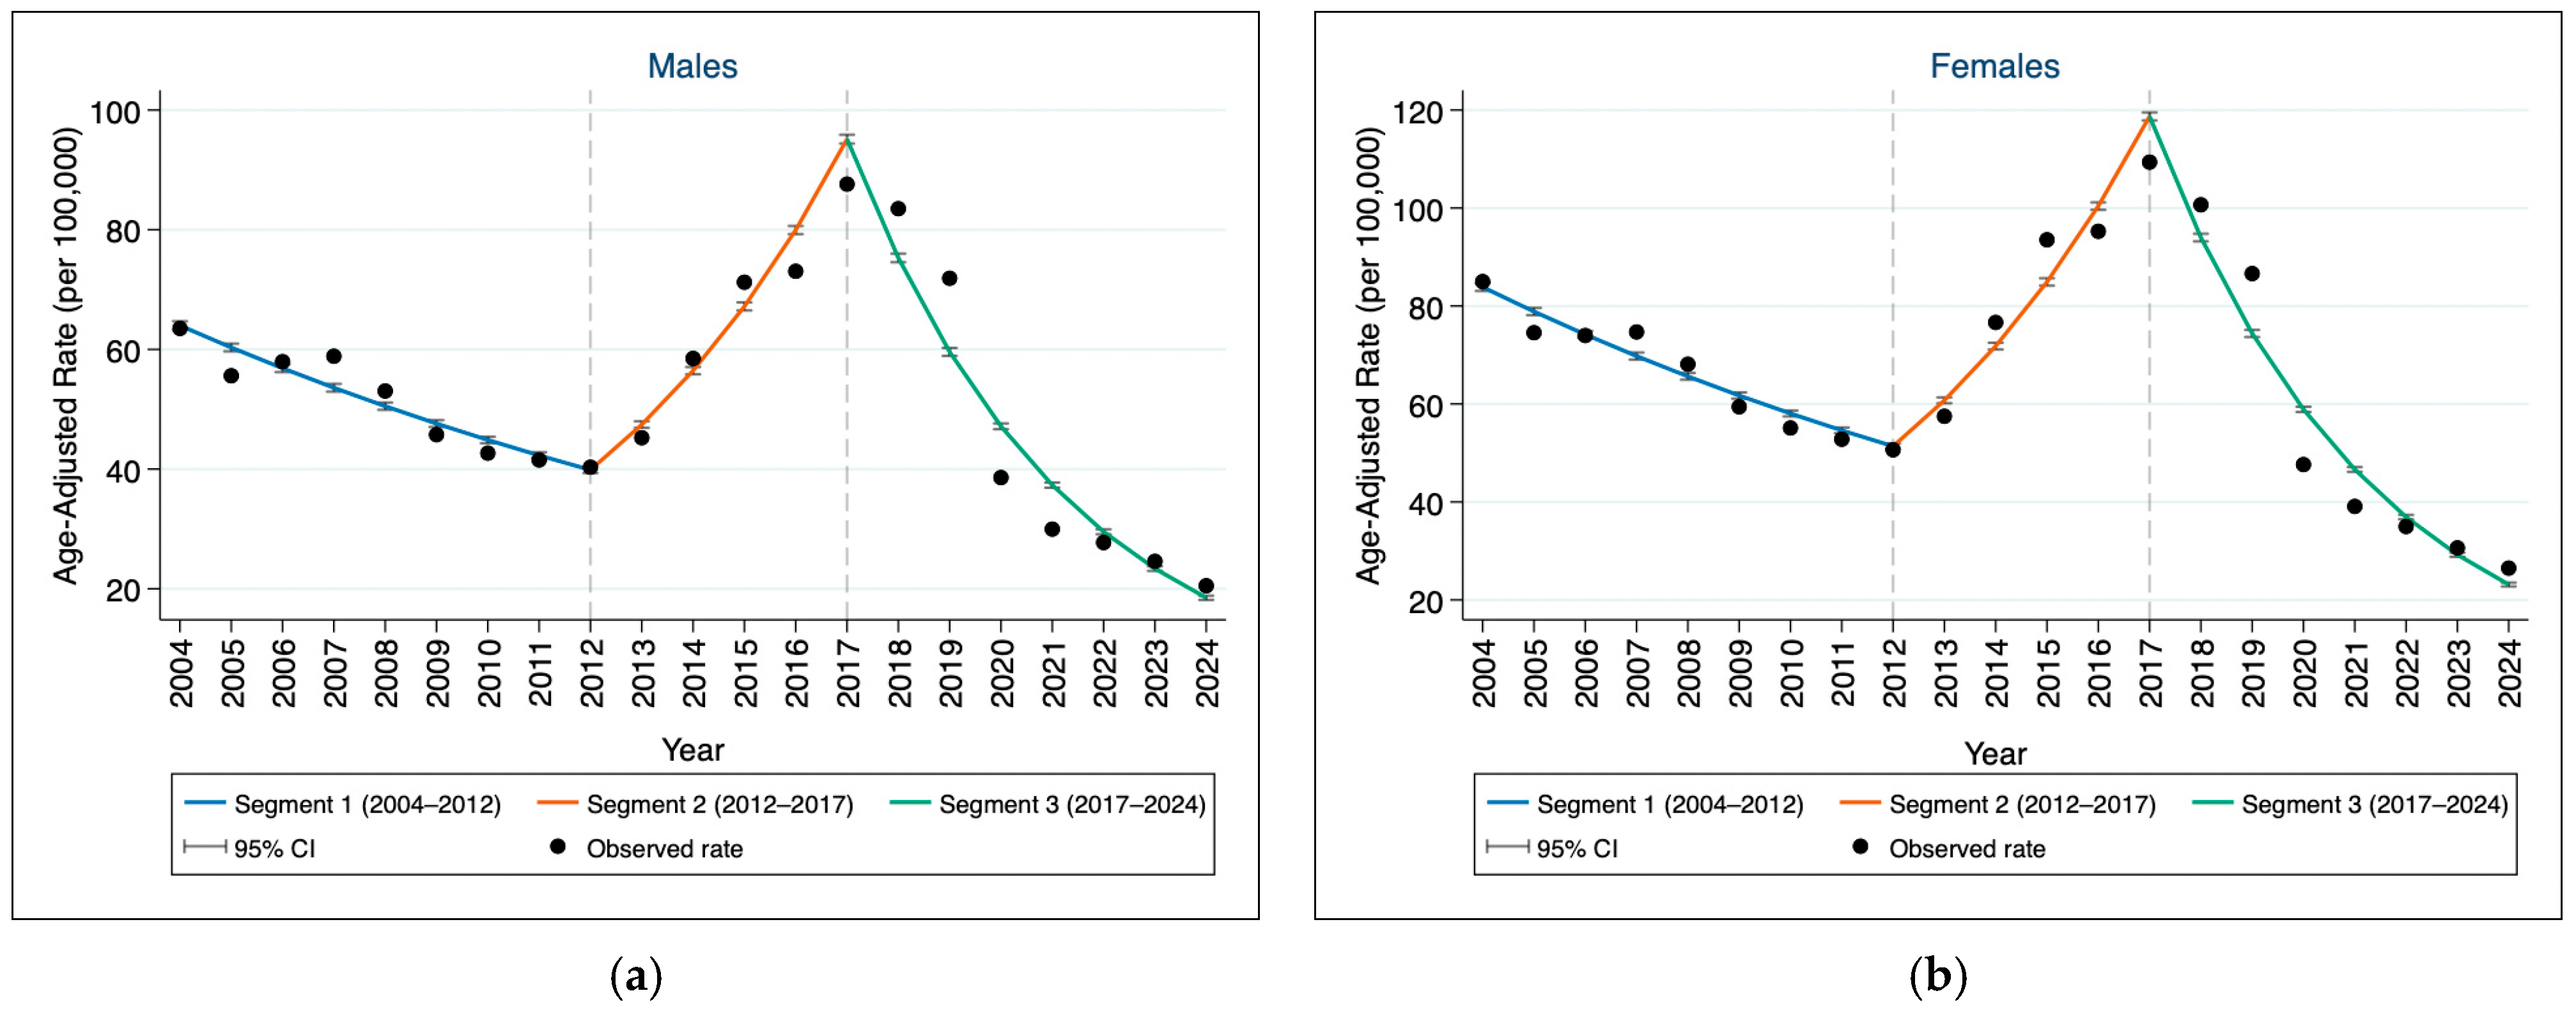
A joinpoint regression analysis was conducted by sex for the whole period. For males, two joinpoints were identified in 2012 and 2017 (Figure 2a). From these joinpoints, the trend was divided into three linear segments, each showing a different slope. From 2004 to 2012, the incidence rate decreased significantly, with an APC of −5.75% (95% CI: −10.34 to −2.53; p = 0.001). Then, from 2012 to 2017, the incidence rate increased significantly, with an APC of 19.00% (95% CI: 11.59–31.65; p < 0.001). Finally, from 2017 to 2024, the incidence rate decreased significantly, with an APC of −20.86% (95% CI: −24.65 to −17.97; p < 0.001). The AAPC for the overall incidence rate was −6.02% (95% CI: −7.33 to −5.00; p < 0.001). Therefore, despite a transient increase between 2012 and 2017, the national scabies incidence showed a statistically significant net decrease over the study period (2004–2024). The complete-case sensitivity analysis yielded virtually identical results, with the same joinpoints identified (2012 and 2017), APCs of −5.73% (95% CI: −9.99 to −2.65; p = 0.001), 18.97% (95% CI: 11.96–30.65; p < 0.001), and −20.85% (95% CI: −24.42 to −18.04; p < 0.001) for each period, respectively, and an AAPC of −6.01% (95% CI: −7.28 to −5.00; p < 0.001), confirming that the proportional redistribution of missing age data had negligible impact on the conclusions.
For females, two joinpoints were also identified in 2012 and 2017 (Figure 2b). As with males, two joinpoints divided the trend into three segments. From 2004 to 2012, the incidence rate decreased significantly, with an APC of −5.94% (95% CI: −9.71 to −3.05; p < 0.001). Then, from 2012 to 2017, the incidence rate increased significantly, with an APC of 18.23% (95% CI: 12.05–28.15; p < 0.001). Finally, from 2017 to 2024, the incidence rate decreased significantly, with an APC of −20.83% (95% CI: −24.09 to −18.23; p < 0.001). The AAPC for the overall incidence rate was −6.24% (95% CI: −7.83 to −5.35; p < 0.001), indicating a statistically significant net decrease in female scabies incidence over 2004–2024, despite the transient increase observed between 2012 and 2017. The complete-case sensitivity analysis for females also yielded virtually identical results, with the same joinpoints identified (2012 and 2017), APCs of −5.90% (95% CI: −9.78 to −2.99; p < 0.001), 18.28% (95% CI: 12.03–28.66; p < 0.001), and −20.86% (95% CI: −24.15 to −18.26; p < 0.001) for each period, respectively, and an AAPC of −6.22% (95% CI: −7.40 to −5.33; p < 0.001). These findings confirm that the proportional redistribution of missing age data had negligible impact on the results. Residual autocorrelation diagnostics confirmed no systematic autocorrelation structure in the final model residuals for either sex (Appendix A, Figure A1 and Figure A2).

3.3. Age and Sex Differences in Scabies Incidence

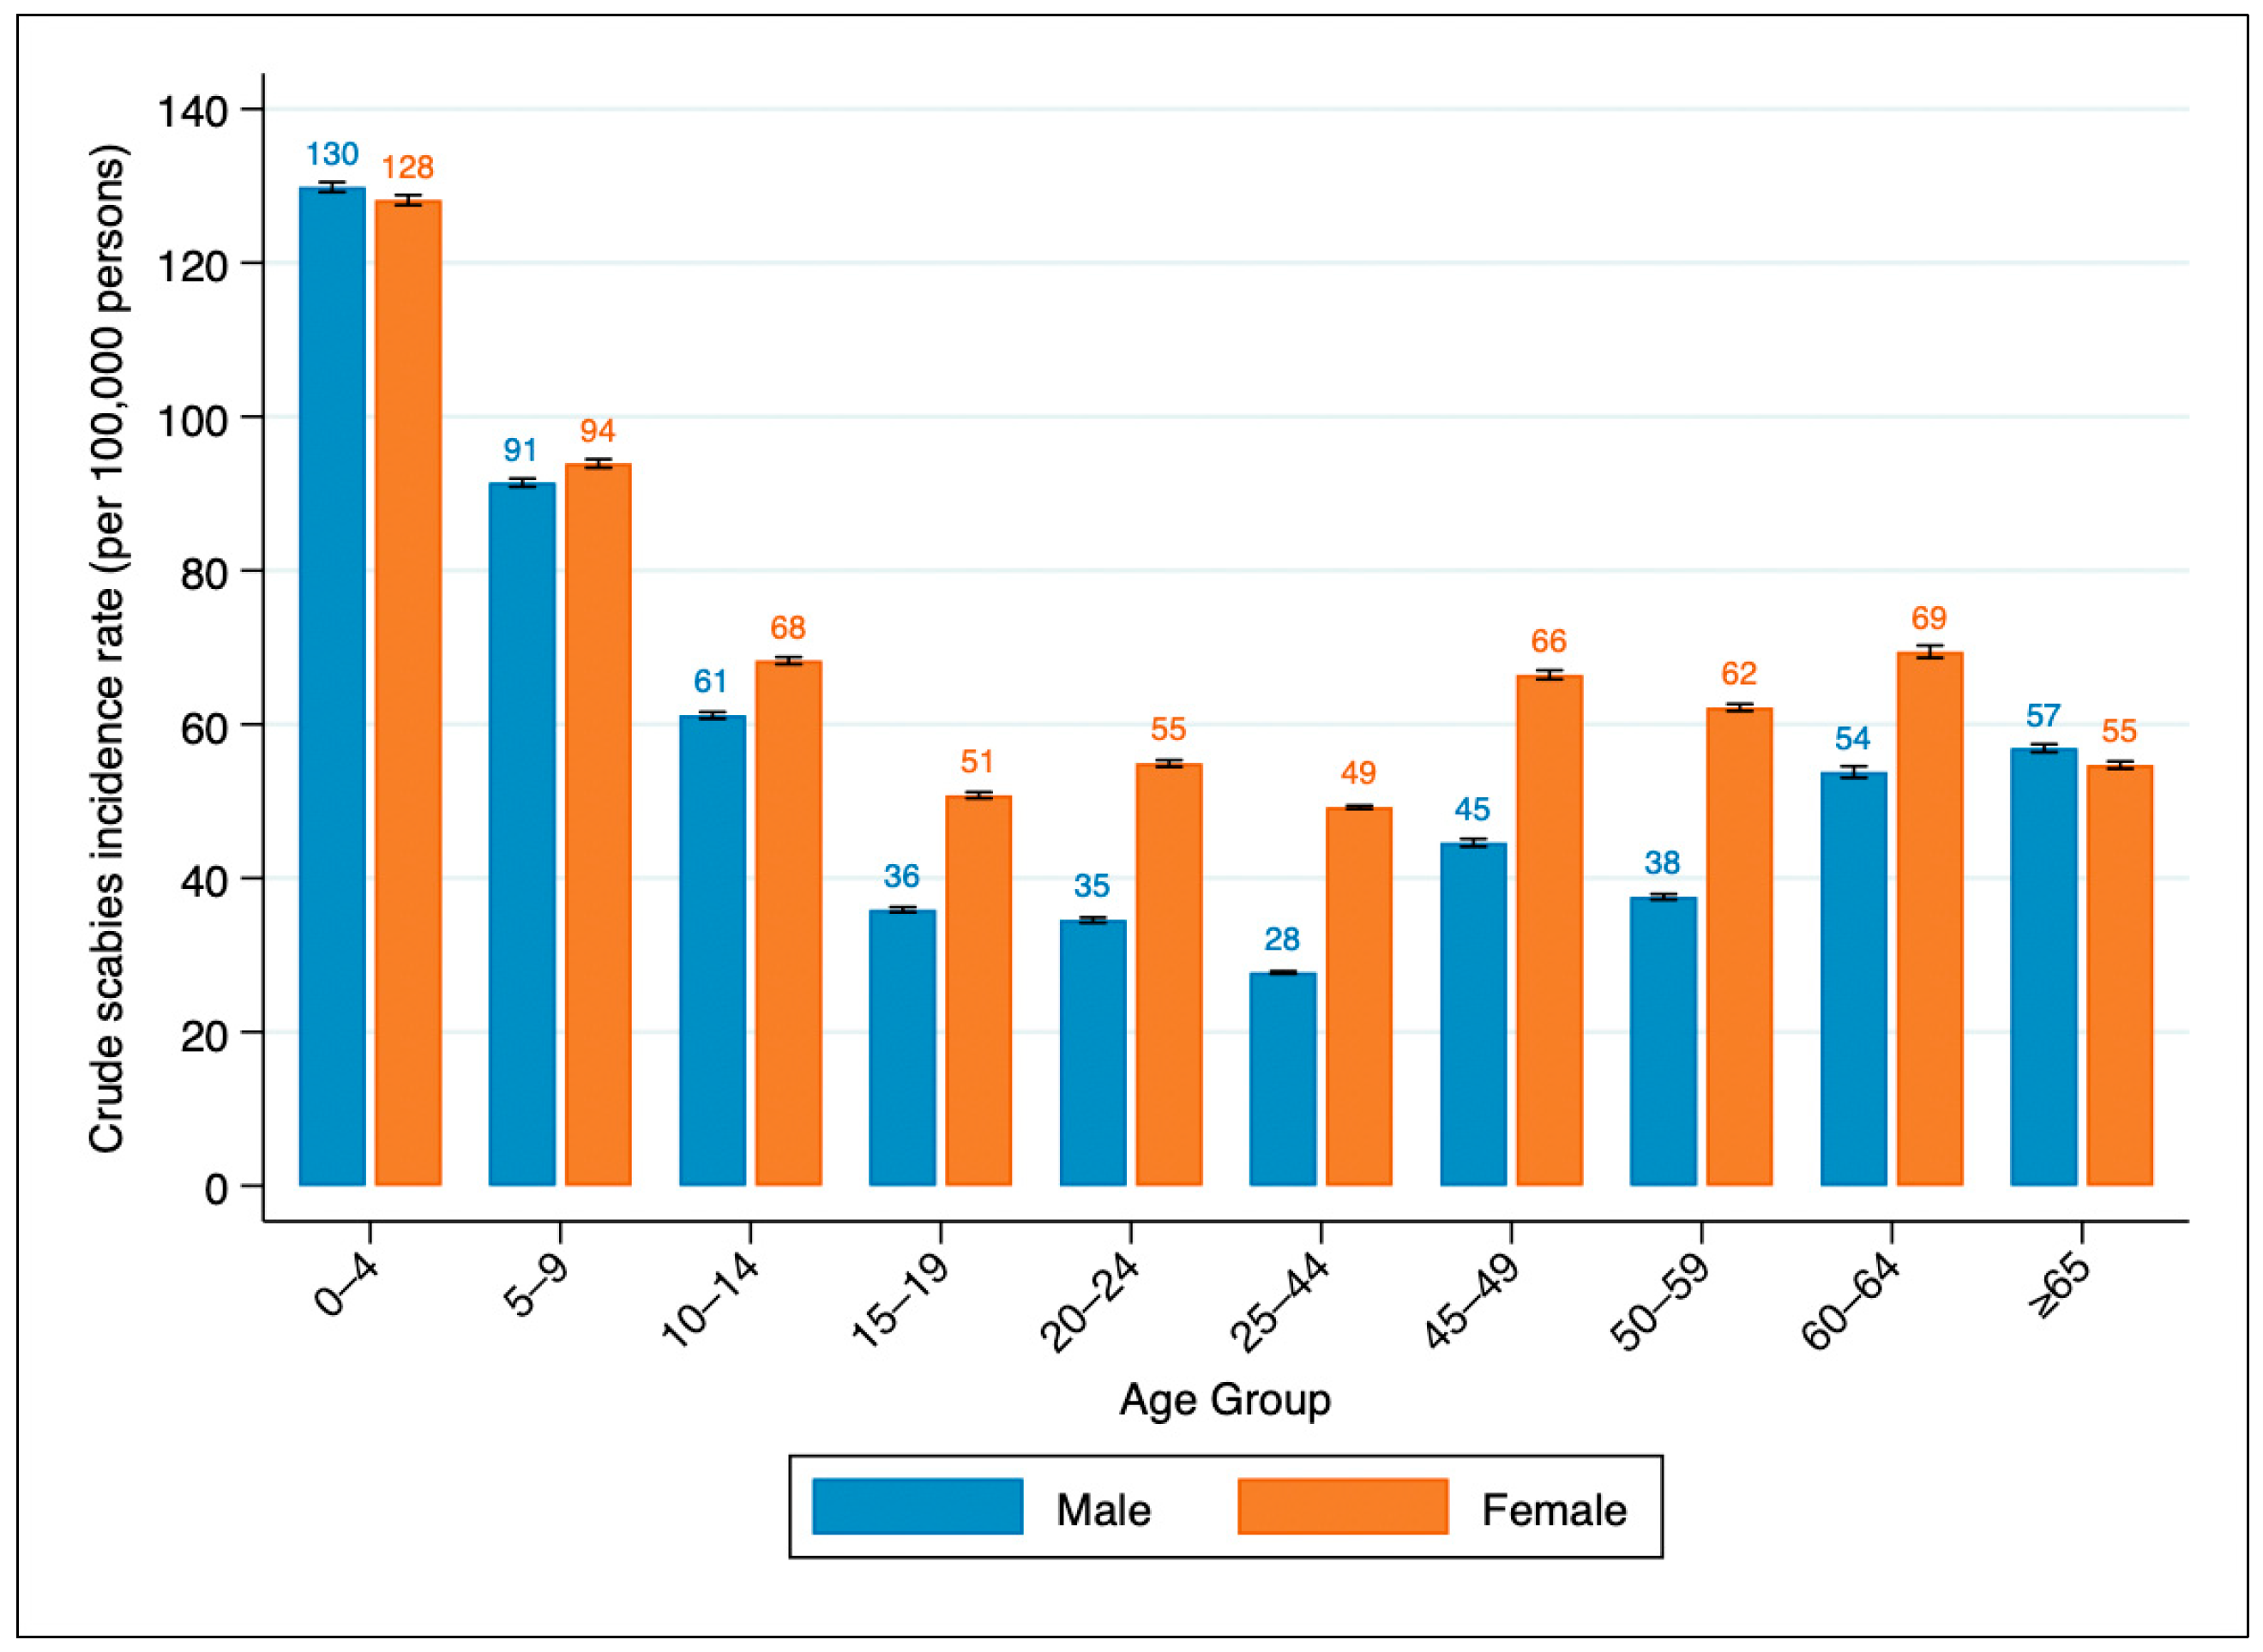
The crude scabies incidence rate (per 100,000 persons) was estimated separately for females and males across the following age groups: 0–4, 5–9, 10–14, 15–19, 20–24, 25–44, 45–49, 50–59, 60–64, and 65 years and over (Figure 3). Subsequently, for each age group, the female-to-male IRR and 95% CIs were computed (Table 1). Of the 1,500,348 reported cases of scabies, 847,647 (56%) were in females, and 652,701 (44%) were in males. The youngest age group (0–4) showed the highest incidence rates for both females (128 per 100,000) and males (130 per 100,000). The 5–9 age group had the second highest incidence rates, at 94 per 100,000 females and 91 per 100,000 males. Incidence was higher among women across all age groups, except among those aged 0–4 years and among those aged 65 years and over. The peak higher female-to-male incidence rate ratio for scabies occurred in the age group 25–44 with an IRR of 1.77. This was followed by women in the 50–59 age group, (66% higher risk) and the 20–24 age group (59% higher risk).
Age-specific crude incidence rates by period are presented in Table 2. While the 0–4 age group consistently showed the highest incidence across all three periods, the percentage increase from the first to the second period was greatest among adolescents and young adults aged 15–19 (+51%) and 20–24 (+45%), compared to +31% among children aged 0–4.

3.4. Seasonal Distribution of Scabies Incidence

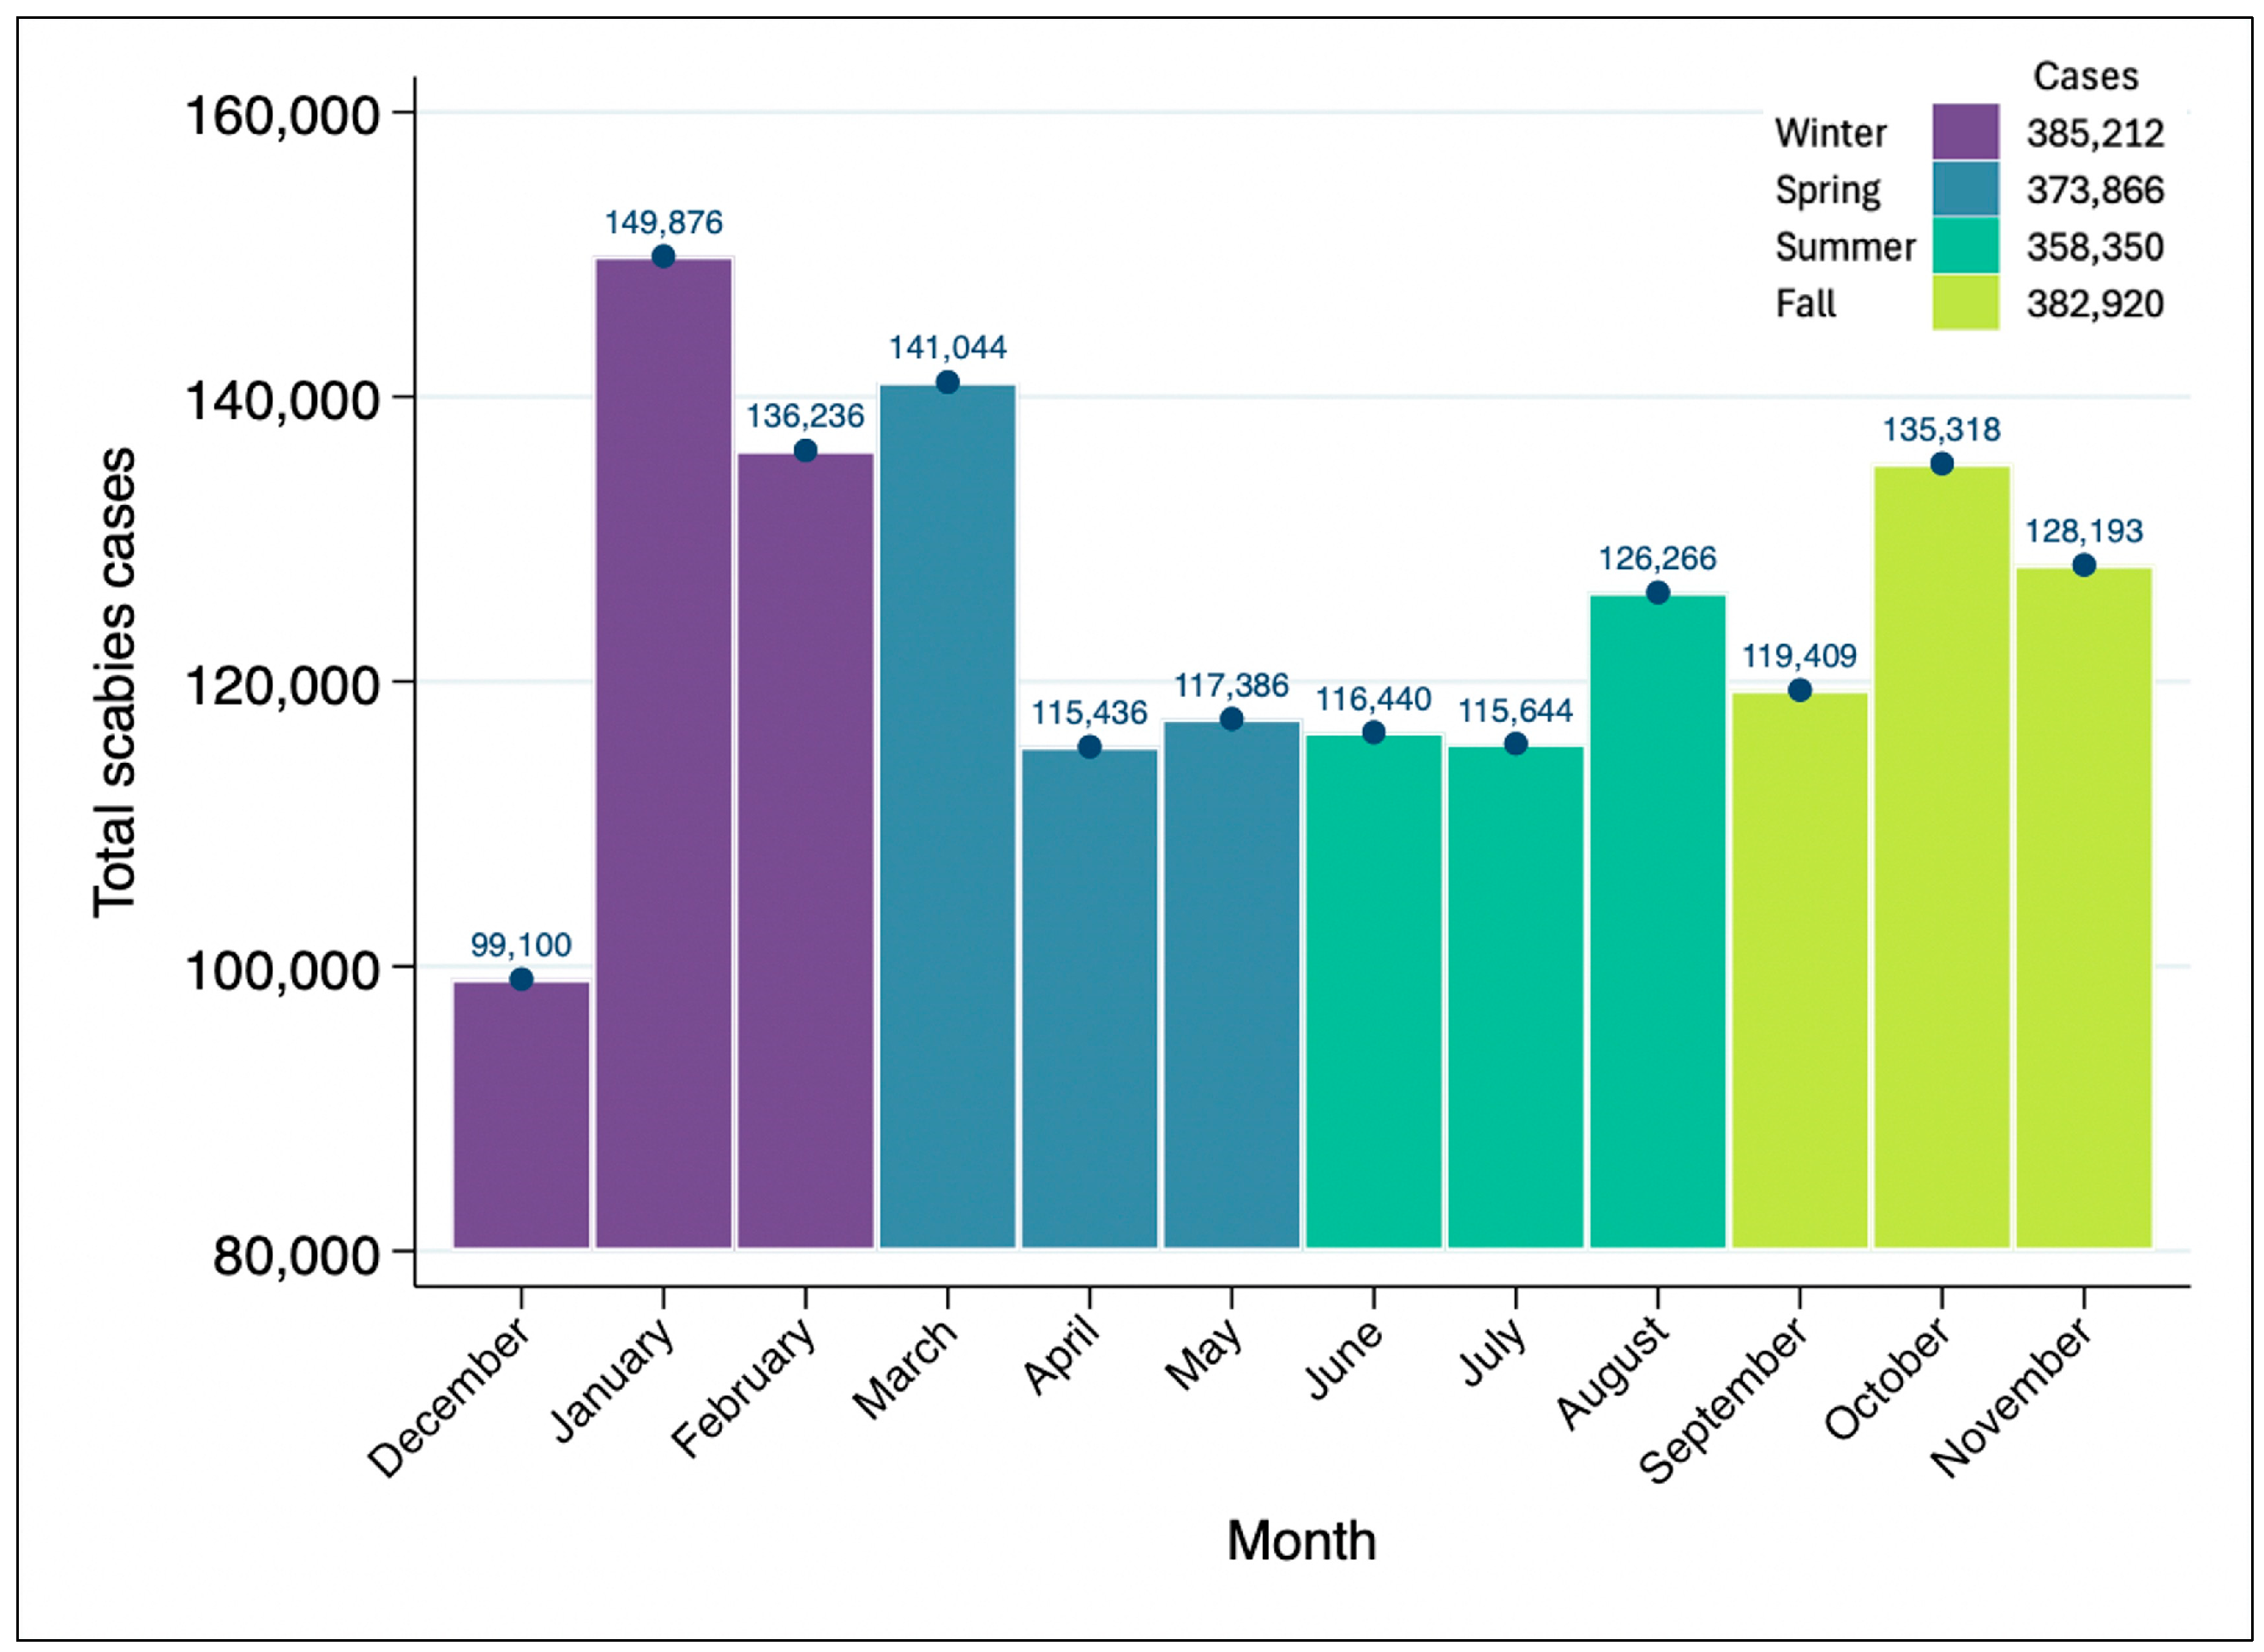
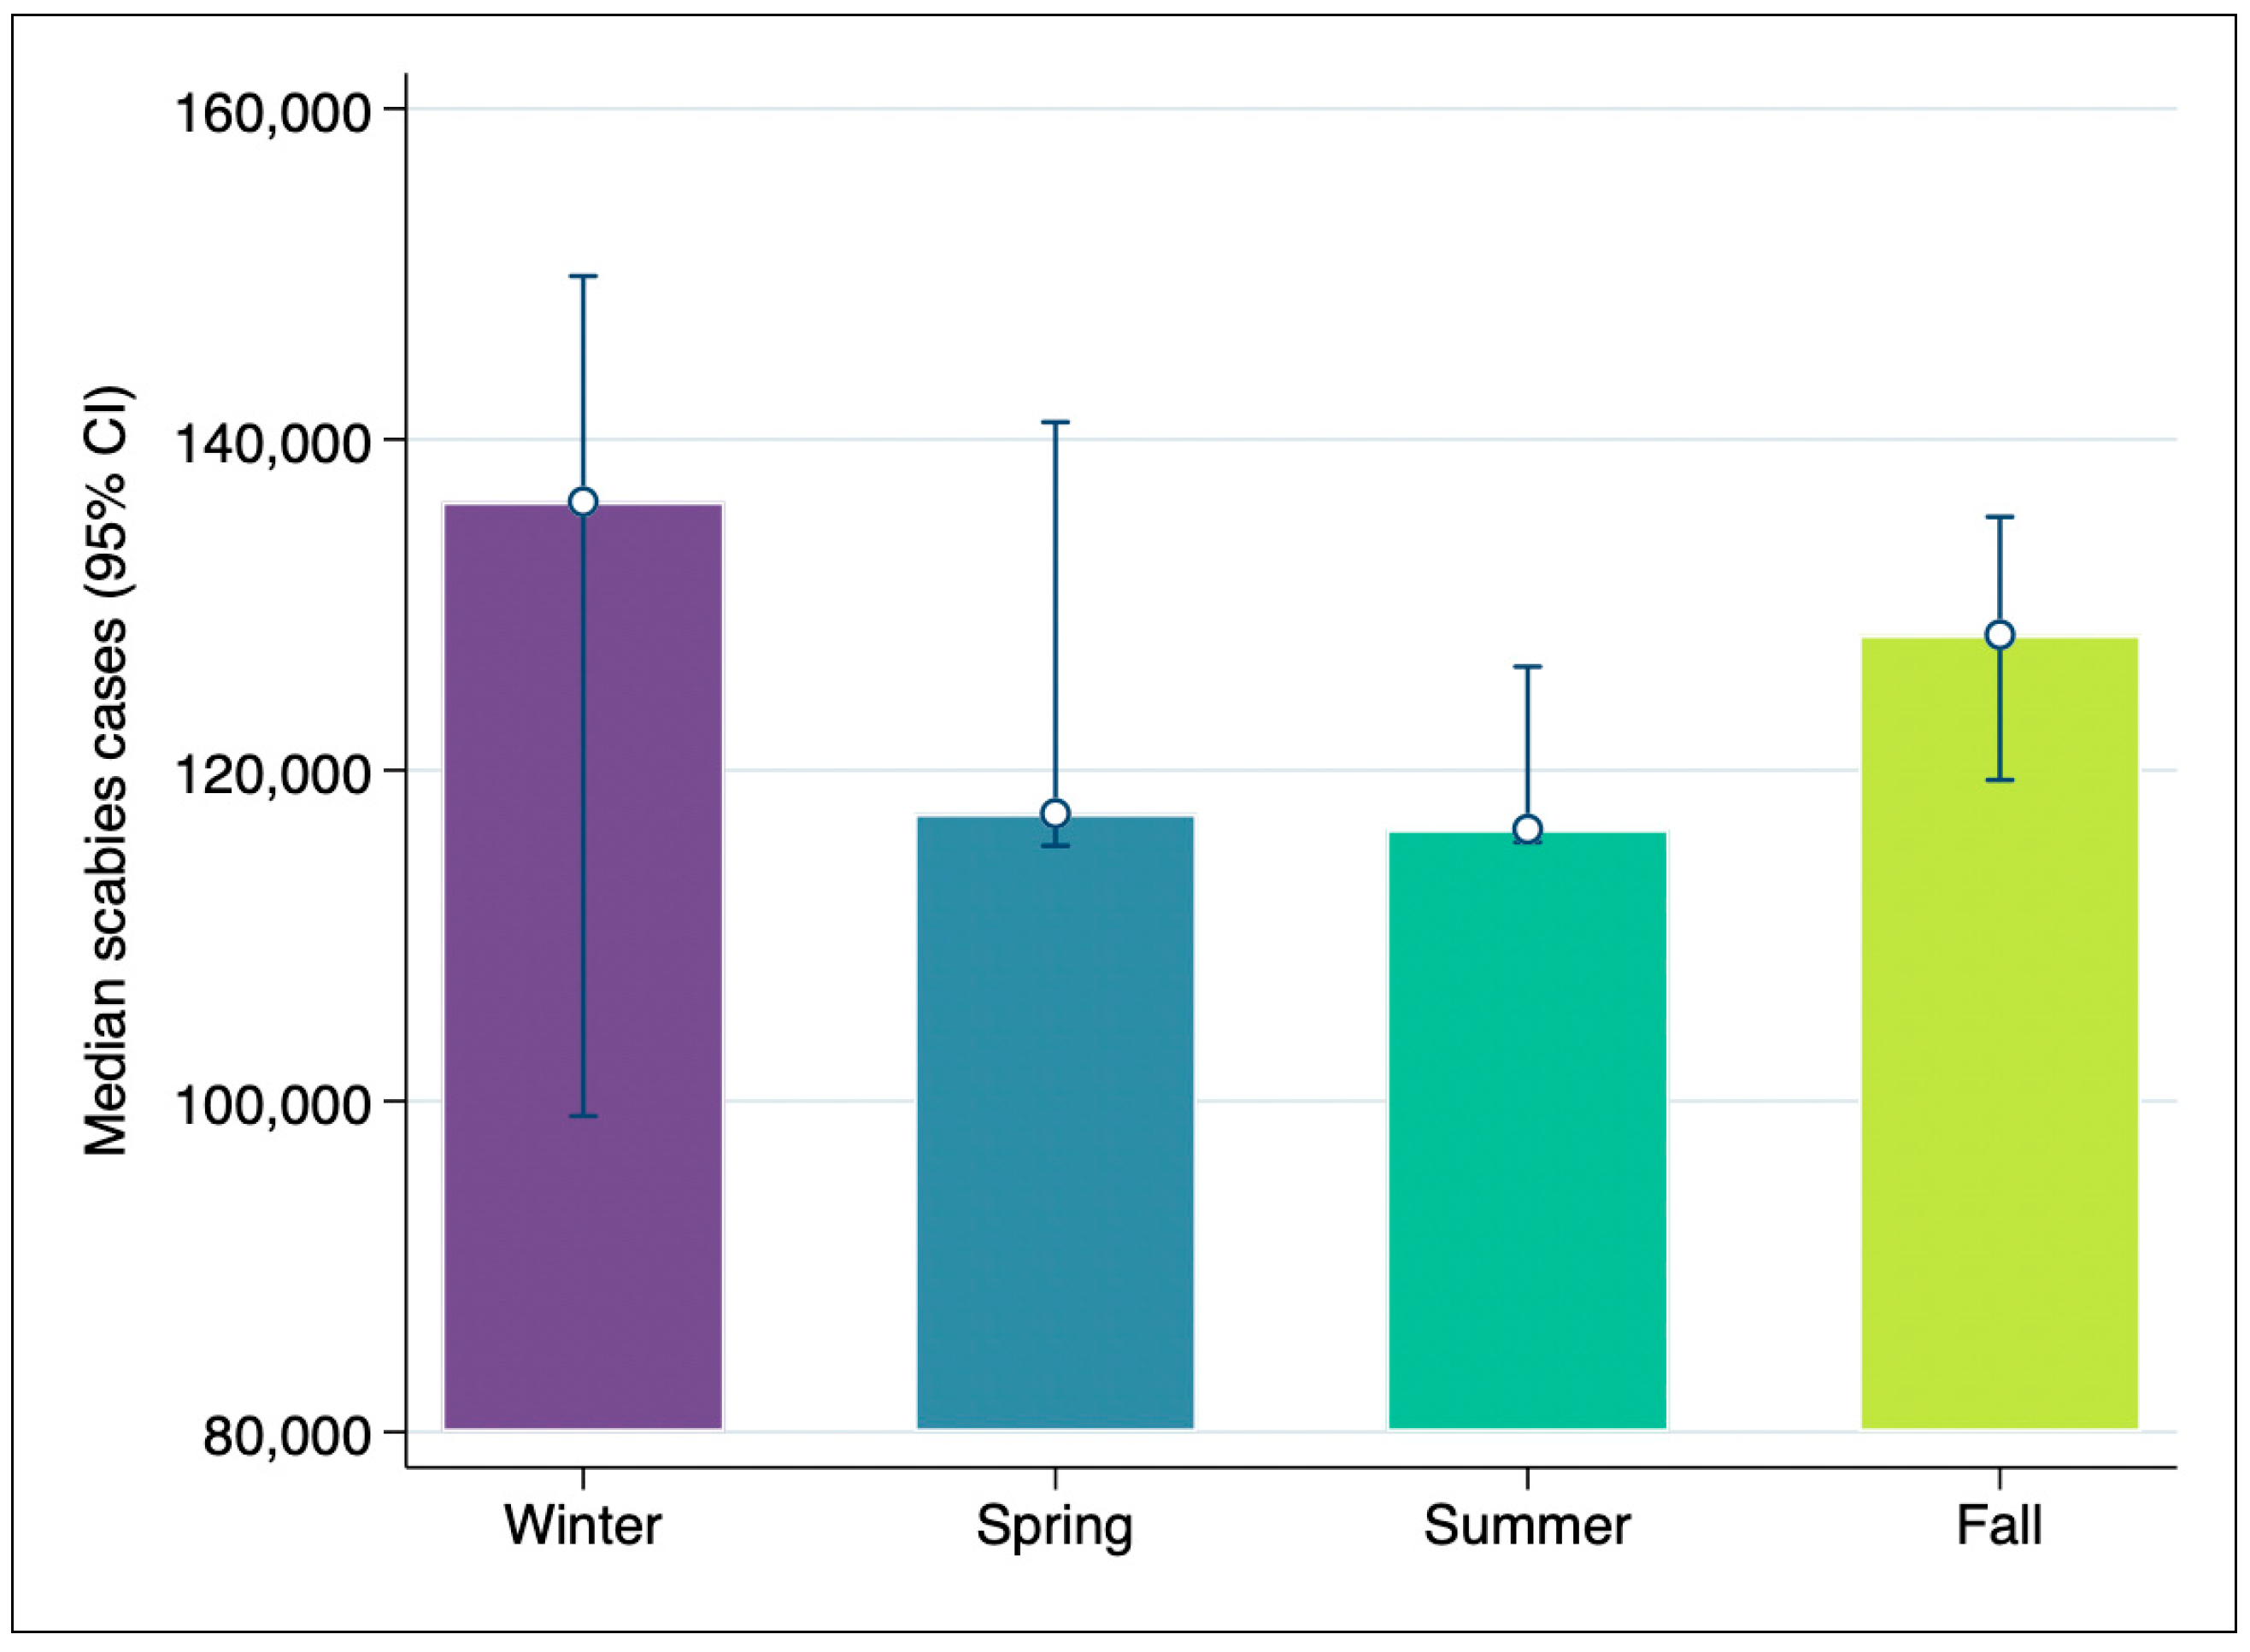
Figure 4 presents the monthly distribution of scabies cases during the study period (2004–2024). The reporting of new cases peaked in January at 149,876 cases (9.99%) and was lowest in December at 99,100 cases (6.61%). The Shapiro–Wilk test indicated that monthly case counts were normally distributed (p = 0.841). No statistically significant seasonal variation in scabies case counts was observed (one-way ANOVA: F = 0.20, p = 0.894; Kruskal–Wallis: p = 0.691). Results were consistent across parametric and non-parametric tests. Winter had the greatest number of cases, 385,212 (25.67%) followed by fall, 382,920 (25.52%), spring, 373,866 (24.92%), and summer, 358,350 (23.88%), though these differences were not statistically significant. Figure 5 presents the median scabies cases in Mexico by season. The estimated median values were 136,236 (95% CI: 98,554–173,919) in winter, 117,386 (95% CI: 96,381–138,391) in spring, 116,440 (95% CI: 107,729–125,151) in summer, and 128,193 (95% CI: 116,898–139,488) in fall. The widest confidence interval was observed in winter (95% CI: 98,554–173,919), reflecting greater variability in case counts during that season.

3.5. State-Level Distribution of Scabies Incidence

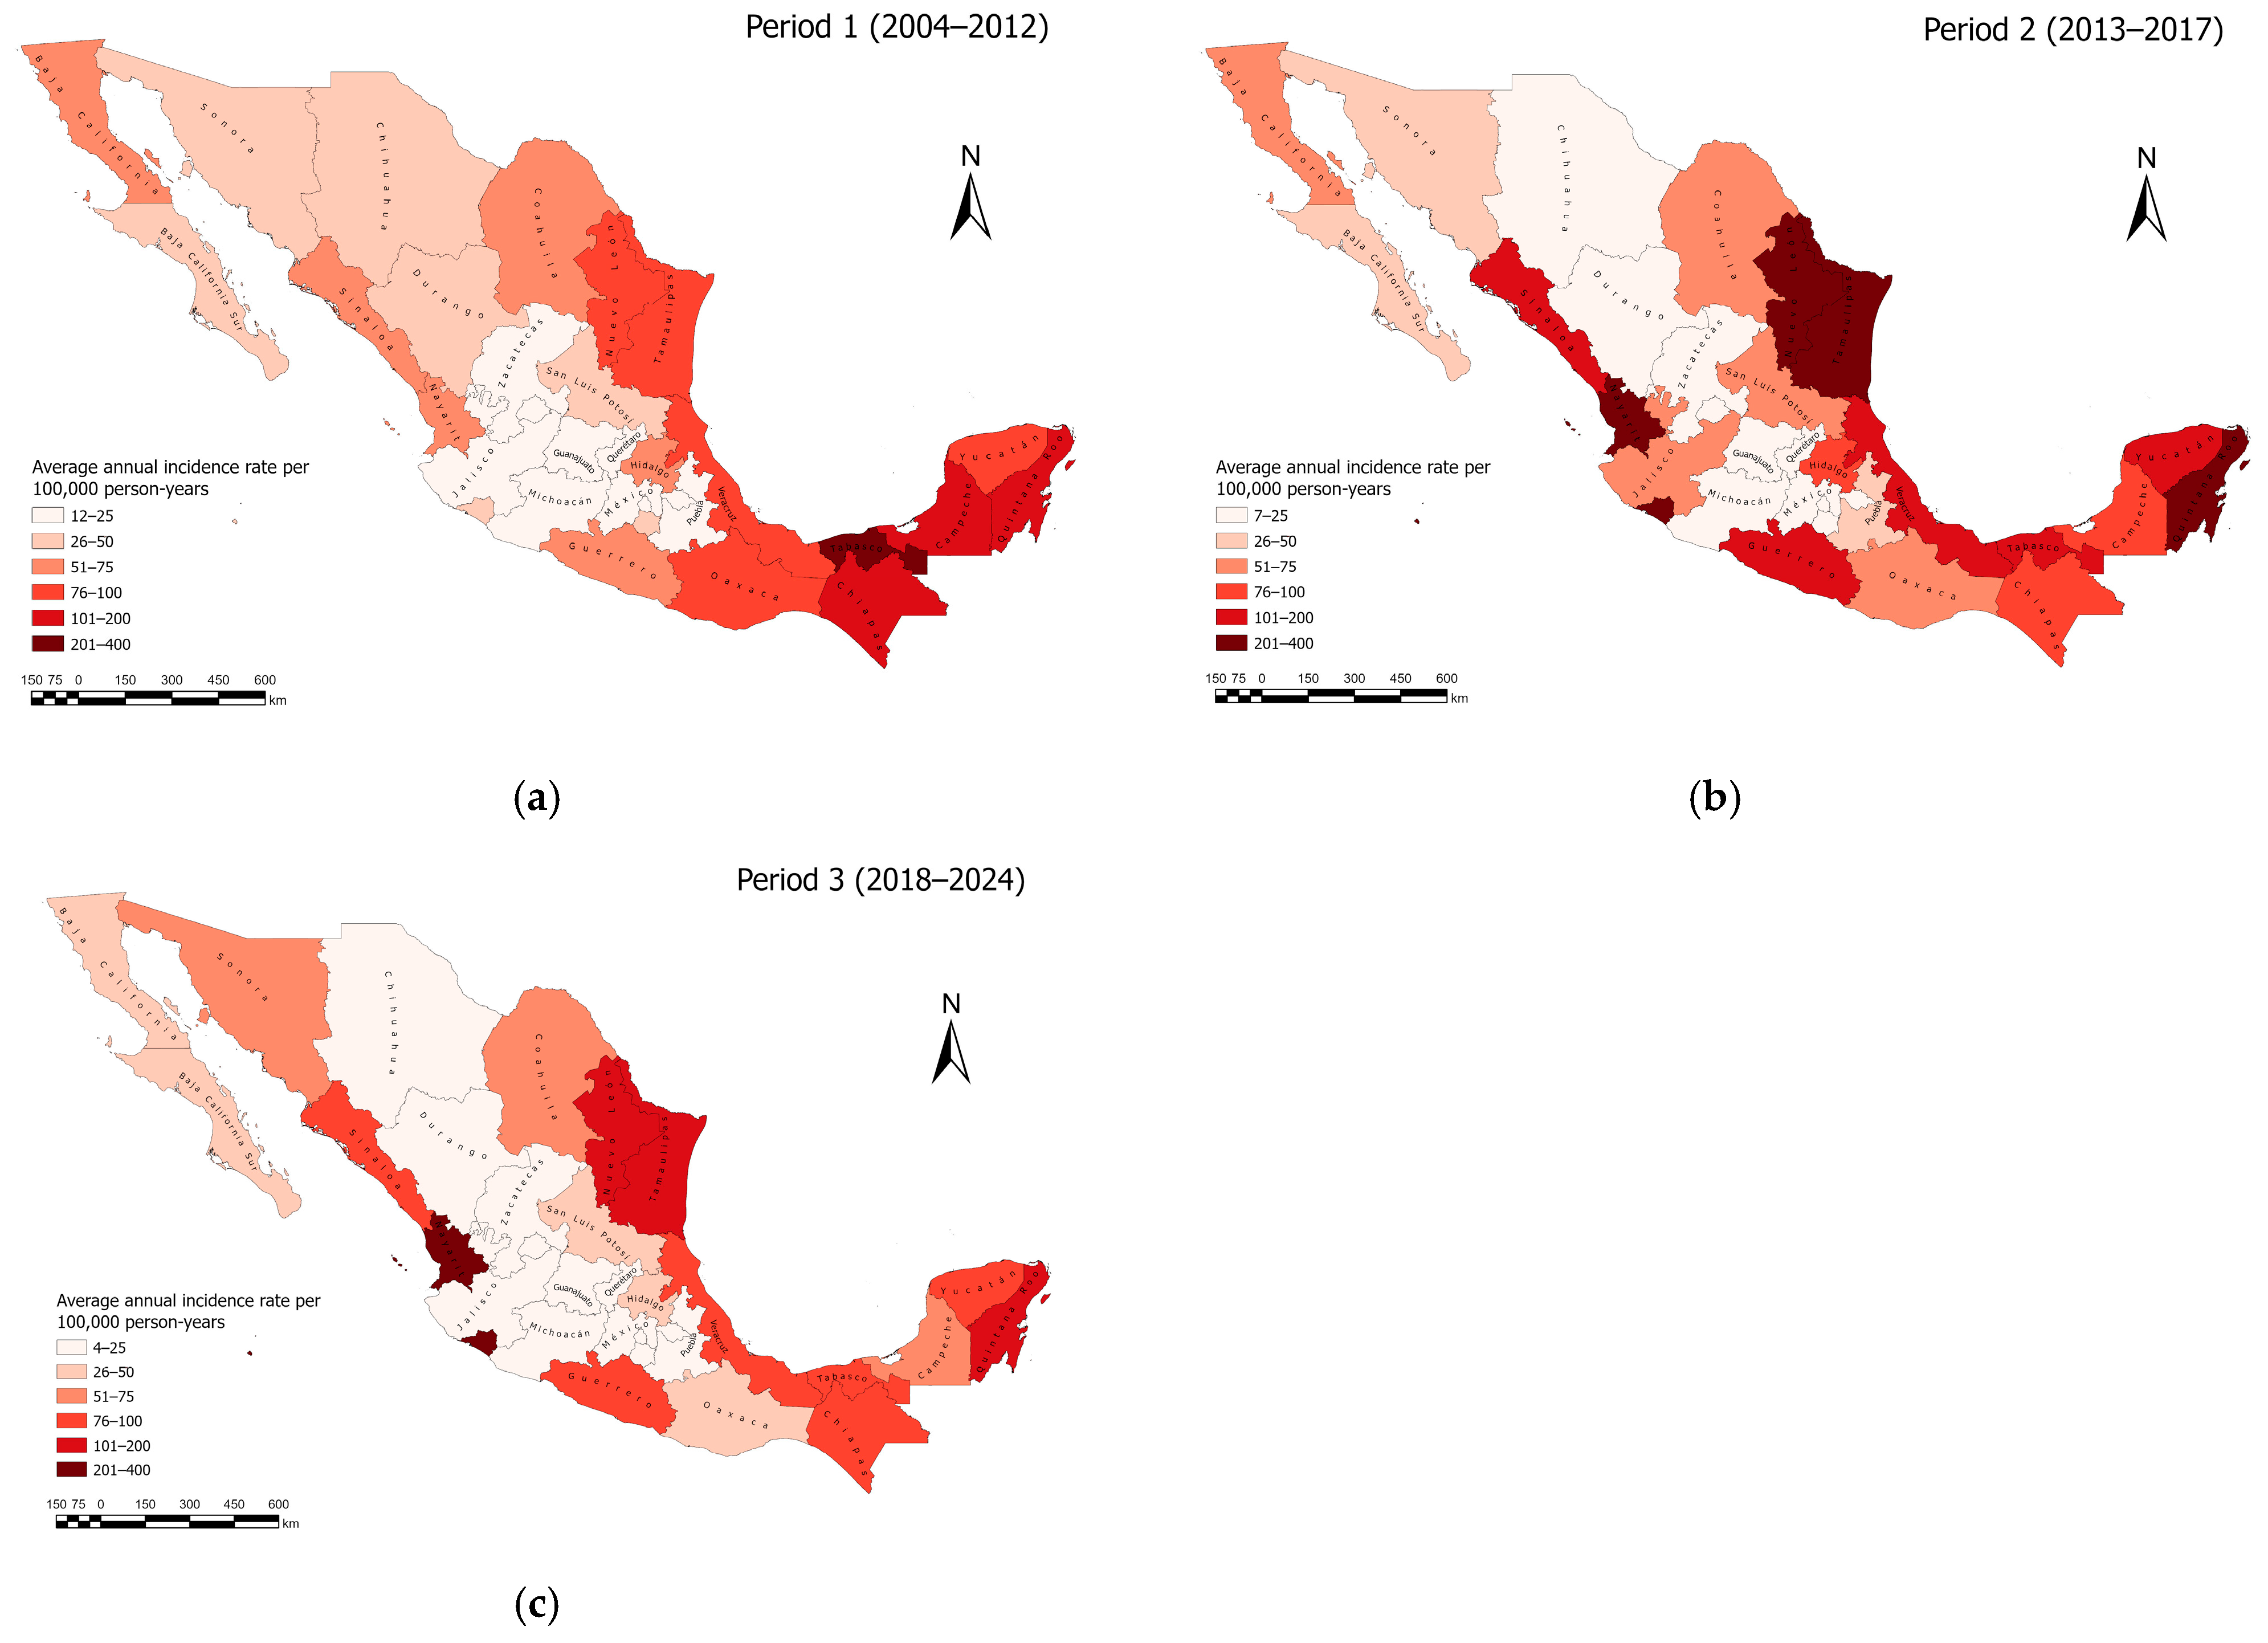
Figure 6 presents the estimated average annual incidence rate per 100,000 person-years by state in Mexico across three periods. These periods correspond to those identified in the joinpoint regression analysis, spanning 9 years (2004–2012), 5 years (2013–2017), and 7 years (2018–2024), respectively. As this measure accounts for differences in period length, rates are directly comparable across the three panels.
Across the entire study period, states in the central region of the country consistently reported the lowest average annual incidence rate (below 25 per 100,000 person-years), including Mexico City, the State of Mexico, Tlaxcala, Aguascalientes, Zacatecas, Guanajuato and Querétaro. In contrast, high-incidence states were concentrated along the coasts and northern border, although the geographic epicenter shifted over time. During the first period, the highest burden was in the southeast, particularly Tabasco and Chiapas (395 and 198 per 100,000, respectively), alongside other southern and coastal states such as Quintana Roo, Campeche, Veracruz, and Oaxaca. By the second period, Tamaulipas and Nuevo León in the northeast, and Nayarit on the Pacific Coast recorded the highest incidence rates (381, 263, and 297 per 100,000, respectively), while other coastal states along the Gulf and Pacific coasts maintained elevated incidence. In the third period, this coastal and northern concentration persisted, with Nayarit, Colima, Tamaulipas, Quintana Roo, and Nuevo León maintaining the highest rates.

3.6. Spatial Autocorrelation Analysis Results

Table 3 presents the Moran’s I statistic, variance, Z-score, and p-value for age-standardized scabies incidence rates across the three periods defined by joinpoint regression analysis. Statistically significant positive spatial clustering was observed during the first period (2004–2012; Z-score > 1.96, p < 0.05), indicating that states with similar scabies incidence rates were geographically concentrated. In contrast, no statistically significant spatial autocorrelation was detected during the second (2013–2017) or third period (2018–2024), suggesting a more spatially dispersed distribution of scabies incidence in these periods.
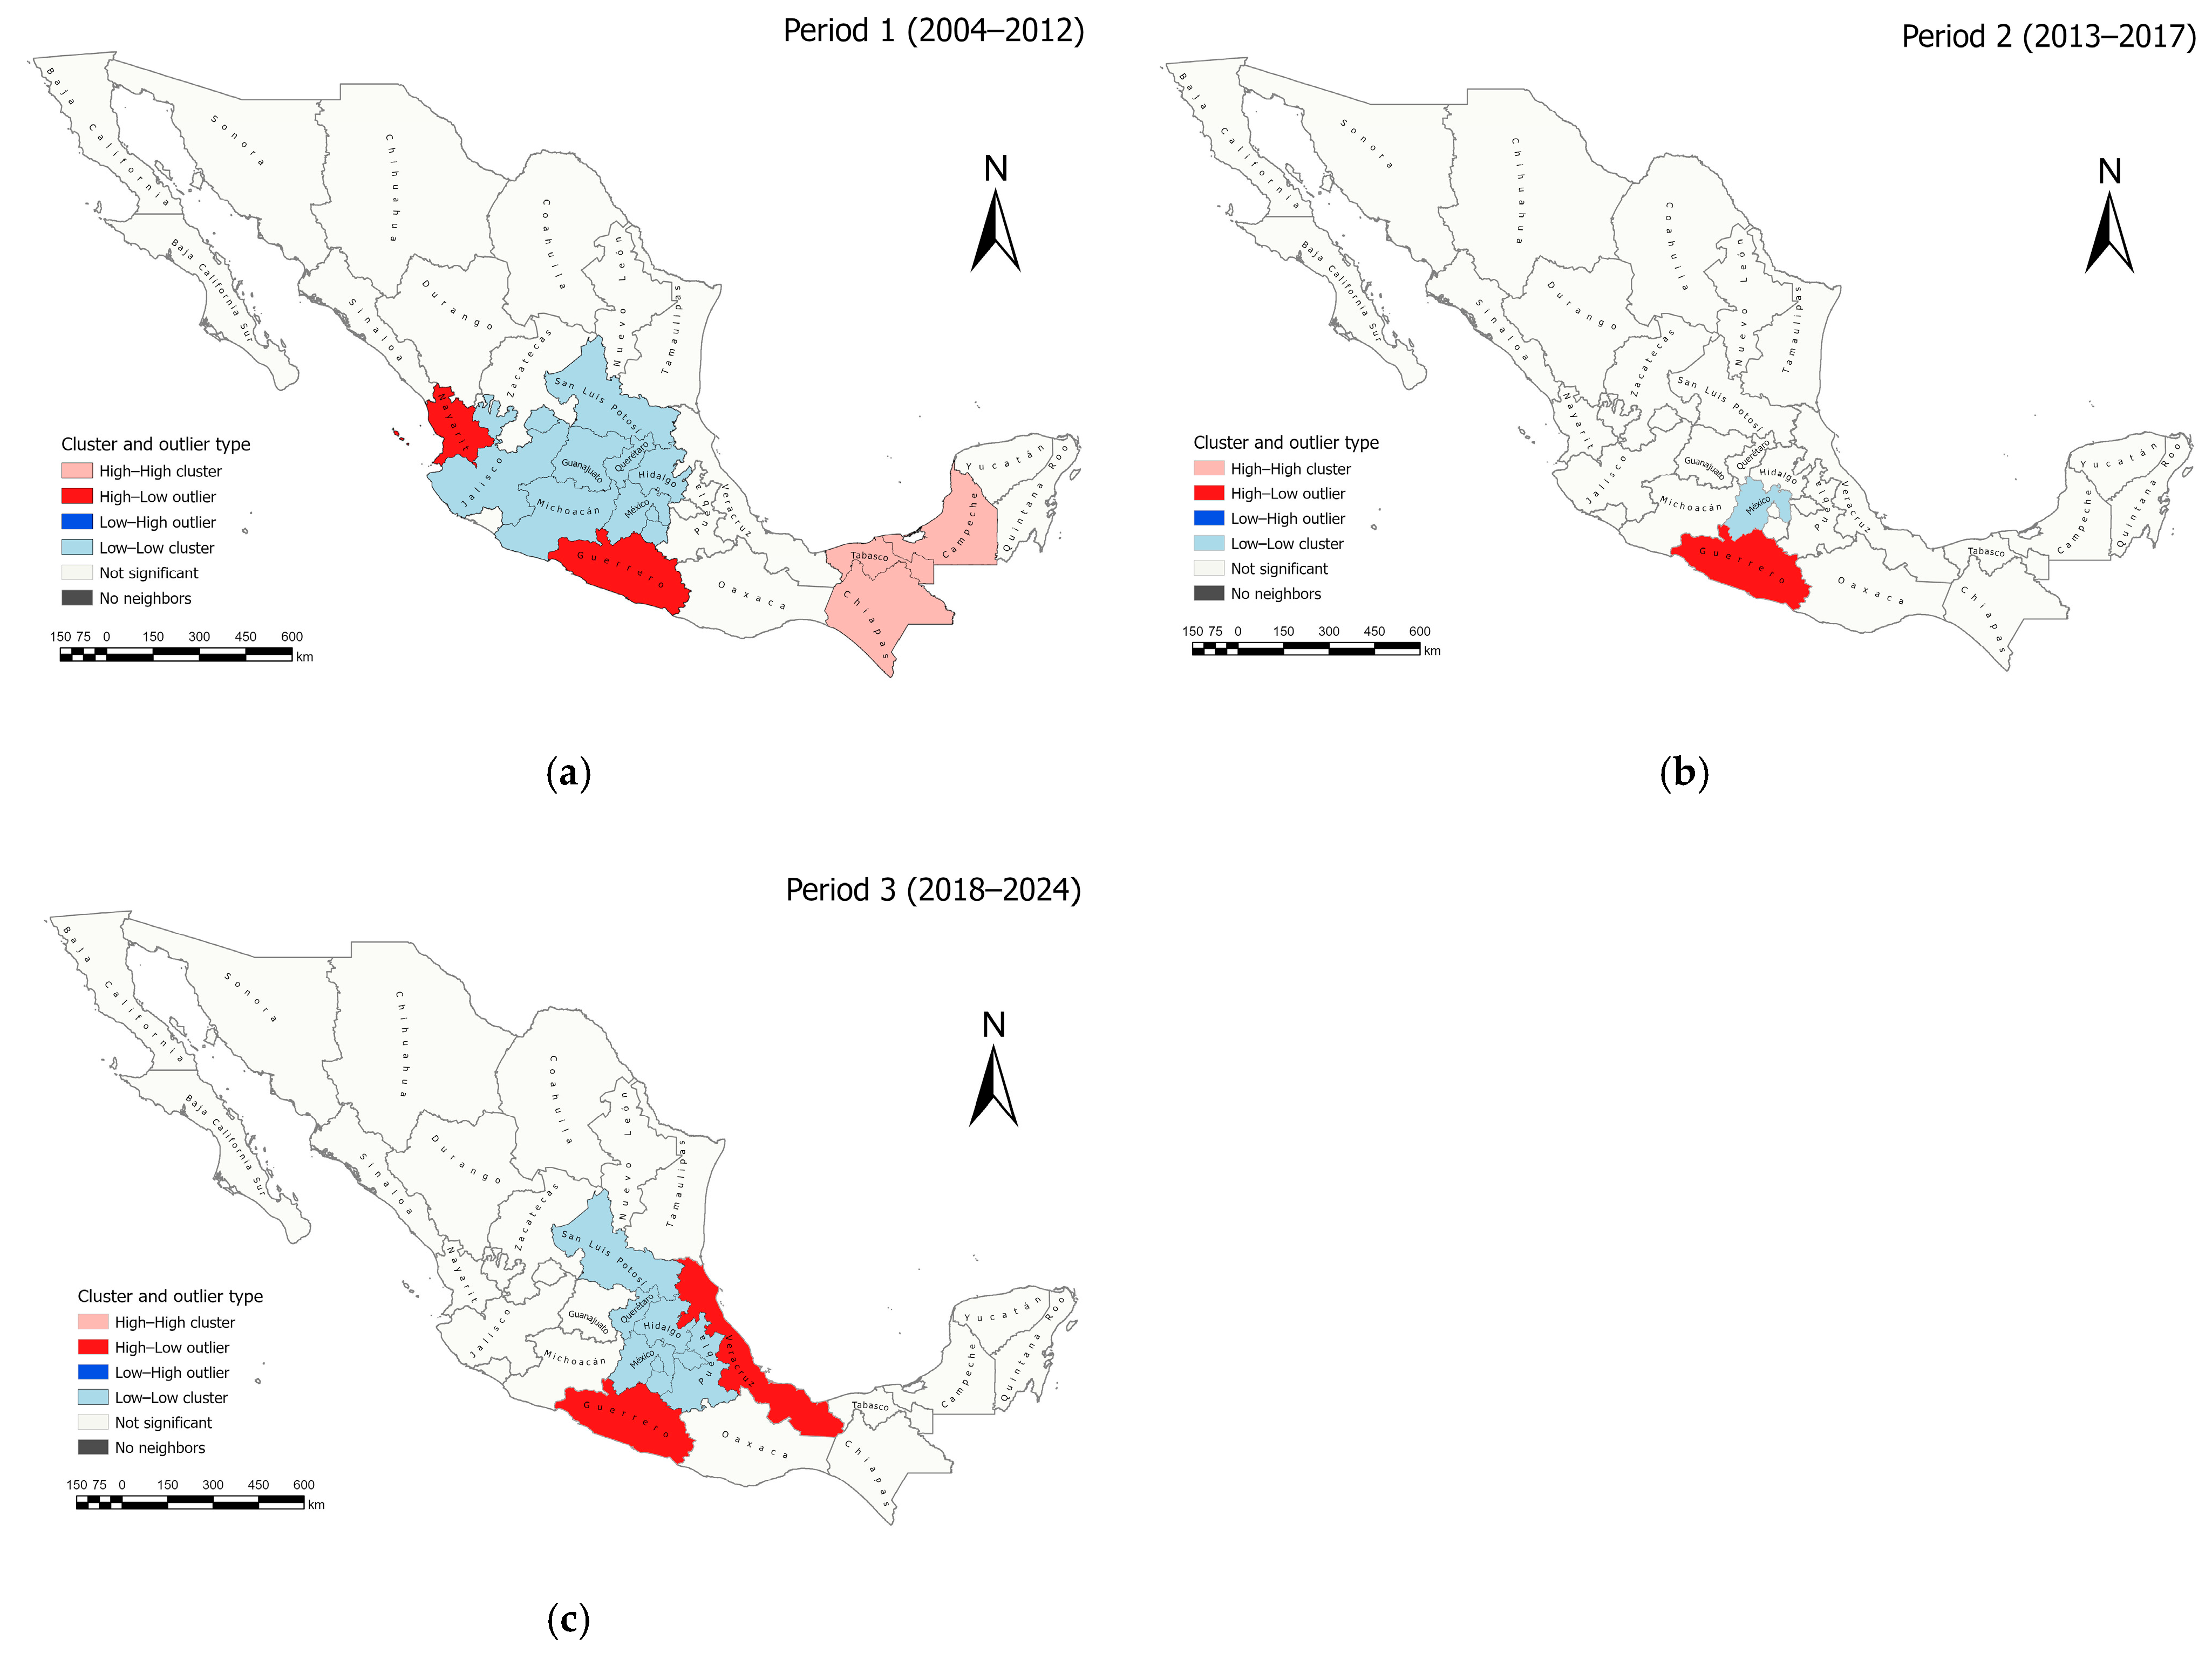
Figure 7 shows the scabies average annual incidence rate per 100,000 person-years hot spots and cold spots in Mexico for the three periods defined by joinpoint regression analysis. During the first period (2004–2012), a High–High cluster was identified in the southwest region of the country, including the states of Chiapas, Tabasco, and Campeche. An extensive Low–Low cluster was also identified in the central region of the country, including the states of Zacatecas, San Luis Potosí, Aguascalientes, Querétaro, Guanajuato, Hidalgo, State of Mexico, Mexico City, Morelos, Nayarit, Jalisco, and Michoacán. The state of Guerrero, on the Pacific Coast, was identified as a High–Low outlier. During the second period (2013–2017), a Low–Low cluster was identified in the State of Mexico. The state of Guerrero was again identified as a High–Low outlier. During the third period (2018–2024), a Low–Low cluster was identified in the central region of the country, including the states of San Luis Potosí, Querétaro, Hidalgo, State of Mexico, Mexico City, Morelos, Tlaxcala, and Puebla. Guerrero was identified as a High–Low outlier for the third consecutive period, along with Veracruz.

4. Discussion

Scabies fluctuations reflect context-dependent epidemic dynamics driven by population movement, socioeconomic factors, and overcrowding. The present study found that scabies incidence in Mexico followed a fluctuating pattern of declines and increases over the 21-year study period, consistent with recurrent epidemic waves rather than a strictly periodic cycle. The initial decline during the first period (2004–2012) may reflect improvements in living standards across most of the country. During this period, the highest burden was concentrated in the southeast, in states with higher poverty rates and lower access to healthcare, water, and sanitation services, such as Chiapas, Oaxaca, Veracruz, and Tabasco. The sharp increase during the second period (2013–2017) coincides with deteriorating living standards, increased migration to the United States, and rising deportations of Mexican migrants by U.S. authorities [47]. Consistent with this, the epicenter shifted to the northeast, particularly Nuevo León and Tamaulipas, both of which border the U.S. and serve as major migration transit points. The subsequent decline in the third period (2018–2024), which includes the COVID-19 pandemic years, may partly reflect reduced healthcare-seeking and reporting rather than a true decrease in transmission, a limitation addressed below. Overall, the net decrease over the study period suggests that the scabies burden in Mexico has declined, though the recurrent waves observed highlight the importance of sustained surveillance.
Children were disproportionately affected compared to other age groups, consistent with reports from other countries [24,25,28,48], with the highest crude incidence rates observed in the 0–4 age group, followed by the 5–9 age group. Children’s disproportionate burden likely reflects a combination of factors, including prolonged exposure to peers and affected caregivers, limited hygiene autonomy at young age, and sharing of beds, clothes, and toys [8,9,49,50]. The attenuated sex difference in young children likely reflects shared household exposure environments in early childhood, where transmission occurs regardless of sex and behavioral differences between boys and girls are minimal.
Notably, while children consistently bore the highest burden throughout the study period, with the 0–4 age group maintaining a rate approximately twice the national average, the increase observed during the second period (2013–2017) was proportionally higher among adolescents and young adults aged 15–24 (approximately 45–51% increase), compared to 31% among children under five. This pattern suggests that the epidemic wave during this period was primarily driven by transmission among the mobile population associated with migration and deportation flows, rather than school-based or household child-to-child transmission. This may explain why yearly fluctuations in Mexico differ from other settings where child-centered transmission dominates.
Females had a higher incidence than males across all age groups, except in the 0–4 and 65 and over age groups. The higher incidence among females was most pronounced in the 25–44 age group, which had the highest female-to-male IRR, which may reflect the caregiving roles of women of reproductive age and their increased skin-to-skin contact with affected children [49,51,52]. The reduction in the higher incidence among females in the ≥65 age group could reflect changes in social behavior, living arrangements, and healthcare-seeking patterns in older populations, including higher rates of institutionalization among elderly males, which may increase their exposure to scabies transmission.
In contrast to some studies reporting seasonal variations and peaks in scabies incidence [15,16], no statistically significant seasonal variation was observed in Mexico during the study period (2004–2024). Several factors may explain this finding. First, aggregating cases over 21 years and across a geographically diverse country may have smoothed out seasonal patterns at the regional or annual level. Second, the absence of seasonal variation at the national level may reflect the influence of socioeconomic and behavioral factors that drive scabies transmission independently of season. Third, reporting patterns in passive surveillance systems may not fully capture true seasonal variation in incidence, as healthcare-seeking behavior, influenced by factors such as postponement of consultation demand during holidays [53,54], health system strain during peak transmission [55,56,57], and barriers to health care access during the rainy season [58,59], may lead to systematic under-reporting during certain periods. As active surveillance is not conducted for scabies in Mexico, data on reporting completeness are not generated, precluding formal quantification of this bias across seasons.
Across most periods, the states with the highest average annual incidence rate per 100,000 person-years were in the Yucatán Peninsula, the Gulf of Mexico coast, and the Pacific Coast, suggesting that geographic and climatic factors may influence the regional distribution of scabies in Mexico (Figure 6). These regions are characterized by hot and humid climates, which may facilitate the survival of Sarcoptes scabiei var. hominis outside the human host and increase the risk of indirect transmission. This finding is consistent with the literature reporting that higher temperature and humidity (21 °C and 40–80% relative humidity) favor Sarcoptes scabiei survival outside the host and are associated with increased transmission [12,14,60,61,62]. In contrast, states in the central region of the country, characterized by more temperate and arid climates, consistently showed the lowest average annual incidence rate per 100,000 person-years across all three periods, supporting the role of climate in shaping the geographic distribution of scabies in Mexico. Notably, during the second period (2013–2017), the geographic distribution of high incidence shifted to the northeastern states of Tamaulipas and Nuevo León, a pattern that justifies further research and may reflect changes in population movement, urbanization, or reporting practices during this period.
In addition to climatic factors, socioeconomic factors are likely to have contributed to the observed regional patterns. States in the southeast and Gulf of Mexico coast have higher poverty rates and lower human development indices in Mexico [63,64], conditions that favor scabies transmission through overcrowding, limited access to clean water, and poor sanitation [1,8,65]. The persistent identification of southeastern and coastal states as hot spots across multiple periods in the Local Moran’s I analysis highlights the role of socioeconomic inequalities in sustaining scabies transmission in these regions and underscores the need for targeted public health interventions, including enhanced surveillance, community-based treatment programs, improvements in housing and sanitation conditions, and educational initiatives to reduce stigma [3,31,66]. The state of Guerrero, on the Pacific Coast, was consistently identified as a High–Low outlier across all three periods, indicating persistently elevated incidence surrounded by states with lower incidence, which may reflect localized socioeconomic vulnerabilities that require further research.
This study has limitations that should be considered when interpreting the findings. First, as with all studies based on passive surveillance data, underreporting is a significant concern. Scabies cases reported through the Mexican Health Ministry’s morbidity yearbooks likely represent only a fraction of true cases, as many individuals may not seek healthcare, particularly in regions with limited access to health services. On the other hand, scabies is usually diagnosed clinically without laboratory confirmation, which may lead to misclassification of cases and introduce diagnostic inaccuracy into the surveillance data. Another limitation of the study is that changes in diagnostic and reporting practices over the study period, including the introduction of the national clinical practice guideline in 2012, may have increased case ascertainment and affected the comparability of case reports across time and should be considered when interpreting the observed trends. In addition, the aggregated nature of the data prevents individual-level analysis of risk factors such as household crowding, hygiene practices, socioeconomic status, and comorbidities, limiting causal inference.
In conclusion, this study provides a comprehensive analysis of the spatiotemporal epidemiology of scabies in Mexico over 21 years (2004–2024). Despite an overall statistically significant net decrease in national scabies incidence, scabies remains a persistent public health concern in Mexico, particularly among children and women, and in high-incidence regions. The geographic clustering of scabies incidence in regions with hot, humid climates and high poverty rates highlights the role of both environmental and socioeconomic factors in maintaining scabies transmission. Future research should focus on subnational analyses at the municipal level, individual-level risk factor assessment, the design and evaluation of targeted control programs, and multivariable regression modelling of seasonal transmission dynamics. Improving the quality of surveillance data will be essential to advancing this research agenda. Transitioning from passive to active surveillance would improve case ascertainment, particularly in regions with limited access to healthcare where underreporting is likely greatest and among migrant populations. Periodic retraining of clinicians in the application of the national clinical practice guideline would improve diagnostic consistency and reduce misclassification over time. Finally, although municipality-level case and population data are recorded by the Mexican Health Ministry, these are not publicly available; making these data accessible would enable more precise geospatial analyses and better identification of local transmission hotspots, ultimately supporting more targeted and effective public health interventions.

Supplementary Materials

The following supporting information can be downloaded at: https://www.mdpi.com/article/10.3390/parasitologia6030030/s1. Scabies Database.

Funding

This research was funded by the Secretaría de Ciencia, Humanidades, Tecnología e Innovación (Secihti), grant number CIR/002/2024 “Métodos cuantitativos para el análisis de la seguridad hídrica en México,” and by the Universidad Autónoma de Aguascalientes grant number PIAG/RN26-1 “Análisis espacio-temporal de dos enfermedades tropicales desatendidas relacionadas con la inseguridad hídrica en México”. The APC was funded by the Universidad Autónoma de Aguascalientes.

Institutional Review Board Statement

Ethical review and approval were not required for this study, as the data were obtained from publicly available Morbidity Yearbooks published by the Mexican Health Ministry. The data are de-identified and cannot be linked to specific individuals.

Informed Consent Statement

Not applicable.

Data Availability Statement

All the data analyzed in this paper is publicly available from the website: https://epidemiologia.salud.gob.mx/anuario/html/index.html (accessed on 9 March 2026) and in the Supplementary Materials.

Acknowledgments

The author wishes to thank Tomás José Ferrer for his assistance during the data collection stage, and Gloria Angélica Quintanar Gálvez and Angélica González Quintanar for their moral support during the research.

Conflicts of Interest

The author declares no conflicts of interest. The funders had no role in the design of the study; in the collection, analyses, or interpretation of data; in the writing of the manuscript; or in the decision to publish the results.

Abbreviations

The following abbreviations are used in this manuscript:
APCAnnual percentage change
AAPCAverage annual percentage change
CIConfidence interval
IRRIncidence rate ratio
NTDNeglected tropical disease
STAG-NTDStrategic and Technical Advisory Group for Neglected Tropical Diseases
WHOWorld Health Organization

Appendix A

Figure A1. Autocorrelation function (ACF) and partial autocorrelation function (PACF) plots of joinpoint model residuals—Males.
Parasitologia 06 00030 g0a1
Figure A2. Autocorrelation function (ACF) and partial autocorrelation function (PACF) plots of joinpoint model residuals—Females.
Parasitologia 06 00030 g0a2

References

  1. World Health Organization (WHO). Scabies. Available online: https://www.who.int/news-room/fact-sheets/detail/scabies (accessed on 13 March 2026).
  2. Fernando, D.D.; Mounsey, K.E.; Bernigaud, C.; Surve, N.; Estrada Chávez, G.E.; Hay, R.J.; Currie, B.J.; Chosidow, O.; Fischer, K. Scabies. Nat. Rev. Dis. Prim. 2024, 10, 74. [Google Scholar] [CrossRef] [Scilit]
  3. Heukelbach, J.; Feldmeier, H. Scabies. Lancet 2006, 367, 1767–1774. [Google Scholar] [CrossRef] [Scilit] [PubMed]
  4. World Health Organization (WHO). Report of the Tenth Meeting of the WHO Strategic and Technical Advisory Group for Neglected Tropical Diseases; WHO: Geneva, Switzerland, 2017. [Google Scholar]
  5. World Health Organization (WHO). WHO Informal Consultation on a Framework for Scabies Control: World Health Organization Regional Office for the Western Pacific: Manila, Philippines, 19–21 February 2019: Meeting Report; WHO: Manila, Philippines, 2020. [Google Scholar]
  6. Iyengar, L.; Chong, A.H.; Steer, A.C. Scabies: A Clinical Update. Med. J. Aust. 2024, 221, 558–563. [Google Scholar] [CrossRef] [Scilit] [PubMed]
  7. El-Moamly, A.A. Scabies as a Part of the World Health Organization Roadmap for Neglected Tropical Diseases 2021–2030: What We Know and What We Need to Do for Global Control. Trop. Med. Health 2021, 49, 64. [Google Scholar] [CrossRef] [Scilit]
  8. Ararsa, G.; Merdassa, E.; Shibiru, T.; Etafa, W. Prevalence of Scabies and Associated Factors among Children Aged 5–14 Years in Meta Robi District, Ethiopia. PLoS ONE 2023, 18, e0277912. [Google Scholar] [CrossRef] [Scilit]
  9. Melese, F.; Malede, A.; Sisay, T.; Geremew, A.; Gebrehiwot, M.; Woretaw, L.; Atanaw, G.; Azanaw, J.; Melese, M.; Feleke, H. Cloth Sharing with a Scabies Case Considerably Explains Human Scabies among Children in a Low Socioeconomic Rural Community of Ethiopia. Trop. Med. Health 2023, 51, 52. [Google Scholar] [CrossRef] [Scilit]
  10. Enbiale, W.; Ayalew, A. Investigation of a Scabies Outbreak in Drought-Affected Areas in Ethiopia. Trop. Med. Infect. Dis. 2018, 3, 114. [Google Scholar] [CrossRef] [Scilit]
  11. Enbiale, W. Climate Change and Dermatologic Diseases in the Global South. Dermatol. Clin. 2026, 44, 67–78. [Google Scholar] [CrossRef] [Scilit] [PubMed]
  12. Liu, J.-M.; Wang, H.-W.; Chang, F.-W.; Liu, Y.-P.; Chiu, F.-H.; Lin, Y.-C.; Cheng, K.-C.; Hsu, R.-J. The Effects of Climate Factors on Scabies. A 14-Year Population-Based Study in Taiwan. Parasite 2016, 23, 54. [Google Scholar] [CrossRef] [Scilit] [PubMed]
  13. Korycinska, J.; Dzika, E.; Kloch, M. Epidemiology of Scabies in Relation to Socio-Economic and Selected Climatic Factors in North-East Poland. Ann. Agric. Environ. Med. 2020, 27, 374–378. [Google Scholar] [CrossRef] [Scilit]
  14. Silva, N.; Alencar, C.H.; Heukelbach, J. Environmental and Social Factors Associated with the Occurrence of Severe Tungiasis and Scabies in the State of Ceará, Brazil: An Ecological Study. Trop. Med. Infect. Dis. 2025, 10, 135. [Google Scholar] [CrossRef] [Scilit]
  15. Mimouni, D.; Ankol, O.E.; Davidovitch, N.; Gdalevich, M.; Zangvil, E.; Grotto, I. Seasonality Trends of Scabies in a Young Adult Population: A 20-Year Follow-Up. Br. J. Dermatol. 2003, 149, 157–159. [Google Scholar] [CrossRef] [Scilit] [PubMed]
  16. Downs, A.M.R. Seasonal Variation in Scabies. Br. J. Dermatol. 2004, 150, 602–603. [Google Scholar] [CrossRef] [Scilit]
  17. Nawaz, K.; Khan, S.; Bibi, A. Insights into Scabies Prevalence and Risk Factors. Bull. Biol. Allied Sci. Res. 2024, 2024, 68. [Google Scholar] [CrossRef] [Scilit]
  18. Rahman, M.S.; Hasan, A.B.M.N.; Jahan, I.; Sharif, A. Bin Prevalence of Scabies and Its Associated Environmental Risk Factors among the Forcibly Displaced Myanmar Nationals Living in the Cox’s Bazar District of Bangladesh. J. Migr. Heal. 2024, 9, 100220. [Google Scholar] [CrossRef] [Scilit]
  19. Halder, C.E.; Hasan, M.A.; Okello, J.C.; Khan, M.F.; Soma, E.R.; Poly, J.T.; Tassdik, H.; Hosen, M.S.; Prue, U.M.; Hannan, A. Seasonality of Scabies and Its Association with Climatic Factors in Rohingya Refugee Camps, Cox’s Bazar: A Retrospective Observational Study, 2021–2023. BMJ Open 2026, 16, e117016. [Google Scholar] [CrossRef] [Scilit]
  20. Hicks, M.I.; Elston, D.M. Scabies. Dermatol. Ther. 2009, 22, 279–292. [Google Scholar] [CrossRef] [Scilit]
  21. Jokela, E.; Mikola, A.; Kiviniemi, E.; Jokelainen, J.; Sinikumpu, S.-P.; Huilaja, L. Incidence of Scabies from 1996 to 2022: A Retrospective Single Centre Cohort Study from Finland. Br. J. Dermatol. 2025, 192, 741–743. [Google Scholar] [CrossRef] [Scilit] [PubMed]
  22. Walker, M.D. Examining the Cyclical Nature of Scabies Using Historical Texts. Int. J. Dermatol. 2023, 62, e525–e526. [Google Scholar] [CrossRef] [Scilit]
  23. Aktaş, H.; Cebecik, A. Changes in Incidence and Age Distribution of Scabies: A Retrospective Cohort Study in a Tertiary Hospital. Arch. Clin. Exp. Med. 2019, 4, 21–24. [Google Scholar] [CrossRef] [Scilit]
  24. Delaš Aždajić, M.; Bešlić, I.; Gašić, A.; Ferara, N.; Pedić, L.; Lugović-Mihić, L. Increased Scabies Incidence at the Beginning of the 21st Century: What Do Reports from Europe and the World Show? Life 2022, 12, 1598. [Google Scholar] [CrossRef] [Scilit] [PubMed]
  25. Zhang, W.; Zhang, Y.; Luo, L.; Huang, W.; Shen, X.; Dong, X.; Zeng, W.; Lu, H. Trends in Prevalence and Incidence of Scabies from 1990 to 2017: Findings from the Global Burden of Disease Study 2017. Emerg. Microbes Infect. 2020, 9, 813–816. [Google Scholar] [CrossRef] [Scilit]
  26. Schneider, S.; Wu, J.; Tizek, L.; Ziehfreund, S.; Zink, A. Prevalence of Scabies Worldwide—An Updated Systematic Literature Review in 2022. J. Eur. Acad. Dermatol. Venereol. 2023, 37, 1749–1757. [Google Scholar] [CrossRef] [Scilit]
  27. Tavoletti, G.; Avallone, G.; Sechi, A.; Cinotti, E.; Veraldi, S.; Micali, G.; Lacarrubba, F.; Marzano, A.V.; Nazzaro, G. Scabies: An Updated Review from Epidemiology to Current Controversies and Future Perspectives. Travel Med. Infect. Dis. 2025, 67, 102878. [Google Scholar] [CrossRef] [Scilit] [PubMed]
  28. Li, J.; Liu, Z.; Xia, X. The Disability-Adjusted Life Years (DALYs), Prevalence and Incidence of Scabies, 1990–2021: A Systematic Analysis from the Global Burden of Disease Study 2021. PLoS Negl. Trop. Dis. 2024, 18, e0012775. [Google Scholar] [CrossRef] [Scilit]
  29. Paray, A.A.; Chandra, M.; Wani, I.; Singh, M.; Kaur, A.; Najar, I.A.; Paray, N.A.; Dar, M.M. Scabies as a Neglected Tropical Disease: A Comprehensive Review of Pathogenesis, Epidemiology, Clinical Manifestations, Diagnosis and Treatment. Yale J. Biol. Med. 2025, 98, 489–500. [Google Scholar] [CrossRef] [Scilit]
  30. World Health Organization (WHO). Ending the Neglect to Attain the Sustainable Development Goals: A Road Map for Neglected Tropical Diseases 2021–2030; WHO: Geneva, Switzerland, 2020. [Google Scholar]
  31. Engelman, D.; Marks, M.; Steer, A.C.; Beshah, A.; Biswas, G.; Chosidow, O.; Coffeng, L.E.; Lardizabal Dofitas, B.; Enbiale, W.; Fallah, M.; et al. A Framework for Scabies Control. PLoS Negl. Trop. Dis. 2021, 15, e0009661. [Google Scholar] [CrossRef] [Scilit]
  32. Friedman, R. Scabies in Colonial America. Ann. Med. Hist. 1940, 2, 401–403. [Google Scholar] [PubMed]
  33. de Sahagún, B. Historia General de Las Cosas de Nueva España; Consejo Nacional para la Cultura y las Artes: Ciudad de México, Mexico, 2002.
  34. Guerra, F.; Sánchez Téllez, M.C. Las Enfermedades Del Hombre Americano. Quinto Cent. 1990, 16, 19–54. [Google Scholar]
  35. Cuenca, J.V.R. Las Enfermedades En Las Condiciones de Vida Prehispánica de Colombia; Universidad Nacional de Colombia: Bogota, Colombia, 2006. [Google Scholar]
  36. Secretaría de Salud (SSA). NORMA Oficial Mexicana NOM-017-SSA2-2012, Para La Vigilancia Epidemiológica; Diario Oficial de la Federación: Ciudad de México, Mexico, 2013.
  37. Secretaría de Salud (SSA). Diagnóstico y Tratamiento de Escabiosis; Secretaría de Salud: Mexico City, Mexico, 2012.
  38. Secretaría de Salud (SSA). Secretaría de Salud Definiciones Operacionales de Enfermedades Sujetas a Vigilancia Convencional; Secretaría de Salud: Mexico City, Mexico, 2021.
  39. Secretaría de Salud (SSA). Anuarios de Morbilidad 1984 a 2024. Available online: https://www.gob.mx/salud/acciones-y-programas/anuarios-de-morbilidad-1984-a-2024 (accessed on 9 March 2026).
  40. Secretaría de Salud (SSA). Manual de Procedimientos Estandarizados Para La Vigilancia Epidemiológica de La Notificación Convencional de Casos Nuevos de Enfermedad; Secretaría de Salud: Mexico City, Mexico, 2021.
  41. Consejo Nacional de Población (CONAPO). Conciliación Demográfica de 1950 a 2019 y Proyecciones de La Población de México y de Las Entidades Federativas 2020 a 2070. Available online: https://www.gob.mx/conapo/acciones-y-programas/conciliacion-demografica-de-1950-a-2019-y-proyecciones-de-la-poblacion-de-mexico-y-de-las-entidades-federativas-2020-a-2070 (accessed on 2 March 2026).
  42. Ahmad, O.B.; Boschi-Pinto, C.; Lopez, A.D.; Murray, C.J.L.; Lozano, R.; Inoue, M. Age Standardization of Rates: A New WHO Standard; GPE Discussion Paper Series; WHO: Geneva, Switzerland, 2001. [Google Scholar]
  43. Kim, H.-J.; Fay, M.P.; Feuer, E.J.; Midthune, D.N. Permutation Tests for Joinpoint Regression with Applications to Cancer Rates. Stat. Med. 2000, 19, 335–351. [Google Scholar] [CrossRef] [Scilit]
  44. Mitchell, A. The ESRI Guide to GIS Analysis, Volume 2: Spatial Measurements and Statistics; ESRI: Sydney, Australia, 2005; ISBN 158948116X. [Google Scholar]
  45. Getis, A. Spatial Autocorrelation. In Handbook of Applied Spatial Analysis; Fischer, M.M., Getis, A., Eds.; Springer: Berlin/Heidelberg, Germany, 2010; pp. 255–278. [Google Scholar]
  46. Anselin, L. Local Indicators of Spatial Association—LISA. Geogr. Anal. 1995, 27, 93–115. [Google Scholar] [CrossRef] [Scilit]
  47. Gil Everaert, I.; Rodríguez, O.; Masferrer, C. Mejores Condiciones y Mayores Posibilidades Para Las Poblaciones Desplazadas, En México (Notas Sobre Migración y Desigualdades Núm. 7); El Colegio de México: Mexico City, Mexico, 2023. [Google Scholar]
  48. Romani, L.; Steer, A.C.; Whitfeld, M.J.; Kaldor, J.M. Prevalence of Scabies and Impetigo Worldwide: A Systematic Review. Lancet Infect. Dis. 2015, 15, 960–967. [Google Scholar] [CrossRef] [Scilit]
  49. Thompson, R.; Westbury, S.; Slape, D. Paediatrics: How to Manage Scabies. Drugs Context 2021, 10, 2020-12-3. [Google Scholar] [CrossRef] [Scilit]
  50. Jetly, K.J.J.K.; Ibrahim, F.E.; Karim, I.K.A.; Jeevanathan, C.; Mokti, K.; Omar, A.; Pang, N.T.P.; Rahim, S.S.S.A.; Jeffree, M.S.; Azhar, Z.I.; et al. Risk Factors for Scabies in School Children: A Systematic Review. Vopr. Prakt. Pediatr. 2022, 17, 117–125. [Google Scholar] [CrossRef] [Scilit]
  51. Mitchell, E.; Wallace, M.; Marshall, J.; Whitfeld, M.; Romani, L. Scabies: Current Knowledge and Future Directions. Front. Trop. Dis. 2024, 5, 01–09. [Google Scholar] [CrossRef] [Scilit]
  52. Thomas, C.; Castillo Valladares, H.; Berger, T.G.; Chang, A.Y. Scabies, Bedbug, and Body Lice Infestations. JAMA 2024, 332, 1189. [Google Scholar] [CrossRef] [Scilit]
  53. Gupta, D.; Denton, B. Appointment Scheduling in Health Care: Challenges and Opportunities. IIE Trans. 2008, 40, 800–819. [Google Scholar] [CrossRef] [Scilit]
  54. van Bussel, E.M.; van der Voort, M.B.V.R.; Wessel, R.N.; van Merode, G.G. Demand, Capacity, and Access of the Outpatient Clinic: A Framework for Analysis and Improvement. J. Eval. Clin. Pract. 2018, 24, 561–569. [Google Scholar] [CrossRef] [Scilit] [PubMed]
  55. Yang, K.-K.; Cayirli, T. Managing Clinic Variability with Same-Day Scheduling, Intervention for No-Shows, and Seasonal Capacity Adjustments. J. Oper. Res. Soc. 2020, 71, 133–152. [Google Scholar] [CrossRef] [Scilit]
  56. Tangcharoensathien, V.; Bassett, M.T.; Meng, Q.; Mills, A. Are Overwhelmed Health Systems an Inevitable Consequence of COVID-19? Experiences from China, Thailand, and New York State. BMJ 2021, 372, n83. [Google Scholar] [CrossRef] [Scilit] [PubMed]
  57. Doubova, S.V.; Leslie, H.H.; Kruk, M.E.; Pérez-Cuevas, R.; Arsenault, C. Disruption in Essential Health Services in Mexico during COVID-19: An Interrupted Time Series Analysis of Health Information System Data. BMJ Glob. Health 2021, 6, e006204. [Google Scholar] [CrossRef] [Scilit]
  58. Joseph, G.M.; Skinner, M.W.; Yantzi, N.M. The Weather-Stains of Care: Interpreting the Meaning of Bad Weather for Front-Line Health Care Workers in Rural Long-Term Care. Soc. Sci. Med. 2013, 91, 194–201. [Google Scholar] [CrossRef] [Scilit] [PubMed]
  59. Stone, B.; Sambo, J.; Sawadogo-Lewis, T.; Roberton, T. When It Rains, It Pours: Detecting Seasonal Patterns in Utilization of Maternal Healthcare in Mozambique Using Routine Data. BMC Health Serv. Res. 2020, 20, 950. [Google Scholar] [CrossRef] [Scilit]
  60. Hay, R.J.; Steer, A.C.; Engelman, D.; Walton, S. Scabies in the Developing World–-Its Prevalence, Complications, and Management. Clin. Microbiol. Infect. 2012, 18, 313–323. [Google Scholar] [CrossRef] [Scilit]
  61. Sharaf, M.S. Scabies: Immunopathogenesis and Pathological Changes. Parasitol. Res. 2024, 123, 149. [Google Scholar] [CrossRef] [Scilit]
  62. Arlian, L.G.; Runyan, R.A.; Achar, S.; Estes, S.A. Survival and Infestivity of Sarcoptes scabiei var. canis and var. hominis. J. Am. Acad. Dermatol. 1984, 11, 210–215. [Google Scholar] [CrossRef] [Scilit] [PubMed]
  63. Programa de las Naciones Unidas para el Desarrollo (PNUD). Informe de Desarrollo Humano Municipal 2010–2020 Una Década de Transformaciones Locales En México; Programa de las Naciones Unidas para el Desarrollo: Ciudad de México, Mexico, 2022. [Google Scholar]
  64. López, J.A.V. La Pobreza Multidimensional Y la Pobreza Extrema en México, 2022. Semest. Económico 2023, 26, 1–24. [Google Scholar] [CrossRef] [Scilit]
  65. Ahmed, M.N. Scabies Outbreak in Bangladesh: A Growing Public Health Crisis. IJID Reg. 2025, 17, 100747. [Google Scholar] [CrossRef] [Scilit]
  66. Engelman, D.; Cantey, P.T.; Marks, M.; Solomon, A.W.; Chang, A.Y.; Chosidow, O.; Enbiale, W.; Engels, D.; Hay, R.J.; Hendrickx, D.; et al. The Public Health Control of Scabies: Priorities for Research and Action. Lancet 2019, 394, 81–92. [Google Scholar] [CrossRef] [Scilit] [PubMed]
Figure 1. Annual new scabies cases and crude incidence rate (per 100,000 persons) in Mexico, 2004–2024.
Parasitologia 06 00030 g001
Figure 2. Joinpoint regression analysis of changes in scabies incidence rate per 100,000 persons in Mexico, by sex, 2004–2024. (a) Males: dots represent observed age-adjusted rates per 100,000 persons; colored lines represent the fitted joinpoint regression model for each segment; vertical dashed lines indicate joinpoints; capped error bars represent 95% confidence intervals. (b) Females: dots represent observed age-adjusted rates per 100,000 persons; colored lines represent the fitted joinpoint regression model for each segment; vertical dashed lines indicate joinpoints; capped error bars represent 95% confidence intervals.
Parasitologia 06 00030 g002
Figure 3. Crude scabies incidence rate (per 100,000 persons) in Mexico by age groups and sex (2004–2024).
Parasitologia 06 00030 g003
Figure 4. Total scabies cases in Mexico by month (2004–2024).
Parasitologia 06 00030 g004
Figure 5. Median scabies cases in Mexico by season (2004–2024).
Parasitologia 06 00030 g005
Figure 6. Average annual incidence rate per 100,000 person-years of scabies per 100,000 persons by state in Mexico for three periods defined by joinpoint regression analysis: (a) 2004–2012; (b) 2013–2017; (c) 2018–2024. Class intervals are consistent across all panels to allow direct visual comparison across periods.
Parasitologia 06 00030 g006
Figure 7. Scabies average annual incidence rate per 100,000 person-years hot spots and cold spots in Mexico for three periods defined by joinpoint regression analysis: (a) 2004–2012; (b) 2013–2017; (c) 2018–2024.
Parasitologia 06 00030 g007
Table 1. Crude scabies incidence rate (per 100,000 persons) by age group and sex, female-to-male (F/M) incidence rate ratio and 95% confidence intervals.
FemaleMaleIncidence Rate Ratio
Age GroupsCasesIncidenceCasesIncidenceF/M(95% CI)
0–4147,287128154,4531300.99(0.98–0.99)
5–9110,10594110,537911.03(1.02–1.03)
10–1481,0956874,646611.12(1.11–1.12)
15–1959,7285142,992361.41(1.40–1.43)
20–2462,1295538,703351.59(1.58–1.60)
25–44187,8754997,051281.77(1.77–1.78)
45–4949,1556629,921451.49(1.48–1.50)
50–5970,8816239,245381.66(1.64–1.67)
60–6428,4496919,998541.29(1.28–1.31)
≥6550,9435545,155570.96(0.95–0.97)
Table 2. Crude scabies incidence rate (per 100,000 persons) by period and age group, and percentage changes between periods.
Age GroupPeriod 1 (2004–2012)Period 2 (2013–2017)Period 3 (2018–2024)% Change P1 to P2% Change P2 to P3
0–41301709531−44
5–9901237336−41
10–1463875038−42
15–1939593751−37
20–2440584145−28
25–4439513131−40
45–4950715243−28
50–5952654025−38
60–6462805129−36
≥6561694313−37
Table 3. Global Moran’s I statistics for age-standardized scabies incidence rates in Mexico across three periods defined by joinpoint regression analysis: Period 1 (2004–2012), Period 2 (2013–2017), and Period 3 (2018–2024).
PeriodMoran’s IndexVarianceZ-Scorep-ValueDistribution
1 (2004–2012)0.6324090.0119626.0771830.0000Clustered
2 (2013–2017)0.1881900.0165421.7140160.0865Random
3 (2018–2024)0.1121300.0171591.1022770.2703Random
Disclaimer/Publisher’s Note: The statements, opinions and data contained in all publications are solely those of the individual author(s) and contributor(s) and not of MDPI and/or the editor(s). MDPI and/or the editor(s) disclaim responsibility for any injury to people or property resulting from any ideas, methods, instructions or products referred to in the content.