


CO2 Emissions and Scenario Analysis of Transportation Sector Based on STIRPAT Model: A Case Study of Xuzhou in Northern Jiangsu

 ,
,  ,
, 
Abstract
1. Research Methodology and Data Sources
1.1. Research Methodology
1.1.1. Measurement of Carbon Dioxide Emissions
1.1.2. Scope and Definition of Decoupling
- Strong decoupling (ΔTC < 0, ΔGDP > 0, W < 0);
- Weak decoupling (ΔTC > 0, ΔGDP > 0, 0 ≤ W < 0.8);
- Expansive coupling (ΔTC > 0, ΔGDP > 0, 0.8 ≤ W < 1.2);
- Expansive negative decoupling (ΔTC > 0, ΔGDP > 0, W ≥ 1.2);
- Strong negative decoupling (ΔTC > 0, ΔGDP < 0, W < 0);
- Weak negative decoupling (ΔTC < 0, ΔGDP < 0, 0 ≤ W <0.8);
- Recessive coupling (ΔTC < 0, ΔGDP<0, 0.8 ≤ W < 1.2);
- Recessive decoupling (ΔTC < 0, ΔGDP < 0, W ≥ 1.2).
1.1.3. Establishment of STIRPAT Model
- Population dimension: Urbanization rate (C) and year-end total population (P) to represent population structure and scale;
- Economic dimension: GDP per capita (R) for economic development and tertiary industry share (D) for industrial structure;
- Technology dimension: Energy structure (Q) and carbon intensity (Z) to capture the impact of technological progress;
- Transportation dimension: Passenger turnover (K) and freight turnover (H) to quantify transportation demand.
1.1.4. Methodological Independence
1.2. Data Sources
2. Results and Discussion
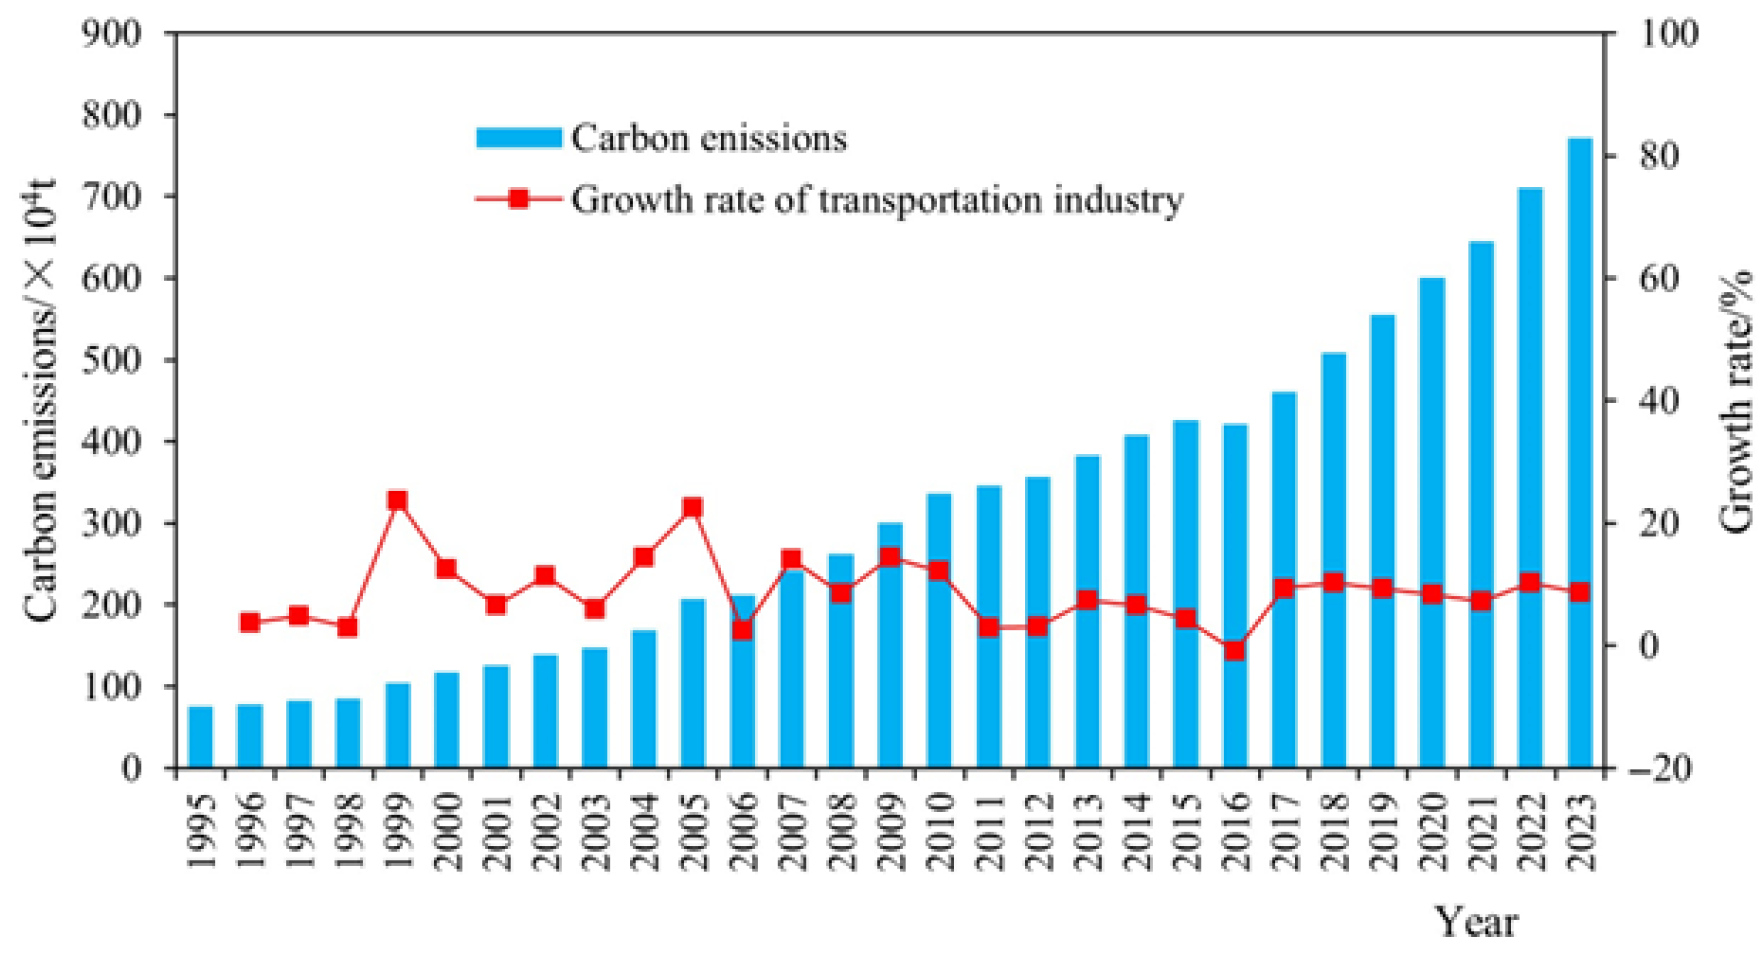
2.1. Carbon Emissions from the Transportation Sector
2.2. Decoupling Status from the Transportation Sector
- Stage I (1995–2000): Dominated by weak decoupling and expansive negative decoupling, this stage reflects an extensive mode of economic development. Economic growth was driven by the expansion of high-energy-consuming industries, which led to a continuous surge in transportation-related carbon emissions. In particular, from 1996–1997 and 1998–2000, the growth rate of transportation-related emissions far overtook GDP expansion, manifesting atypical environmental pressure dynamics;
- Stage II (2001–2012): Characterized by a mixed pattern of predominantly weak decoupling with some expansive coupling. Benefiting from the guidance of the “11th Five-Year Plan”, the industrial structure began shifting toward the tertiary sector. This stage achieved a model of relative decoupling, reflecting a more coordinated relationship between the environment and the economy;
- Stage III (2013–2023): Mainly featured expansive negative decoupling and weak decoupling, followed by strong decoupling and expansive coupling. This stage represents a transitional development mode, marked by diverse patterns in the interaction between the transportation sector and economic growth, shifting from coordinated development to extensive development, then to high-quality growth, and eventually reverting again to extensive development. The phase-wise progression highlights ongoing reforms in the urban economic system. These trends align with China’s national “dual carbon” strategy and echo Jiangsu Province’s and Xuzhou City’s policies on building a green, low-carbon, and circular economy.
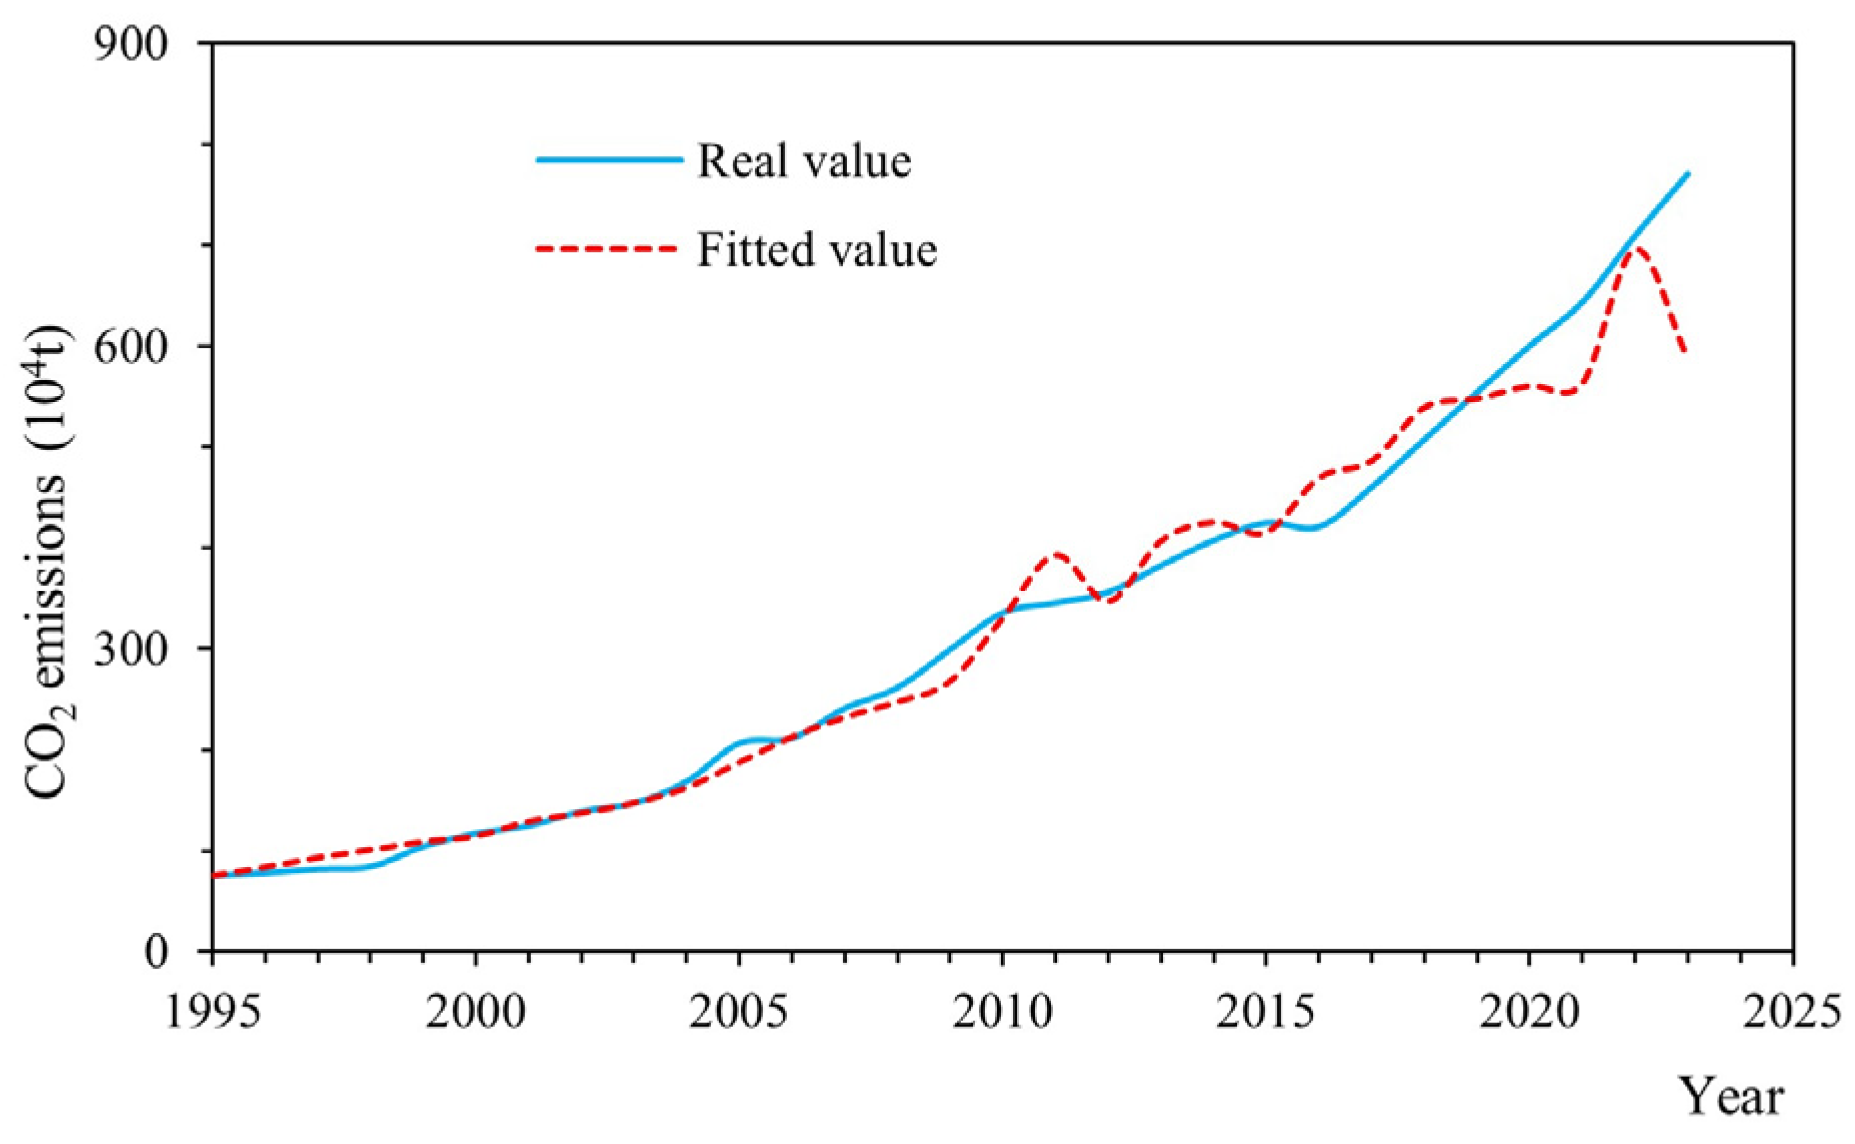
2.3. Carbon Emissions Forecasting Model for the Transportation Sector
2.4. Scenario Parameter Settings
- (1)
- Urbanization rate. In April 2021, the Xuzhou Municipal Government issued the Outline of the 14th Five-Year Plan for National Economic and Social Development of Xuzhou City and the Long-Range Objectives Through the Year 2035, which pointed out that, by 2025, the urbanization rate of Xuzhou will reach 73%, and the average annual growth rate of Xuzhou from 2022 to 2025 and 2026 to 2030 will be 2.0% and 1.5%, respectively [27]. Based on this, the growth rate of the urbanization rate in different periods is set at 2.0% in the period 2024–2025 and 1.5% in the period 2026–2030 under the baseline scenario, respectively, and the low-carbon and enhanced low-carbon scenarios are adjusted accordingly;
- (2)
- Population size. Li et al. found that the registered population of Xuzhou City in 2025, 2030, and 2035 will be 11.271 million, 11.843 million, and 12.4463 million, respectively [29]. Therefore, the growth rate of population size in the baseline scenario for different periods is set at 4.0% for the period 2024–2025 and 2.0% for the period 2026–2030, respectively;
- (3)
- GDP per capita. According to the “Xuzhou Sustainable Development Plan (2022–2030)”, the annual disposable income of urban residents in Xuzhou in 2030 will be CNY80,000. During the 14th Five-Year Plan, the 15th Five-Year Plan, and the 16th Five-Year Plan periods, the average annual GDP growth rate of key industries was about 5.5%, 5.0%, and 4.2%, respectively [30], and Wu Meng et al. pointed out that the average annual growth rate of Xuzhou’s per capita GDP in the two stages of 2022–2025 and 2026–2030 is 6.0% and 5.5% [27]. Therefore, the growth rate of per capita GDP in different periods is set at 6.0% in 2024–2025 and 5.5% in 2026–2030 under the baseline scenario, respectively, and the low-carbon and enhanced low-carbon scenarios are adjusted accordingly;
- (4)
- The proportion of the tertiary industry. According to the Outline of the 14th Five-Year Plan for National Economic and Social Development of Xuzhou City and the Long-Range Objectives Through the Year 2035, the output value of high-tech industries will account for 50% of the output value of industries above a designated size in 2025. Therefore, the growth rate of the proportion of the tertiary industry in different periods of the baseline scenario is set at 2.0% in the period 2024–2025 and 1.5% in the period 2026–2030, respectively, and the low-carbon and intensified low-carbon scenarios are adjusted accordingly;
- (5)
- Energy structure. The “14th Five-Year Plan” Comprehensive Work Plan for Energy Conservation and Emission Reduction and the Action Plan for Carbon Peaking Before 2030 put forward the goal of reducing energy consumption per unit of GDP by 13.5% by 2025 compared to 2020. At the same time, the Xuzhou Sustainable Development Plan (2022–2030) states that renewable energy will account for 25% of Xuzhou’s energy consumption by 2030. Therefore, the growth rate of the energy structure under the baseline scenario in different periods is set at −0.2% in the period 2024–2025 and −0.4% in the period 2026–2030, respectively, and the low-carbon and enhanced low-carbon scenarios are adjusted accordingly;
- (6)
- Carbon emission intensity. According to the white paper “China’s Policies and Actions to Address Climate Change”, China’s carbon dioxide emissions per unit of GDP will be reduced by more than 65% by 2030 compared with 2005. The “Xuzhou Sustainable Development Plan (2022–2030)” points out that carbon emissions per unit of GDP (t/CNY 10,000) will drop from 1.06 t/CNY 10,000 in 2021 to 0.5 t/CNY 10,000 in 2030. Therefore, the growth rate of the energy structure under the baseline scenario in different periods is set at −1.0% in the period 2024–2025 and −1.5% in the period 2026–2030, respectively, and the low-carbon and enhanced low-carbon scenarios are adjusted accordingly;
- (7)
- Passenger turnover and freight turnover. According to the 2023 Statistical Annual Report on National Economic and Social Development of Xuzhou City and the 2024 Statistical Annual Report on National Economic and Social Development of Xuzhou City, passenger turnover and freight turnover in 2024 will increase by 20.2% and 3.9%, respectively, compared to 2023. Therefore, the growth rates of passenger turnover and freight turnover in different periods are set at 13.5% and 2.4% in 2024–2025 and 4.0% and 1.5% in 2026–2030, respectively.
2.5. Scenario Analysis
- Policy regulation: It is recommended that government departments formulate a phased low-carbon development roadmap, set net-zero emission targets for the transportation sector, and promote green travel modes. Additionally, energy consumption intensity and carbon emission indicators should be incorporated into the performance evaluation system of transportation management departments and enterprises [26]. It is also necessary to establish and improve carbon tax policies and carbon emissions trading mechanisms;
- Energy consumption optimization: It is suggested to accelerate the application of clean energy, such as electricity and natural gas, in transportation vehicles, gradually replacing traditional oil-fueled vehicles. At the same time, increased investment in the research and development of new energy technologies in the transportation sector should be encouraged, along with the commercialization of research achievements [27,28];
- Optimization of the freight transport structure: It is recommended to develop high-tech solutions such as the Internet of Things (IoT) and artificial intelligence (AI) in transportation [31], promote green freight transport, integrate multiple channels, and push forward the “road-to-rail” strategy for bulk goods.
3. Conclusions
- (1)
- Xuzhou’s transportation sector’s CO2 emissions increased from 755,100 tons in 1995 to 7,711,900 tons in 2023, with an average annual growth rate of 8.39%. Among these, aviation and private cars are the primary sources of carbon emissions in Xuzhou’s transportation sector;
- (2)
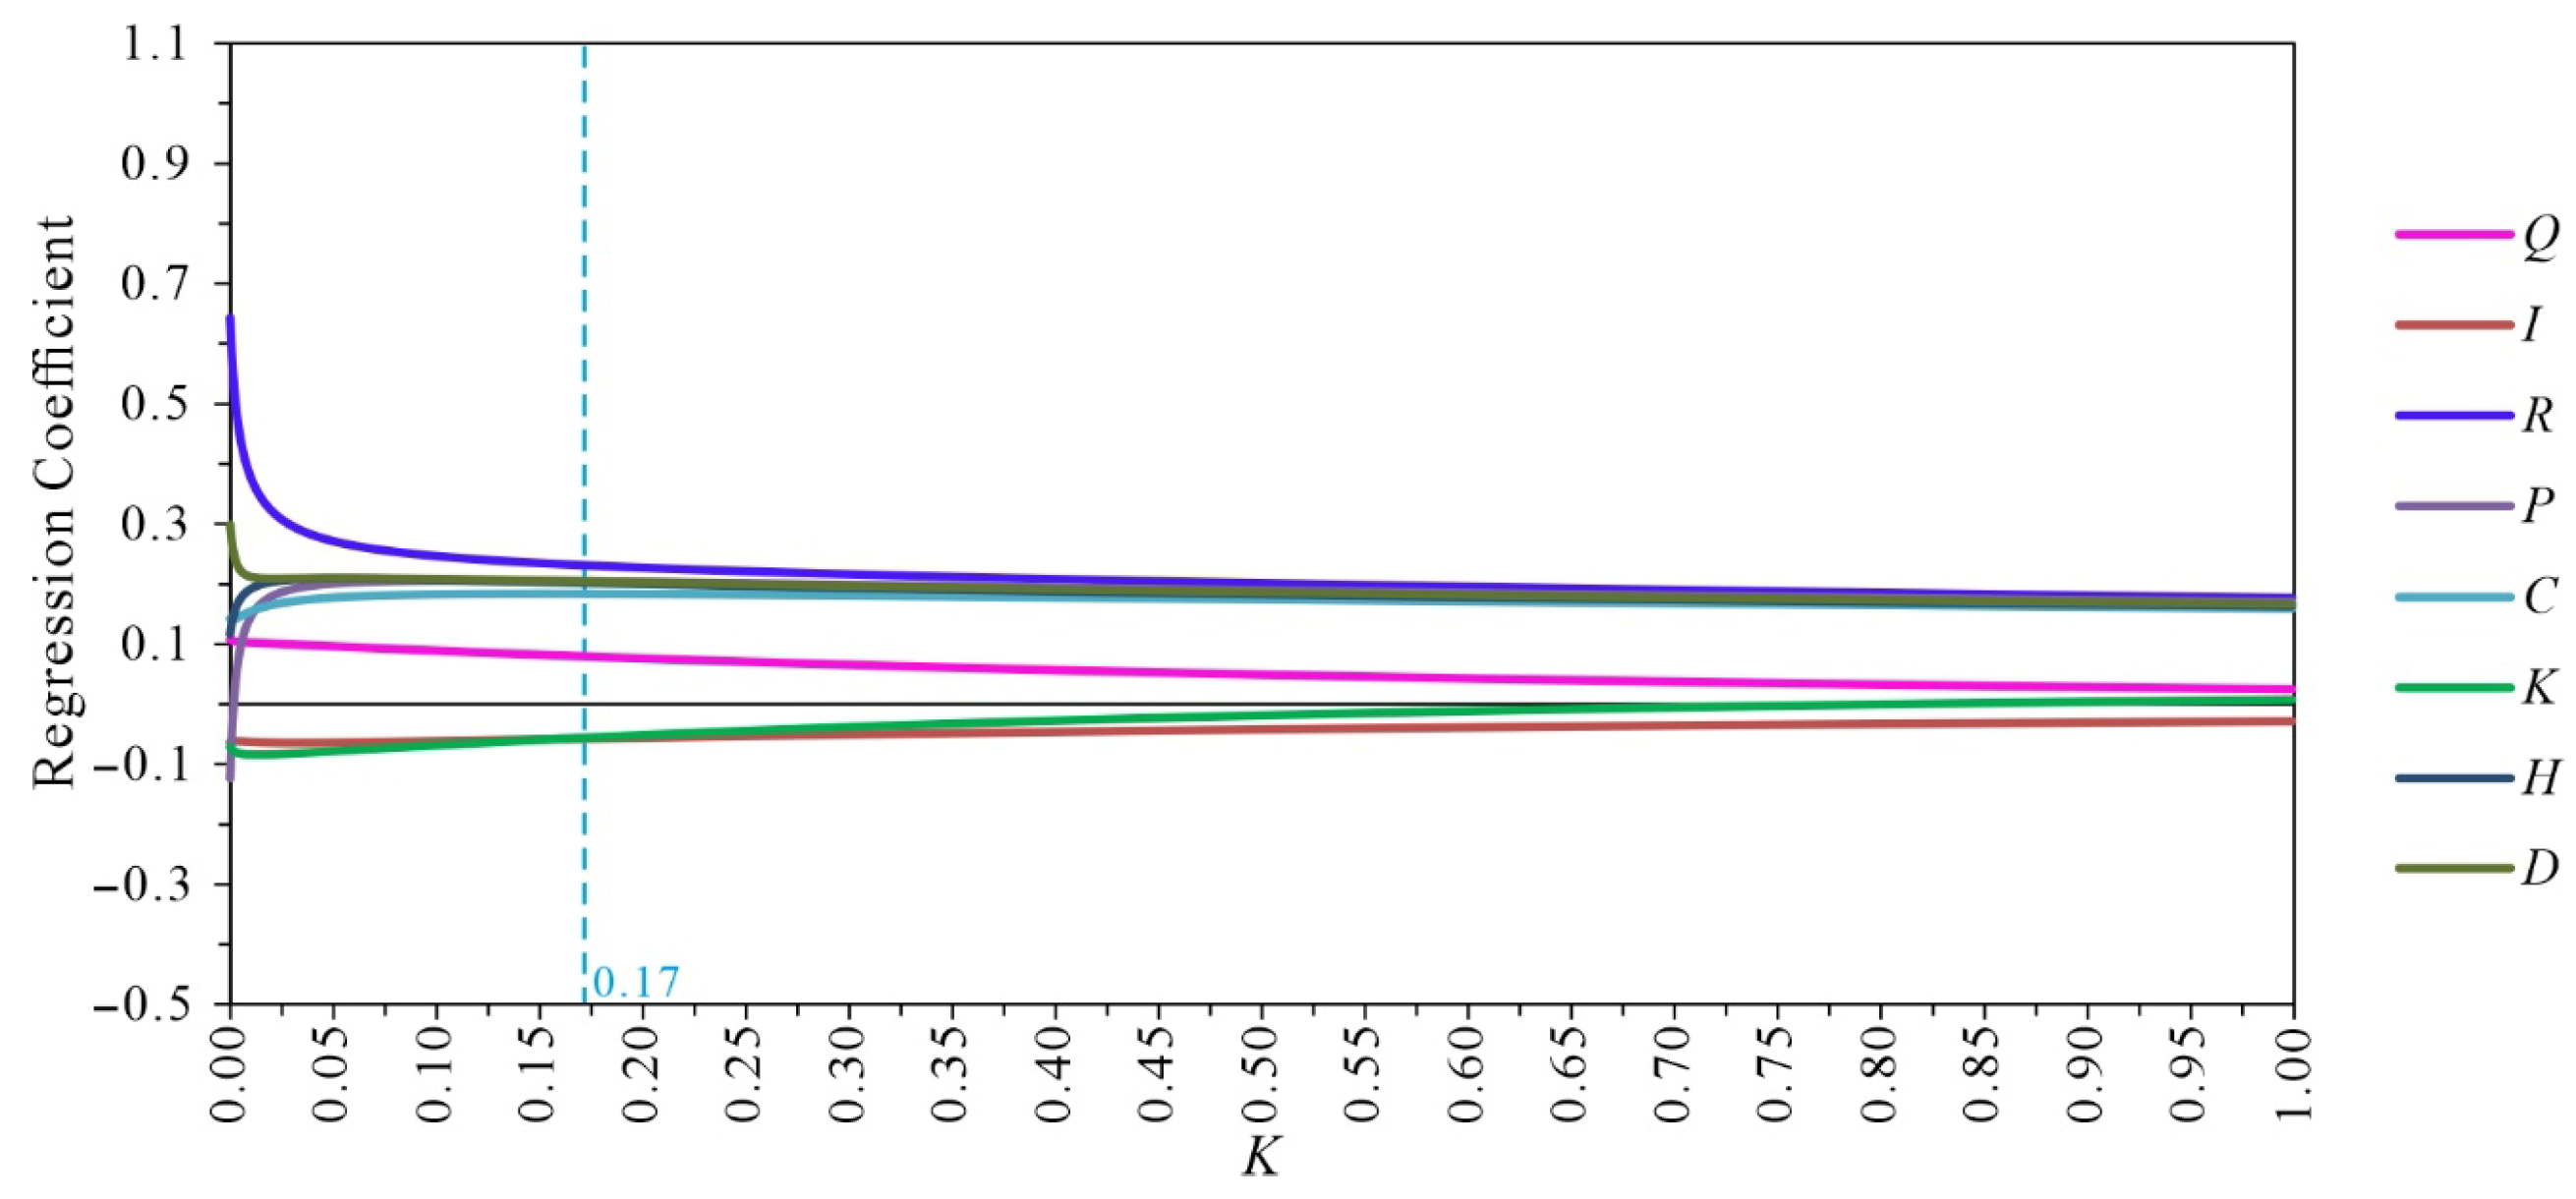
- Factors such as population size, urbanization rate, GDP per capita, the share of the tertiary industry, energy structure, and carbon intensity have a significant positive effect on the carbon emissions of Xuzhou’s transportation sector. In contrast, passenger turnover and freight turnover show significant negative moderating effects;
- (3)
- The decoupling relationship between transport-related carbon emissions and economic development in Xuzhou can be divided into three distinct stages: the first stage is characterized by weak decoupling and expansive negative decoupling, reflecting an extensive mode of economic development; the second stage is dominated by weak decoupling, with expansive coupling as a secondary feature, representing a phase of environmentally-coordinated economic development; the third stage is marked primarily by expansive negative decoupling and weak decoupling, followed by strong decoupling and expansive coupling, indicating a transitional economic development model;
- (4)
- Under the baseline, low-carbon, and enhanced low-carbon scenarios, by 2030, the CO2 emissions of the transportation industry in Xuzhou will be 10,154,700 tons, 9,072,500 tons, and 8,835,000 tons, respectively, and the CO2 emissions under the low-carbon scenario and the enhanced low-carbon scenario will be reduced by 10.66% and 13.00%, respectively. Carbon emission reductions in the transportation sector can be effectively achieved through a combination of policy tools, structural optimization projects, and enhanced technological innovation, thereby advancing the dual strategic goals of high-quality economic development and improved eco-environmental quality.
Author Contributions
Funding
Institutional Review Board Statement
Informed Consent Statement
Data Availability Statement
Conflicts of Interest
References
- Wang, H.R.; Feng, X.J.; Shen, J.X.; Zhang, Y.; Wang, H.P. Prediction on peak value of carbon emission from the Jiangsu transportation industry based on SVR model. Environ. Sci. Technol. 2022, 35, 58–63. (In Chinese) [Google Scholar]
- Lu, Y.Q.; Fan, T.Z.; Zhang, J.N. Spatiotemporal characteristics and influencing factors of China’s transport sector carbon emissions efficiency. Ecol. Econ. 2023, 39, 13–22. (In Chinese) [Google Scholar]
- Wang, J.T.; Ma, X.M. Influencing factors of carbon emissions from transportation in China: Empirical analysis based on two-level econometrics method. Acta Sci. Nat. Univ. Pekin. 2021, 57, 1133–1142. (In Chinese) [Google Scholar]
- Tian, P.N.; Mao, B.H.; Tong, R.Y.; Zhang, H.X.; Zhou, Q. Analysis of carbon emission level and intensity of China’s transportation industry and different transportation modes. Adv. Clim. Change Res. 2023, 19, 347–356. (In Chinese) [Google Scholar]
- Cheng, J.H. Decomposition of carbon cap target at provincial level in China: A case study of Zhejiang. China Popul. Resour. Environ. 2016, 26, 23–30. (In Chinese) [Google Scholar]
- Hu, X.W.; Guo, W. Measurement of spatial conflict of urban traffic ecosystem and an analysis of its influencing factors. Ecol. Econ. 2022, 38, 108–114. (In Chinese) [Google Scholar]
- Lin, B.; Benjamin, N.I. Influencing factors on carbon emissions in China transport industry: A new evidence from quantile regression analysis. J. Clean. Prod. 2017, 150, 175–187. [Google Scholar] [CrossRef]
- Talbi, B. CO2 emissions reduction in road transport sector in Tunisia. Renew. Sustain. Energy Rev. 2017, 69, 175–187. [Google Scholar] [CrossRef]
- Xu, B.; Lin, B. Investigating the differences in CO2 emissions in the transport sector across Chinese provinces: Evidence from a quantile regression model. J. Clean. Prod. 2018, 175, 109–122. [Google Scholar] [CrossRef]
- Gao, B.; Xu, Q.T.; Li, Y.B.; He, H. Calculation and driving factors analysis of carbon emissions from traffic and transportation energy consumption in Jilin province. Econ. Geogr. 2013, 33, 25–30. (In Chinese) [Google Scholar]
- Wang, L.; Ouyang, H.; Ma, Y.H. Re-understanding of the impact of economic and social development on the environment: Analysis of urban carbon emissions based on the IPAT model. Macroeconomics 2017, 10, 161–168. (In Chinese) [Google Scholar]
- Lv, Q.; Gao, J.L. Analysis of traffic and transportation carbon emissions model and driving factors in Beijing-Tianjin-Hebei region. Ecol. Econ. 2018, 34, 31–36. (In Chinese) [Google Scholar]
- Wang, L.X.; Li, Z.; He, J.C.; Ma, Q.Q. Influencing factors of transportation carbon emissions in Shaanxi province based on STIRPAT model. Transp. Res. 2022, 8, 98–107. (In Chinese) [Google Scholar]
- Hu, M.F.; Zheng, Y.B.; Li, Y.H. Forecasting of transport carbon emission peak in Hubei Province under multiple scenarios. Acta Sci. Circumstantiae 2022, 42, 464–472. (In Chinese) [Google Scholar]
- Chris, G. How to Live a Low-Carbon Live: The Individual’s Guide to Stopping Climate Change; Routledge: London, UK, 2007. [Google Scholar]
- Chen, H.D.; Lu, W.; Wang, X.J. The calculation of carbon emissions and analysis on reduction strategies of Xuzhou city. For. Econ. 2012, 64–69, 78. (In Chinese) [Google Scholar]
- Yu, Y.; Jin, Z.X.; Li, J.Z.; Li, J. Low-carbon development path research on China’s power industry based on synergistic emission reduction between CO2 and air pollutants. J. Clean. Prod. 2020, 275, 123097. [Google Scholar] [CrossRef]
- Sun, R. Improvement and application of Tapio decoupling index measurement method. Technol. Econ. Manag. Res. 2014, 8, 7–11. [Google Scholar]
- Jie, L.; Wang, Z.; Yu, R.X. Scenario simulation of carbon decoupling effect of China’s energy mining industry. China Popul. Resour. Environ. 2020, 30, 47–56. (In Chinese) [Google Scholar]
- Ehrlich, P.R.; Holdren, J.P. Impact of Population Growth. Science 1971, 171, 1212–1217. [Google Scholar] [CrossRef] [PubMed]
- York, R.; Rosa, E.A.; Dietz, T. STIRPAT, IPAT and ImPACT: Analytic tools for unpacking the driving forces of environmental impacts. Ecol. Econ. 2003, 46, 351–365. [Google Scholar] [CrossRef]
- Han, Y.L.; Liu, Y.P. Study on influencing factors of industrial carbon emission in Jiangsu province based on LMDI model. Environ. Sci. Technol. 2018, 41, 278–284. (In Chinese) [Google Scholar]
- Lu, J.Q.; Gan, X.H. Temporal-spatial differentiation and emission reduction strategy of Jiangsu’s industrial carbon emission. Resour. Ind. 2022, 24, 150–156. (In Chinese) [Google Scholar]
- Zhang, Z.B.; Xie, J.P.; Ma, J.L. Development status and demand forecast of highway traffic in Xuzhou, Jiangsu Province. J. Jiangsu Norm. Univ. (Nat. Sci. Ed.) 2016, 34, 51–54. (In Chinese) [Google Scholar]
- Wu, H. Influencing Mechanism of Traffic Development on Spatial Evolution of Xuzhou city. Master’s Thesis, Jiangsu Normal University, Xuzhou, China, 2017. (In Chinese). [Google Scholar]
- Liu, C.S.; Qu, J.S.; Ge, Y.J.; Tang, J.X.; Gao, X.Y.; Liu, L.N. LSTM model-based prediction of carbon emissions from China’s transportation sector. China Environ. Sci. 2023, 43, 2574–2582. (In Chinese) [Google Scholar]
- Wu, M.; Qin, Y.H.; Wang, S.M.; Song, X.J.; Ma, P.; Cao, B.; Feng, L.L. Energy carbon emissions and scenario analysis of industrial enterprises above designated size: A case study of Xuzhou City in the Huaihai economic zone. Coal Geol. China 2023, 35, 59–64. (In Chinese) [Google Scholar]
- Rong, W.W. Research of analysis and countermeasures of ecological civilization construction in Jiangsu province. Environ. Sci. Technol. 2018, 31, 73–78. (In Chinese) [Google Scholar]
- Li, Z.P.; Ou, X.J.; Zhou, B.B.; Qian, J.L.; Ou, Y.G. Characteristics of Xuzhou population development and its projiction. J. Jiangsu Norm. Univ. (Nat. Sci. Ed.) 2021, 39, 21–25. (In Chinese) [Google Scholar]
- Yan, G.; Zheng, Y.X.; Wang, X.S.; Li, B.; He, J.; Shao, Z.Q.; Li, Y.L.; Wu, L.X.; Ding, Y.; Xu, W.; et al. Pathway for Caibon Dioxide Peaking in China Based on Sectoral Analysis. Res. Environ. Sci. 2022, 35, 309–319. (In Chinese) [Google Scholar]
- Zhou, H.X. Research on Traffic Information Collection and Processing Methods Internet of Vehicles. Ph.D. Thesis, Jilin University, Changchun, China, 2013. (In Chinese). [Google Scholar]


| Year | ΔTC/% | ΔGDP | w | Decoupling Relationship |
|---|---|---|---|---|
| 1995–1996 | 3.699 | 20.964 | 0.176 | Weak decoupling |
| 1996–1997 | 4.751 | 3.316 | 1.433 | Expansionary negative decoupling |
| 1997–1998 | 2.976 | 6.453 | 0.461 | Weak decoupling |
| 1998–1999 | 23.643 | 7.514 | 3.147 | Expansionary negative decoupling |
| 1999–2000 | 12.401 | 6.793 | 1.826 | Expansionary negative decoupling |
| 2000–2001 | 6.561 | 10.579 | 0.620 | Weak decoupling |
| 2001–2002 | 11.292 | 9.956 | 1.134 | Expansionary connectivity |
| 2002–2003 | 5.987 | 13.735 | 0.436 | Weak decoupling |
| 2003–2004 | 14.440 | 21.971 | 0.657 | Weak decoupling |
| 2004–2005 | 22.515 | 18.966 | 1.187 | Expansionary connectivity |
| 2005–2006 | 2.382 | 19.365 | 0.123 | Weak decoupling |
| 2006–2007 | 13.981 | 19.417 | 0.720 | Weak decoupling |
| 2007–2008 | 8.506 | 21.044 | 0.404 | Weak decoupling |
| 2008–2009 | 14.417 | 13.068 | 1.103 | Expansionary connectivity |
| 2009–2010 | 12.192 | 22.339 | 0.546 | Weak decoupling |
| 2010–2011 | 2.883 | 20.716 | 0.139 | Weak decoupling |
| 2011–2012 | 3.087 | 13.090 | 0.236 | Weak decoupling |
| 2012–2013 | 7.400 | 12.529 | 0.591 | Weak decoupling |
| 2013–2014 | 6.518 | 9.825 | 0.663 | Weak decoupling |
| 2014–2015 | 4.261 | 7.171 | 0.594 | Weak decoupling |
| 2015–2016 | −0.918 | 8.864 | −0.104 | Strong decoupling |
| 2016–2017 | 9.355 | 9.014 | 1.038 | Expansionary connectivity |
| 2017–2018 | 10.207 | 5.950 | 1.715 | Expansionary negative decoupling |
| 2018–2019 | 9.237 | 5.111 | 1.807 | Expansionary negative decoupling |
| 2019–2020 | 8.288 | 3.777 | 2.194 | Expansionary negative decoupling |
| 2020–2021 | 7.233 | 10.897 | 0.664 | Weak decoupling |
| 2021–2022 | 10.206 | 3.633 | 2.809 | Expansionary negative decoupling |
| 2022–2023 | 8.619 | 5.802 | 1.486 | Expansionary negative decoupling |
| Year | Q | Z | R | P | C | K | H | D | TC |
|---|---|---|---|---|---|---|---|---|---|
| 1995 | 4.459 | 0.938 | 8.468 | 6.747 | 2.986 | 4.730 | 6.116 | 3.381 | 4.324 |
| 1996 | 4.454 | 0.737 | 8.649 | 6.756 | 3.020 | 4.833 | 6.076 | 3.420 | 4.361 |
| 1997 | 4.467 | 0.701 | 8.673 | 6.765 | 3.045 | 4.762 | 6.044 | 3.473 | 4.407 |
| 1998 | 4.465 | 0.617 | 8.726 | 6.775 | 3.068 | 4.722 | 6.075 | 3.492 | 4.436 |
| 1999 | 4.491 | 0.725 | 8.792 | 6.777 | 3.091 | 4.687 | 6.119 | 3.512 | 4.649 |
| 2000 | 4.442 | 0.744 | 8.846 | 6.798 | 3.250 | 4.824 | 6.243 | 3.548 | 4.765 |
| 2001 | 4.473 | 0.701 | 8.933 | 6.804 | 3.285 | 4.849 | 6.278 | 3.566 | 4.829 |
| 2002 | 4.496 | 0.731 | 9.024 | 6.807 | 3.321 | 4.883 | 6.299 | 3.562 | 4.936 |
| 2003 | 4.492 | 0.729 | 9.149 | 6.812 | 3.444 | 4.809 | 6.340 | 3.554 | 4.994 |
| 2004 | 4.493 | 0.563 | 9.367 | 6.821 | 3.497 | 4.966 | 6.444 | 3.543 | 5.129 |
| 2005 | 4.511 | 0.520 | 9.545 | 6.830 | 3.529 | 4.511 | 6.305 | 3.558 | 5.332 |
| 2006 | 4.496 | 0.351 | 9.729 | 6.840 | 3.535 | 4.588 | 6.670 | 3.562 | 5.356 |
| 2007 | 4.498 | 0.303 | 9.912 | 6.847 | 3.538 | 4.732 | 6.824 | 3.582 | 5.486 |
| 2008 | 4.496 | 0.196 | 10.107 | 6.853 | 3.572 | 5.244 | 7.001 | 3.606 | 5.568 |
| 2009 | 4.505 | 0.256 | 10.232 | 6.864 | 3.676 | 5.333 | 7.030 | 3.613 | 5.703 |
| 2010 | 4.501 | 0.843 | 10.440 | 6.880 | 3.824 | 5.531 | 7.923 | 3.698 | 5.818 |
| 2011 | 4.467 | 0.726 | 10.633 | 6.884 | 4.159 | 5.367 | 8.074 | 3.718 | 5.846 |
| 2012 | 4.437 | 0.643 | 10.755 | 6.898 | 4.206 | 5.372 | 7.318 | 3.716 | 5.877 |
| 2013 | 4.437 | 0.586 | 10.870 | 6.915 | 4.271 | 5.191 | 7.387 | 3.761 | 5.948 |
| 2014 | 4.520 | 1.165 | 10.956 | 6.931 | 4.277 | 5.731 | 7.387 | 3.799 | 6.011 |
| 2015 | 4.450 | 0.620 | 11.017 | 6.936 | 4.059 | 5.286 | 7.173 | 3.821 | 6.053 |
| 2016 | 4.413 | 0.474 | 11.094 | 6.948 | 4.072 | 5.272 | 7.587 | 3.858 | 6.044 |
| 2017 | 4.410 | 0.528 | 11.169 | 6.946 | 4.084 | 5.214 | 7.640 | 3.884 | 6.133 |
| 2018 | 4.441 | 0.687 | 11.218 | 6.952 | 4.104 | 5.181 | 7.771 | 3.913 | 6.230 |
| 2019 | 4.444 | 0.785 | 11.264 | 6.949 | 4.114 | 5.168 | 7.887 | 3.914 | 6.319 |
| 2020 | 4.441 | 0.804 | 11.298 | 6.945 | 4.132 | 4.970 | 7.903 | 3.915 | 6.398 |
| 2021 | 4.433 | 0.901 | 11.401 | 6.943 | 4.137 | 4.670 | 7.902 | 3.898 | 6.468 |
| 2022 | 4.538 | 0.781 | 11.309 | 6.939 | 4.140 | 4.505 | 7.941 | 3.893 | 6.565 |
| 2023 | 4.442 | 0.716 | 11.367 | 6.937 | 4.146 | 5.024 | 8.048 | 3.925 | 6.648 |
| Factors | Unstandardized Coefficient | Standard Error | t-Statistic | p-Value | VIF |
|---|---|---|---|---|---|
| Constant term | −23.546 | 2.865 | −8.218 | 0.000 *** | - |
| Q | 1.765 | 0.535 | 3.297 | 0.004 *** | 0.080 |
| Z | −0.202 | 0.083 | −2.441 | 0.024 ** | −0.058 |
| R | 0.161 | 0.01 | 16.005 | 0.000 *** | 0.232 |
| P | 2.136 | 0.167 | 12.772 | 0.000 *** | 0.204 |
| C | 0.299 | 0.041 | 7.243 | 0.000 *** | 0.184 |
| K | −0.128 | 0.059 | −2.186 | 0.041 ** | −0.056 |
| H | 0.198 | 0.028 | 6.991 | 0.000 *** | 0.202 |
| D | 0.863 | 0.093 | 9.301 | 0.000 *** | 0.204 |
| R2 | 0.985 | ||||
| F | F(8, 20) = 160.703, p = 0.000 | ||||
| Year | Scenario | Rate Setting of Various Influencing Factors/% | |||||||
|---|---|---|---|---|---|---|---|---|---|
| Urbanization Rate | Total Population at the End of Each Year | Per Capita GDP | Proportion of Tertiary Industry | Energy Consumption Structure | Carbon Emission Intensity | Passenger Turnover | Cargo Turnover | ||
| 2024–2025 | BEN | 2.0 | 4.0 | 6.0 | 2.0 | −0.2 | −4.0 | 13.5 | 2.4 |
| LN | 1.8 | 3.0 | 4.0 | 2.5 | −0.4 | −5.0 | 10.0 | 2.0 | |
| SL | 1.5 | 2.5 | 2.5 | 3.0 | −0.6 | −8.0 | 8.0 | 1.8 | |
| 2026–2030 | BEN | 1.5 | 2.0 | 5.5 | 1.5 | −0.4 | −3.5 | 4.0 | 1.5 |
| LN | 1.2 | 1.5 | 3.5 | 2.0 | −0.8 | −4.0 | 3.0 | 1.4 | |
| SL | 1.0 | 1.2 | 2.0 | 2.5 | −1.0 | −6.0 | 2.0 | 1.2 | |
Disclaimer/Publisher’s Note: The statements, opinions and data contained in all publications are solely those of the individual author(s) and contributor(s) and not of MDPI and/or the editor(s). MDPI and/or the editor(s) disclaim responsibility for any injury to people or property resulting from any ideas, methods, instructions or products referred to in the content. |
© 2025 by the authors. Licensee MDPI, Basel, Switzerland. This article is an open access article distributed under the terms and conditions of the Creative Commons Attribution (CC BY) license (https://creativecommons.org/licenses/by/4.0/).
Share and Cite
He, J.; Wu, M.; Cao, W.; Wang, W.; Sun, P.; Luo, B.; Song, X.; Peng, Z.; Zhang, X. CO2 Emissions and Scenario Analysis of Transportation Sector Based on STIRPAT Model: A Case Study of Xuzhou in Northern Jiangsu. Eng 2025, 6, 175. https://doi.org/10.3390/eng6080175
He J, Wu M, Cao W, Wang W, Sun P, Luo B, Song X, Peng Z, Zhang X. CO2 Emissions and Scenario Analysis of Transportation Sector Based on STIRPAT Model: A Case Study of Xuzhou in Northern Jiangsu. Eng. 2025; 6(8):175. https://doi.org/10.3390/eng6080175
Chicago/Turabian StyleHe, Jinxian, Meng Wu, Wenjie Cao, Wenqiang Wang, Peilin Sun, Bin Luo, Xuejuan Song, Zhiwei Peng, and Xiaoli Zhang. 2025. "CO2 Emissions and Scenario Analysis of Transportation Sector Based on STIRPAT Model: A Case Study of Xuzhou in Northern Jiangsu" Eng 6, no. 8: 175. https://doi.org/10.3390/eng6080175
APA StyleHe, J., Wu, M., Cao, W., Wang, W., Sun, P., Luo, B., Song, X., Peng, Z., & Zhang, X. (2025). CO2 Emissions and Scenario Analysis of Transportation Sector Based on STIRPAT Model: A Case Study of Xuzhou in Northern Jiangsu. Eng, 6(8), 175. https://doi.org/10.3390/eng6080175