1. Introduction
Sudden contractions in pipes are a major source of pressure drop, and therefore a source of entropy generation, in almost all pipework of industrial installations and in heat transfer devices like heat exchangers. Even though a sudden contraction is not desirable in standard designs, it is often chosen due to its low manufacturing costs and simplicity. Many fluid mechanics studies have been performed on sudden pipe contractions to determine the pressure drop across the contraction. However, these investigations usually do not specify which part of the sudden contraction causes the major drop.
Astaria and Greco [
1] reviewed data on excess pressure drop in laminar flow through sudden pipe contractions. The data were limited to a contraction area ratio of β = 0.1667 and the laminar flow regime. Later, Sylvester and Rosen [
2] conducted an experiment on pipe contraction with β = 0.0156 and laminar flow for Newtonian fluids. They concluded that the non-dimensional pressure loss is a function of the Reynolds number (Re) and the contraction area ratio β. Durst and Loy [
3] have conducted an experimental investigation on a pipe contraction with β = 0.285 and the laminar flow regime, with Reynolds number (Re), based on the large diameter, ranging between 23 and 1213. Their experimental work using the Lazer Doppler Anemometer (LDA) technique provided a detailed view of the flow field. They analyzed the features of the re-circulation zone in the concave corner of the contraction (large pipe) as well as the re-circulation zone starting at the convex corner (small pipe). They reported detailed velocity profiles across the contraction. They also conducted numerical investigations on a contraction with β = 0.0156. Their numerical predictions of the pressure loss agreed well with the experimental results of Sylvester and Rosen [
2].
Other works have reported experimental and numerical results for the turbulent flow regime. Bullen et al. [
4] conducted experiments to measure the losses at various Reynolds numbers ranging from 4 × 10
4 to 2 × 10
5 for contraction area ratios from 0.13 to 0.7. They found that their results differed by as much as 25% in comparison to published results. No laminar flow data were given in this study. Hussein compiled all the results of this study in his PhD thesis [
5].
Ajayi et al. [
6] conducted a full experimental investigation on the flow field around pipe contraction for an area ratio of 4 for Reynolds numbers between 3400 and 10,000. They used the LDA system to capture the velocity field and took wall pressure measurements near the contraction. They found that the flow characteristics are affected by the Reynolds number in the range they studied. They also found that high turbulence levels are responsible for the smaller recirculation zone near the vena contracta at high Reynolds numbers. They also used a k-ε turbulence model to simulate the flow field numerically and compared it to their findings. The full details of the study can be found in Ajayi [
7].
Bashir et al. [
8] investigated the influence of inlet contraction ratios on the heat transfer and pressure drop characteristics of single-phase flow in smooth circular tubes in the transitional flow regime where the Reynolds numbers ranged from 1000 to 6000. They concluded that the flow characteristics and dynamics are highly affected by the contraction ratio, especially at high heat fluxes.
The method of entropy generation was introduced in the last 30 years and has been documented by Bejan [
9]. The method was used by Biyikoglu [
10] to investigate the flow around a pipe contraction. The paper presented numerical simulations of laminar flow around the pipe contraction and presented axial and radial variations of the total entropy generation. The paper did not discuss the component of entropy generation due to shear stresses and normal stresses. No estimates of the pressure loss coefficient due to the contraction were given.
The entropy generation method was recently used by Barnoon et al. [
11] to investigate MHD mixed convection in a lid-driven cavity using the two-phase mixture model. Al-Kouz et al. [
12] investigated the heat transfer for the hybrid nanofluid in a trapezoidal wavy enclosure containing porous media. Ibrahim et al. [
13] used a two-phase model to investigate the heat transfer and entropy generation in a microtube carrying a water-based magnetite nanofluid.
It is worth noting that the data regarding the pressure loss coefficient for turbulent flow, reported in fluid mechanics textbooks as well as engineering handbooks, varies across different sources, as indicated by Fox and McDonald [
14]. It is also evident that this pressure loss is a function of the contraction area ratio as well as the Reynolds number. Even though it is well known that a sudden contraction results in significant pressure loss, it is not clear which part of the contraction generates the majority of the loss. It is hoped that the analysis of the entropy generation field will help answer this question.
Pipe contraction is a prominent feature in fluid flow and heat transfer devices. The energy losses in contractions are large, especially in oil flows, petrochemical flows, polymer flows, and microfluidic devices. The entropy generation field across the contraction should enable us to find the critical areas where major losses are produced. This key information may help us to reduce these losses effectively with the least changes in the contraction geometry and hence with minimum costs.
The flow field in a sudden contraction is in general three-dimensional and at best two-dimensional if we assume axisymmetric conditions. This renders a closed form solution of the flow field extremely difficult and, in most cases, impossible with the present mathematical tools. Therefore, a numerical solution is required to solve the flow field. Once the flow field is known, the entropy generation can be computed.
This study focuses on single-phase flow, but the need for pressure loss in multiphase flow in bends, contractions, and fittings is also highly needed for designing petrochemical installations and plants. Der and Bertola [
15] carried out an experimental investigation of oil–water flow in a serpentine channel. The study used high-speed photography and focused on finding the flow pattern and mixing of water and oil in the channel. They found that the serpentine channel enhances the oil–water mixing in comparison to a straight channel. Another important work by Lyu and Huang [
16] developed a flow loop and carried out experiments on the flow of water-heavy oil mixtures. This investigation is important for the transport of heavy oil blended with water in a large portion of oil wells, especially towards the end of the well life. In addition to establishing the flow maps at different temperatures ranging from 20 to 60 °C, they have carried out pressure drop measurements in horizontal pipes for different high-water contents ranging from 70 to 90%. The study also investigated the wax deposition in the pipes.
It is clear from the latest literature search and review of major published work that very little data related to energy losses due to abrupt contraction are available. Most of the data deals with turbulent flow conditions under high Reynolds numbers for abrupt contractions. These data are published in Fluid Mechanics textbooks. Data for loss coefficient under laminar flow conditions is very rare (only two or three sources were found).
The general objective of this study is to investigate the flow in pipe contractions for a large range of Reynolds numbers, covering both laminar and turbulent regimes. Another equally important objective is to investigate the effectiveness of introducing rounded contractions in reducing sharp contraction losses.
The unique contribution of this study is to investigate the effect of rounding radius on the pressure loss for both laminar and turbulent regimes. This objective was achieved as follows:
- -
Solve the flow field using accurate numerical method for the sharp contraction;
- -
Determine the local entropy generation to find out the real cause and location of the pressure loss using the detailed flow field;
- -
Determine the pressure loss coefficient by using the integral energy equation;
- -
Validate the results using the available data available in the open literature;
- -
Solve the flow field using accurate numerical method for rounded contraction;
- -
Carry out a parametric investigation to determine the effect of Reynolds number (Re), the effect of Contraction ration (D1/D2) and the effect of rounding radius ratio (r/D2) on the nondimensional pressure loss coefficient.
Results from a differential analysis will be compared to those obtained from an integral analysis. Knowledge of the entropy generation field should help us identify the main sources of loss and thus develop a cost-effective method to reduce entropy generation and therefore increase the energy efficiency of devices containing sudden contractions.
The definition of the problem is considered, and the mathematical modeling will be presented in
Section 2. In the same section, we will introduce both the differential and integral approaches of the entropy generation method. The numerical method of solutions will also be introduced. In
Section 3, we will present the results and discuss them. We will first present the entropy generation fields and then examine the integrated results. We will also present the findings on introducing rounded contractions as a remedy for reducing the losses. The paper then concludes with summarizing remarks.
3. Results and Discussion
The solution to the problem has been carried out by CFD software (Version 10) [
20]. The entropy generation calculation is achieved by user-defined functions. The working fluid considered is engine oil, whose thermophysical properties are given in
Table 1. The CFD software employed uses the finite volume technique, which is well documented in the literature [
18,
19]. The computational domain contraction for symmetry reasons. The most refined grid M4 was constructed out of a structured mesh with 100 × 200 (r-z) intervals in the large pipe section and 50 × 200 (r-z) intervals in the smaller diameter section. This fine grid was determined after a grid independence study that ensured less than 2% change in the entropy generation for finer grids, as shown in
Table 2. To capture the boundary layer, finer spacing was placed close to the walls of the domain, using a successive ratio technique.
It is assumed that flow is isothermal and the properties are constant. These properties have been taken from the Ansys Fluent database at a reference temperature of 20 °C. The high-viscosity fluid (engine oil) was used for the laminar flow cases, and the low-viscosity fluid (water) was used for the turbulent flow cases. The high-viscosity fluids cover many fluid transport applications in petrochemical plants and oil transport in pipelines. Water also is a very common application in heat exchangers, power plants, and petrochemical plants. Since the results were given in non-dimensional form namely the non-dimensional pressure loss coefficient K as a function of the Reynolds number. Any other fluid, or the same fluids (oil and water) at different temperatures, can be used to get the non-dimensional pressure loss as the Reynolds number Re.
The grid-independent study used four (4) different grids (M1, M2, M3, and M4). We have used the entropy generation as a metric to compare the four grids. This metric involves the velocities and their gradients integrated over the entire computational domain. We believe this is a good metric to evaluate the grid independence as it uses the variable values and their gradients. Since we have seen an error jump in grid M3, we have used grid M4 for the rest of our calculations.
Grid refinement and adaptation were used in all grids including grid M4 near the contraction walls, in order to resolve the flow details around the contraction and be able to capture the vena contracta region accurately. Grid M4 is shown in
Figure 3 below.
To refine the results of grid M4, we compared the plug flow with the fully developed laminar flow at the inlet in order to account only for the contraction losses. The development of flow from plug to fully developed will cause entropy generation as well. To resolve the issue, we have imposed a fully developed flow profile at the inlet, as shown in
Figure 1. The resulting difference between the plug flow and fully developed flow is shown in
Table 3 below. The third order MUSCL (the highest discretization order available in Ansys Fluent), has been used for few cases, and the difference in the integrated entropy generation was less than 0.2%. It took longer to converge; hence we adopted the refined mesh M4 and 2nd order discretization.
As we can see, the fully developed inlet with the finest mesh M4 and 2nd Order upwind discretization resulted in the best agreement with the integral method; it was therefore adopted for the calculation of all Reynolds numbers studied. The same procedure gave best results when we compared the velocity profiles based on experimental study discussed in the next section.
3.1. Flow Field Characteristics in Relation to Entropy Generation
The correct prediction of the entropy generation depends strongly on the correct prediction of the flow field variables and their gradients as indicated by Equation (5). Hence it is very essential to validate the current computations against reliable experimental data. Durst and Loy [
3] have used an accurate multicomponent LDA system with an effective measuring control volume of 200 μm. In order to validate the present CFD software, the case of Re
1 = 372 (Re
2 = 704) was taken. The exact experimental geometry was used for numerical simulation.
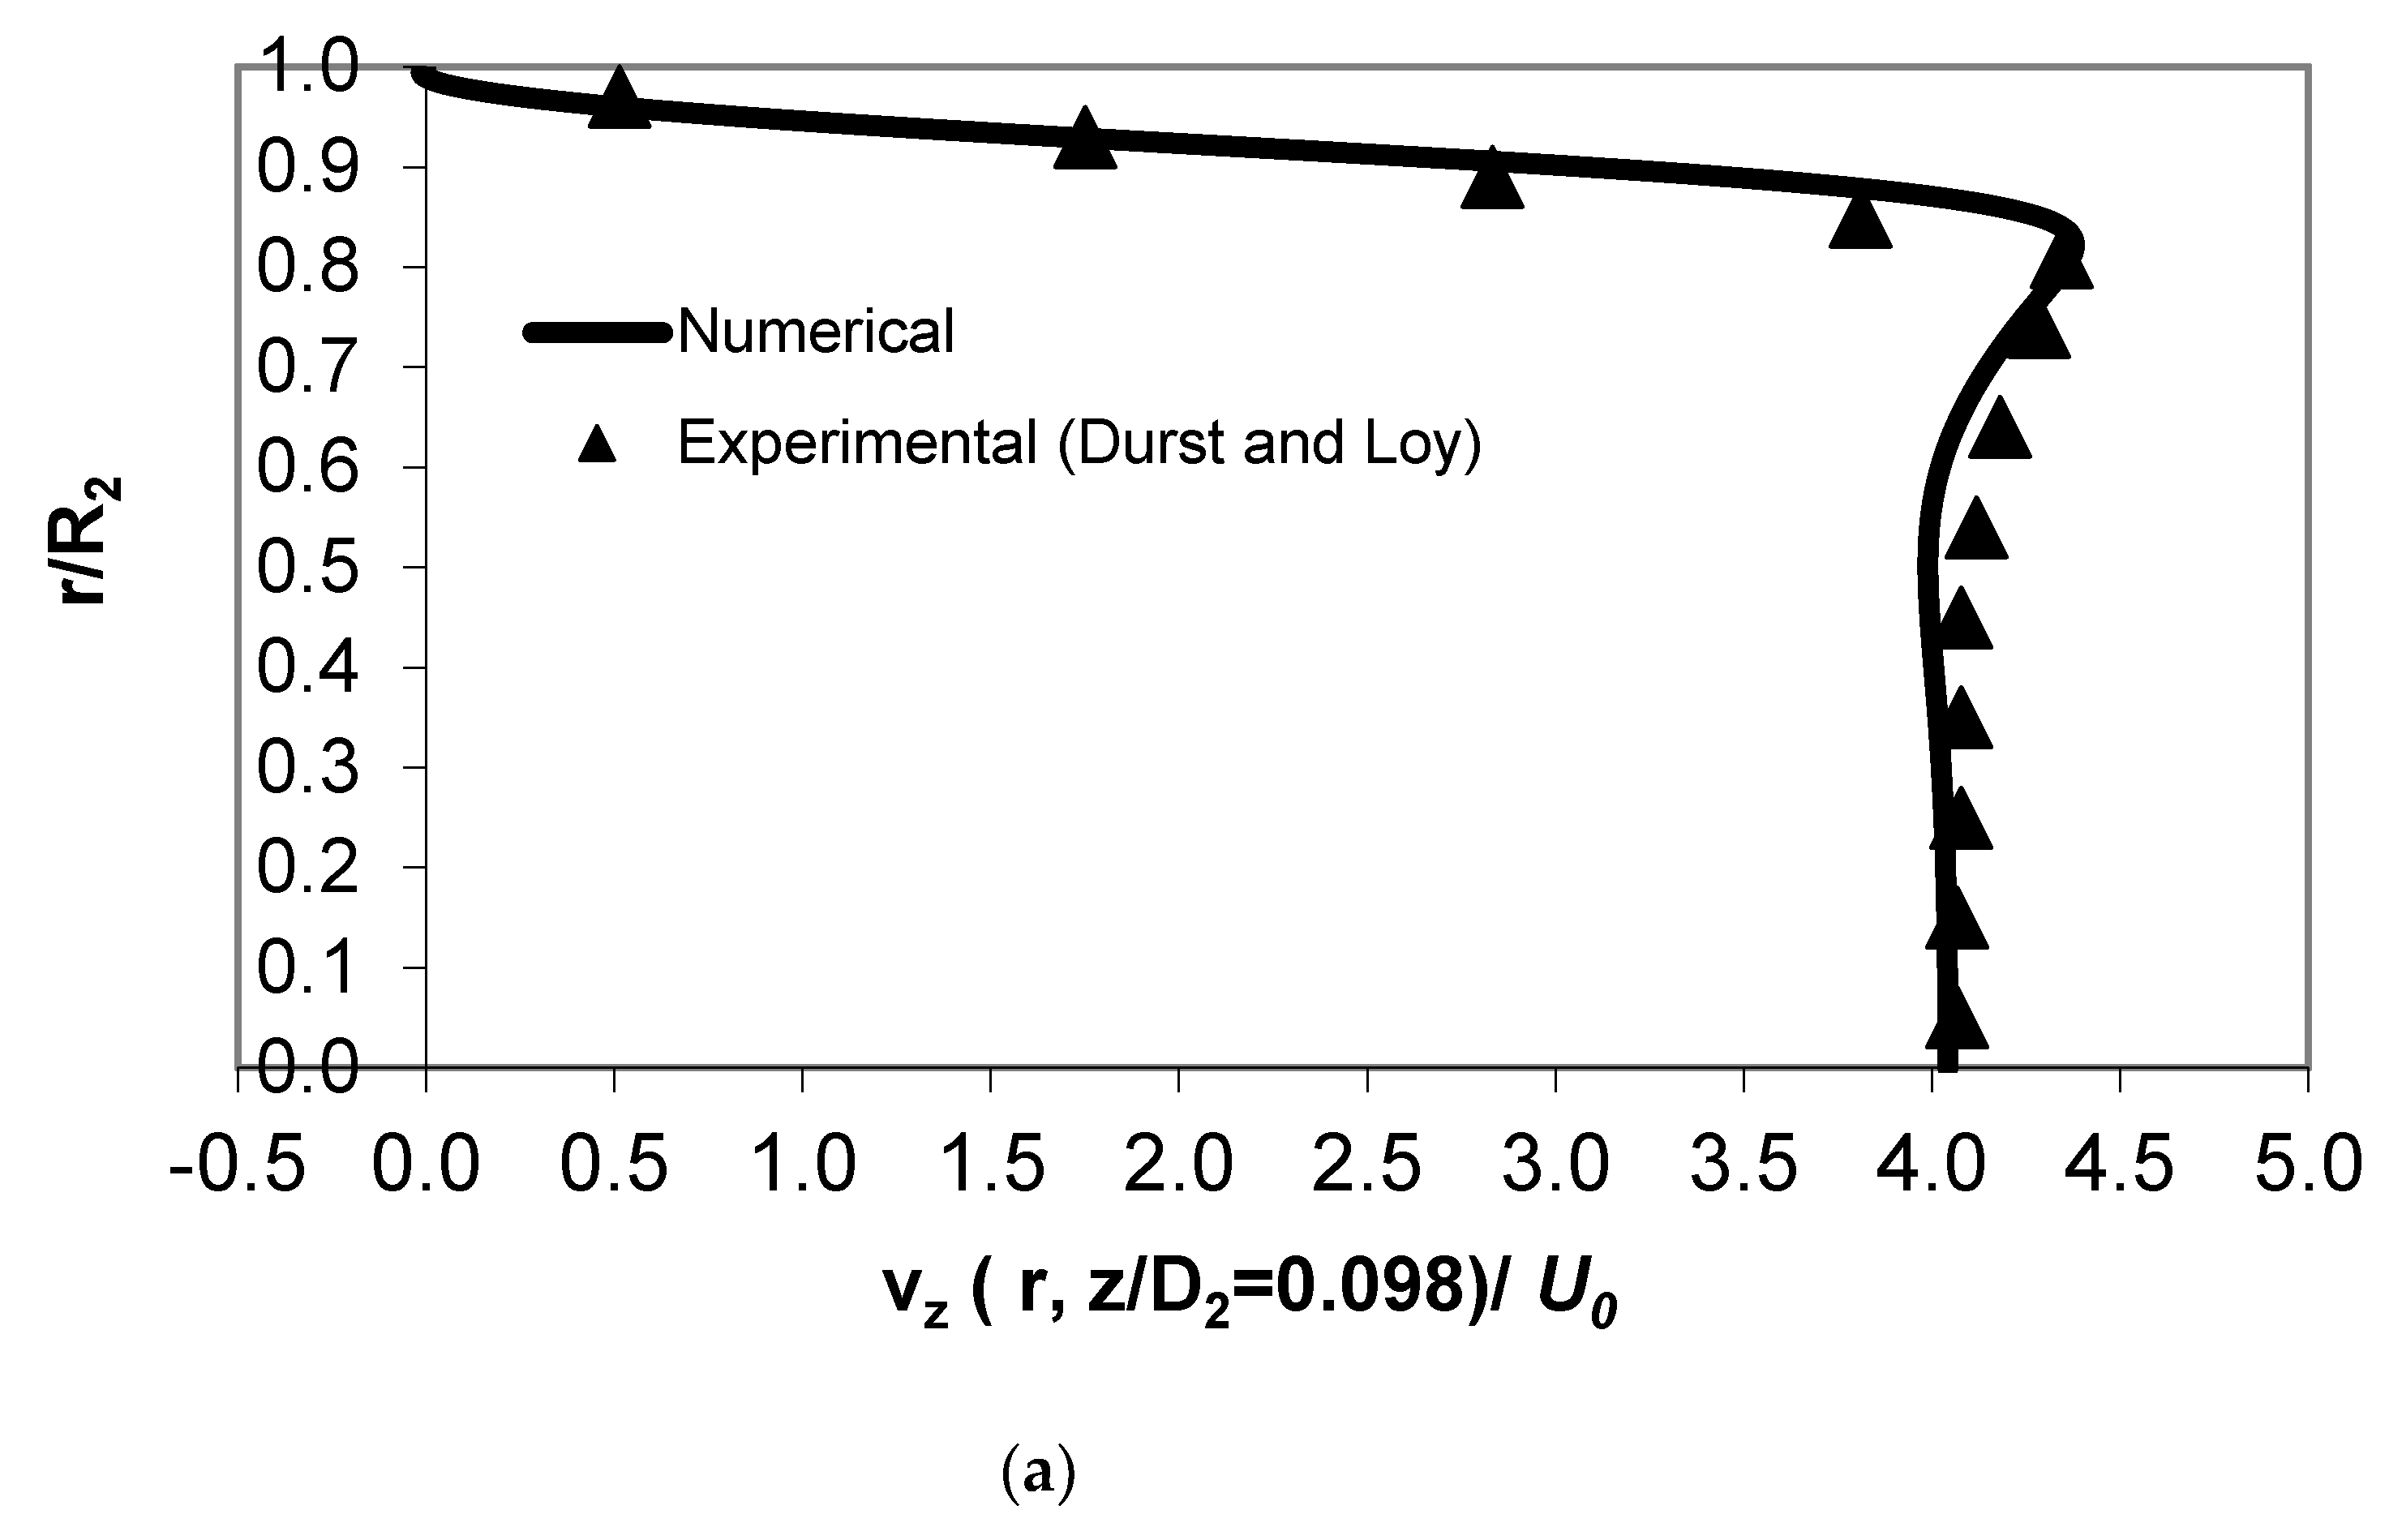
The comparison between the experimental and present numerical results yielded very good agreement. These comparisons are shown in
Figure 4 for two different sections in the smaller pipe post the contraction where the flow goes through drastic changes in magnitudes and gradients. As can be seen, most of the experimental data points fall on the numerical prediction curves. There are some small differences in the profile at a location of 1 mm after the contraction (z/D
2 = 0.098).
In this section there is a recirculation zone due to the
vena contracta. The authors of the experimental study [
3] have indicated that they could not resolve this region well and stated that they needed an LDA system with an effective measuring control volume of 20 μm in diameter. It is noted on
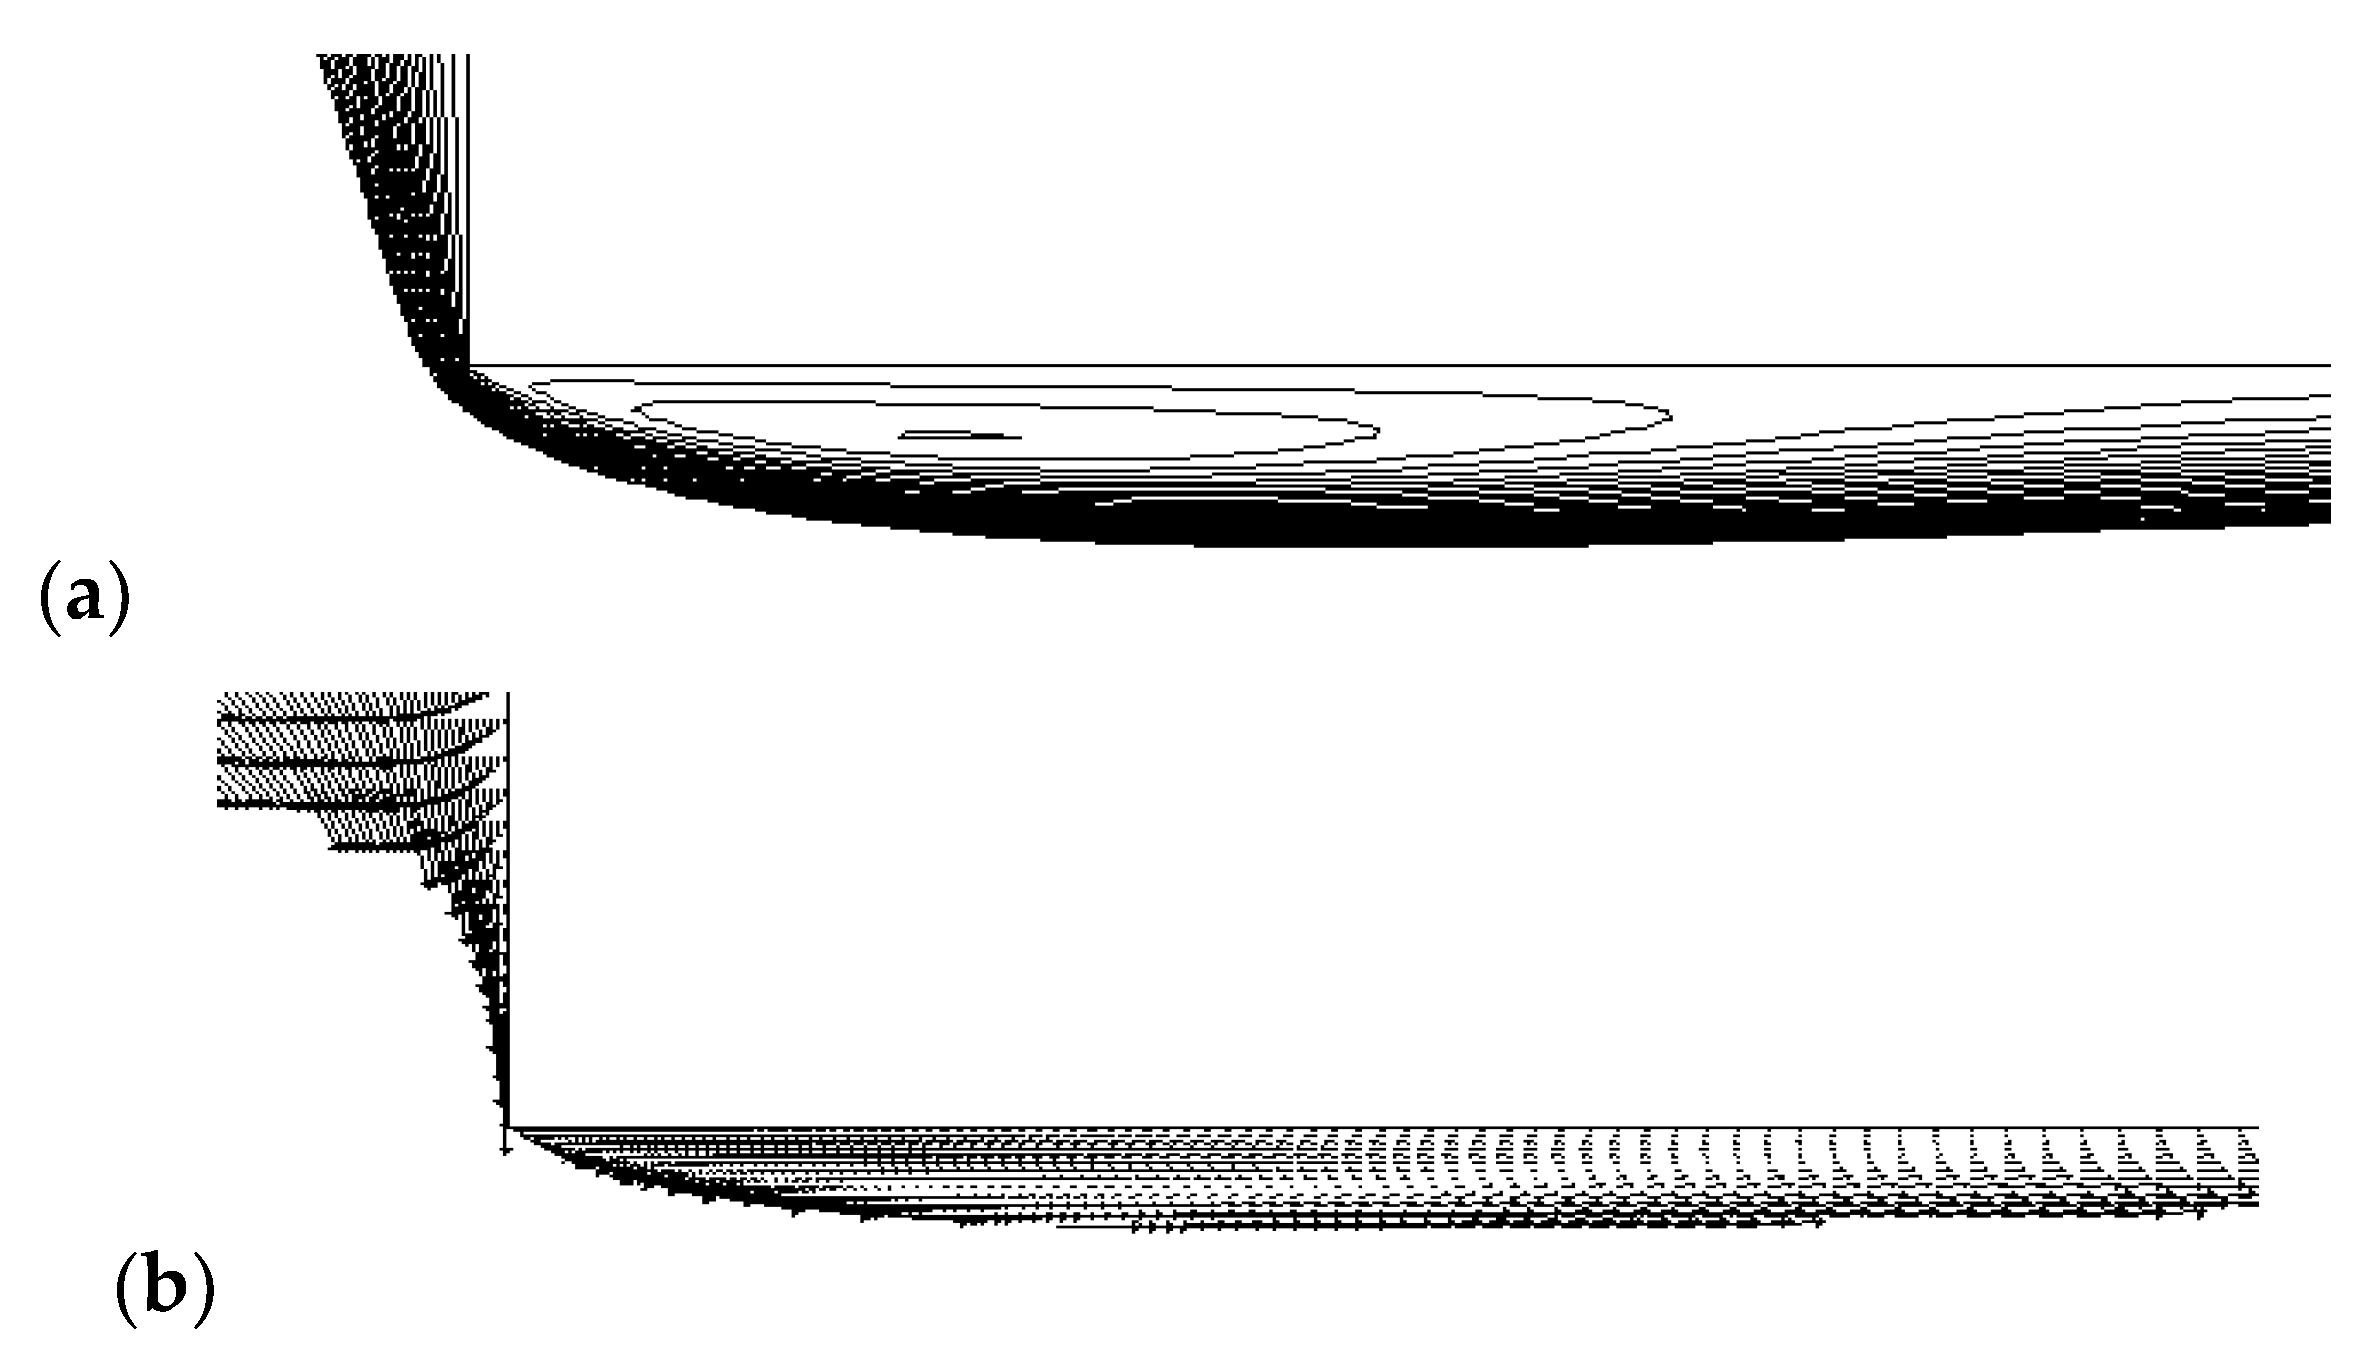
Figure 4a that the numerical model predicted this recirculation zone as the axial velocity has negative values close to the wall. This may be due to the fine grid used for these calculations as the control volumes had an effective diameter of 25 μm. This recirculation zone can be better seen in
Figure 5, where the streamlines and velocity vectors are shown in the vena contracta zone.
Obtaining an accurate numerical solution is of critical importance for determining the entropy generation field, as the latter depends both on the velocity magnitude and the velocity gradients, both of which exhibit large variations in the contraction zone. As a matter of fact, in the early stage of this study, the author used a moderately fine grid with a first-order discretization. The difference between the differential method and the integral one in the entropy generation results was as high as 30%. At the same time, the differences between experimental and numerical velocity profiles were less than 5%.
After checking both the integral and differential methods, it was concluded that the main source of error is mainly caused by inaccuracies in numerical calculations. Hence, finer grids were generated. Refining the grid resulted in reducing the difference between the integral and differential values of entropy generation to 5%. Finally, a second-order discretization scheme was employed, resulting in differences of less than 1%, which was thought to be satisfactory. These numerical results are summarized in
Table 4.
In conclusion, excellent numerical accuracy is required in order to obtain accurate entropy generation values. Extending this fact further, one may postulate that entropy generation predictions can be used as an accuracy test for a given numerical scheme provided there is an exact solution to check against. This hypothesis needs to be tested for different flow and heat transfer situations before being applied.
3.2. Entropy Generation Field in the Contraction
During the course of this study, several cases have been simulated to check the accuracy and validity of numerical results. Only a few cases will be discussed here with, with a focus on the entropy generation in the contraction region.
In the following presented results, the flow is assumed to be laminar and isothermal. Viscous dissipation is only accounted for in the entropy generation. The validity of this assumption was checked by solving the energy equation, including the viscous dissipation term. A very small temperature rise (<0.01 K) was noted in the temperature solution. Under these conditions, the total entropy generation is made of two major parts: entropy generation due to shear stresses and entropy generation due to pressure (normal) stresses.
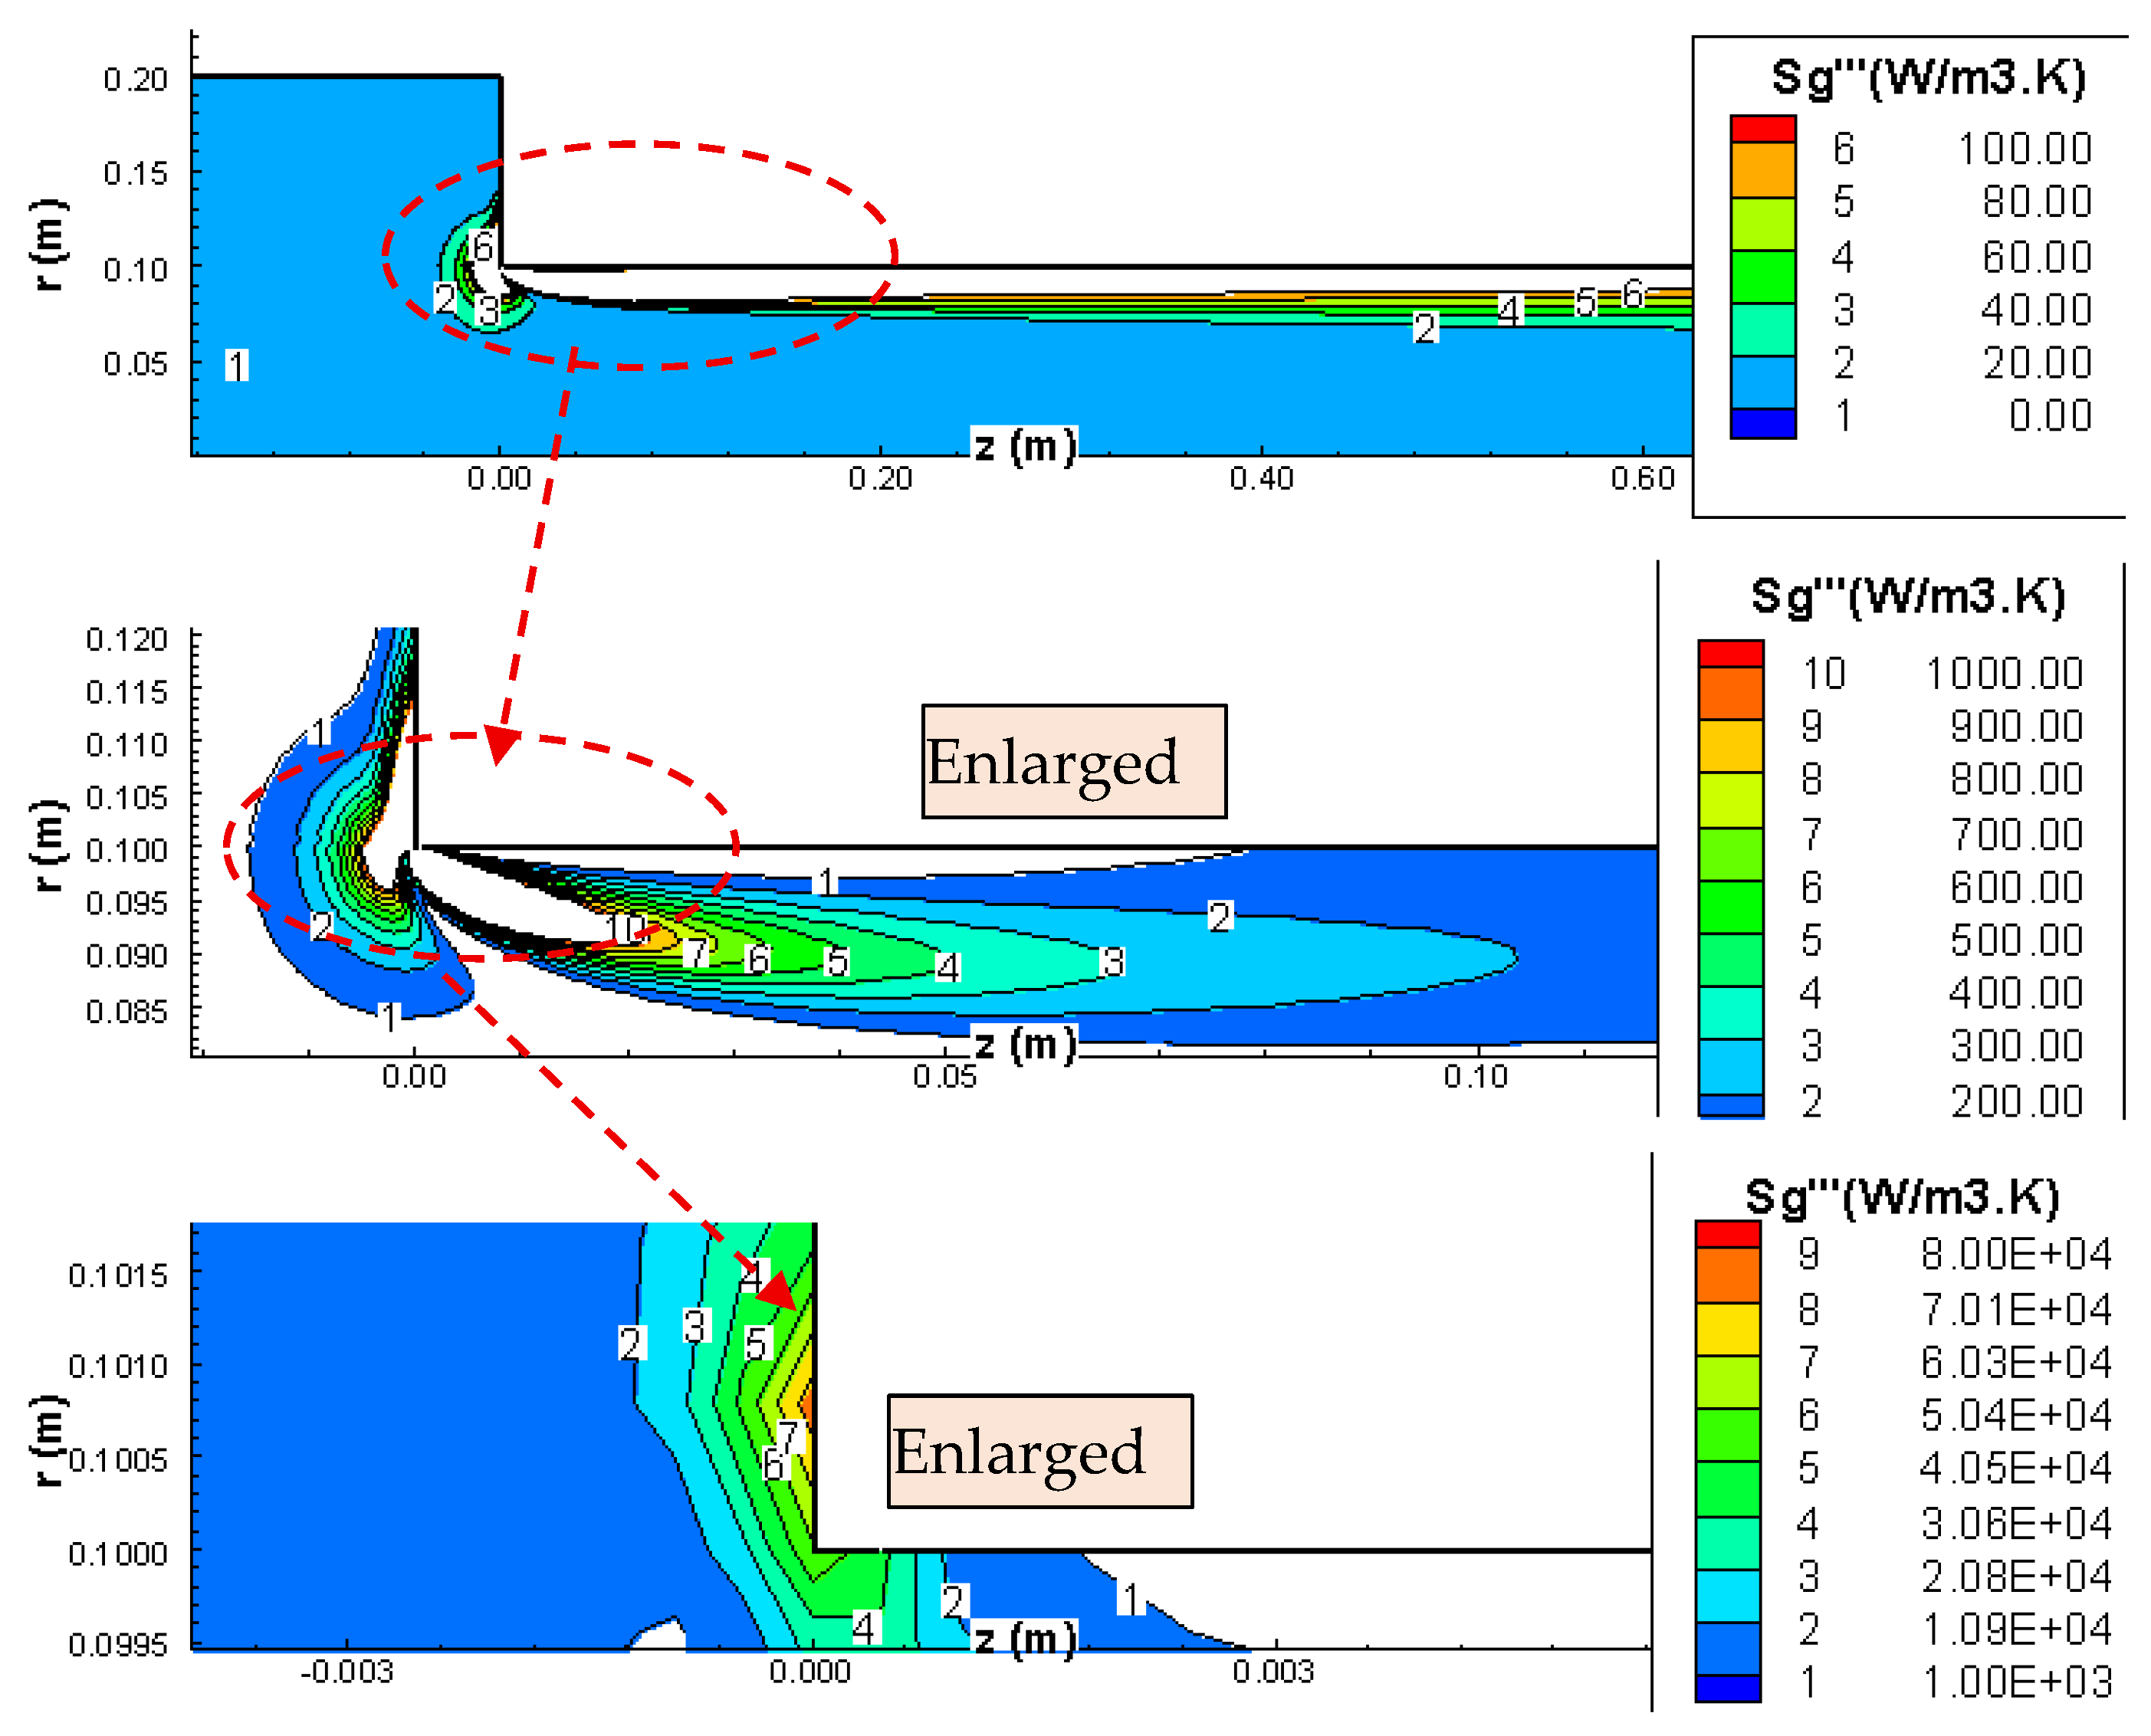
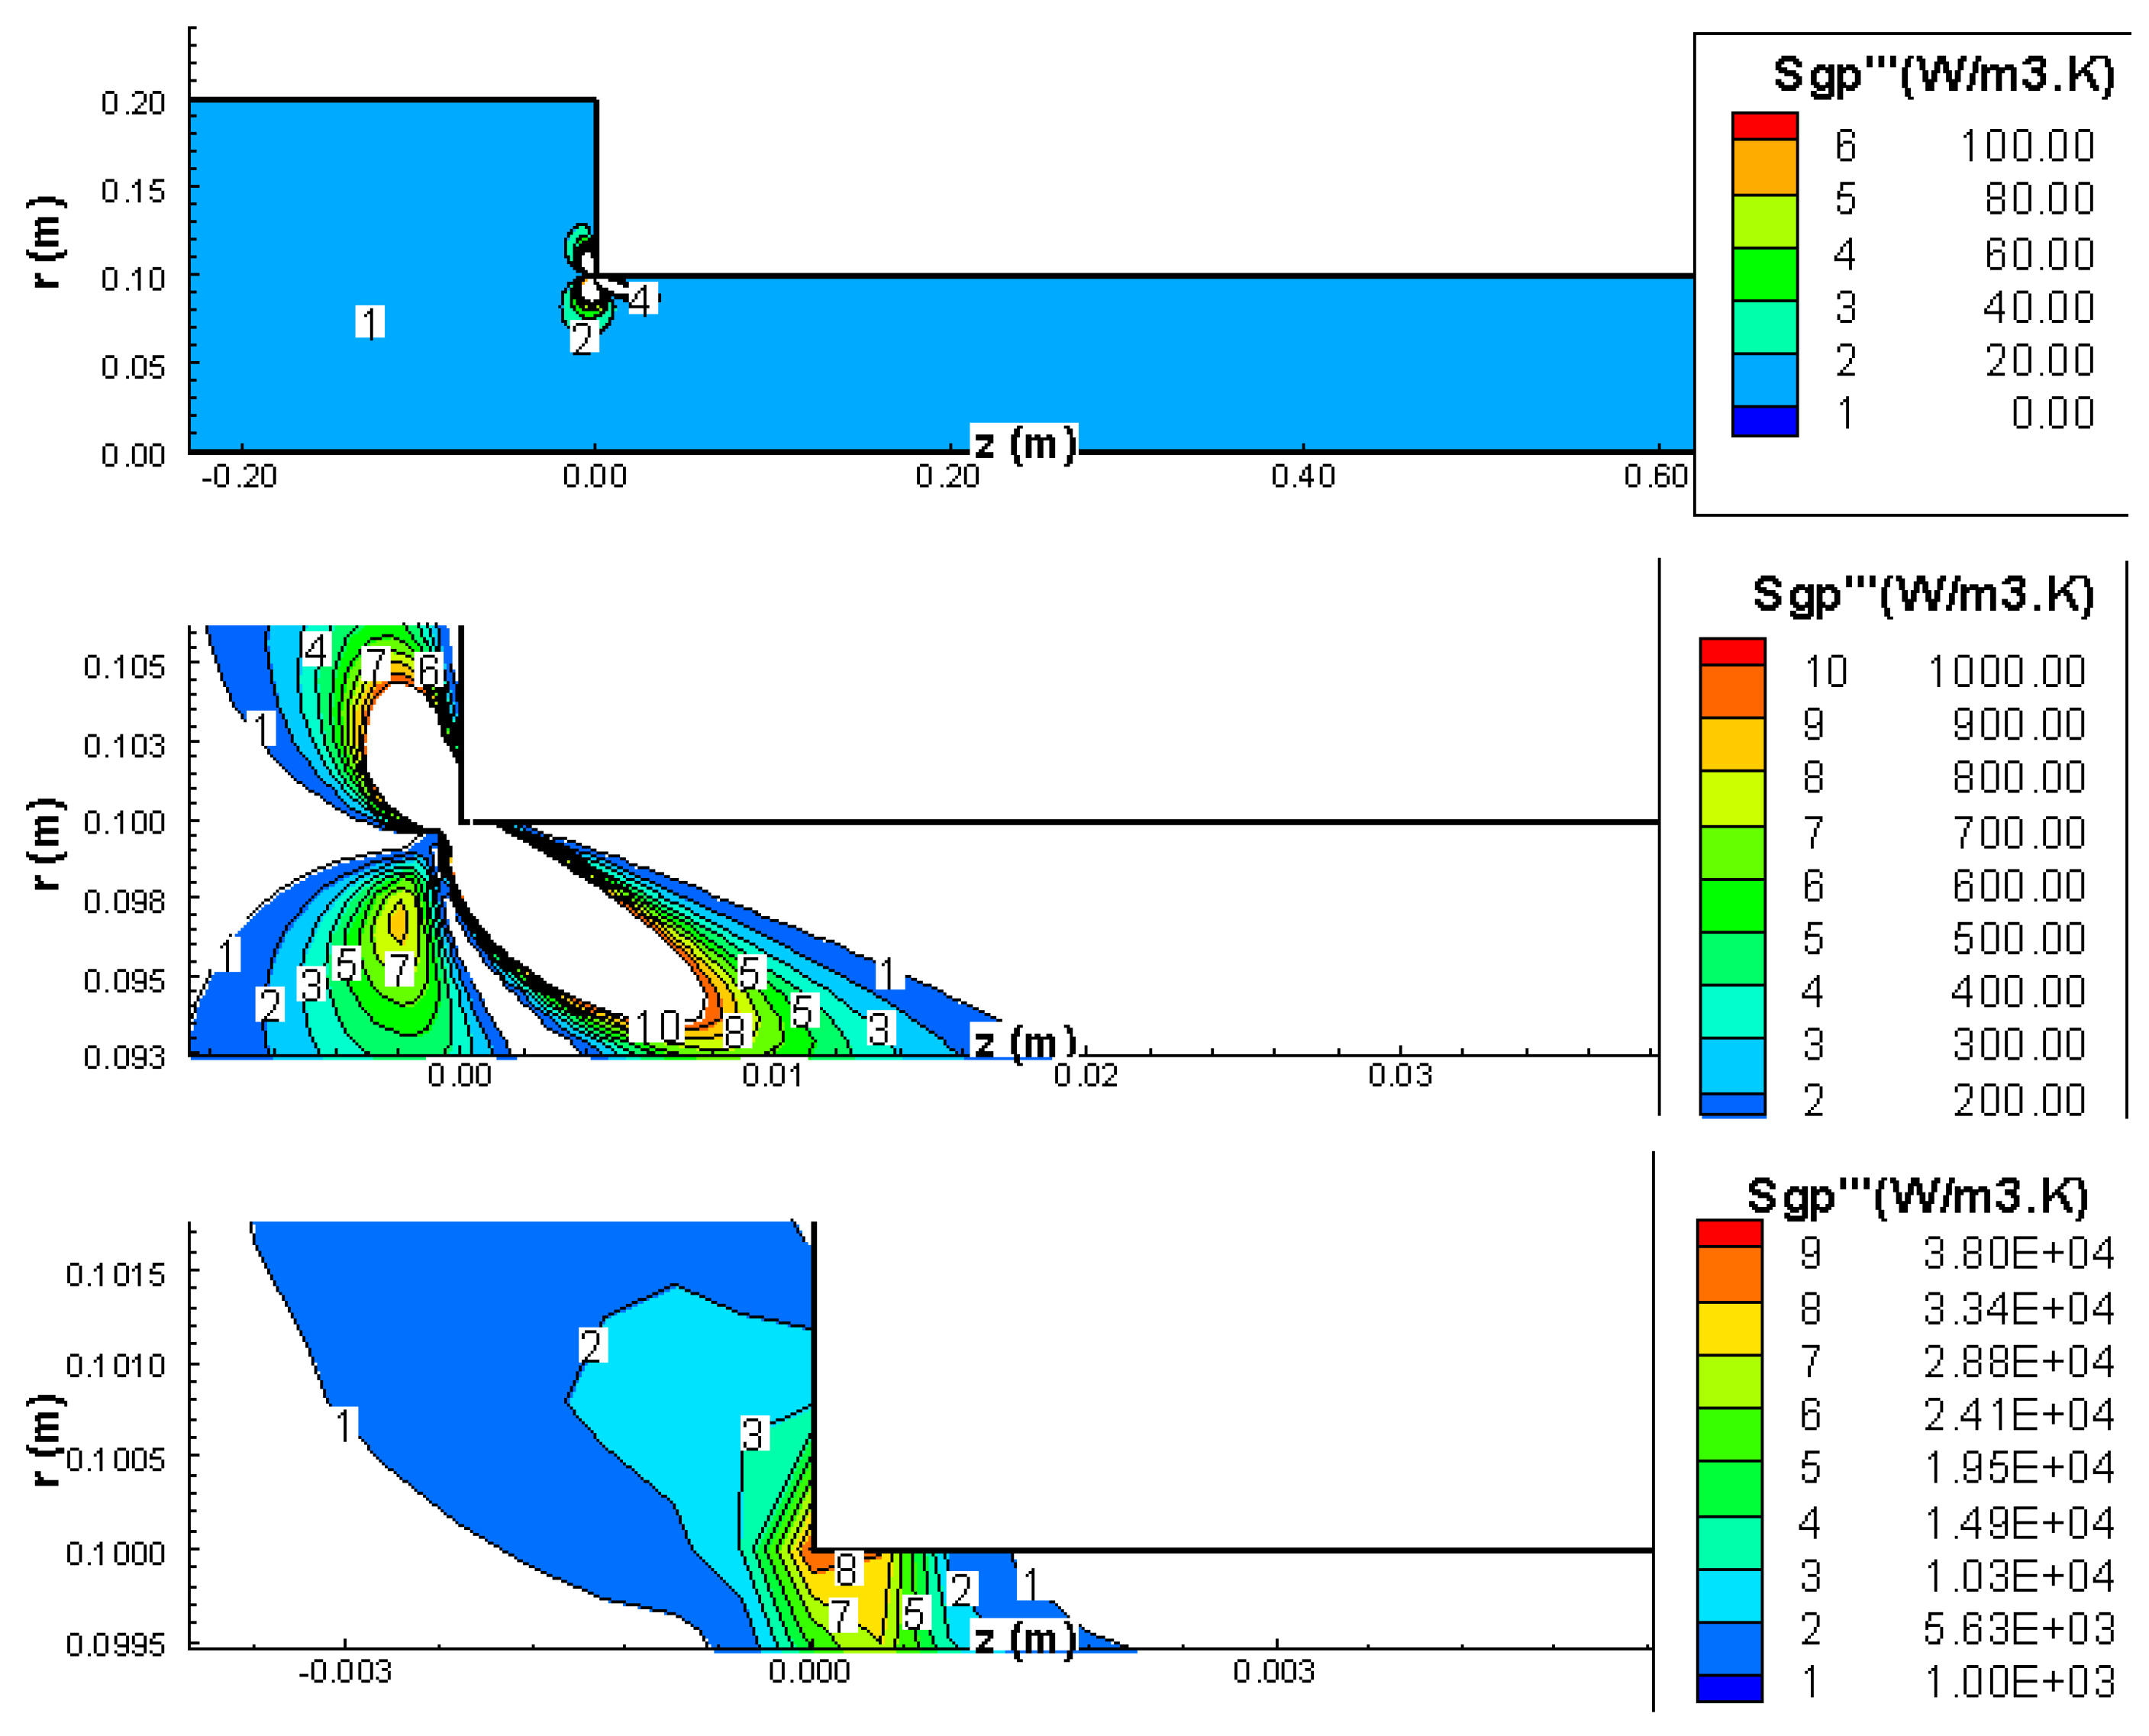
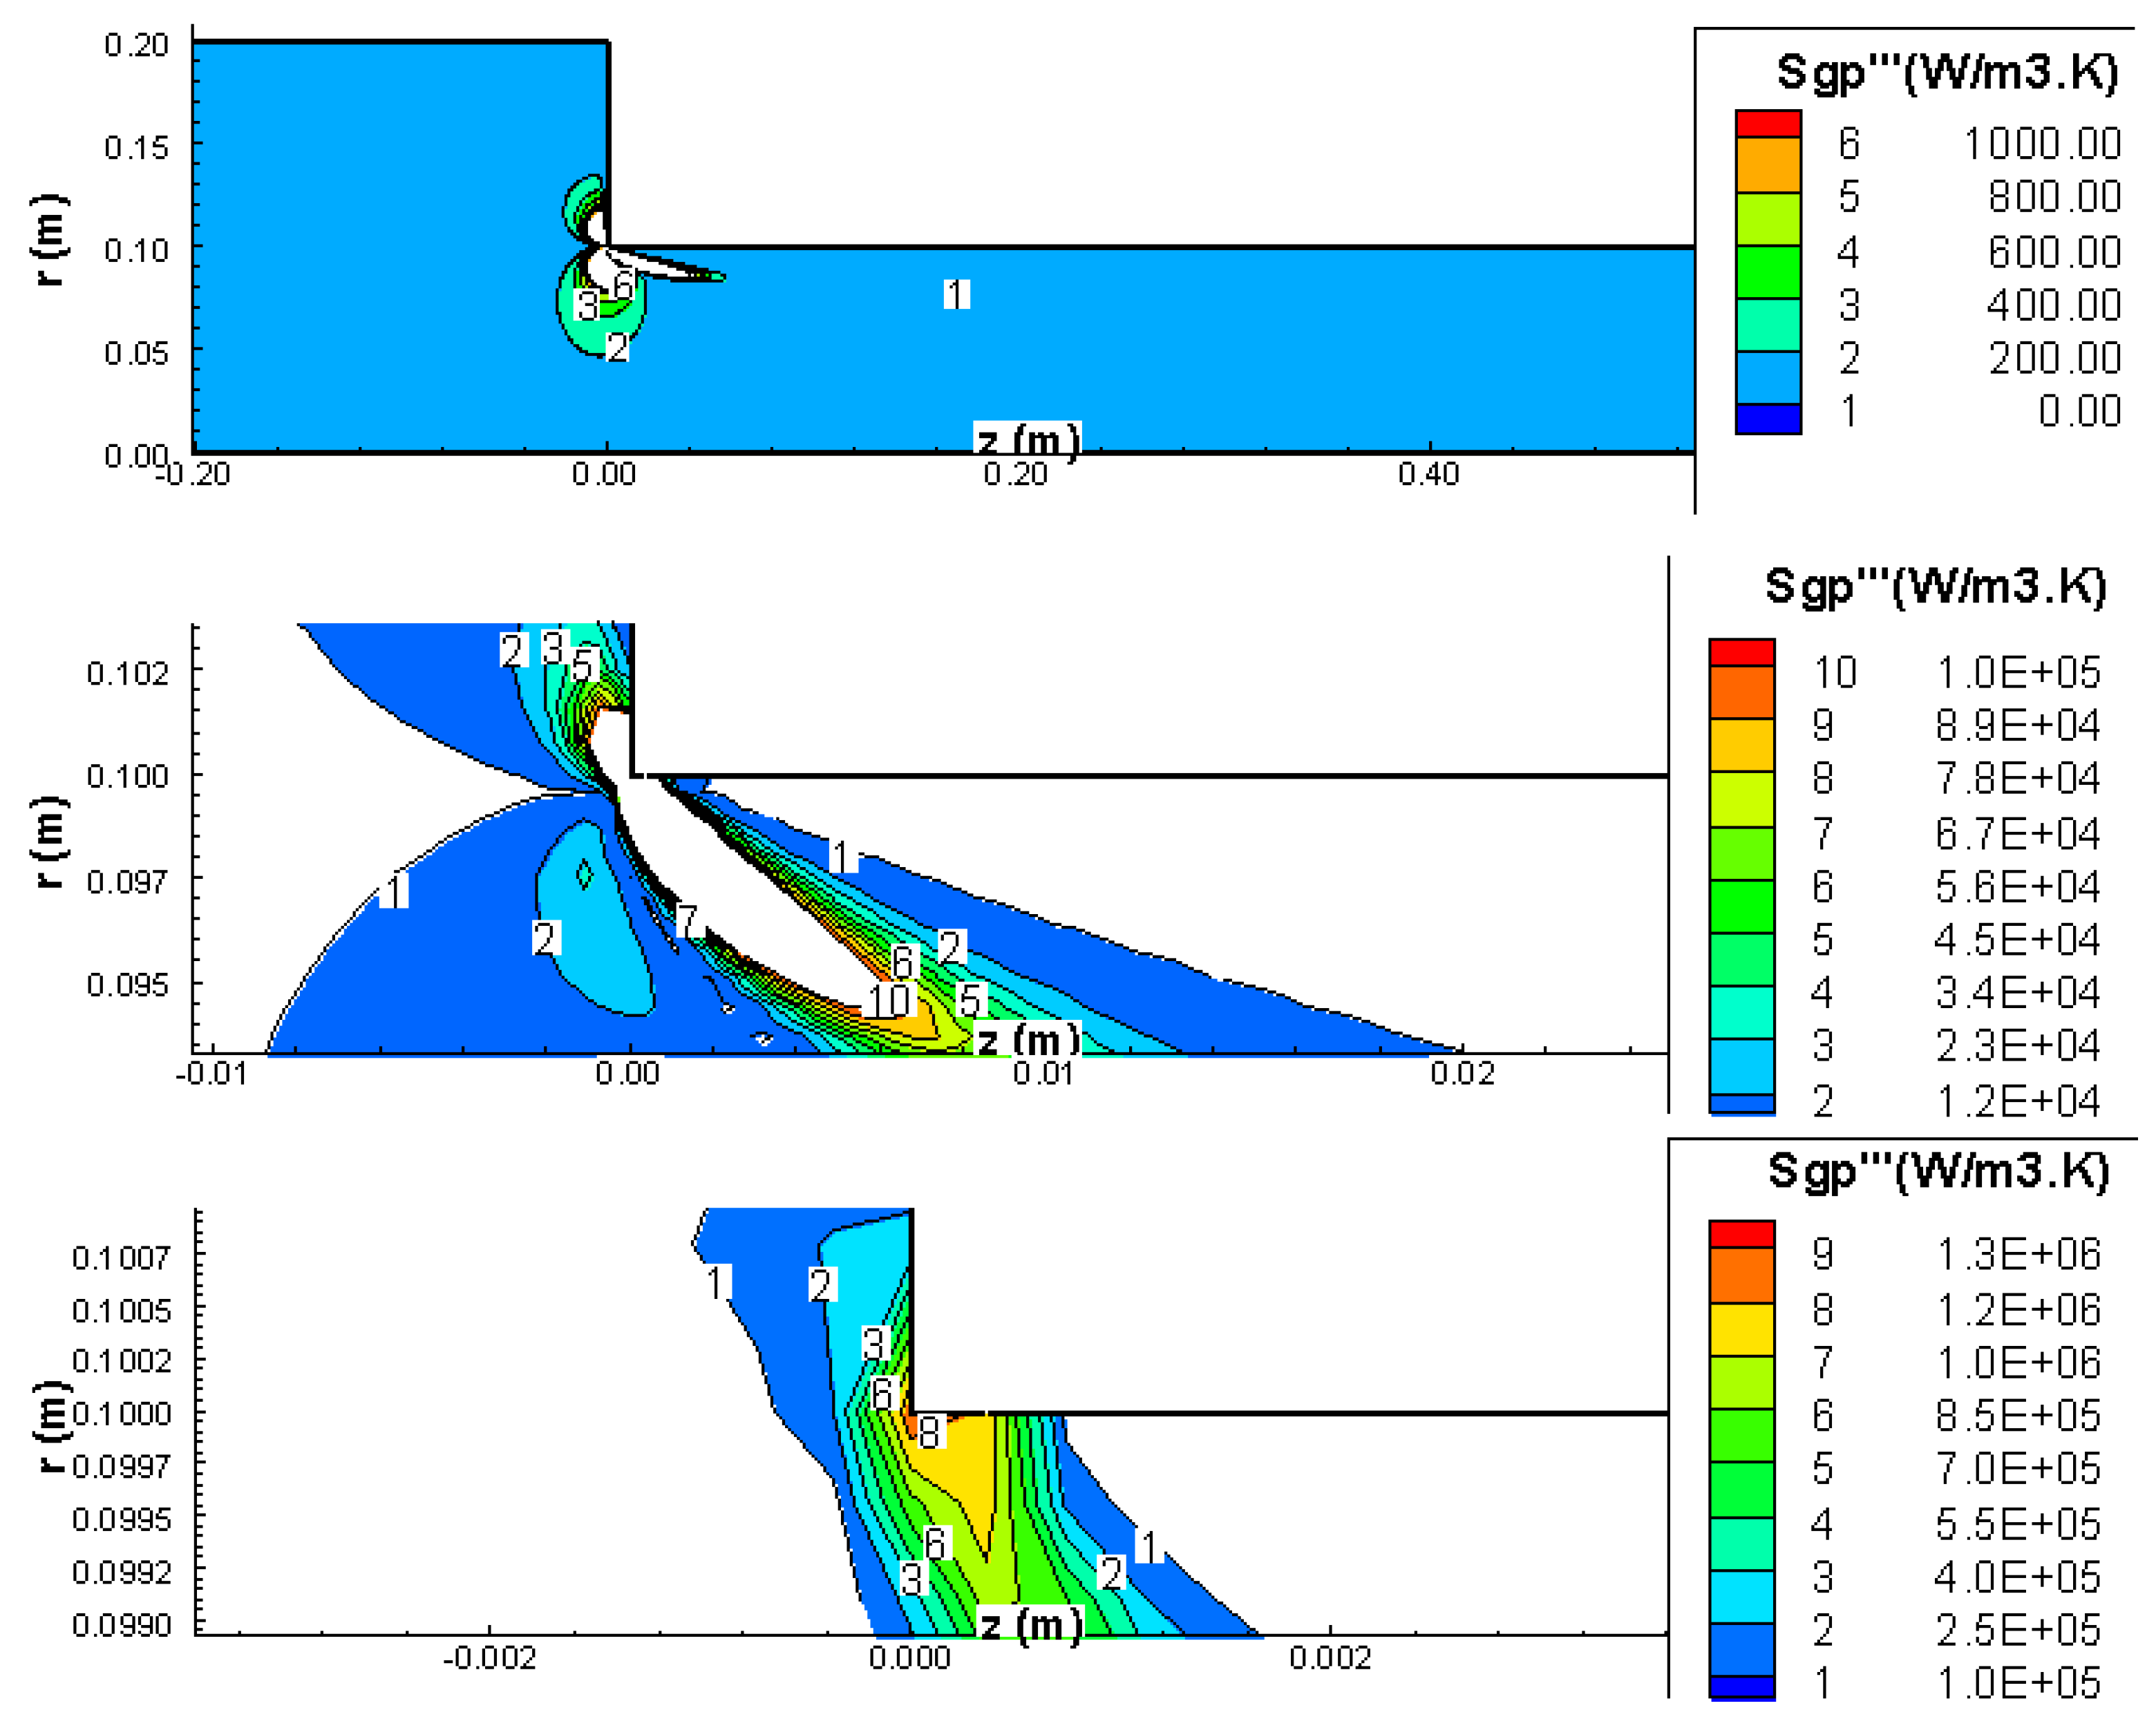
The total entropy generation is presented in
Figure 6,
Figure 7 and
Figure 8 for three Reynolds numbers (Re
1 = 34, 335, 1342; Re
2 = 67, 671, 2684; Re
1 is based on the contraction large diameter D
1 and Re
2 is based on the contraction smaller D
2). Each figure has three (3) contour plots showing different ranges of entropy generation rates. The top figure is an overview of the entropy generation contours around the contraction, the middle figure is zoomed in to show better resolution of the entropy generation around the contraction, and the bottom figure is a closer zoom in around the sharp corner of the contraction. It was necessary to zoom into the corner area where extremely high values of entropy generation rates exist. For Re
1 = 34, the entropy generation rate varies from 10 to 55 (W/m
2K) over a region spanning 4 mm in the z-direction and 2 mm in the r-direction. (Note that the computational domain is 2 m in z-direction and 0.2 m in the r-direction). Therefore, it can be concluded that the bulk of the entropy generation is mainly due to the contraction and is highly localized around the
contraction corner (intersection of the small diameter pipe with the contraction disk). The entropy generation rates in the
stagnation corner (intersection of the large diameter pipe with the contraction disk) are much smaller in comparison to those in the contraction corner.
The location of the maximum value of the entropy generation moves around the contraction corner as the Reynolds number varies. For the low Reynolds case (Re
1 = 34), the maximum entropy generation is located in the small pipe 0.6 mm downstream from the corner (see
Figure 6). For Re
1 = 335 and Re
1 = 1342, the maximum entropy generation is located on the contraction disk 0.7 mm radially outward from the contraction corner (see
Figure 7 and
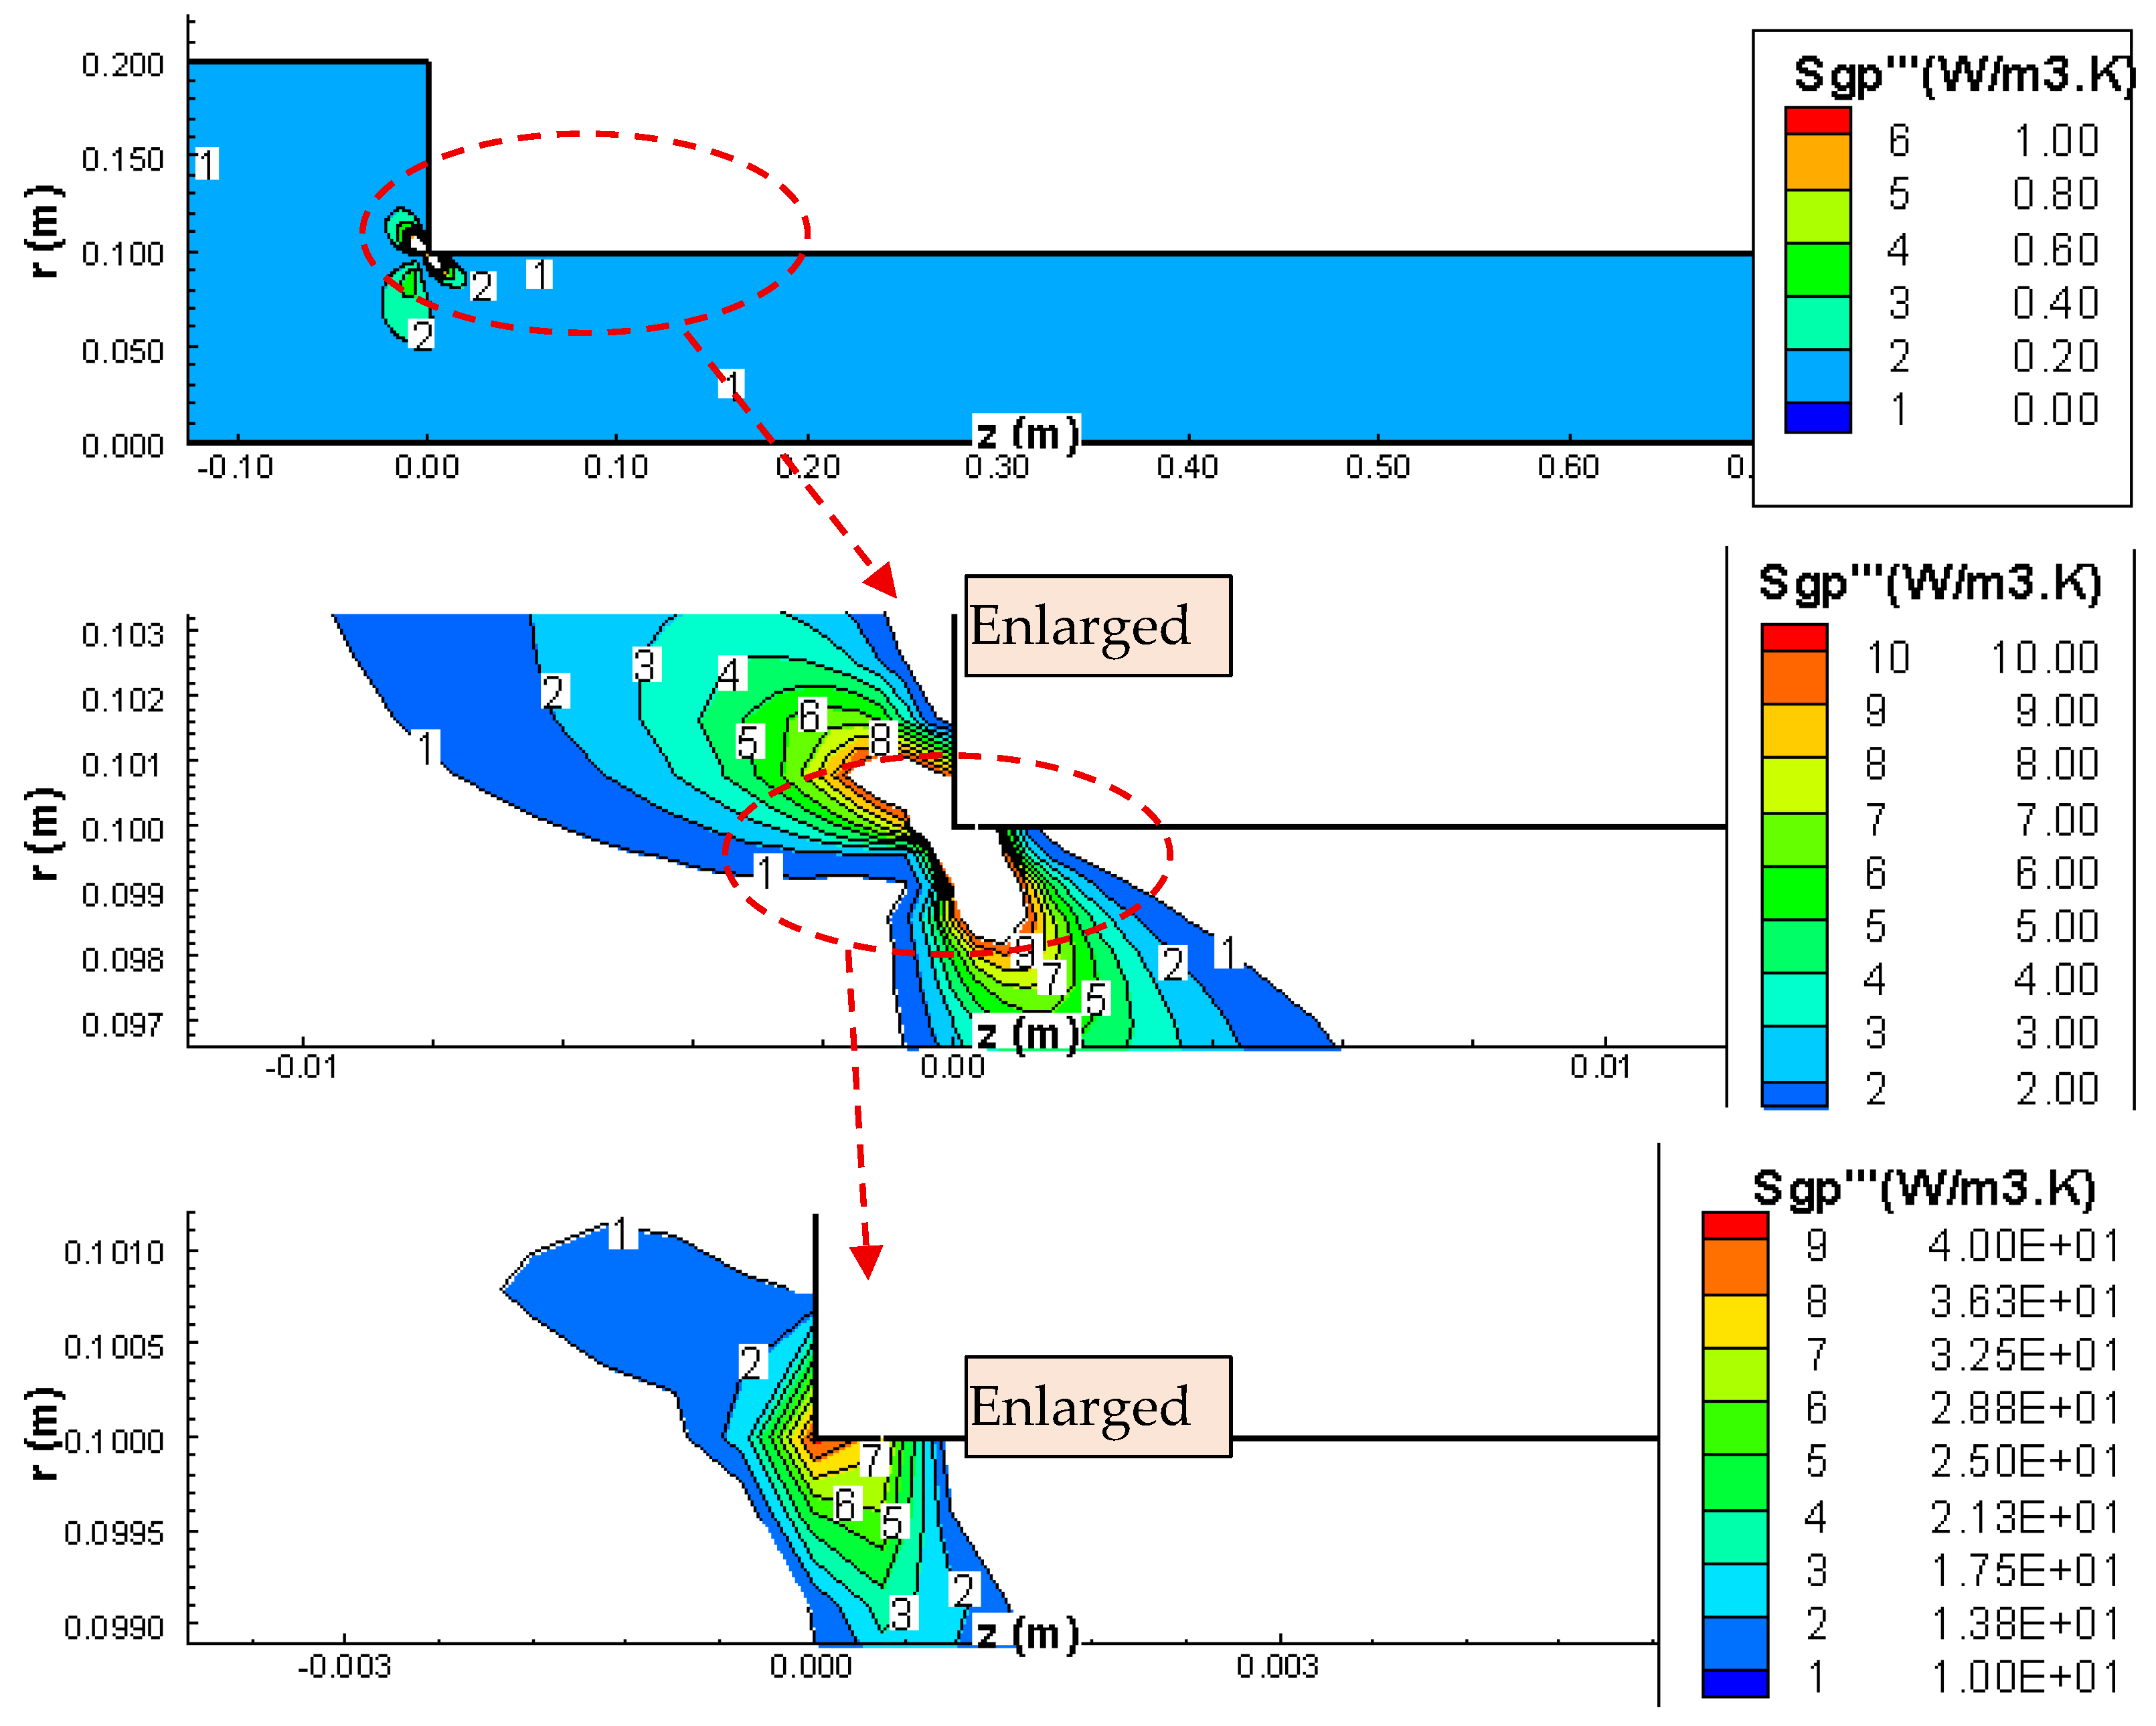
Figure 8). To understand the factors affecting the location of maximum total entropy generation, the entropy generation due to shear and that due to pressure are also plotted in a similar manner as the total entropy generation.
The entropy generation portion, which is due to normal stresses (Equation (8a)), is shown in
Figure 9,
Figure 10 and
Figure 11 for Re
1 = 34, 335, 1342, respectively. It appears that the location of the maximum generation occurs very close to the corner. This finding agrees with theoretical as well as experimental observations, which indicate that the maximum pressure gradient occurs very close to the corner location. The same observation applies for all the three Reynolds cases and the location of maximum generation of entropy due to pressure is independent of the Re number.
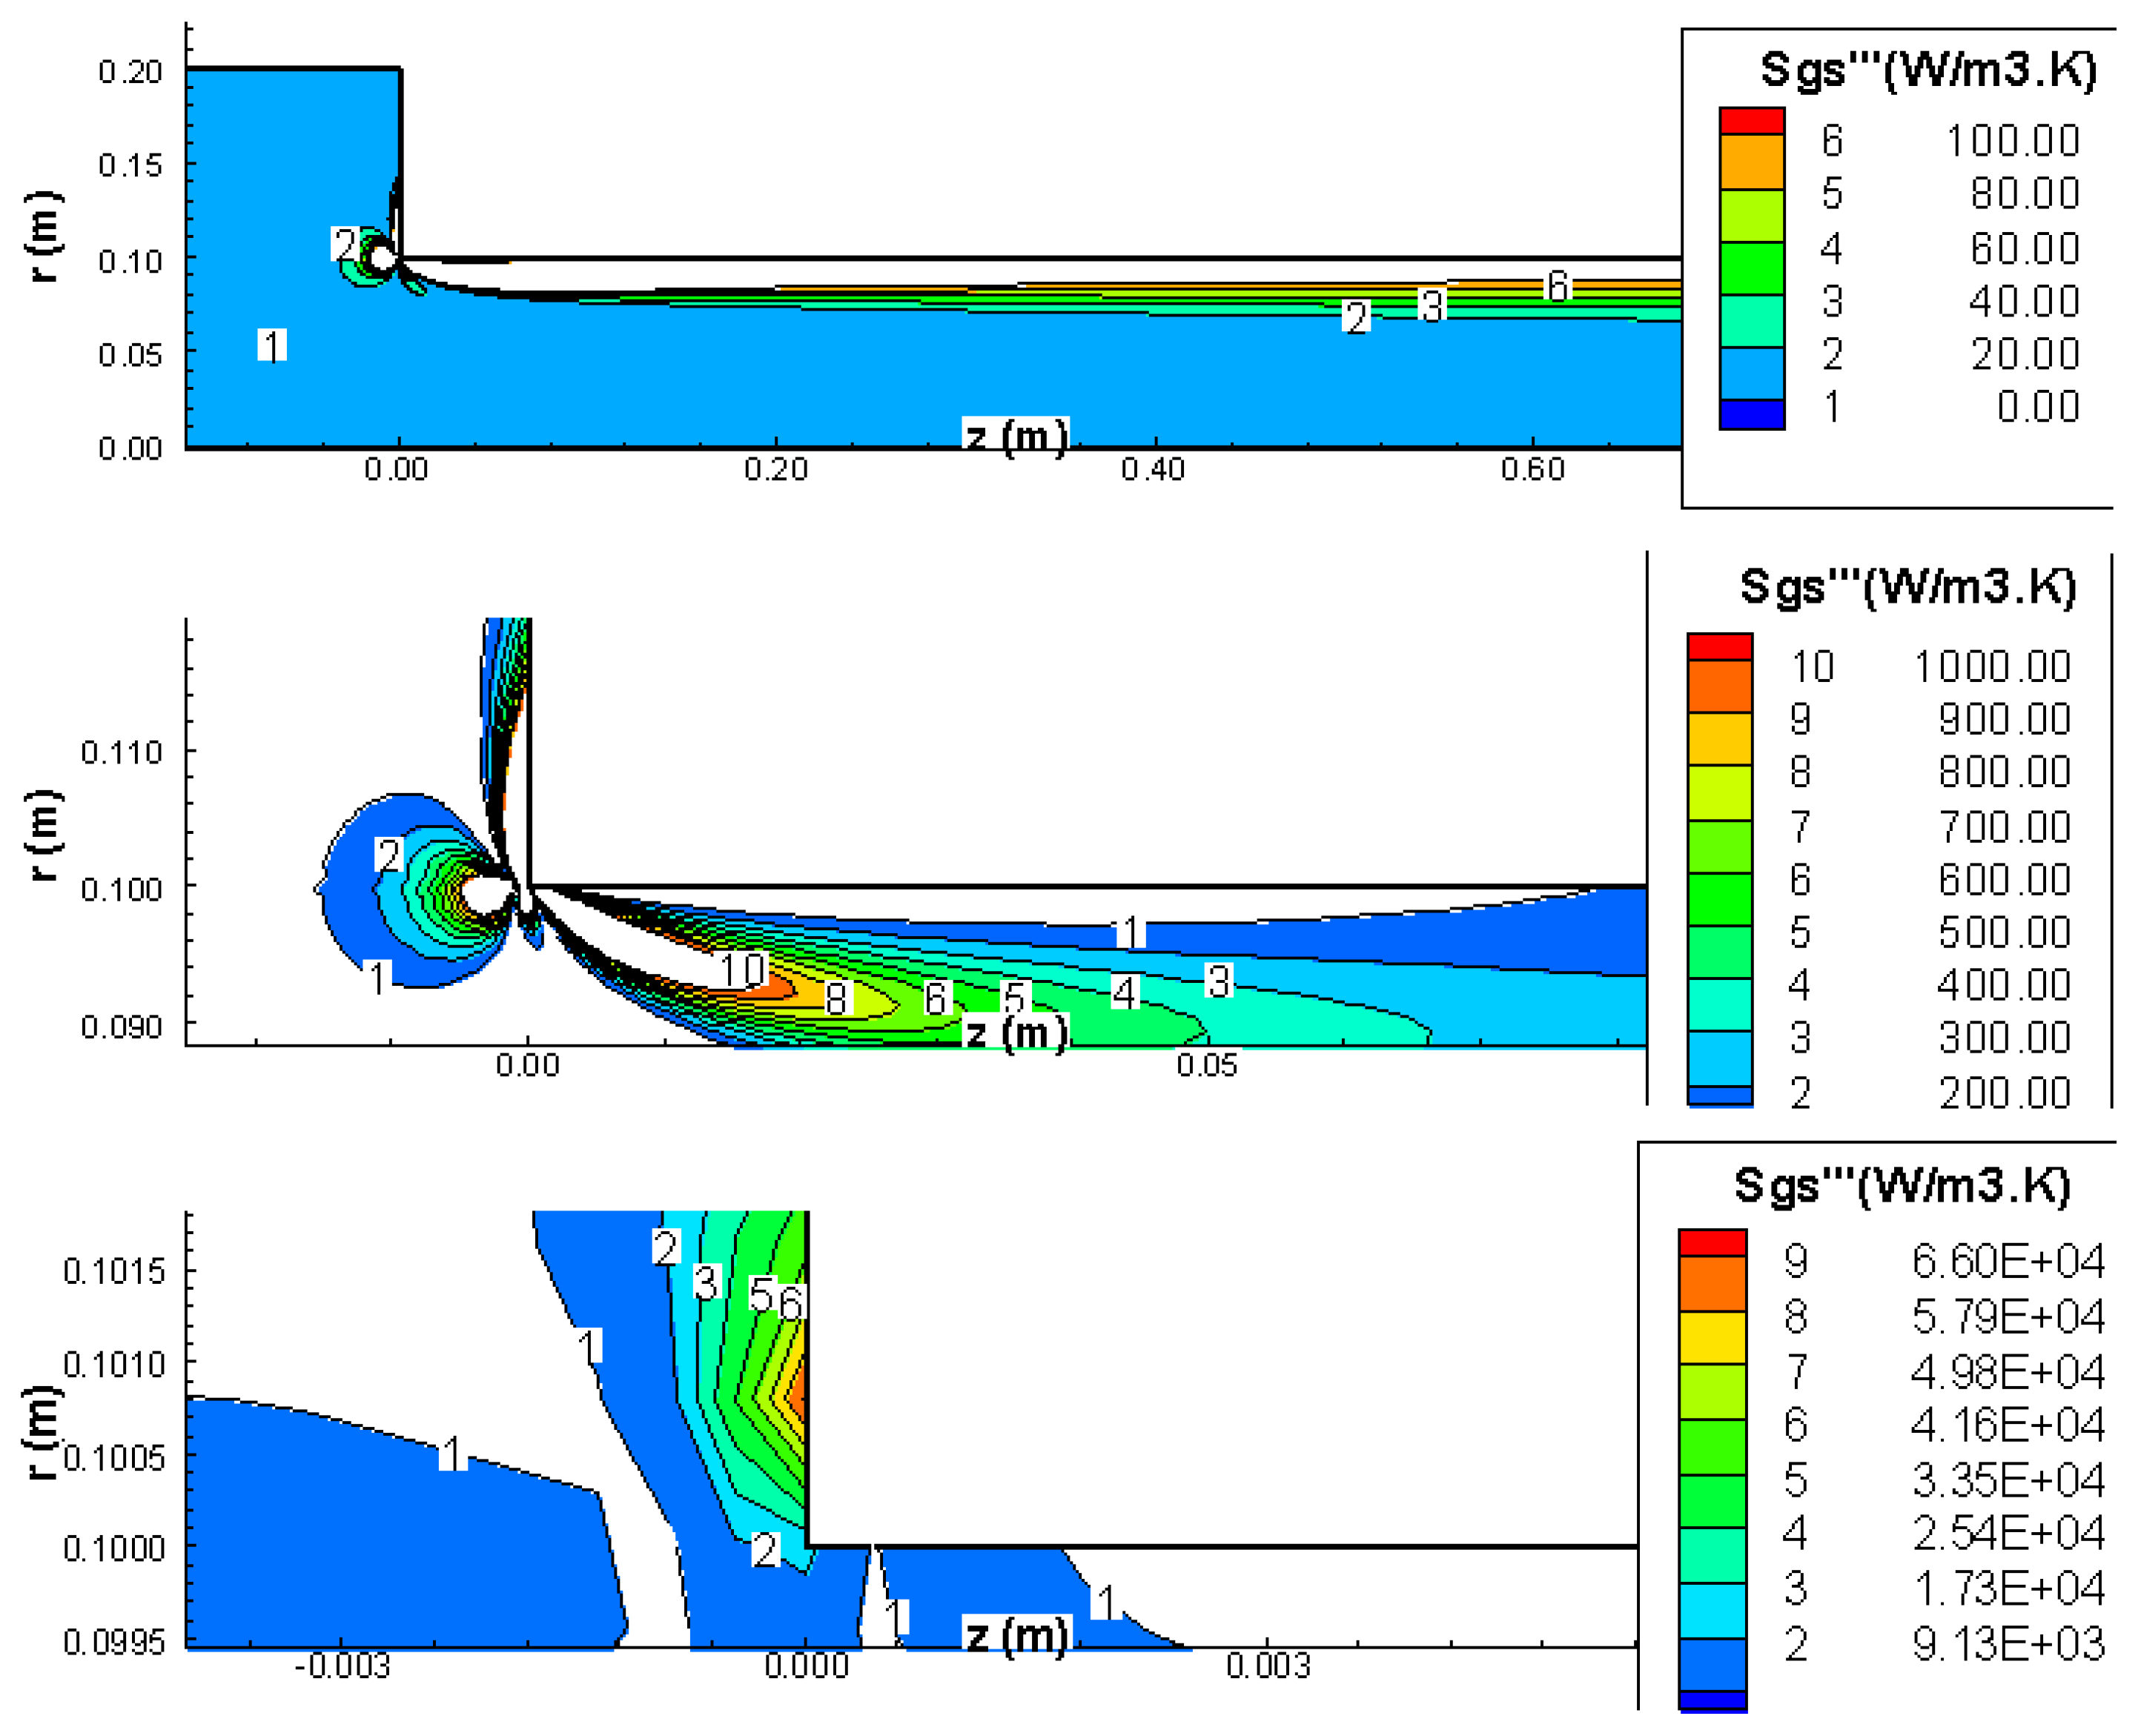
The entropy generation portion due to shear stresses (Equation (8b)) is shown in
Figure 12,
Figure 13 and
Figure 14 for Re
1 = 34, 335, and 1342 respectively. The location of the maximum generation does depend on the number of Reynolds. For Re
1 = 34, the maximum is located on the small pipe 0.6 mm downstream from the corner (see
Figure 12). For Re
1 = 335 and Re
1 = 1342, the maximum entropy generation due to shear is located on the contraction disk 0.7 mm radially outward from the contraction corner (see
Figure 13 and
Figure 14). This observation seems to be similar to the total entropy generation. Since the location of the pressure-generated entropy is very close to the corner, the location of the maximum value and the distribution of the entropy generation by shear stresses seem to strongly affect the location of the maximum value and the distribution of the total entropy generation. This is further re-enforced by the fact that the levels of shear-generated entropy are higher than those of pressure-generated entropy except for creeping flows.
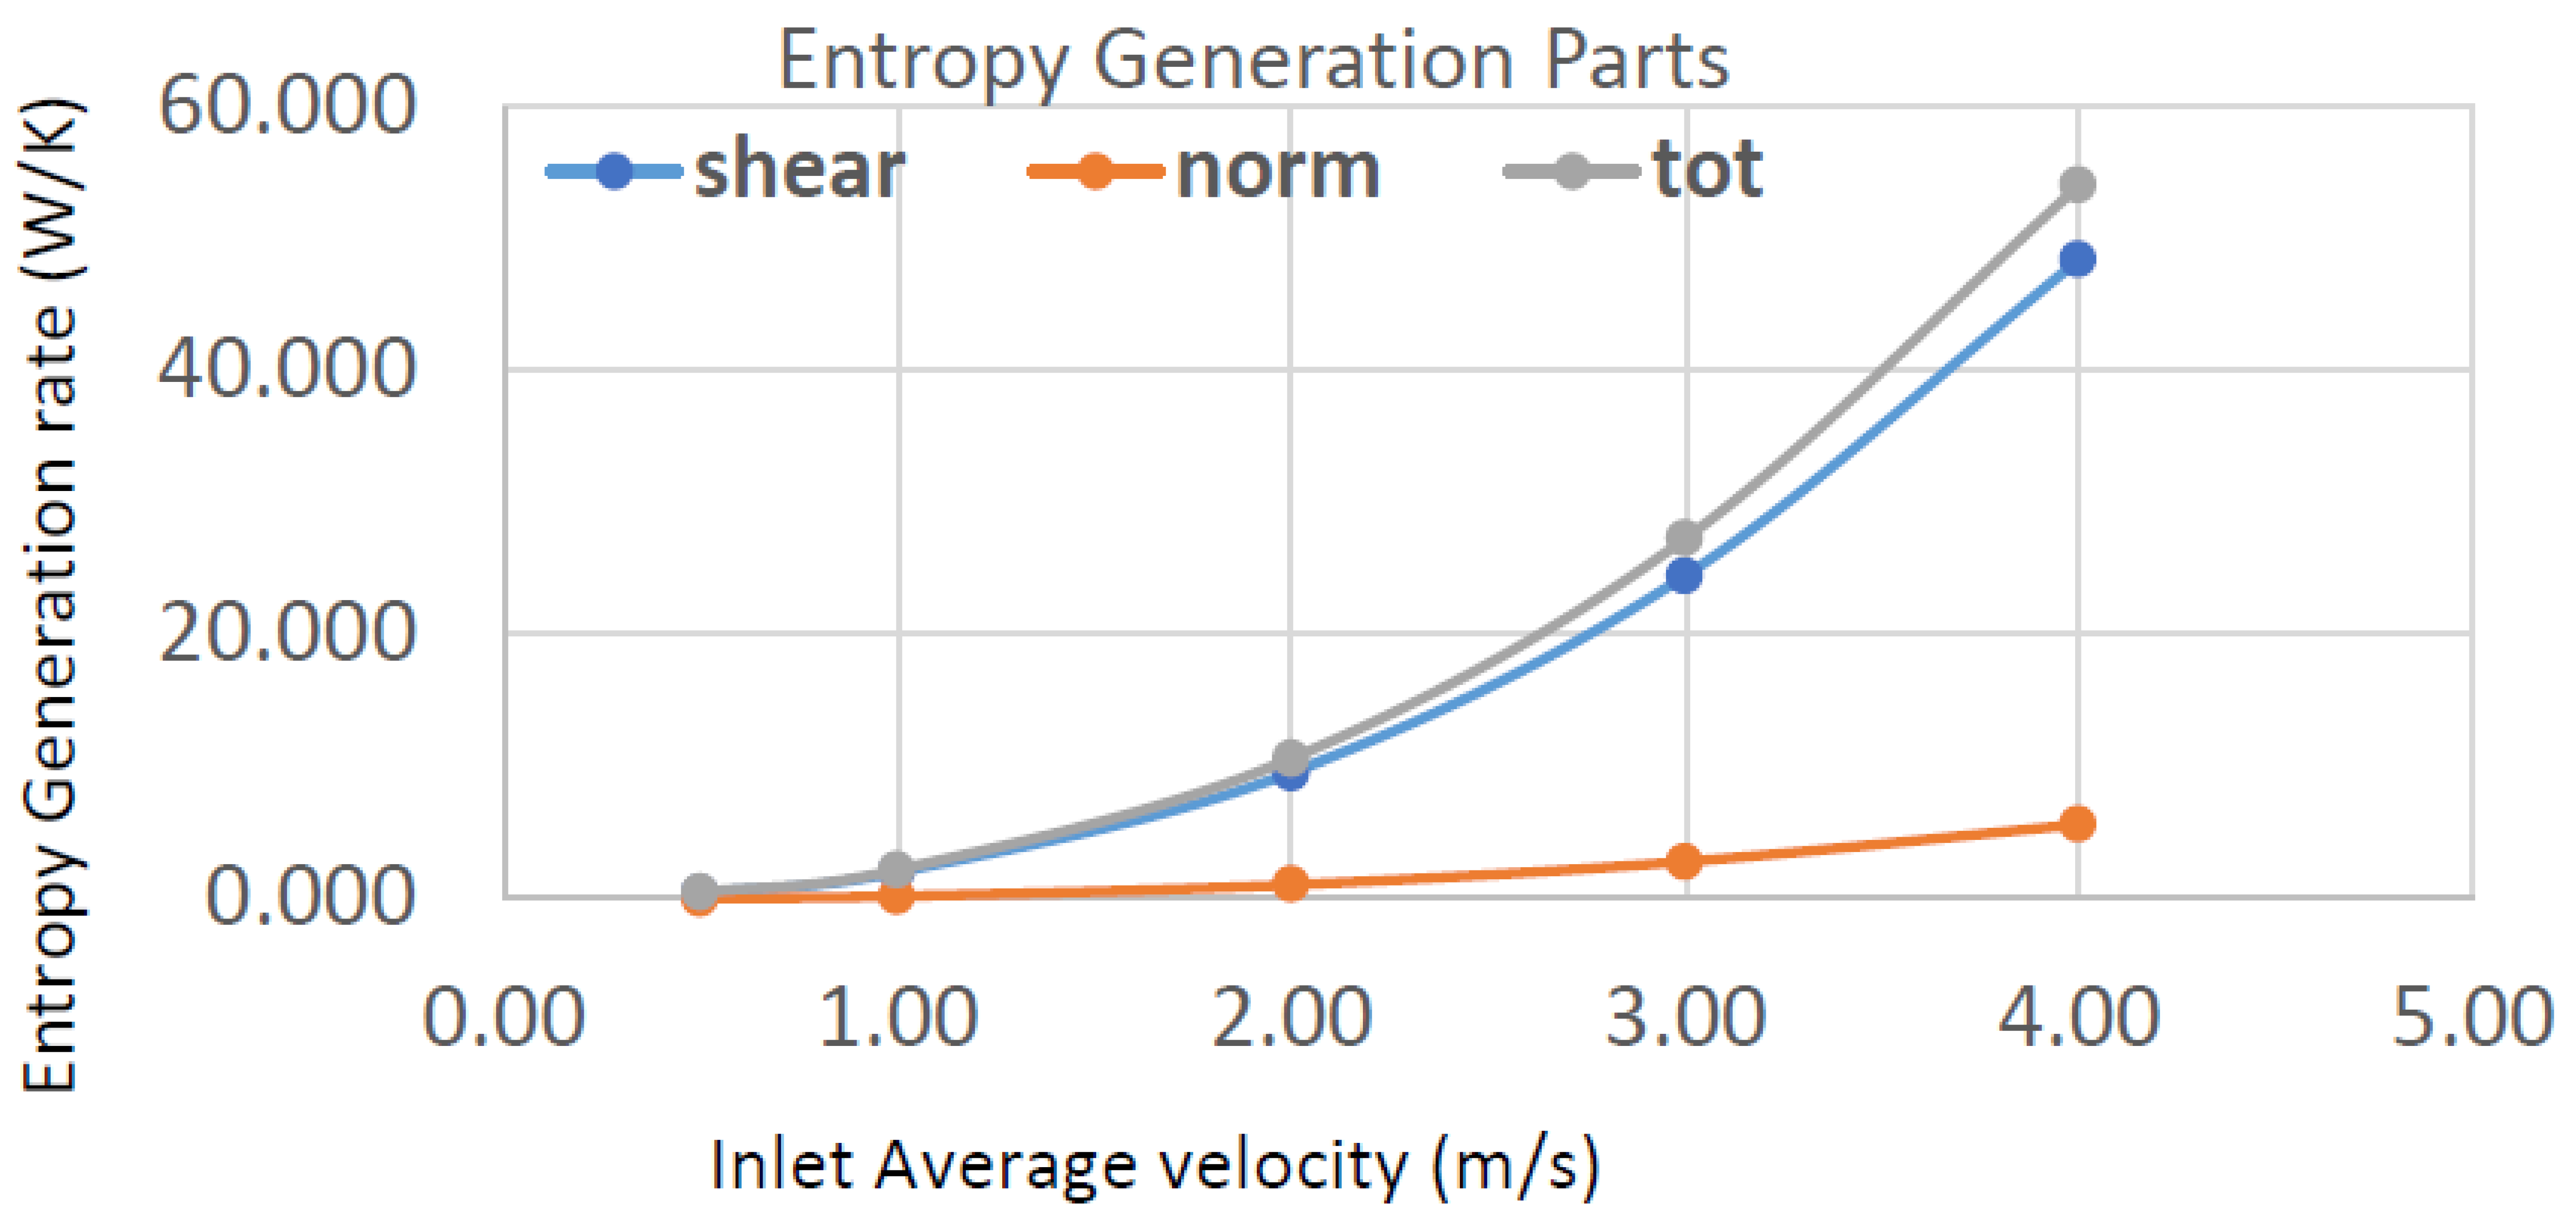
At the end of this section, it would be useful to compare the entropy generated by the shear stresses against the entropy generated by normal stresses. The numerical model computes these quantities separately. The volume-integrated entropy rates caused by normal stresses, shear stresses, and total stresses are shown in
Figure 15. The best fit (R = 0.9997) through all three curves resulted in three functions of U
2. More importantly, the curves show that the entropy generation rates are mainly caused by the shear stresses. For the data points, the average entropy rate caused 90% of the total entropy rate. Only 10% or less is caused by normal stresses.
We can also estimate that at least 80 to 90 percent of the entropy generation is produced in the vicinity of the contraction corner. Removing the corner or rounding the corner can result in major energy savings or reduction of losses. As a replacement for sharp or abrupt contraction (
Figure 17a), we recommend the following rounded contraction, as shown in
Figure 17b. If the radius of the contraction R is more than 15% of the smaller diameter, the losses will be than reduced by around 90% as validated experimentally [
4].
With advanced manufacturing techniques, the cost of making rounded-edge contractions is similar to sharp-edged contractions.
Finally, it is important to note that rounded edge contractions have many advantages including (i) reduced energy losses and hence more efficient system, (ii) reduce circulation zone since the vena contract region is removed, (iii) reduce pipe vibration, and (iv) reduce erosion rates caused by abrupt contraction [
21] and hence extend the life of equipment. The contraction exists in thousands at the entry of tubes in shell and tube heat exchangers which cost millions of dollars. Rounding the inlet of tubes will make the heat exchangers more efficient and have longer lives.
3.3. Detailed Investigation of Contraction Losses
In the previous section, the entropy generation field has shown that most of the losses in the contraction are created by the sharp edges of the contraction. Limited experimental data under turbulent regimes suggested that rounding the edges would reduce these losses. We now present an investigation of the effect of rounding the sharp edges for both laminar and turbulent flow conditions. We will start our discussion with the effect of Reynolds’ numbers on the contraction losses. We will present the effect of Contraction Ratio on these losses, and we will look into the effect of rounding radius for both laminar and turbulent flow conditions. In the next sections we will present the energy losses in terms of the pressure loss coefficient K. This is equivalent to presenting the entropy generation as indicated by Equations (7) and (11).
3.3.1. Effect of Reynolds Number Re2 on Normalized Contraction Losses
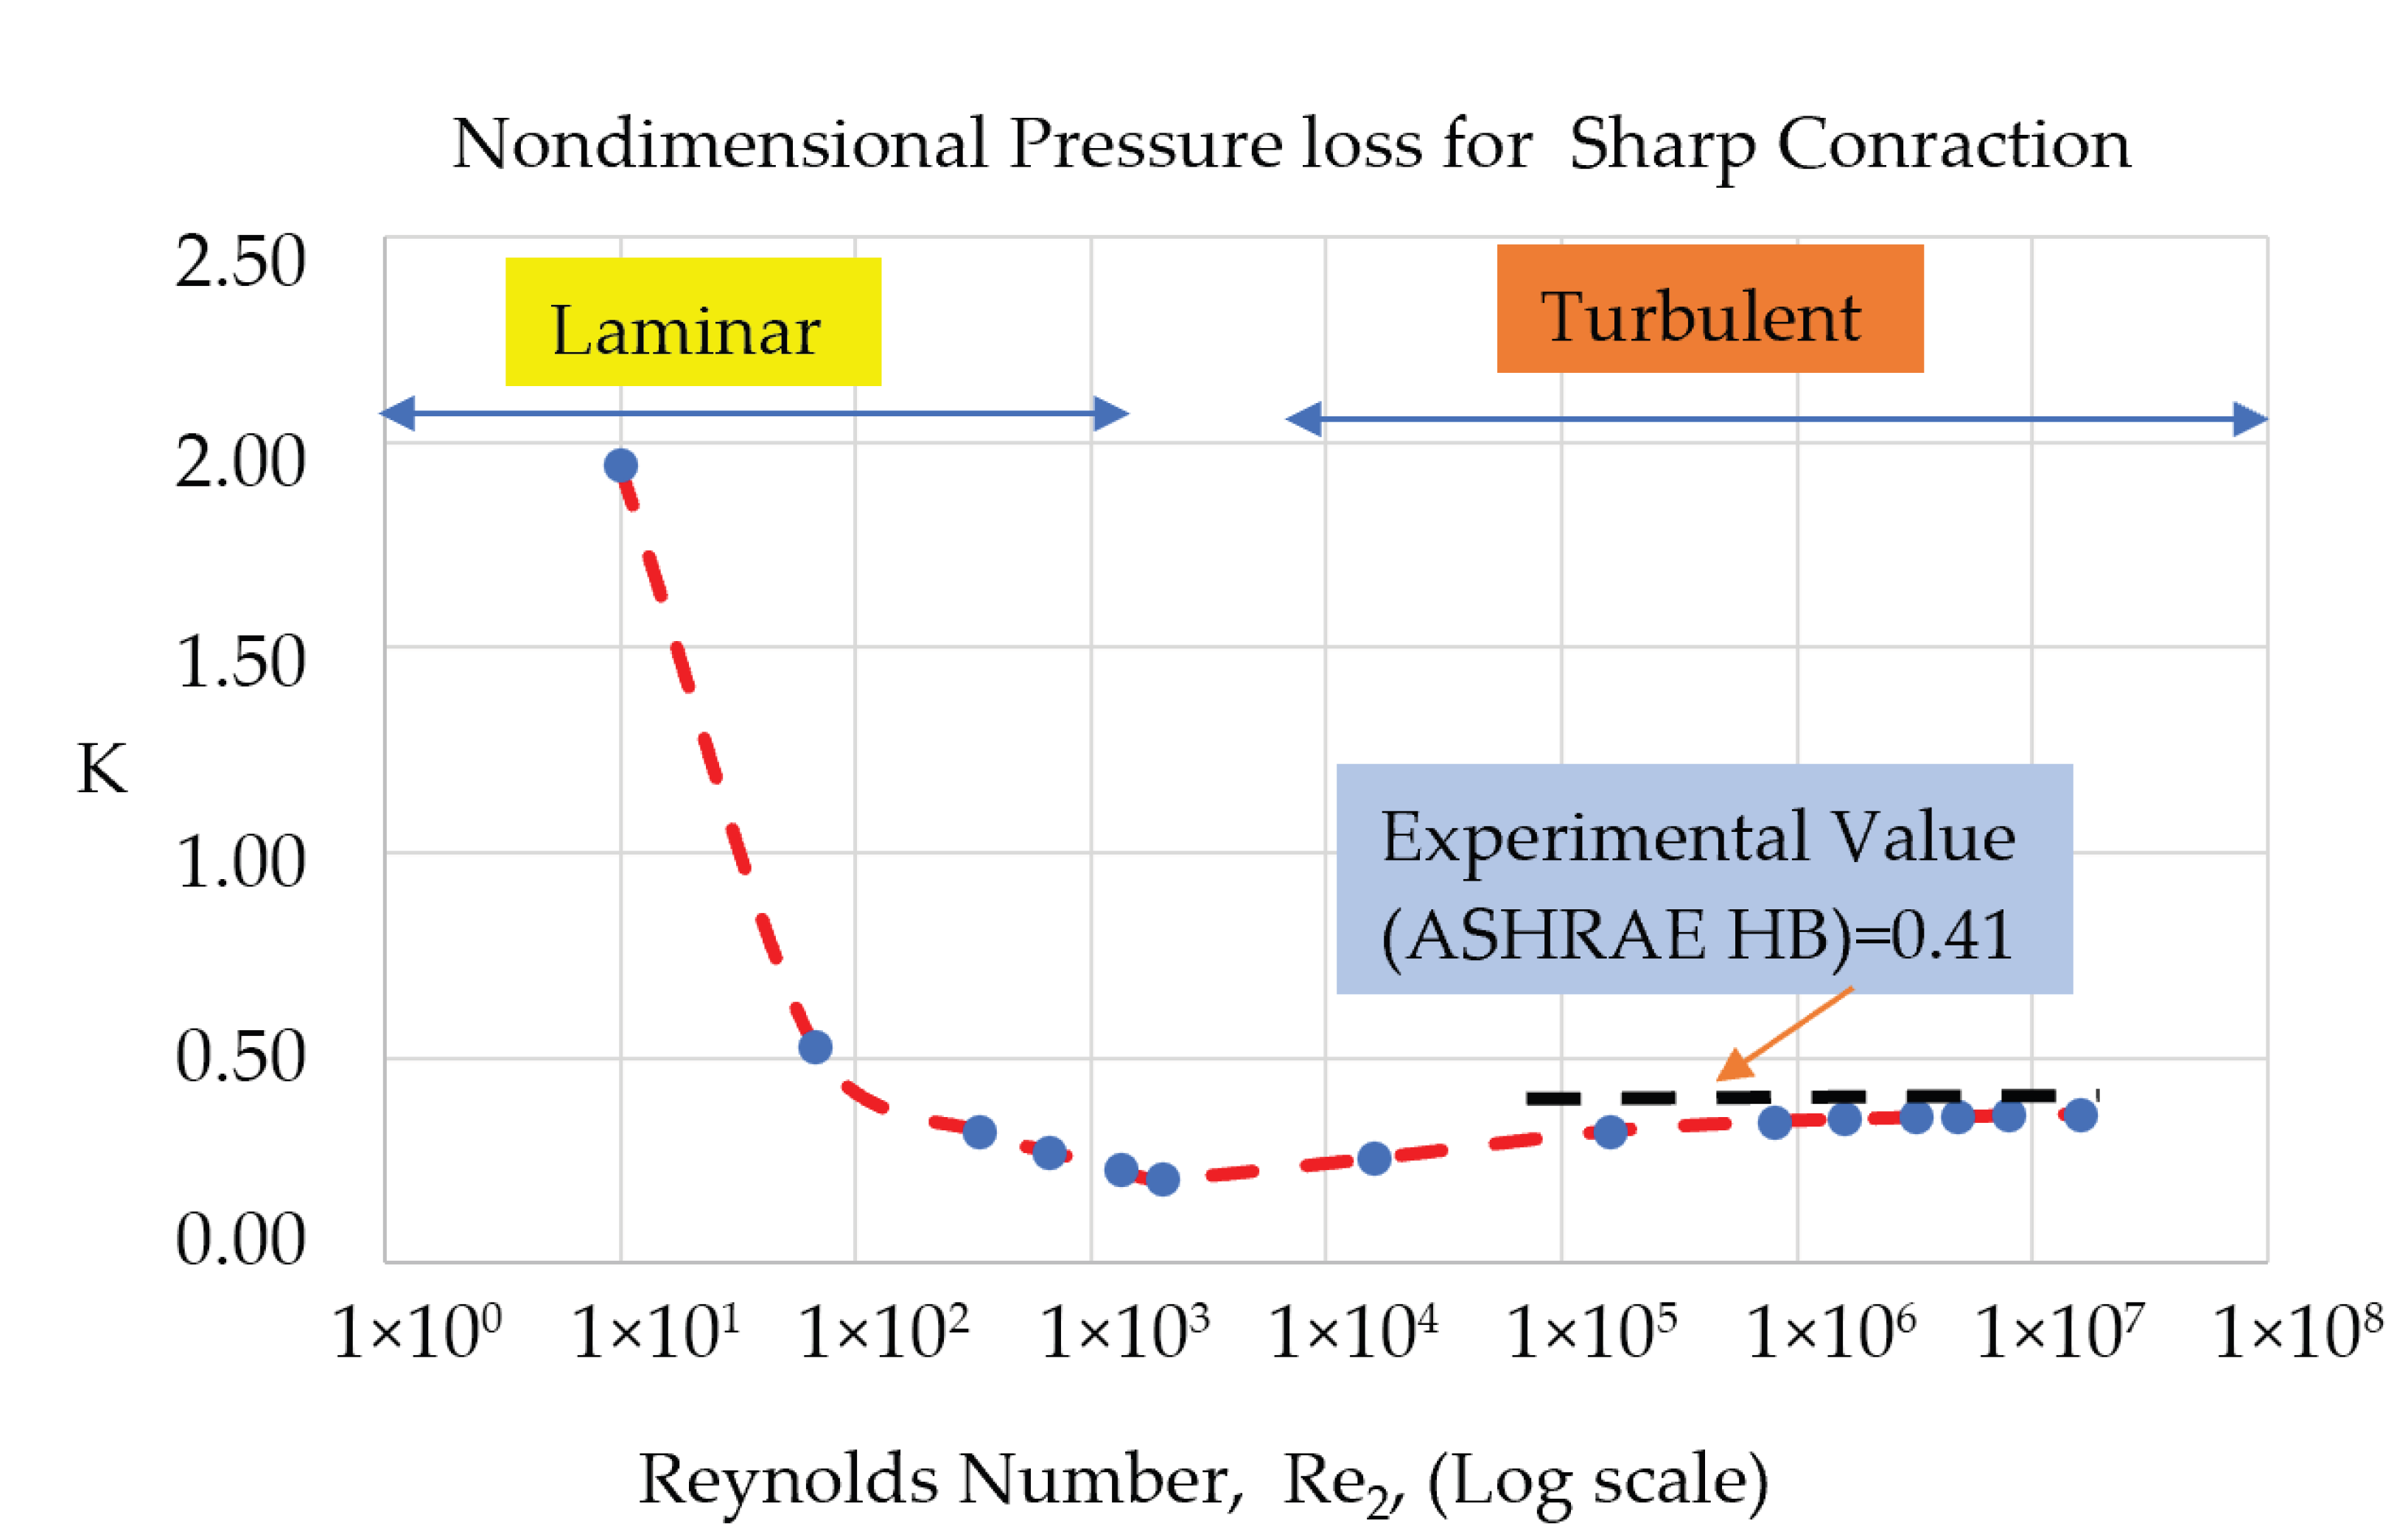
The numerical results of the nondimensional pressure loss coefficient K = ΔP/(0.5
ρ) are presented in
Figure 18. These results cover both flow regimes starting from the laminar regime at Re
2 = 10 up to Re
2 of 2013 and the turbulent regime from Re
2 = 2 × 10
4 up to Re
2 of 2 × 10
7. For the laminar case, the normalized losses are very high, and they decrease sharply as the Reynolds number increases. In the turbulent regime, the loss coefficient starts with a low value and then converges to an almost constant value of 0.40, which is in very good agreement with experimental data reported by AHSRAE Handbooks [
22]. For the laminar range, there is only one conference paper published by Ajayi et al. [
23]. The experimental data for the turbulent regime also agrees with ASHRE experimental data. For the laminar range, the trend is similar to the present findings, but the spread of experimental data is very wide, and it is difficult to draw any conclusions.
In order to understand the fluid dynamic phenomena for these trends, we have presented the streamlines of some of the cases in
Figure 19.
We observe that the region of the fluid that is stagnated by the contraction (red color) is very large for Re
2 = 10 and decreases rapidly as we move to Re
2 = 2013. For the turbulent flow regime, we observe that the area affected by the contraction is almost the same for all turbulent Reynold’s numbers studied, reflecting exactly the behavior of the loss coefficient K, plotted in
Figure 19. In other words, the
vena contracta region is much bigger in laminar flow and is a strong function of the Reynold’s number. In turbulent flow the
vena contracta region is almost the same for all Reynold’s numbers.
It turns out that the nature of the flow regime is very important in this case. This behavior is similar to that of viscous losses manifested in the famous Moody diagram or for the pressure coefficient in an orifice flow meter. In fully turbulent flow conditions, the transport of momentum is dominated by turbulence or vigorous mixing. We expect that the shape of the vena contraction will not change much since we have fully turbulent conditions. In the laminar regime, the momentum transport is governed by the dynamic viscosity; hence, the transport between different layers of the fluid is weak. As the Reynolds number changes, stronger transport is imposed by the increase in velocity or decrease in viscosity (for a fixed shape) and hence the shape of the vena contracta is not a strong function of Reynold’s number.
3.3.2. Effect of Contraction Ratio Under Laminar Flow Conditions
The effect of contraction ratio D
2/D
1 on nondimensional contraction pressure losses K is presented in
Figure 20. Experimental data for abrupt contraction under laminar flow conditions are very rare, and the author could not find any data to compare to. The only experimental data available is given for turbulent flow in the ASHRAE handbook [
22] as presented in many Fluid Mechanics textbooks [
14]. The effect of contraction ratio on K is presented in Reference [
4]. For the case of D2/D1 = 0.5, the present result (K = 0.4) is within published experimental data of (K = 0.41) as indicated in
Figure 17.
The results show that K decreases rapidly from a value of K = 0.6 for D
2/D
1 = 0.25 to a value of K = 0.037 for D
2/D
1 = 0.75 and it is expected to drop to K = 0 as D
2/D
1 = 1, which is the case of no contraction. Again, we look at the vena contracta diameter
Dvc in
Figure 21 for different contraction ratios and we observe that D
vc keeps on decreasing as the D
2/D
1 increases, which indicates smaller losses. This argument was first used by Kays [
24] where he derived a numerical correlation for K which is a strong function of D
vc.
3.3.3. Effect of Rounding Radius r/D2 on Normalized Contraction Losses
In standard Fluid Mechanics Textbooks, the famous example of rounded entrance is usually taught in introductory fluid mechanics courses. It turns out that the data is only valid for turbulent flow conditions. No data is published for laminar flow conditions. Furthermore, there is no data published for pipe contraction for both laminar and turbulent conditions. We now present the results for the effect of rounding radius on the contraction pressure loss coefficient K.
Laminar flow Condtions
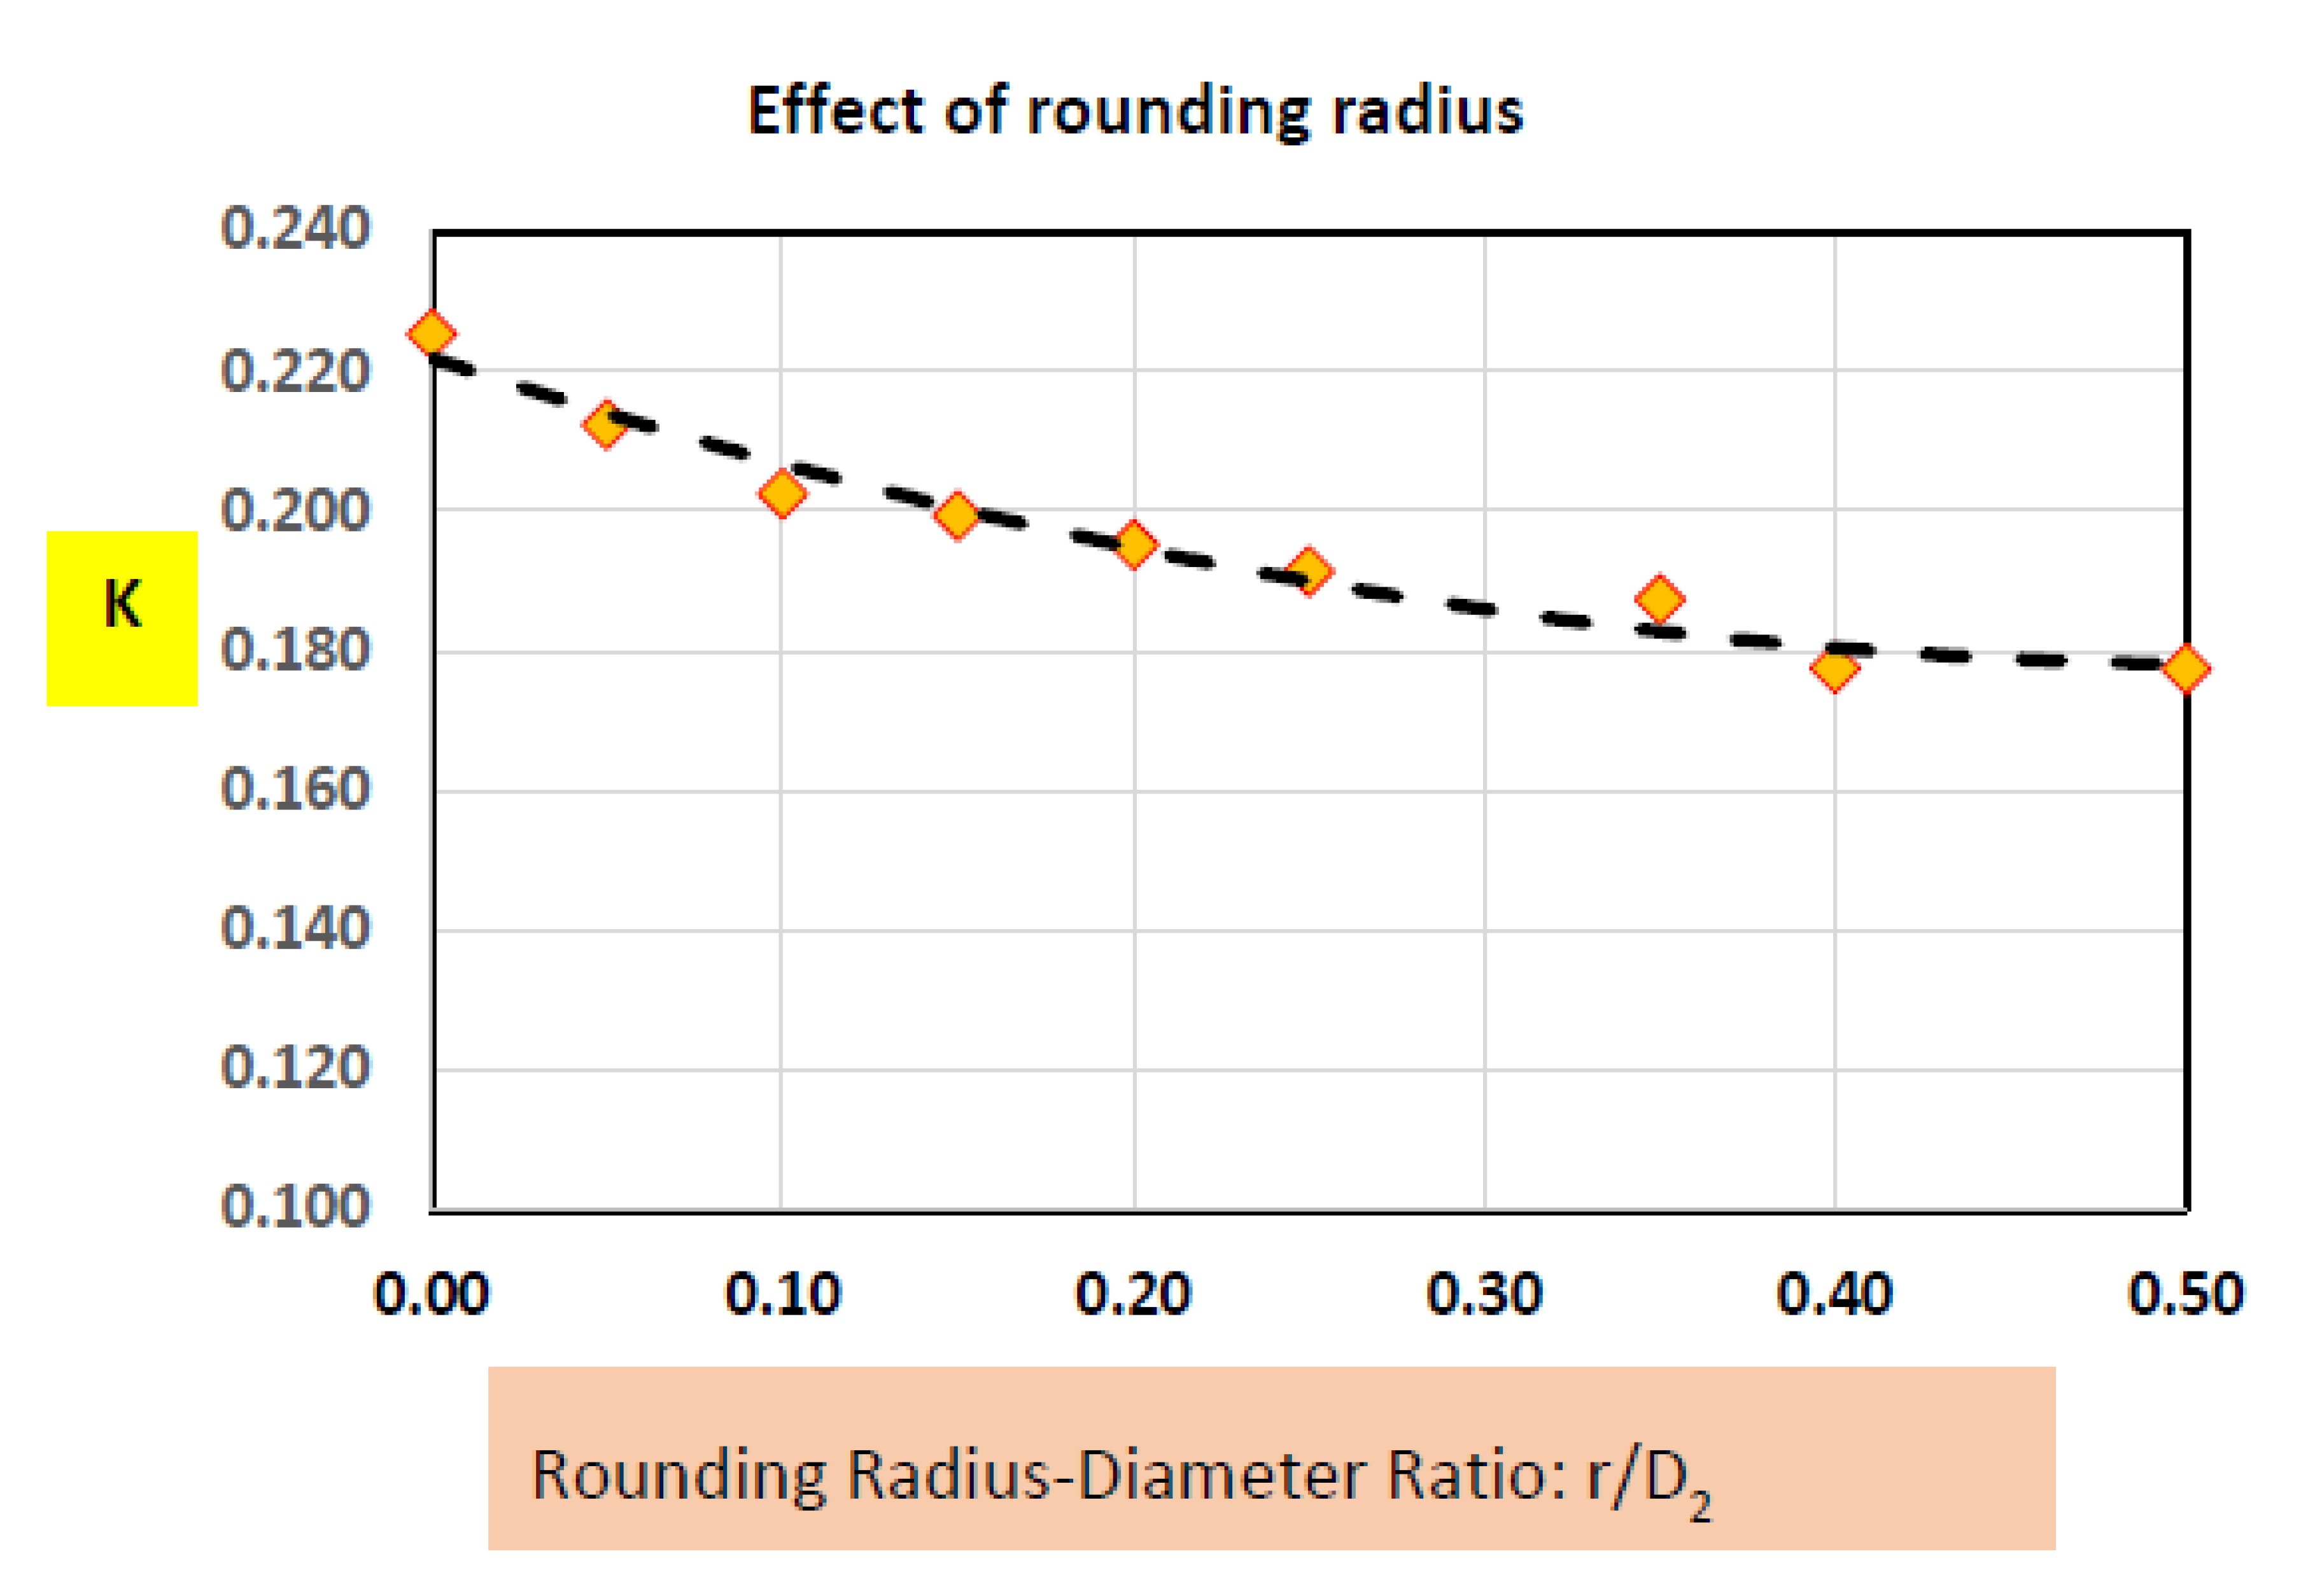
Introducing a rounded corner in the contraction does reduce the losses as seen in
Figure 22. In comparison to the sharp contraction (r/D
2 = 0), the largest possible rounding of r/D
2 = 0.5 resulted in a 22% loss reduction. In the case of rounded entrance, losses can be reduced by as much as 92% as reported from experimental findings [
4]. In order to verify our computational models, we have used the
k-ω-SST turbulence model to look at the effect of rounding radius under turbulent flow regime as presented in the next section.
Turbulent Flow Conditions:
To investigate the effect of rounding radius, we have fixed the Reynolds number at 3.2 × 10
6 and contraction ratio D
2/D
1 to 0.5. Introducing a rounding radius ratio of 2.5% resulted in reducing the losses by 77%. A rounding radius of 10% has resulted in reducing the losses by 96%. The results are shown in
Figure 23 with triangular symbols. This is a significant reduction. These results are very similar to the experimentally reported loss reduction [
4] for rounded entrances, which are also plotted in
Figure 23 for comparison. Under turbulent flow conditions, our present investigation shows that the losses in an abrupt contraction are reduced more effectively in comparison to the rounded entrance. This may be due to the fact that the flow in a pipe contraction does not go through as much rotation (vorticity) as in the case of an entrance of a pipe connected to a large reservoir.
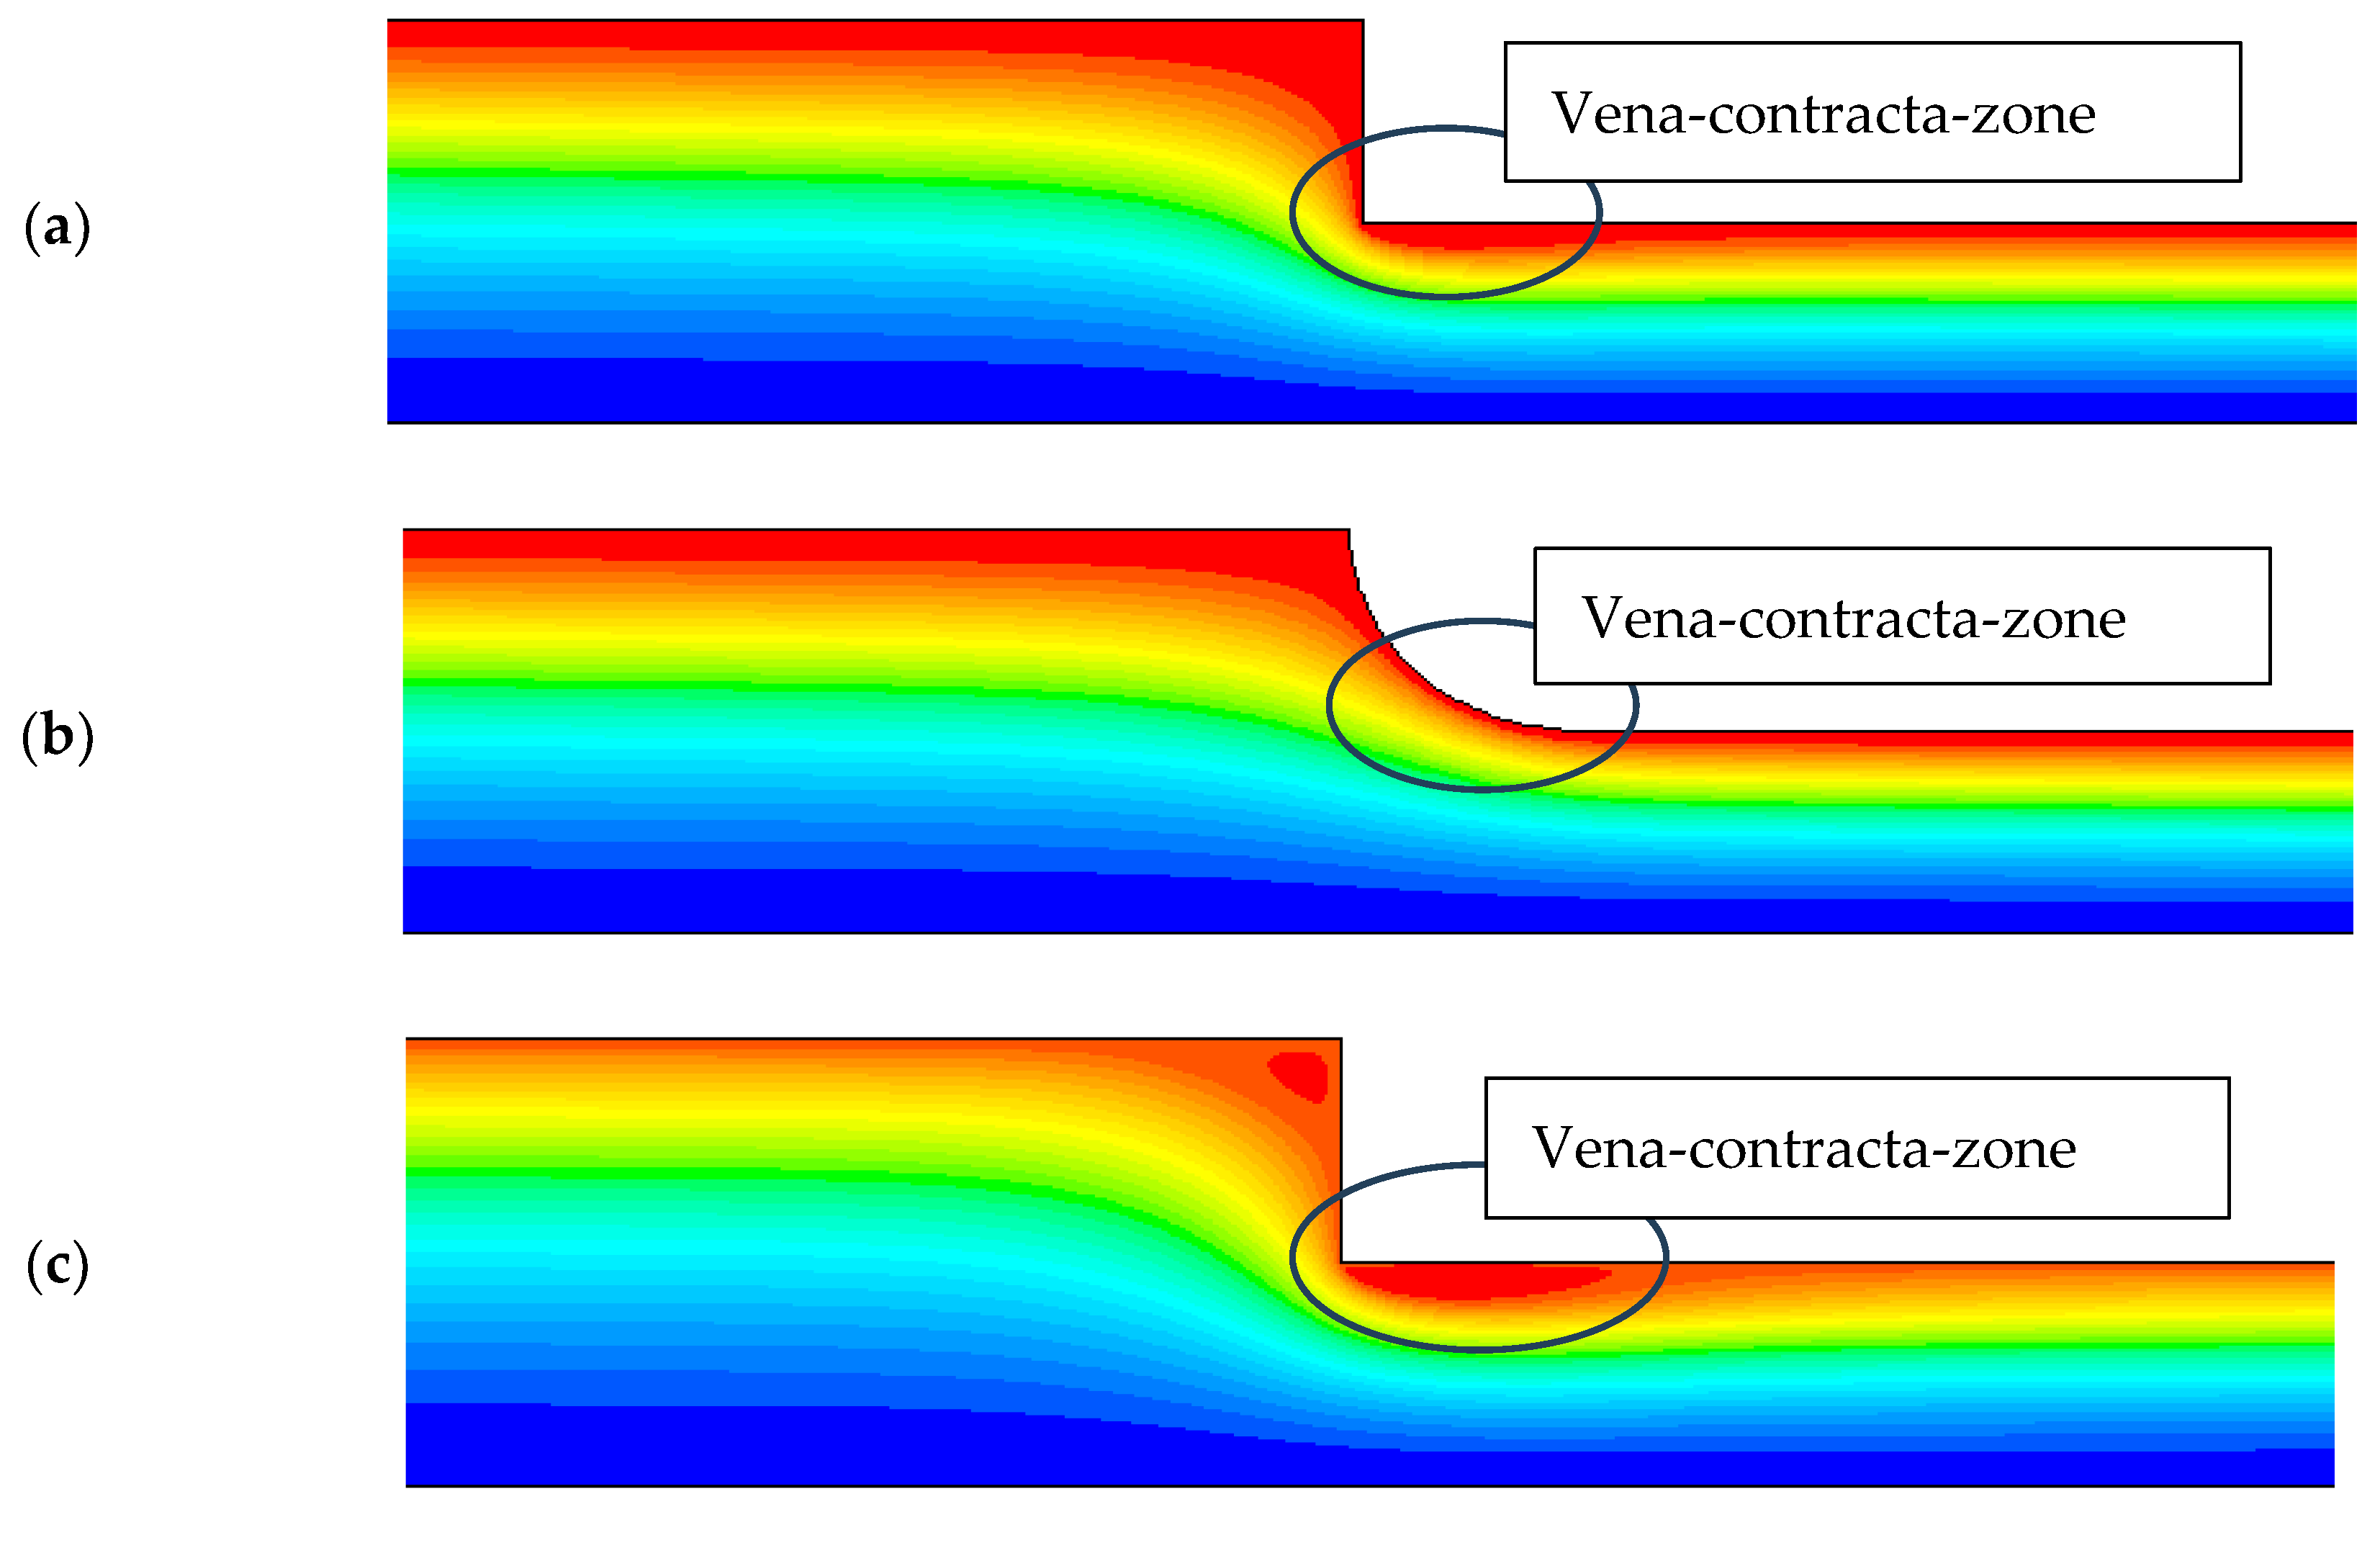
To better understand the difference between the effect of rounding the contraction on laminar flow vs. turbulent flow, we look at the flow streamlines in 4 cases presented in
Figure 24. These cases are sharp contraction flow streamlines for laminar and turbulent flow compared to rounded contractions for both flow regimes.
Again, when we look at the vena contracta (V-C) zone for the 4 cases, we observe that in the laminar case, the sharp contraction produces a smaller V-C zone in comparison to the V-C zone produced by turbulent flow. Introducing a rounded contraction with the maximum rounding radius (100 mm) reduced the V-C zone by a relatively small amount (22%) compared to the rounded contraction in the turbulent case, where the V-C zone was almost completely eliminated despite using a small rounding radius of 20 mm in the turbulent case compared to 100 mm in the laminar case.
The large loss reduction under the turbulent flow regime was discovered earlier for the case of pipe entrance (D
1/D
2 very large), as indicated in
Figure 23. This is documented in most undergraduate textbooks (Fox and McDonald [
14], White [
17], and Elger et al. [
25]). Most of the textbooks refer to the ASHRAE Handbooks [
22]. For example, Elger et al. report an experimental value of K = 0.50 for a sharp pipe entrance and K = 0.03 for a rounded pipe entrance for a rounding radius to pipe diameter ratio (r/d) greater than 0.2. This is a reduction of 94%, which is very close to the present results. All textbooks indicate that these results are for the turbulent flow regime. The present study considers pipe contraction and does not consider pipe entrance and investigates the effect of rounding radius systematically for the turbulent regime. Furthermore, the present results cover the laminar regime as well, which is not reported in any textbook.


