1. Introduction
Between late December 2019 and early January 2020, southern Puerto Rico was struck by a damaging earthquake sequence, featuring 15 events with magnitudes exceeding 5.0. The M5.8 earthquake on 6 January and the M6.4 event on 7 January were particularly destructive, triggering the collapse of numerous soft-story reinforced concrete (RC) houses and an operating three-story RC school. These failures underscored the region’s acute vulnerability to seismic events and prompted efforts by the Puerto Rico Strong Motion Program to enhance construction codes and regulations based on lessons learned.
Masonry infill panels are widely used globally for architectural needs like thermal and sound insulation. However, their interaction with the surrounding frame under lateral loads is a complex problem that has been extensively studied for decades, yet often remains neglected in seismic codes, where they are typically treated as non-structural components. Neglecting their influence can lead to substantial inaccuracies in predicting a structure’s lateral stiffness, strength, and ductility. Experience from recent destructive earthquakes (e.g., Turkey 1999, Central Peru 2007, China 2008, L’Aquila 2009, Emilia 2012, and the 2020 Puerto Rico sequence) has repeatedly confirmed their significant role in the seismic performance of RC buildings. This interaction often results in highly nonlinear inelastic behavior, stemming from the cracking and crushing of masonry, stiffness, and strength degradation, and complex panel–frame interface mechanisms.
Historically, early modeling approaches proposed representing infills with simplified equivalent compression-only braces or single diagonal struts, known as “macromodels”. While these offer computational efficiency for large structures by treating the entire infill as a single unit, they are often unable to capture local phenomena or intricate force transfers. More sophisticated “micromodeling” approaches, such as finite element methods, can predict detailed responses but are often too time-consuming for the analysis of large-scale structures. A significant challenge lies in the high degree of nonlinearity and degradation inherent in the interaction between brittle materials like masonry and concrete, coupled with a wide scatter in the experimental data, making it difficult to generalize existing analytical models with their numerous parameters.
The presence of masonry infills can significantly alter a building’s seismic response, often in unintended and adverse ways. Increased stiffness due to infills can raise the natural frequency, potentially attracting higher seismic demands. Acting as diagonal struts, infills can induce additional internal forces and increase seismic shear forces at beam–column joints, potentially activating brittle failure modes, undesirable soft-story failures, or short column effects, especially in older buildings designed without modern seismic provisions. Furthermore, the irregular distribution of infill walls in the plan or elevation can lead to severe localized damage, soft-story collapse mechanisms (where a ground floor is left open while upper stories are infilled), or negative torsional effects that concentrate inelastic deformation demands on flexible sides of a building. Recent studies emphasize the importance of accounting for the shear failure of columns induced by infill–frame interactions.
To address these complexities, researchers have continuously sought to improve analytical models. The authors in [
1] proposed an analytical macromodel based on an equivalent strut approach with a smooth hysteretic model that accounts for stiffness and strength degradation and pinching, implemented for the quasi-static cyclic and dynamic analysis of masonry-infilled frames. This model addressed the need for an efficient and accurate computational model suitable for the time–history analysis of large structures. The authors in [
2] further developed a “three-strut model” which replaces each masonry panel with three struts, providing a more refined representation of force–deformation characteristics based on orthotropic masonry behavior, aiming to better predict the stiffness and lateral load capacity, especially for corner crushing failures and interactions among panels in multi-story buildings. This multi-strut approach, while more complex in the parameter calibration, is useful for accounting for the shear transmission in critical regions. The authors in [
3] investigated the “irregularity effects” of masonry infills, highlighting that even when current code provisions (like Eurocode 8) for irregularity are applied, neglecting infills can still be unsafe, and they can significantly influence inelastic responses and failure mechanisms, including unexpected torsional and soft-story effects and an increased column shear demand.
This study focuses on the seismic evaluation of informally constructed RC houses in Puerto Rico, characterized by the typical geometry and reinforcement details observed in the collapsed structures during the 2020 earthquake sequence. While the problem of infilled frames is well-documented, a significant gap exists in applying advanced simulation techniques to precisely understand the failure mechanisms of these specific informal typologies and to assess the efficacy of simplified, locally recommended shear-wall-based retrofitting strategies. Our work provides a crucial bridge between field-based seismic damage evidence from a specific event (the 2020 Puerto Rico earthquake sequence) and a modern, simulation-based performance evaluation for a prevalent informal building type in a seismically active region. This paper not only investigates the seismic behavior of as-built informal structures, but also assesses the practical implications of simplified retrofit measures, a less explored area compared to studies on formally designed or new constructions. The application of bidirectional IDA with spectrally matched, near-fault pulse-like ground motions adds novelty and realism to the assessment, allowing for a more comprehensive capture of complex dynamic effects like higher modes and torsional responses that are often inadequately addressed by traditional static procedures. The findings offer direct lessons for enhancing construction codes and regulations by incorporating insights from recent seismic events.
4. Lateral Response Characterization via Quasi-Static Lateral Analyses
Quasi-static lateral (pushover) analyses were conducted to characterize the lateral response of the structural prototypes. This method involves the incremental application of lateral forces to the structure while simultaneously monitoring deformations at the element, section, and material levels. This process allows for the evaluation of inelastic material behavior and the determination of internal force distributions. While acknowledging that pushover analyses provide an approximation of seismic behavior and do not fully capture dynamic effects such as the ground motion duration and frequency content, they serve as a valuable initial assessment tool, offering insights into lateral behavior, expected failure mechanisms, and facilitating the definition of key performance limit states before dynamic time–history analyses are performed. The load pattern used was proportional to the first flexural modal shape in each direction. It is important to note that for structures irregular in the plan and elevation, like the case-study building, traditional unidirectional pushover analyses, typically employing a fixed lateral load distribution, are generally inadequate, as they can lead to an underestimation of displacements, damage, and may not accurately capture the distribution of forces and deformations due to substantial in-plane torsional effects. Various advanced pushover methods, including modal pushover analysis, generalized pushover analysis, consecutive modal pushover analysis, the extended N2 method, adaptive pushover analysis, spectrum-based pushover analysis, and multimode pushover analysis, have been developed to address these complexities [
14,
15,
16,
17,
18,
19,
20]. However, it is precisely this acknowledged inadequacy of conventional pushover analyses for torsionally sensitive structures that primarily motivated our adoption of a more rigorous bidirectional incremental dynamic time–history analysis as the core of our assessment methodology, as detailed in the subsequent section.
Performance limit states were defined based on both material strain and structural drift criteria. Material strain limits, derived from the fiber-based modeling approach, included the tensile yielding of longitudinal reinforcement (Ɛy = 0.0021), concrete serviceability (Ɛc = 0.003 in compression), and the onset of rebar buckling. Rebar buckling was estimated based on experimental results by [
21], which indicated that bars with high L/d ratios, as in this study, buckle shortly after reaching a compressive yield. Consequently, the rebar buckling limit state was set at the compressive yield strain of the longitudinal reinforcement.
Infill wall damage, while not typically considered a primary structural concern, can significantly impact serviceability and occupant safety. Based on a comprehensive literature review [
22], excessive cracking and block crushing in infill walls were defined as limit states at 0.56% and 1.2% inter-story drifts, respectively.
The software used for modeling, and most commercial packages, does not capture collapse. In the case of the structures modeled, it means that in the weak axis, it could provide unrealistic large deformations while the structural elements remain almost elastic. For the global structural performance, FEMA 356 recommends a 4% drift limit for reinforced concrete frames. However, given the observed poor reinforcement detailing at the beam–column joints during the 2020 earthquake collapses, a more conservative, judgment-based collapse prevention drift limit of 2.9% was adopted. This value was specifically chosen as a conservative envelope for the informal construction typology in question, directly reflecting the vulnerability observed in the field, where failures were primarily attributed to excessive first-story deformations along the weak axis. It is explicitly acknowledged that a comprehensive field or laboratory calibration to rigorously correlate specific damage levels with engineering demand parameters, such as drift, remains a crucial and necessary area for future research. Additionally, element shear failures were monitored by comparing shear demands with shear strength predictions obtained using the modified UCSD shear model [
23].
For brevity, only the pushover analysis results for the flat terrain models are presented herein. The general behavior and failure mechanisms observed in these models are representative of the other models, with detailed results available in the first author’s thesis [
24].
Figure 6 presents the pushover curves for the as-built (left) and retrofitted (right) flat terrain models. The right vertical axis depicts the base shear, while the left vertical axis represents the base shear-to-weight ratio (
v/
w). The lower horizontal axis illustrates the total (or average) drift, calculated as the ratio of the roof displacement to the total building height, and the upper horizontal axis shows the total roof displacement.
The as-built model (
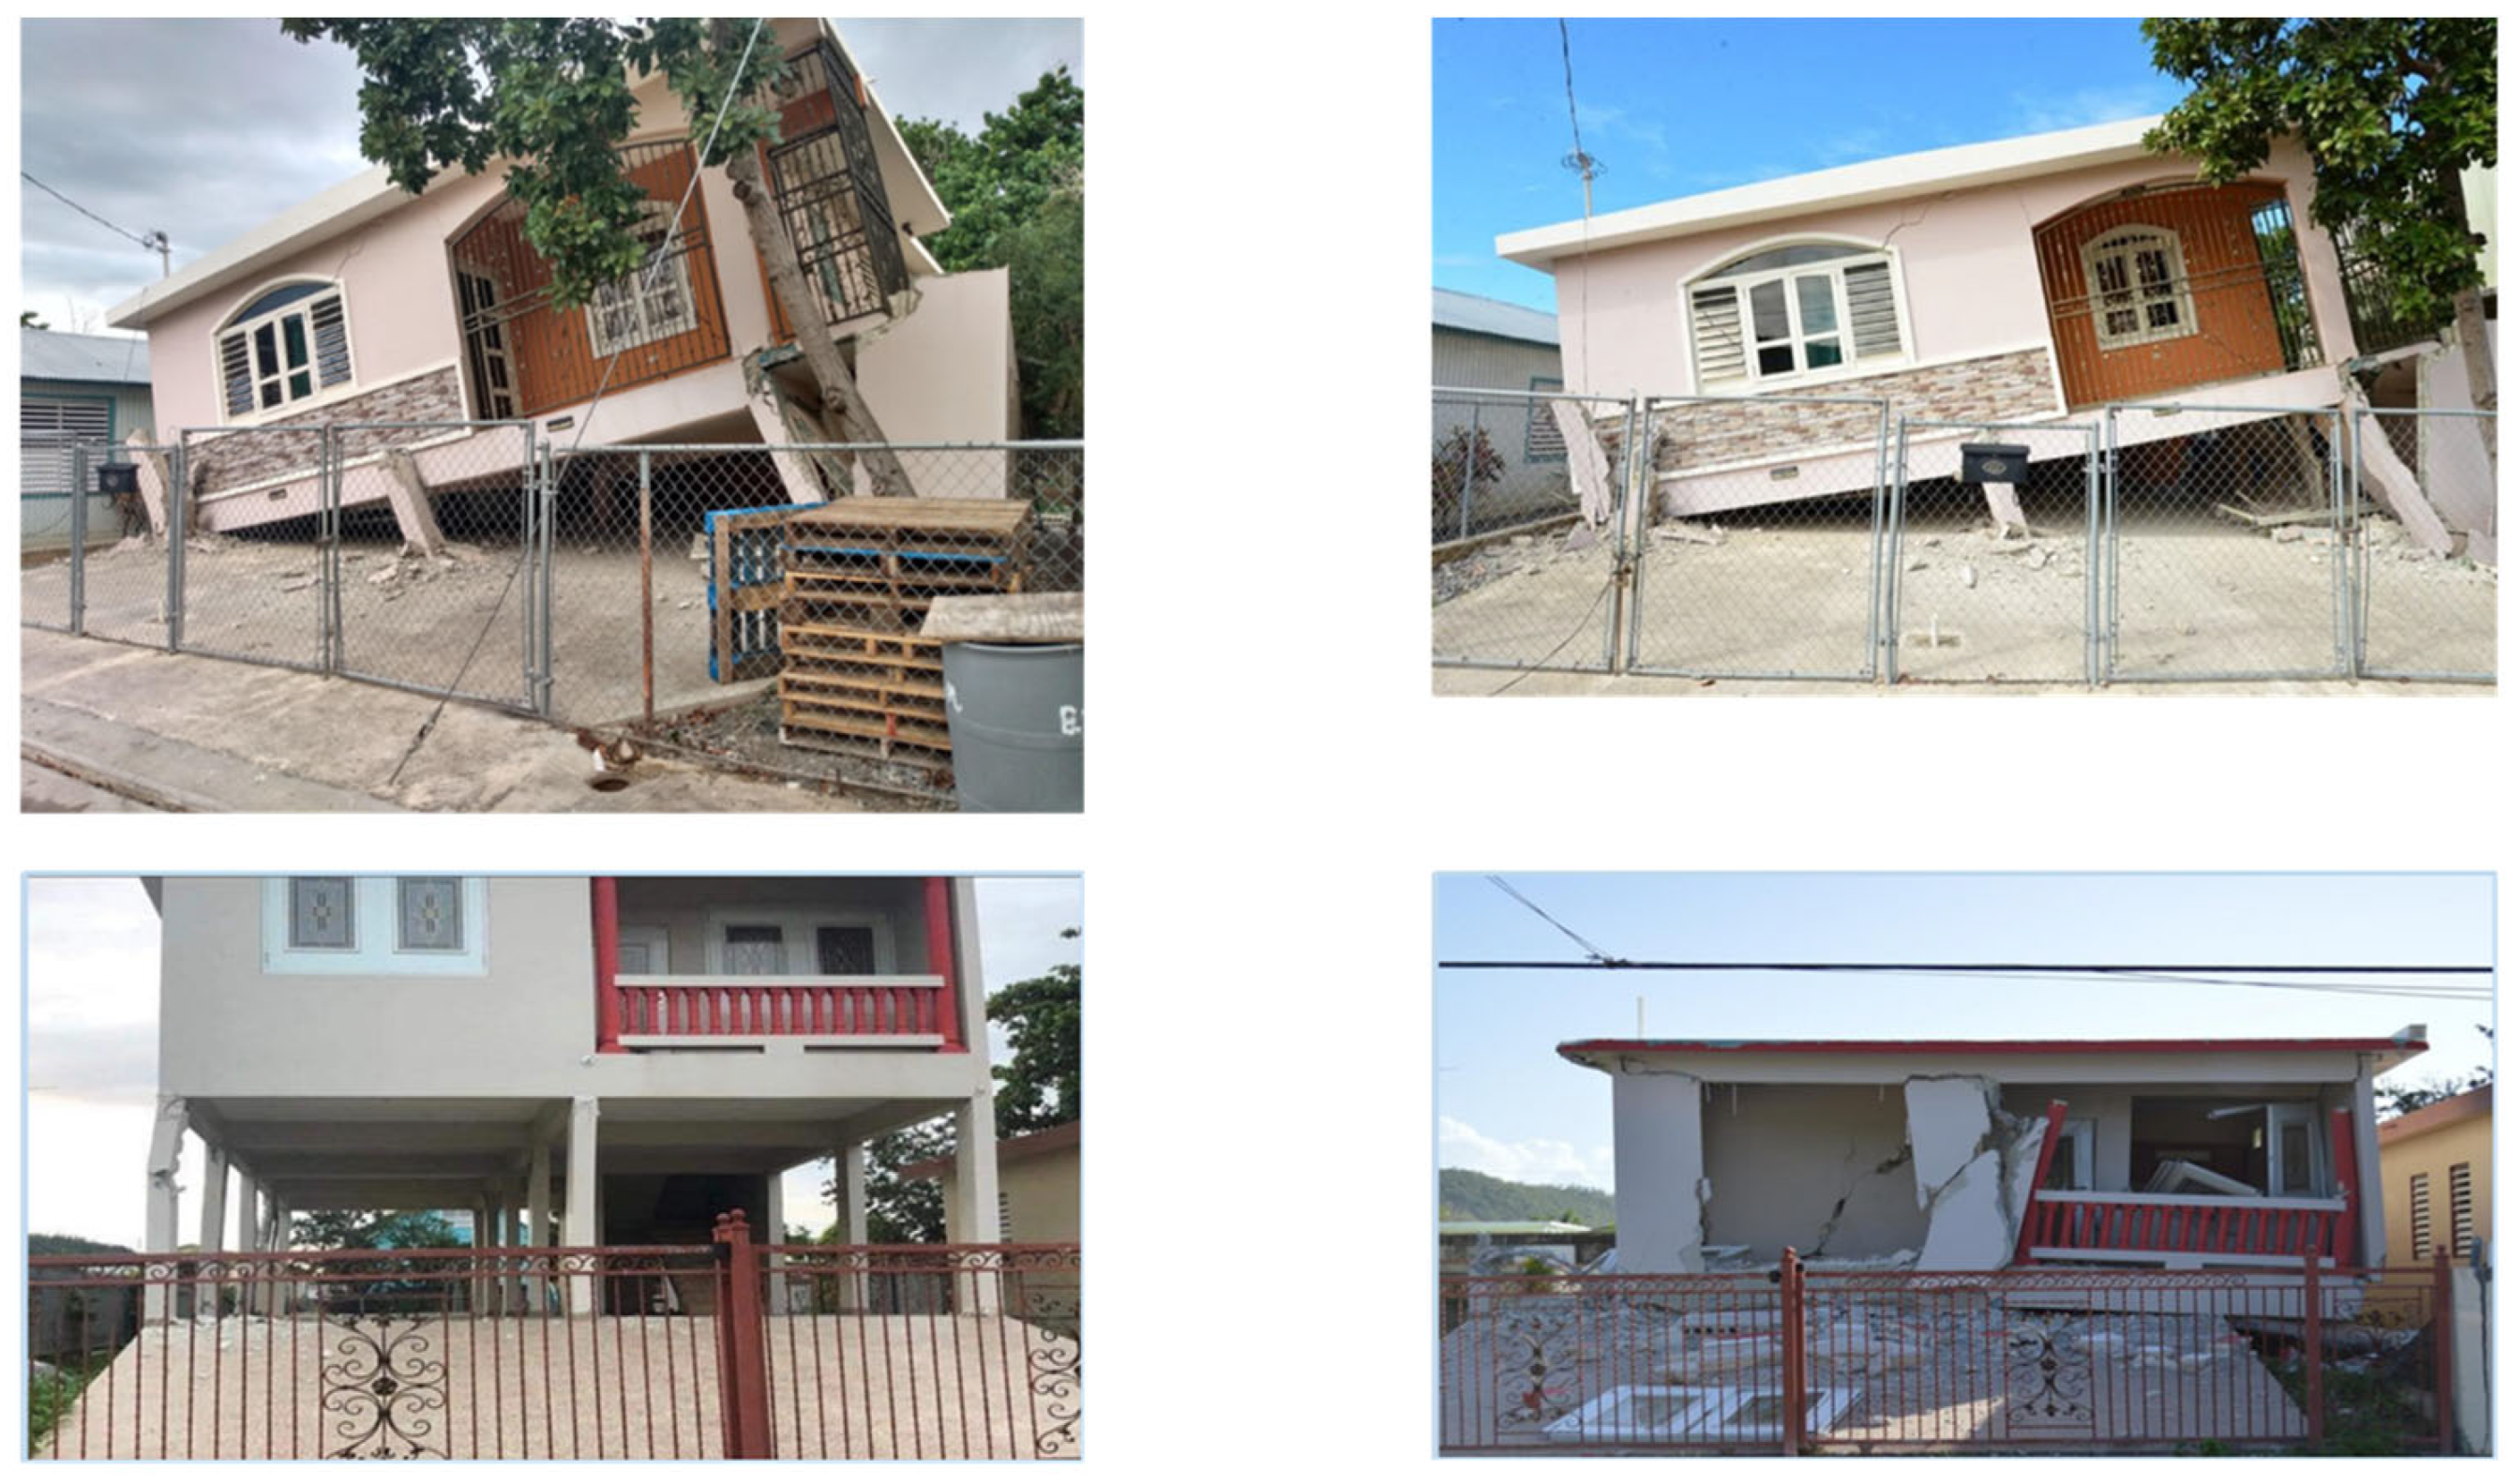
Figure 6-left) demonstrates a significant disparity in the lateral response between the principal axes. Specifically, the Y-axis exhibits approximately eight times greater stiffness and four times greater strength compared to the X-axis. Here, it is important to mention that all limit states were reached in the first story, indicating a concentration of inelastic deformations at this level. Furthermore, when subjected to lateral loading along the weak (X) axis, the excessive deformation limit state is reached shortly after initial yielding and well before the serviceability limit. These findings align with observations from the 2020 earthquake collapses, where failures were primarily attributed to excessive first-story deformations along the weak axis, while the second story remained largely elastic (
Figure 7).
In the retrofitted flat terrain model (
Figure 6-right), the addition of reinforced concrete (RC) shear walls significantly enhanced both the strength and stiffness of the structure. For pushover analysis along the strong (Y) axis, initial tensile yielding occurred in the shear wall added in the Y direction. However, subsequent limit states were observed in the second story, indicating a concentration of plastic deformations at that level. Conversely, when subjected to lateral loading along the weak (X) axis, the non-symmetric placement of the added shear wall induced in-plane torsion. This torsion resulted in increased demands on the first-story columns furthest from the shear wall, which subsequently governed all limit states. This phenomenon was specific to the flat and sloped terrain models, where the added shear wall introduced significant in-plane irregularities. It is important to note that traditional unidirectional pushover analyses are generally inadequate for structures exhibiting substantial in-plane torsional effects. This simplification can lead to an underestimation of displacements and damage in elements located on the stiff side of a torsionally sensitive structure. Moreover, torsional effects can significantly alter the distribution of forces and deformations, which a unidirectional pushover may not accurately capture. Therefore, a bidirectional, incremental, dynamic time–history analysis is implemented in the subsequent section.
Figure 8 presents the deformed shapes of the flat-terrain structural models once all the strain-based limit states are reached. The left figure corresponds to the as-built model and the right figure to the retrofitted. Notice that due to the disparity of strength and stiffness between the main axes, the structure is likely to fail along the weak axis (X). This is corroborated in the following section through bidirectional dynamic time–history analyses. Therefore, only the deformed shapes corresponding to the pushover in this direction are shown. Although the software does not explicitly simulate global structural collapse, these plots offer valuable insight into the anticipated failure mechanism. For the as-built model, the concentration of lateral deformations and plastic hinge formation in the lower story is consistent with a soft-story collapse pattern. Once retrofitted, the inelastic action moves to the second floor, though it starts at much higher demand levels (
Figure 6).
5. Nonlinear Bidirectional Incremental Dynamic Analyses (IDA)
The preceding section presented the pushover analysis results for both as-built and retrofitted houses, providing valuable insights into structural behavior and lateral response characteristics. However, nonlinear static procedures possess inherent limitations, failing to fully capture the complexities of seismic loading, including higher modes and torsional effects. This chapter presents the results of nonlinear, bidirectional dynamic analyses, which offer a more accurate representation of the seismic response. Unlike static procedures, nonlinear dynamic analyses account for the time-dependent nature of seismic excitation, enabling a more realistic assessment of the structural performance. In this study, nonlinear dynamic analyses are conducted within the framework of Incremental Dynamic Analysis (IDA). This methodology involves a series of nonlinear dynamic analyses wherein the intensity of the seismic input is progressively increased, allowing for a detailed evaluation of the structural performance across a range of seismic demands.
5.1. Seismic Input
The design response spectrum employed in this study is orientation-independent, defined as the maximum spectral acceleration observed in any horizontal ground motion direction, denoted as RotD100. Consequently, each ground motion record comprises at least two horizontal components, and the resulting RotD100 response spectrum, computed from these orthogonal components, must align with the target RotD100 spectrum.
This study aimed to incorporate a characteristic commonly observed at near-fault sites: the presence of pulse-like ground motions. These motions contain a dominant velocity pulse, which can induce significantly higher inelastic demands compared to ordinary ground motions.
The detailed process of constructing the response spectrum and selecting seed records is documented in [
25]. The target spectrum was a site-specific spectrum for a strike-slip Mw7.5 earthquake with a Joyner–Boore distance to the rupture of RJB = 5 km for a site with a shear wave velocity of VS30 = 537 m/s. The target spectrum is initially constructed as a RotD50 spectrum using the BSSA14 ground motion prediction equation [
26] and subsequently converted to a RotD100 spectrum using period-dependent ratios [
27]. To account for the pulse effect, a narrowband adjustment was performed using period-dependent amplification factors proposed by [
28], with a target pulse period of 1.75 s.
The resulting target spectrum is presented in
Figure 9. The secondary peak observed around a period of 1.75 s reflects the influence of the velocity pulse on the acceleration response spectrum. For comparative purposes,
Figure 9 also includes the standard ASCE 7-22 two-period and multiperiod Risk-Targeted Maximum Considered Earthquake (MCER) Response Spectrum for a site in Mayagüez, Puerto Rico (Lat.: 18.2109, Lon.: −67.1400, Risk Category III, Site Class C). It is observed that the overall shape of the site-specific spectrum is consistent with the ASCE 7-22 design spectrum up to a period of 0.7 s. Beyond this period, the site-specific spectral amplitudes significantly exceed the design amplitudes due to the velocity pulse effect. The peak ground acceleration for the site-specific spectrum is 0.69 g.
Two sets of eleven ground motion records each were generated using the Continuous Wavelet Transform (CWT) spectral matching algorithm proposed by [
29]. One set utilized pulse-like seed records, ensuring the pulse remained after spectral matching. The second set employed ordinary seed records, verifying no pulse was introduced during spectral matching. A period range of 0.05 s to 5 s was targeted for the matching process. Furthermore, for the pulse-like spectrally matched records, the components were rotated to align the first component with the direction exhibiting the most dominant pulse.
The agreement between the RotD100 spectra of both sets and the target response spectrum is illustrated in
Figure 10, where dashed vertical lines indicate the natural periods of the analyzed structures. The navy-colored lines represent the pulse-present set, while the green lines represent the no-pulse set. The individual record spectra are shown as thin, light lines, and the set averages are shown as thick, intense lines. A close match was achieved for all records within the period range of interest.
5.2. Preliminary Dynamic Results
To elucidate the dynamic behavior of these structures under a bidirectional seismic input before the generation of Incremental Dynamic Analysis (IDA) curves, this section presents individual dynamic analysis results for the flat terrain models subjected to a specific ground motion and amplification factor.
Figure 11 illustrates the drift demands (total, first-story, and second-story) in the polar coordinates. The red lines represent the structural response when the ground motion component exhibiting the dominant pulse is aligned with the structure’s weak (X) axis. In contrast, the green lines represent the response when aligned with the strong (Y) axis.
Figure 12 presents analogous results for the retrofitted flat terrain model.
As anticipated, both the flat and sloped terrain models exhibited the highest drift demands when the ground motion component containing the dominant pulse was aligned with the structure’s weak axis. Despite simultaneous bidirectional excitation, inelastic deformations were predominantly concentrated along the weak axis in these models, even when the component with the dominant pulse is aligned with the structure’s strong axis. Specifically, the as-built flat and sloped terrain models exhibited concentrated inelastic deformations in the first story, whereas the retrofitted counterparts exhibited a concentration in the second story (notice that the radial axes were not kept constant to allow the visualization of the small drifts).
In contrast, the as-built and retrofitted symmetric models (
Figure 13 and
Figure 14) displayed different behavior. While plastic deformations were also concentrated in the first story for the as-built symmetric house (
Figure 13) and in the second story for the retrofitted symmetric house (
Figure 14), there was no preferential concentration in a single direction, independent of the dominant pulse’s angle of incidence.
5.3. Incremental Dynamic Analysis (IDA) Results
Figure 15 presents the IDA curves obtained for the flat terrain (
Figure 15a), sloped terrain (
Figure 15b), and symmetric (
Figure 15c) models. The vertical axis represents the peak ground acceleration (PGA) of the target spectrum, while the horizontal axis represents the maximum inter-story drift (predominantly governed by the first-story drift in as-built models and the second-story drift in retrofitted models). The response of the eleven individual ground motion records is depicted with light lines, and the median response for each record set is shown with solid, thick lines. Each of the three plots includes ten distinct lines, identifying the individual responses for the pulse-present record set for the as-built model, the individual responses for the no-pulse record set for the as-built model, the median response of the as-built model for the pulse-present set, the median response of the as-built model for the no-pulse set, and the overall median response of the as-built model (considering both record sets). The remaining five lines provide analogous data for the retrofitted models.
The results indicate slightly higher drift demands from the pulse-like ground motions, particularly for the retrofitted models, although this difference was not statistically significant. Therefore, the overall median response from both record sets (pulse and no-pulse) is used for comparing the seismic performance of the as-built and retrofitted models.
In general, the IDA curves highlight the effectiveness of the shear-wall-based retrofitting strategy. The retrofitted structures demonstrate an enhanced capacity to withstand higher ground motion intensities while exhibiting reduced inter-story drifts. For the flat-terrain models, the as-built structure reached the excessive deformation limit state at a PGA of 0.23 g, whereas the retrofitted structure reached this limit at 0.60 g, representing a 160% increase in its capacity. For the sloped terrain models, the increase was 140%, from a PGA of 0.20 g to 0.48 g. The symmetric models exhibited a significantly improved seismic response even without retrofitting, reaching the excessive deformation limit state at a PGA of 0.73 g. When retrofitted, the symmetric model remained within the serviceability range even when subjected to a PGA of 2.07 g. In a comparative context, the PGA associated with the Mw7.5 scenario used to construct the target spectrum is 0.69 g, and the PGAs associated with the ASCE 7-22 two-period and multiperiod design spectra for Mayagüez are 0.55 g and 0.62 g, respectively. Furthermore, the record-to-record dispersion in the drift demand is substantially lower in the symmetric structures compared to the structures exhibiting significant azimuthal dependence on strength and stiffness.


