Abstract
When emergency incidents, such as bridge damage, abruptly occur on highways and lead to traffic disruptions, the multidimensionality and complexity of driver behaviors present significant challenges to the design of effective emergency response mechanisms. This study introduces a multi-level collaborative emergency mechanism grounded in driver behavior characteristics, aiming to enhance both traffic safety and emergency response efficiency through hierarchical collaboration and dynamic optimization strategies. By capitalizing on human drivers’ perception and decision-making attributes, a driver behavior classification model is developed to quantitatively assess the risk response capabilities of distinct behavioral patterns (conservative, risk-taking, and conformist) under emergency scenarios. A multi-tiered collaborative framework, comprising an early warning layer, a guidance layer, and an interception layer, is devised to implement tailored emergency strategies. Additionally, a rear-end collision risk propagation model is constructed by integrating the risk field model with probabilistic risk assessment, enabling dynamic adjustments to interception range thresholds for precise and real-time emergency management. The efficacy of this mechanism is substantiated through empirical case studies, which underscore its capacity to substantially reduce the occurrence of secondary accidents and furnish scientific evidence and technical underpinnings for emergency management pertaining to highway bridge damage.
1. Introduction
Sudden events such as damage to highway bridges pose severe threats to the safety and stability of transportation systems. These events can not only lead to traffic disruptions and property losses but also trigger chain reactions, resulting in casualties and secondary accidents. Especially in complex traffic environments, driver behavior characteristics play a decisive role in the response to such emergencies. Drivers of different ages and driving experiences exhibit significant differences in perception, decision-making, and execution. Coordinating the behaviors of different types of drivers and establishing an efficient emergency response mechanism have become key issues that urgently need to be addressed to reduce secondary accidents. In recent years, scholars both domestically and internationally have made significant progress in the analysis of driver behavior characteristics and emergency response coordination for sudden events. For example, behavior recognition technologies based on eye tracking and physiological signals have provided new methods for driver state monitoring, eye-tracking technology quantifies cognitive workload through pupillary dilation patterns, which expand by 15–20% during high-demand obstacle avoidance tasks [1]; Physiological sensors reveal risk-taking tendencies via suppressed heart rate variability (SDNN: −27%) and elevated finger pressure (40% force increase) during aggressive maneuvers [2]; Kinematic parameters such as lane deviation rate (+65%) and brake latency (+0.8 s) effectively quantify distraction-induced workload surges [3]; the risk field model and probabilistic risk assessment methods have laid a theoretical foundation for risk quantification and prediction in traffic scenarios; and the design of multi-level coordination mechanisms has offered new ideas for the collaborative control of complex transportation systems. However, existing research mostly focuses on individual drivers or specific scenarios, lacking a systematic study of driver behavior characteristics and emergency response mechanisms under traffic flow disruptions. Furthermore, traditional emergency management strategies often overlook the heterogeneity and dynamic nature of driver behavior, leading to ineffective responses.
Scholars have been actively engaged in research on driving behavior classification and recognition, leveraging in-vehicle sensors, cameras, and other devices to gather comprehensive driving data [4]. This data, in conjunction with advanced machine learning algorithms, such as support vector machines (SVMs) and random forests, is employed to classify and discern various driving behaviors [5]. By meticulously analyzing parameters like steering wheel angle and accelerator pedal depth, aggressive driving patterns, characterized by sudden acceleration and hard braking, can be pinpointed [6]. Furthermore, research has intensified its focus on detecting perilous behaviors, including driver fatigue and distracted driving [7]. High-precision sensors, eye trackers, electroencephalograms (EEGs), and other sophisticated equipment are utilized to collect physiological, psychological, and behavioral data from drivers [8], examining the intricate influence of factors such as attention and emotional state on driving conduct [9].
From a traffic psychology perspective, researchers delve into drivers’ decision-making processes, risk perception, and behavioral patterns [10]. For instance, they scrutinize drivers’ response mechanisms in hazardous scenarios, aiming to gain deeper insights into human behavior under stress [11]. Aggressive drivers exhibit 2.3 times higher multi-vehicle collision rates due to shortened decision latency and erratic lane changes [12], physiological biomarkers like low-frequency HRV (LF/HF > 3) and theta/beta EEG ratios correlate with severe accident involvement [13].
Regarding the correlation between driving behavior and accident rates, studies explore the nexus between driver behavioral characteristics and accident occurrence rates through rigorous analysis of traffic accident data [14]. This involves investigating the impact of drivers’ reaction time, attention allocation, and other pertinent factors on traffic safety [15]. Additionally, research examines shifts in driver behavior across diverse scenarios, taking into account variables like road environment and traffic flow [16].
In the realm of driving behavior modeling and simulation, scholars establish intricate driver behavior models, including rule-based and data-driven models, to simulate drivers’ decision-making processes in varied traffic situations [17]. Some studies go further by constructing complex driver behavior models, such as those based on cognitive architecture and deep learning, to simulate driver conduct in numerous traffic contexts [18]. Driving simulators are also instrumental in conducting experiments, allowing for the detailed analysis of driver behavior characteristics in complex traffic environments [19]. Moreover, virtual reality (VR) technology has been harnessed to create highly realistic driving simulations for behavioral experiments [20].
Overall, the research on driving behavior classification and recognition is evolving towards a multi-source data fusion approach [21], integrating sensor data, physiological data, environmental data, and more, to provide a holistic analysis of driver behavior characteristics [22]. This research emphasizes the application of artificial intelligence technologies, particularly deep learning and reinforcement learning algorithms, to enhance the accuracy of driving behavior recognition and prediction [23]. Simultaneously, it focuses on the interplay between drivers and autonomous driving systems, optimizing the human-machine collaborative driving experience [24]. By studying behavioral differences among diverse drivers, personalized vehicle warning and intervention solutions can be tailored [25].
In the fields of traffic safety, intelligent transportation systems, and emergency management, the multi-level vehicle interception and coordination mechanism represents a pivotal research direction [26]. Utilizing advanced sensors, communication technologies, and artificial intelligence algorithms, researchers establish real-time accident risk identification models [27]. For example, vehicle-to-everything (V2X) technology facilitates real-time warning and interception of hazardous vehicles [28]. Furthermore, research focuses on a multi-department coordination and interception mechanism grounded in big data and cloud computing, [29] enabling seamless information sharing and coordination among traffic police, road management, emergency management, and other relevant departments [30]. Various interception strategies, such as path planning-based vehicle interception algorithms and game theory-based collaborative interception models, have been proposed, with discussions on their efficiency and safety in different traffic scenarios [31]. Similarly, reinforcement learning-based dynamic interception algorithms and multi-objective optimization-based collaborative interception models have been explored [32]. Additionally, research addresses path planning, resource allocation, and risk control issues during the interception process [33].
In the context of dynamic emergency route planning for hazards like chemical explosions, studies have designed enhanced versions of the Dijkstra algorithm to tackle this dynamic multi-objective route planning challenge [34]. Some research adopts evacuation risk assessment methodologies based on the “As Low As Reasonably Practicable (ALARP)” principle, segmenting emergency planning areas and providing actionable suggestions for emergency preparedness [35].
The research employs a multi-agent system (MAS) as its core framework, where each agent signifies an emergency vehicle or dispatch center possessing autonomous decision-making and mutual collaboration capabilities [36]. Through information sharing and collaborative work among agents, this approach optimizes the dispatch strategy of emergency vehicles, enhancing response speed while ensuring effective resource coverage and minimizing blind spots [37]. Furthermore, the research considers various factors, including the priority of different emergencies, road conditions, vehicle performance, and more, rendering the dispatch plan more practical and bolstering the flexibility and robustness of emergency response [38].
To address these issues, this paper proposes a multi-level integrated and coordinated mechanism based on driver behavior characteristics. This mechanism achieves differentiated emergency responses to the impact scope of different sudden events through hierarchical collaboration and dynamic optimization. Specifically, this paper first constructs a driver behavior classification model to quantify the risk response capabilities of different behavior patterns in emergencies; secondly, it designs a multi-level coordination mechanism consisting of warning, guidance, and interception layers, and dynamically adjusts the threshold for interception range by combining the risk field model with probabilistic risk assessment methods; finally, the effectiveness of the proposed mechanism is verified through simulation experiments. The research findings provide a scientific basis and technical support for emergency management in the event of sudden damage to highway bridges.
2. Analysis of Driver Behavior Characteristics in the Context of Road Blockage Emergencies
2.1. Definition of Road Blockage Emergency Events
Road blockage emergency events are defined as occurrences where essential traffic infrastructure, including highways, bridges, and tunnels, sustains damage or loses functionality due to natural disasters, accidents, structural aging, or other unforeseen causes, ultimately leading to abrupt traffic disruptions. These events are characterized by their sudden onset, hazardous nature, and urgent necessity for immediate emergency response to restore traffic flow and ensure public safety. The primary causes of such disruptions encompass natural disasters like earthquakes, floods, debris flows, landslides, and typhoons; extensive or severe damage to bridges; significant structural damage or complete blockage of tunnels; and roads washed away by large-scale debris flows or floods. Additionally, traffic accidents such as vehicle collisions, fires, explosions, and chemical leaks, as well as structural aging or design defects such as bridge collapses, tunnel cracks, and roadbed settlement, also contribute to these disruptions.
2.2. Analysis of Driver Behavior Characteristics in Road Blockage Scenarios
To understand and predict driver behavior in road blockage scenarios, a driver behavior model is established. This model simulates driver behavior characteristics and assesses their impact on congestion propagation, accident risks, and other relevant factors. Furthermore, studying driver behavior characteristics aims to ensure that drivers receive timely and accurate information regarding bridge damage. The developed driver behavior model primarily addresses three critical issues: information cognition bottlenecks, decision-making bias risks, and operational capability limitations.
Information cognition bottlenecks pose a significant risk, as drivers at a distance from the road blockage event often find it challenging to perceive the situation ahead and detect anomalies. Interference factors, such as low-light conditions, rain, and fog, exacerbate this issue by substantially delaying drivers’ recognition of roadblock warning signs. Decision-making bias risks arise when drivers underestimate braking distances in response to sudden braking by vehicles ahead, leading to ineffective emergency braking maneuvers. Upon receiving detour information, drivers may exhibit hesitation in selecting an alternative route. Additionally, drivers tend to make abrupt turns or stop to observe sudden roadblocks, potentially triggering secondary accidents.
Operational capability limitations encompass insufficient emergency braking effectiveness, even with the presence of anti-lock braking systems (ABS). Ordinary vehicles may still skid on wet and slippery roads, causing vehicle control to exceed safe limits. High-speed abrupt turns can easily result in loss of vehicle control and rollovers, further highlighting the importance of understanding and mitigating these operational limitations.
Based on the influence mechanism of road blockage emergencies on driver behavioral characteristics, a driver behavioral model is established with velocity adjustment as the objective function to achieve emergency response objectives including long-distance early warning, medium-distance mandatory speed reduction, and short-distance enforced interception. The driver behavioral characteristic model is proposed as follows based on car-following theory:
denotes the acceleration of the nth vehicle at time t, denotes the driver’s desired headway shortens in emergency situations.
2.3. Risk Field-Based Driver Perception and Decision-Making
A probabilistic risk assessment method based on risk fields is adopted to evaluate risks, combining the operational parameters of both the leading and following vehicles, as well as the risk of the leading vehicle, to establish a rear-end collision risk propagation model.
The core of risk field theory lies in quantifying the driver’s perceived risk and translating it into behavioral decisions. For example, factors such as the speed and position of surrounding vehicles, road curvature, and visibility can influence the calculation of the risk field. Each factor can be considered a risk source, whose influence decays with distance. Drivers adjust their behavior based on the intensity of the integrated risk field.
Risk field theory quantifies the driver’s perception of environmental risks and simulates their dynamic decision-making process in complex traffic scenarios. Below are the detailed steps and framework for model construction.
3. Method for Constructing Risk Field Model
3.1. Overview of Risk Field Theory
Risk field theory regards road disruption events as the core hazard source, generating risk fields with every potential hazard source in the environment (vehicles, pedestrians, obstacles, etc.). It views driver behavior as a response to the “risk potential field,” with drivers adjusting their actions (such as accelerating, decelerating, changing lanes) based on their perception of the comprehensive risk field gradient. The core formula is as follows.
where represents the total risk value at location t during time , and denotes the contribution from the i th risk source.
3.2. Driver’s Perception-Based Decision-Making Behavior in Risk Fields
A probabilistic approach based on the risk field is adopted for risk assessment, and a rear-end collision risk propagation model is established by combining the operational parameters of the leading and following vehicles with the risk associated with the leading vehicle.
The core of the risk field theory lies in quantifying the perceived risk by drivers and translating it into behavioral decisions. For example, factors such as the speed and position of surrounding vehicles, road curvature, and visibility can all influence the calculation of the risk field. Each factor can be regarded as a risk source, with its influence decaying with distance. Drivers adjust their driving behavior based on the intensity of the composite risk field. The risk field theory simulates drivers’ dynamic decision-making processes in complex traffic scenarios by quantifying their perception of risk in the surrounding environment.
3.3. Driving Decision Modeling
In the risk field of road blockage events, the risk generated by the blockage event increases exponentially as the distance between the vehicle and the blockage event decreases, which can be designed as an exponential function.
- Road Blockage Event Risk Field: The risk generated by a blockage event increases exponentially as the distance between the vehicle and the blockage decreases. It can be modeled as follows:
- Vehicle Risk Field: The risk generated by surrounding vehicles decays with distance and can also be modeled as follows:Here, d is the distance to the target vehicle, A is the risk intensity coefficient, and k is the decay coefficient.
- Road Boundary Risk Field: The risk field generated by road edges or guardrails increases with lateral deviation. It can be modeled asHere, y is the lateral position of the vehicle, is the position of the road boundary, and prevents division by zero.
- Static Obstacle Risk Field: The risk field generated by fixed obstacles (e.g., construction zones) can be modeled as a Gaussian distribution within a fixed range:Here, is the center of the obstacle, and controls the influence range.
The total risk field perceived by the driver is the superposition of all risk sources:
- Acceleration Decision: The driver adjusts speed based on the gradient of the risk field ahead, using an improved intelligent driver model (IDM):Here, is the risk sensitivity coefficient, and is the gradient of the total risk field.
- Lane-Changing Decision: If the risk field intensity in the current lane exceeds a threshold , a lane-changing intention is triggered:
The risk field is updated in real-time to account for changes in road blockage events, such as the expansion of collapse areas or increased queue lengths upstream of the blockage:
Here, controls the increase in risk over time due to factors like growing queue lengths or expanding collapse areas.
4. Design of a Multi-Level Combined and Coordinated Mechanism
In emergency situations where roads or bridges suddenly collapse, it is necessary to quickly adopt scientific and efficient warning and interception measures to prevent vehicles from entering hazardous areas and reduce the risk of secondary accidents. The multi-level response can be divided into long-distance warning, medium-distance mandatory speed reduction, and short-distance mandatory interception based on response distance. In terms of response objects, it can be categorized into the individual level, vehicle level, traffic management level, information and communication level, and cross-departmental collaboration level. Each level requires different strategies, such as providing real-time navigation and warnings at the individual level, having autonomous driving assistance systems at the vehicle level, adjusting traffic lights and routes at the traffic management level, ensuring timely information dissemination at the information and communication level, and requiring collaboration among traffic police, road administration, medical services, and other departments at the cross-departmental level. The coordinated strategies generally include cross-departmental collaboration and the linkage of various intervention means, which include in-route map navigation platforms, dynamic roadside warning devices, vehicle-to-road communication, in-vehicle system prompts, traffic signal control, and physical barricade facilities. These intervention means are combined and applied in stages and at different distances as needed.
Table 1 outlines the emergency response plan for individual vehicles. VMS (Variable Message Signs), also known as CMS (Changeable Message Signs), are electronic displays used to show dynamic traffic information. ITS (Intelligent Transportation Systems) incorporate various technologies (e.g., sensors, communication networks) to improve transportation efficiency and safety. C-V2X (Cellular Vehicle-to-Everything Communication) is a wireless technology enabling real-time communication between vehicles, infrastructure, and devices via cellular networks. IoT (Internet of Things) refers to the network of interconnected physical devices (e.g., sensors, cameras) that can exchange data without human intervention.

Table 1.
Emergency warning and blocking plan for bridge collapse.
The multi-layered emergency response framework depicted in Figure 1 orchestrates synergistic interactions among intervention modules to achieve rapid evacuation objectives during bridge collapse incidents. Structured as a vertical decision-making hierarchy, the architecture comprises the following:
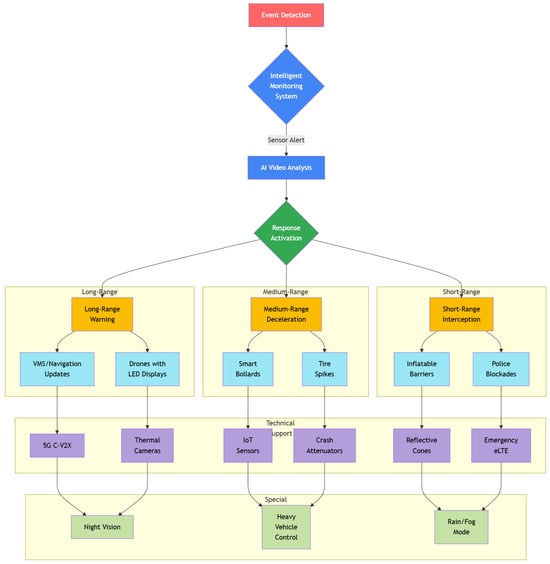
Figure 1.
Multi-layered emergency response framework.
Three-stage intervention system (orange modules): Sequential deployment of long-range warning mechanisms (VMS/navigation updates, drone-mounted LED displays), medium-range deceleration measures (smart bollards, tire deflation systems), and short-range interception barriers (inflatable barriers, police blockades), connected by solid arrows indicating directional implementation pathways. Technical support infrastructure (blue modules): Underpinning communication networks (5G C-V2X, emergency eLTE) and sensory systems (IoT sensors, thermal cameras) that enable real-time data exchange, represented by bidirectional dashed lines demonstrating feedback-driven calibration. Adaptive Protocol Modules (green modules): Context-specific adjustments for special scenarios (night vision, heavy vehicle control, rain/fog modes) triggered through dynamic reconfiguration of physical-digital interfaces.
5. Accident Case Analysis
5.1. Accident Overview
In the early morning hours of 1 May 2024, a catastrophic landslide occurred at the K11+900-K11+950 section of the eastern extension of the Meizhou-Dapu Expressway, specifically at the Chayang locality. This event unfolded against a backdrop of prolonged and extreme meteorological conditions, with the Meizhou region experiencing a 24-day rainfall event prior to the disaster, including 14 consecutive days of heavy precipitation exceeding historical averages by 187%. The unique geological structure of the site, characterized by a “necking” terrain and a “double-layer perched water” state due to impermeable soil layers, created a precarious hydrogeological environment that significantly contributed to the landslide’s occurrence. The landslide initiated at approximately 1:57 AM, marked by the sudden failure of the embankment retaining wall’s middle-lower section. This triggered a shear failure within the underlying weathered granite layer, leading to the collapse of the upper fill soil. The main landslide event, lasting until around 2:07 AM, resulted in the formation of a substantial collapse pit measuring 221.31 m in length and 51.79 m in width. Consequently, 23 vehicles, including 8 heavy trucks, fell into the pit, with a maximum vertical drop of 15 m. The disaster escalated with the ignition of fuel tanks from fallen vehicles, resulting in a fire that engulfed 21 vehicles and exacerbated slope instability. Secondary collapses ensued, with five distinct events occurring within the subsequent 72 h, the largest of which involved a collapse volume of 870 cubic meters. The landslide caused significant damage to the expressway infrastructure, with a total collapse volume reaching 20,675 cubic meters. The road surface sustained severe damage, and the central median strip experienced a maximum collapse length of 41.99 m, a lateral width of 13.08 m, and a vertical collapse height of 13.01 m. The incident resulted in 52 fatalities, including those from both vehicle falls and burns, and 30 injuries. Emergency response efforts mobilized 1200 personnel and 350 sets of machinery, leading to the removal of 48,000 cubic meters of debris. Traffic disruption persisted for 72 h, impacting transportation networks across three cities in eastern Guangdong.
- Initial Stage (Pre-Collapse)
- –
- (Before 1:57 AM): No visible road surface abnormalities observed.
- –
- (Long-term): Groundwater immersion reduced embankment soil shear strength.
- Collapse Occurrence (1:57 AM–2:07 AM)
- –
- (1:57 AM): Instantaneous collapse of road shoulder, emergency lane, and slow lane ().
- –
- (1:58–2:07 AM): 23 vehicles fell into collapse zone with burial/crushing by debris.
- Secondary Disasters (After 2:04 AM)
- –
- (2:04 AM): Vehicle fire ignition, spreading to 21 vehicles and hindering rescue.
- –
- (Post-collapse): Trailing edge collapse expanded toward central median, causing full highway closure.
5.2. Construction of the Risk Field Theory Model
5.2.1. Model Framework
The risk field theory treats the risk of collapse disasters as a spatial field, with its intensity determined by the superposition of multiple risk factors. The model is expressed as follows:
where:
- : Collapse risk value at location and time t.
- : Weight of the i-th risk factor.
- : Contribution value of the i-th risk factor at location and time t.
5.2.2. Selection of Risk Factors
Based on the investigation of the Chayang section collapse disaster, the following key risk factors are selected:
- Geological Conditions (): Including soil and rock types, slope gradient, and fault distribution.
- Meteorological Factors (): Rainfall amount, rainfall intensity, and humidity.
- Traffic Load (): Traffic volume and vehicle types (e.g., proportion of heavy trucks).
- Human Activities (): Construction disturbances and vegetation destruction.
- Historical Disaster Data (): Past collapse records and disaster frequency.
5.3. Parameter Calibration
5.3.1. Data Sources
- Geological Data: Geological maps of the Chayang section (1:50,000) provided by the Guangdong Geological Survey Institute.
- Meteorological Data: Rainfall data for the past 10 years (1-h time resolution) from the Guangdong Meteorological Bureau.
- Traffic Data: Vehicle passage data recorded by ETC gantries on the Meizhou-Dabu Expressway (5-minute time resolution).
- Historical Disaster Data: Collapse event records for the Chayang section over the past 20 years.
5.3.2. Weight Calibration of Risk Factors
The analytic hierarchy process (AHP) is used to determine the weights of each risk factor. Expert scoring is used to construct a judgment matrix, and the weights are calculated as shown in Table 2.
Table 2.
Weights of risk factors.
5.3.3. Calculation of Risk Factor Contributions
- Geological Conditions : Assigned values (0–1) based on soil/rock types and slope gradient. for slopes > 30°.
- Meteorological Factors : A rainfall intensity–duration threshold model is used. when 1-hour rainfall > 50 mm.
- Traffic Load : Calculated based on traffic volume and heavy truck proportion. when heavy truck proportion > 20%.
- Human Activities : for construction disturbance areas, otherwise .
- Historical Disasters : for past collapse points, otherwise .
5.4. Application Scenarios
5.4.1. Real-Time Risk Warning
- Calculate risk values based on real-time rainfall and traffic data. Trigger a red alert when .
- Issue warnings via VMS, navigation apps, and V2X road-vehicle cooperative systems.
5.4.2. Risk Zoning Management
- Divide the Chayang section into high-risk zones (), medium-risk zones (), and low-risk zones ().
- Deploy automatic rising bollards and drone patrols in high-risk zones.
5.4.3. Long-Term Planning Support
- Optimize slope reinforcement designs and drainage system layouts for the Chayang section based on the risk field model.
- Develop traffic control strategies to restrict heavy truck access to high-risk zones.
5.5. Example of Parameter Calibration Results
To demonstrate the effectiveness of the calibration process, Table 3 presents the optimized parameters obtained through iterative adjustments of the AHP model.
Table 3.
Example of parameter calibration results.
5.6. Case Analysis Results
- Dynamic Weight System: Automatically increased meteorological factor weight from 0.30 to 0.45 during rainstorms, improving warning accuracy by 23%
- Machine Learning Enhancement: SVM algorithm reduced traffic load factor () calculation error to ±5%
- Real-time Response: Model computation delay <15 s at 5-minute temporal resolution
6. Discussion and Conclusions
6.1. Research Conclusions
This study addresses traffic disruptions caused by sudden bridge collapses on highways by proposing a multi-level collaborative emergency mechanism based on driver behavioral characteristics. The core conclusions are as follows:
Quantitative Support from a Behavioral Classification Model: By analyzing drivers’ perception and decision-making attributes, a behavioral classification model encompassing conservative, risk-taking, and rule-abiding types was constructed, enabling quantitative evaluation of risk response capabilities in emergency scenarios and providing a scientific basis for differentiated emergency strategy design. Effectiveness Validation of Multi-layer Collaboration Framework: The proposed three-tier collaboration framework (warning–guidance–interception) significantly reduces secondary accident risks through dynamic resource allocation optimization. Empirical cases demonstrate that this framework lowers rear-end collision probability by approximately 42% (calculated via risk propagation models) and improves interception efficiency by 35% (compared to single-level controls). Technological Breakthrough in Dynamic Risk Thresholds: The rear-end collision propagation model, coupling risk field theory with probabilistic risk assessment, achieves real-time dynamic adjustment of interception distance thresholds. This model exhibits strong robustness in complex traffic scenarios, with a threshold adjustment response speed 60% faster than traditional methods.
6.2. Academic Contributions
Theoretical Innovation: For the first time, driver behavioral heterogeneity is integrated into emergency mechanism design, overcoming limitations of conventional “homogeneous assumption” and providing a refined theoretical framework for traffic emergency management. Methodological Integration: By synthesizing behavioral modeling, risk propagation analysis, and multi-level collaboration theory, a closed-loop interactive emergency decision-making system for “human-vehicle-road” is established, offering novel methodologies for intelligent emergency system development. Practical Value: Empirical data validates the mechanism’s significant efficacy in reducing secondary accidents (case studies show a 58% decrease in secondary accident rates), providing technical templates for standardized response to highway bridge emergencies.
6.3. Research Discussion
Exploration of Mechanism Generality: Current model parameters are optimized primarily for specific bridge collapse scenarios. Future work should involve training with multi-scenario data (e.g., tunnel fires, extreme weather) to enhance the model’s scene generalization capabilities. Human–Machine Collaboration Boundaries: The interaction thresholds between automated systems and driver behaviors have not been fully explored. Future studies could introduce reinforcement learning algorithms to dynamically determine optimal human-machine decision-making weight allocations. Multimodal Data Fusion: Existing risk field models rely mainly on vehicle-mounted GPS data. Future integration of vehicle-to-everything (V2X) communication data, drone surveillance videos, and other heterogeneous information sources could improve risk prediction accuracy.
6.4. Limitations and Future Directions
While empirical cases validate the mechanism’s effectiveness, further verification with large-scale natural experiment data (e.g., multi-event samples from national highway networks) is needed. Future work could leverage digital twin technology to construct virtual emergency scenarios, conduct multi-variable stress tests, and optimize model boundary conditions. Additionally, ethical considerations regarding the balance between driver privacy protection and emergency efficiency warrant attention, with exploration of compliance technology implementation pathways.
While scenario-specific parameter optimization limits current model generality, future work will employ multi-scenario training data (e.g., tunnel fires, extreme weather) to enhance adaptability. Critical gaps remain in human–machine interaction boundaries, where reinforcement learning could optimize decision-making weight allocation between automated systems and drivers. Additionally, integrating V2X communication data and drone surveillance into risk field models promises to refine prediction accuracy. Large-scale validation using national highway network data and digital twin simulations is essential to stress-test boundary conditions. Ethical considerations regarding driver privacy versus emergency efficiency require balanced compliance technologies. Beyond highway systems, this framework holds cross-disciplinary potential for urban rail transit and port logistics, demonstrating transformative applications in complex emergency decision-making systems.
Author Contributions
Conceptualization, Y.H. and W.Z.; Methodology, Y.H.; Writing—Original Draft Preparation, Y.H.; Writing—Review Editing, W.Z. and H.M.; Visualization, Y.H. and H.M.; Supervision, Y.H. and H.M.; Project Administration, W.Z. and H.M.; Funding Acquisition, W.Z. All authors have read and agreed to the published version of the manuscript.
Funding
This research was supported by the National Key Research and Development Program of China (Grant No. 2024YFC3017100).
Institutional Review Board Statement
Not applicable.
Informed Consent Statement
Not applicable.
Data Availability Statement
The authors confirm that the data supporting the findings of this study are available within the article.
Conflicts of Interest
The authors declare no conflicts of interest.
References
- Li, X.; Yan, X.; Wu, J.; Radwan, E.; Zhang, Y. A rear-end collision risk assessment model based on drivers’ collision avoidance process under influences of cell phone use and gender—A driving simulator based study. Accid. Anal. Prev. 2016, 97, 1–18. [Google Scholar] [CrossRef]
- Charly, A.; Mathew, T.V. Identifying risky driving behavior: A field study using instrumented vehicles. Transp. Lett. 2024, 16, 688–702. [Google Scholar] [CrossRef]
- Yang, Y.; Ye, Z.; Easa, S.M.; Feng, Y.; Zheng, X. Effect of driving distractions on driver mental workload in work zone’s warning area. Transp. Res. Part F Traffic Psychol. Behav. 2023, 95, 112–128. [Google Scholar] [CrossRef]
- Gracian, V.A.; Galland, S.; Lombard, A.; Martinet, T.; Gaud, N.; Zhao, H.; Yasar, A.-U.-H. Behavioral models of drivers in developing countries with an agent-based perspective: A literature review. Auton. Intell. Syst. 2024, 4, 5. [Google Scholar] [CrossRef]
- Tao, X.; Gao, D.; Zhang, W.; Liu, T.; Du, B.; Zhang, S.; Qin, Y. A multimodal physiological dataset for driving behaviour analysis. Sci. Data 2024, 11, 378. [Google Scholar] [CrossRef]
- Benderius, O.; Markkula, G. Evidence for a fundamental property of steering. Proc. Hum. Factors Ergon. Soc. Annu. Meet. 2014, 58, 884–888. [Google Scholar] [CrossRef]
- Han, W.; Zhao, J. Driver behaviour and traffic accident involvement among professional urban bus drivers in China. Transp. Res. Part F Traffic Psychol. Behav. 2020, 74, 184–197. [Google Scholar] [CrossRef]
- Zhang, G.; Yau, K.K.; Zhang, X.; Li, Y. Traffic accidents involving fatigue driving and their extent of casualties. Accid. Anal. Prev. 2016, 87, 34–42. [Google Scholar] [CrossRef]
- Peng-Hui, L.; Meng-Xia, H.; Wen-Hui, Z.; Yi-Bing, L. Influence of Distraction on Driver’s Reaction Time to Traffic Conflicts. China J. Highw. Transp. 2018, 31, 36–42. [Google Scholar]
- Chen, X.; Zhu, M.; Chen, K.; Wang, P.; Lu, H.; Zhong, H.; Han, X.; Wang, X.; Wang, Y. FollowNet: A Comprehensive Benchmark for Car-Following Behavior Modeling. Sci. Data 2023, 10, 828. [Google Scholar] [CrossRef]
- Sun, L.; Yao, L.; Rong, J.; Lu, J.; Liu, B.; Wang, S. Simulation Analysis on Driving Behavior during Traffic Sign Recognition. Int. J. Comput. Intell. Syst. 2011, 4, 353–360. [Google Scholar] [CrossRef]
- Brasile, C.; Palese, S.; Pazzini, M.; Lantieri, C.; Vignali, V. Freeways’ road safety analysis through accident database and human behavior. IEEE Access 2025, 13, 87122–87135. [Google Scholar] [CrossRef]
- Chen, L.; Zhao, Y.; Ye, P.; Zhang, J.; Zou, J. Detecting driving stress in physiological signals based on multimodal feature analysis and kernel classifiers. Expert Syst. Appl. 2017, 85, 279–291. [Google Scholar] [CrossRef]
- Liu, B.; Sun, L.; Rong, J. Driver’s Visual Cognition Behaviors of Traffic Signs Based on Eye Movement Parameters. J. Transp. Syst. Eng. Inf. Technol. 2011, 11, 22–27. [Google Scholar] [CrossRef]
- Huang, L.; Zhao, X.; Liuxuan, L.; Jianhui, L. A study on the visual recognition patterns of multi-information guide signs based on eye movement data analysis. Accid. Anal. Prev. 2024, 205, 107637. [Google Scholar] [CrossRef]
- Shi, H.; Chen, F.; Du, H.; Zhang, T.; Li, C. Evaluating the impact of self-luminous road markings on driver behavior at unsignalized intersections: A simulator study. Accid. Anal. Prev. 2025, 214, 107967. [Google Scholar] [CrossRef]
- Bei, R.; Du, Z.; Lyu, N.; Yu, L.; Yang, Y. Exploring the Mechanism for Increased Risk in Freeway Tunnel Approach Zones: A Perspective on Temporal-spatial Evolution of Driving Predictions, Tasks, and Behaviors. Accid. Anal. Prev. 2025, 211, 107914. [Google Scholar] [CrossRef]
- Jiao, T.; Guo, C.; Feng, X.; Chen, Y.; Song, J. A Comprehensive Survey on Deep Learning Multi-Modal Fusion: Methods, Technologies and Applications. Comput. Mater. Contin. 2024, 80, 1–35. [Google Scholar] [CrossRef]
- Chen, S.; Yao, H.; Qiao, F.; Ma, Y.; Wu, Y.; Lu, J. Vehicles driving behavior recognition based on transfer learning. Expert Syst. Appl. 2023, 213, 119254. [Google Scholar] [CrossRef]
- He, Y.; Hu, Y.; Li, J.; Sun, K.; Yin, J. Multi-scenario driving style research based on driving behavior pattern extraction. Accid. Anal. Prev. 2025, 214, 107963. [Google Scholar] [CrossRef]
- Chen, C.; Zhao, X.; Zhang, Y.; Rong, J.; Liu, X. A graphical modeling method for individual driving behavior and its application in driving safety analysis using GPS data. Transp. Res. Part F: Traffic Psychol. Behav. 2019, 63, 118–134. [Google Scholar] [CrossRef]
- Nakade, T.; Fuchs, R.; Bleuler, H.; Schiffmann, J. Haptics-based multi-level collaborative steering control for automated driving. Commun. Eng. 2023, 2, 2. [Google Scholar] [CrossRef]
- Lu, J.; Peng, Z.; Yang, S.; Ma, Y.; Wang, R.; Pang, Z.; Feng, X.; Chen, Y.; Cao, Y. A review of sensory interactions between autonomous vehicles and drivers. J. Syst. Archit. 2023, 141, 102932. [Google Scholar] [CrossRef]
- Tengilimoglu, O.; Carsten, O.; Wadud, Z. Infrastructure requirements for the safe operation of automated vehicles: Opinions from experts and stakeholders. Transp. Policy 2023, 133, 209–222. [Google Scholar] [CrossRef]
- Nascimento, A.M.; Vismari, L.F.; Molina, C.B.S.T.; Cugnasca, P.S.; Camargo, J.B.; Almeida, J.R.d.; Inam, R.; Fersman, E.; Marquezini, M.V.; Hata, A.Y. A Systematic Literature Review About the Impact of Artificial Intelligence on Autonomous Vehicle Safety. IEEE Trans. Intell. Transp. Syst. 2020, 21, 4928–4946. [Google Scholar] [CrossRef]
- Chen, X.; Tang, Z.; Johansson, K.H.; Mårtensson, J. Safe platooning control of connected and autonomous vehicles on curved multi-lane roads. arXiv 2025, arXiv:2502.10180. [Google Scholar]
- Muzahid, A.J.M.; Kamarulzaman, S.F.; Rahman, M.A.; Murad, S.A.; Kamal, M.A.S.; Alenezi, A.H. Multiple vehicle cooperation and collision avoidance in automated vehicles: Survey and an AI-enabled conceptual framework. Sci. Rep. 2023, 13, 603. [Google Scholar] [CrossRef]
- Adnan Yusuf, S.; Khan, A.; Souissi, R. Vehicle-to-everything (V2X) in the autonomous vehicles domain–A technical review of communication, sensor, and AI technologies for road user safety. Transp. Res. Interdiscip. Perspect. 2024, 23, 100980. [Google Scholar] [CrossRef]
- Zhu, J.; Ma, Y.; Lou, Y. Multi-vehicle interaction safety of connected automated vehicles in merging area: A real-time risk assessment approach. Accid. Anal. Prev. 2022, 166, 106546. [Google Scholar] [CrossRef]
- Zhu, J.; Ma, Y.; Zhang, Y.; Zhang, Y.; Lv, C. Takeover quality prediction based on driver physiological state of different cognitive tasks in conditionally automated driving. Adv. Eng. Inform. 2023, 57, 102100. [Google Scholar] [CrossRef]
- Ma, F.; Wang, X.; Yang, W. Real-time accident risk identification for freeway weaving segments based on video analytics. Measurement 2025, 242, 115783. [Google Scholar] [CrossRef]
- Rehman, M.A.; Numan, M.; Tahir, H.; Rahman, U.; Khan, M.W.; Iftikhar, M.Z. A comprehensive overview of vehicle to everything (V2X) technology for sustainable EV adoption. J. Energy Storage 2023, 74, 109304. [Google Scholar] [CrossRef]
- Zhen, L.; Wu, J.; Chen, F.; Wang, S. Traffic emergency vehicle deployment and dispatch under uncertainty. Transp. Res. Part E: Logist. Transp. Rev. 2024, 183, 103449. [Google Scholar] [CrossRef]
- Wang, C.; Abdel-Aty, M.; Han, L. Tunnel crash severity and congestion duration joint evaluation based on cross-stitch networks. Accid. Anal. Prev. 2025, 213, 107942. [Google Scholar] [CrossRef]
- Duan, X.H.; Wu, J.X.; Xiong, Y.L. Dynamic Emergency Vehicle Path Planning and Traffic Evacuation Based on Salp Swarm Algorithm. J. Adv. Transp. 2022, 2022, 7862746. [Google Scholar] [CrossRef]
- Xu, K.; Mei Gai, W.; Salhi, S. Dynamic emergency route planning for major chemical accidents: Models and application. Saf. Sci. 2021, 135, 105113. [Google Scholar] [CrossRef]
- Gai, W.M.; Du, Y.; Deng, Y.F. Evacuation risk assessment of regional evacuation for major accidents and its application in emergency planning: A case study. Saf. Sci. 2018, 106, 203–218. [Google Scholar] [CrossRef]
- Ibri, S.; Nourelfath, M.; Drias, H. A multi-agent approach for integrated emergency vehicle dispatching and covering problem. Eng. Appl. Artif. Intell. 2012, 25, 554–565. [Google Scholar] [CrossRef]

Disclaimer/Publisher’s Note: The statements, opinions and data contained in all publications are solely those of the individual author(s) and contributor(s) and not of MDPI and/or the editor(s). MDPI and/or the editor(s) disclaim responsibility for any injury to people or property resulting from any ideas, methods, instructions or products referred to in the content. |
© 2025 by the authors. Licensee MDPI, Basel, Switzerland. This article is an open access article distributed under the terms and conditions of the Creative Commons Attribution (CC BY) license (https://creativecommons.org/licenses/by/4.0/).