Article

Field Blast Tests and Finite Element Analysis of A36 Steel Sheets Subjected to High Explosives

by
Anselmo S. Augusto
1,2,*,
Girum Urgessa
2,
José A. F. F. Rocco
1,
Fausto B. Mendonça
1 and
Koshun Iha
1
1
Divisão de Ciências Fundamentais, Departamento de Química, Instituto Tecnológico de Aeronáutica, Pça. Mal. Eduardo Gomes, 50, São José dos Campos 12228-900, SP, Brazil
2
Sid and Reva Dewberry Department of Civil, Environmental, and Infrastructure Engineering, George Mason University, 4400 University Drive, MS 6C1, Fairfax, VA 22030, USA
*
Author to whom correspondence should be addressed.
Eng 2025, 6(8), 187; https://doi.org/10.3390/eng6080187
Submission received: 14 June 2025 / Revised: 14 July 2025 / Accepted: 2 August 2025 / Published: 5 August 2025
(This article belongs to the Special Issue Interdisciplinary Insights in Engineering Research)

Abstract

Blast mitigation of structures is an important research topic due to increasing intentional and accidental human-induced threats and hazards. This research area is essential to building capabilities in sustaining structural protection, site planning, protective design efficiency, occupant safety, and response and recovery plans. This paper investigates experimental tests and finite element analysis (FEM) of thin A36 steel sheets subjected to blast. Six field blast tests were performed at standoff distances of 300 mm and 500 mm. The explosive charges comprised 334 g of bare Composition B, and the steel sheets were 2 mm thick. The experimental results, derived from the analysis of high-speed camera recordings of the blast events, were compared with FEM simulations conducted using Abaqus®/Explicit version 6.10. Three constitutive material models were considered in these simulations. First, the FEM simulation results were compared with experimental results. It was shown that the FEM analysis provided reliable results and was proven to be robust and cost-effective. Second, an extensive set of 460 additional numerical simulations was carried out as a parametric study involving varying standoff distances and steel sheet thicknesses. The results and methodologies presented in this paper offer valuable and original insights for engineers and researchers aiming to predict damage to steel structures during real detonation events and to design blast-resistant structures.

1. Introduction

The study of explosives plays a vital role in analyzing their impact on structures and in reducing related hazards. Worldwide, there has been increasing concern over terrorist activities [1], unintended destruction [2], and both accidental [3] and deliberate [4] detonations. Consequently, a wide range of institutions and researchers have focused on examining methods to design buildings and infrastructure that are more resistant to blasts and provide more safety for occupants [5]. Computational methods, such as the Finite Element Method (FEM), are useful in blast analysis, providing cheaper, faster, and safer solutions when compared to field blast testing [6].
Commercially available FEM software, such as LS-DYNA, Abaqus, and Ansys Autodyn, is widely adopted to analyze the effects of explosive loads on structural elements. Two main approaches are commonly used in numerical simulations to predict blast loads: the Coupled Eulerian–Lagrangian (CEL) method and the Conventional Weapons Effects Program (CONWEP). The CEL method enables the explicit modeling of air and explosive-product interaction with structures in complex fluid–structure problems. The CONWEP, on the other hand, applies empirical formulas to estimate blast pressures in a more simplified and computationally efficient way. These tools have been used to simulate the response of various structural types, including steel, reinforced concrete, and composite elements [6].
The following studies applied LS-DYNA software in combination with the CEL method. Yue et al. [7] examined polyurea-coated concrete arch structures. Four experimental tests and four simulations were conducted, and the comparison focused on the damage pattern and pressure levels, without a quantified error. Mohotti et al. [8] investigated steel plates with and without polymer protection. They performed ten blast tests and ten simulations, reporting an error of up to 15%. Cui et al. [9] evaluated concrete-filled steel tubular columns using two tests and approximately 60 simulations. The reported difference between the test and simulation results was less than 10%. He et al. [10] focused on thick steel plates subjected to local contact detonation. Their study included three tests and three simulations, with differences reaching up to 40%. Nawar et al. [11] studied rubberized steel fiber-reinforced concrete beams through ten tests and around 50 simulations. The static analysis was carried out using Abaqus, while LS-DYNA was used for the dynamic response. The reported error was below 10% for static cases and approximately 13% in dynamic simulations.
LS-DYNA was also used with CONWEP or other simplified methods to apply the blast load. Another work of Nawar et al. [12] focused on the performance of perforated steel structures subjected to explosions. Three blast tests and six simulations were conducted. The authors reported errors of up to 5% in terms of deformation and maximum deformation, and up to 16% for peak pressure. Lim et al. [13] studied the damage level in slab-column joints made of concrete, carrying out 13 simulations without blast tests. Wang et al. [14] analyzed the blast resistance of reinforced concrete girders protected with polymer coatings. Their study included three blast tests and 23 simulation cases, with differences between numerical and experimental results reaching up to 12%. Ding et al. [15] evaluated the damage to A36 steel tubular columns using reference blast test data from another paper. The authors reported differences of approximately 12% between measured and simulated structural behavior. Nasry et al. [16] performed three blast tests and four simulations to evaluate a partially vented reinforced concrete structure. The reported difference between experimental and numerical results was up to 17%. Vaghefi and Mobaraki [17] analyzed the effects of explosions on a concrete bridge deck using four simulations. However, they did not conduct blast tests.
Ansys Autodyn was applied using the CEL method to evaluate the effects of explosions on reinforced concrete structures. Khan et al. [18] studied reinforced concrete panels externally reinforced with steel plates. The study was purely numerical, involving 16 simulations without any blast tests. No comparison with experimental data was reported. Abada et al. [19] focused on reinforced concrete panels protected with sacrificial cladding. Four blast tests were carried out along with four simulations. The reported error was up to 5% for displacement and up to 12% for the damage radius.
In addition to the previous approaches, Abaqus has been used with CEL and other direct load definitions to simulate the structural behavior under blast conditions. Anas et al. [20] analyzed reinforced concrete slabs subjected to touch-off explosions, using blast test results from another study. Seven simulations were performed, and the reported error was approximately 1% for contact-type cases. Yang et al. [21] evaluated fiber–metal laminate sandwich beams through 40 simulations without conducting blast tests. The load was applied directly, and the comparison relied on analytical calculations without a quantified error. Jamil et al. [22] examined aluminum/thermoplastic polyurethane sandwich panels using 16 simulations without experimental validation. The difference between numerical predictions and expected behavior was reported to be up to 14%. Mortar et al. [23] examined geopolymer reinforced concrete beams using three blast tests and three simulations. The comparison was based on the observed damage pattern.
Among the studies using Abaqus, the most common approach for applying the blast load was CONWEP. Al-Rifaie et al. [24] investigated metallic corrugated sandwich panels subjected to blast loading. No blast tests were performed, and four simulations were conducted using different panel configurations. No comparison with experimental results was reported. Zhang and Feng [25] analyzed carbon fiber-reinforced aluminum alloy laminates, comparing them with five specimens from another study. Four simulation groups under varying conditions were developed, and the reported error was around 10%. Alias and Amin [26] evaluated steel-concrete composite slabs, performing 11 simulations without any blast tests. The study did not compare deformation results, focusing instead on the applied load response. Mubarok et al. [27] assessed sandwich panel structures through approximately 60 simulations without conducting blast tests. Mendonça et al. [28] studied reinforced concrete slabs using ten blast tests and ten simulations. The comparison focused only on the damage pattern and extent. Kontogeorgos and Fuggini [29] analyzed steel pipes, both unprotected and coated with polyurethane foam or solid polyurethane. Although no blast tests were carried out, three pipe profiles were studied under three different loading conditions, resulting in nine simulations. Ali and Althoey [30] investigated steel framing systems protected with different composite materials. Around 20 simulations were executed, but they did not conduct blast tests. Abdallah [31] examined ASTM A36 steel columns using blast test data from another study and carried out five simulations. The reported difference between the test and simulation was approximately 7%. Derseh et al. [32] conducted 27 simulations on hybrid metallic sandwich panels with different patterns. The results were compared against data from another published article. The difference was measured graphically and was less than 15%. Kohzadialvar et al. [33] studied steel flexural frames subjected to blast loading through two simulation configurations without conducting blast tests. Abdelrahim et al. [34] investigated the inelastic damage of reinforced concrete slabs subjected to blast loading. Three simulations were conducted and compared with blast test data from another study. The numerical results showed good agreement with the experimental results, with accuracy reaching up to 90%.
This current paper aims to advance the understanding of how steel plates dynamically respond when subjected to explosive airblast loads. To achieve this, a case study was carried out in which bi-fixed A36 steel sheets, 2 mm in thickness, were exposed to the detonation of 334 g of bare, spherical Composition B. The blast tests were conducted at standoff distances of 300 mm and 500 mm, respectively. Six field tests were conducted at the detonation area field operated by the Divisão de Sistemas de Defesa (ASD), part of the Instituto de Aeronáutica e Espaço (IAE), a research organization under the Força Aérea Brasileira (FAB). High-speed cameras (HSCs) were used to capture each event, enabling the measurement of structural maximum displacement during the blast. The test results were compared with computational simulations using the Finite Element Method (FEM) in Abaqus/Explicit [35]. The blast loads were calculated using the CONWEP code available in Abaqus, and three different material models for the steel were considered in the simulations.
The first step involved validating the FEM simulations with the experimental data. After successful validation, 460 additional FEM simulations were conducted using a Python 2.6.2 macro program integrated with Abaqus. These simulations assessed the structural response for different steel thicknesses and standoff distances. Further analysis compared the damage level and matched the simulations with real blast events.
The current paper compared the numerical simulations with repetitive tests conducted by the authors—an important validation step not present in all reviewed papers presented above. Another significant contribution is the volume of simulations performed, totaling more than 460, which is substantially greater than what is typically presented in other studies. This allowed for a broader analysis over a wider range of standoff distances and steel thicknesses.
More details about the explosive used, its characterization, and the loading method can be found in a previously published work by our research team [36]. Further data regarding the blast experiments conducted is available in a separate paper published by our team [37]. The current paper focuses on FEM simulations, validating experimental results and results derived from the parametric study consisting of 460 simulations.

2. Materials and Methods

2.1. Blast Load

High explosives are characterized by their high energy density and ability to detonate, producing supersonic shock waves that propagate through the surrounding medium. A detonation is a rapid exothermic reaction that generates high-temperature, high-pressure gases, which compress the adjacent fluid—typically air—resulting in an overpressure that radiates from the detonation center. As illustrated in Figure 1, this shock wave causes a sudden increase in pressure from the ambient level (Po) to the peak incident overpressure (Pso), which can reach values on the order of several kilobars. This overpressure then rapidly decays back to Po over a short duration, known as the positive phase duration (to), typically lasting a few milliseconds. Following this, a negative phase occurs, in which the pressure drops below Po, reaching a minimum value referred to as the negative peak overpressure (Pso−), typically on the order of a few hundred millibars. The negative phase lasts longer than the positive phase, with a corresponding duration denoted by to−. Each of these phases generates a specific impulse: the positive incident impulse (is) and the negative incident impulse (is−), defined as the areas under the respective segments of the overpressure–time curve shown in Figure 1 [3].
When the shock wave impacts a surface that prevents its free propagation, it generates a reflected pressure (Pr), which is higher than the incident overpressure. This reflected pressure is typically calculated based on Pso or using specific equations [3].
There are several methods to predict these blast parameters: experimental measurements, empirical equations, theoretical calculations, or numerical simulations such as the Coupled Eulerian–Lagrangian (CEL) method. The present study adopted the Conventional Weapons Effects Program (CONWEP) code, developed by the U.S. Army Corps of Engineers [38] and based on the well-established Kingery and Bulmash empirical equations [39]. These equations are used by organizations such as the United Nations [2] and the U.S. Department of Defense [3] to estimate such blast parameters. The CONWEP code is implemented as a built-in feature in Abaqus/Explicit, and its main input parameters are the TNT equivalent mass of the charge and the standoff distance under consideration.
The TNT equivalent of the Composition B charges for this work was determined from a prior work published by our research team [36], considering the peak overpressure (Pso) measured in a dedicated series of five blast tests conducted specifically for this purpose. From that study, the TNT equivalence was determined to be 1.38. Considering that the charge mass was 334 g and applying a 20% safety factor, as recommended by most blast design manuals [3], the resulting TNT equivalent mass considered in this study was 553 g (334 g × 1.38 × 1.2).

2.2. Blast Field Tests

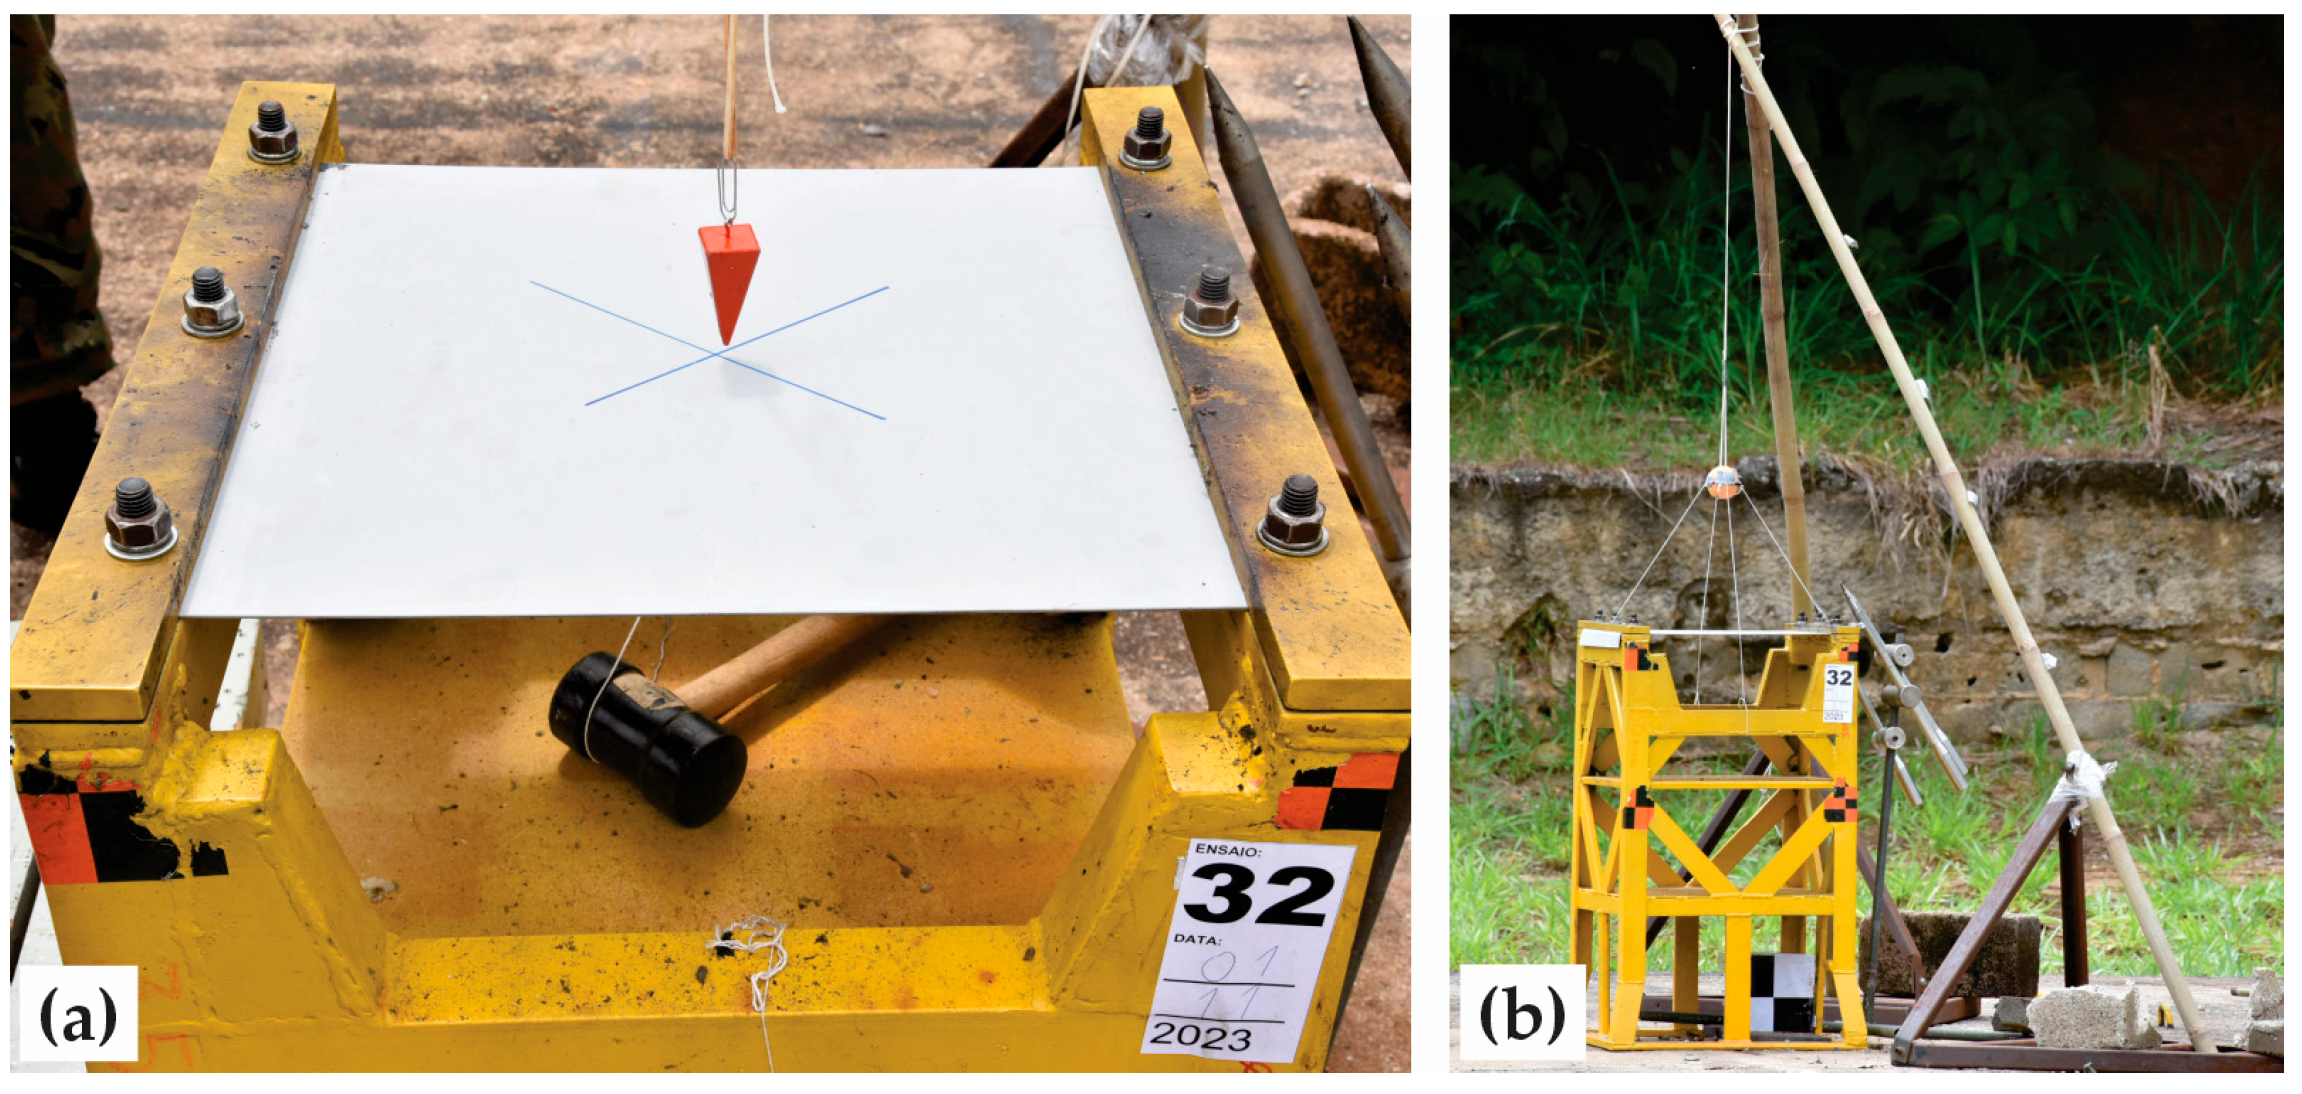
The steel sheets were mounted on a rigid steel support structure, measuring 900 mm in height and anchored to a concrete foundation. This setup was specifically engineered to remain undeformed throughout the blast experiments. Six explosive charges, each composed of Composition B, were used. These spherical charges had an approximate diameter of 72 mm and a mass of 334 g. They were suspended using nylon cords tied to a flexible, replaceable wooden rod. Each charge was centrally initiated with a No. 8 blasting cap and a pressed RDX booster pellet weighing approximately 1.4 g. Figure 2 presents the test setup, including the steel sheet affixed to the support (a) and the overall test configuration (b).
For each test, a new A36 steel sheet was installed. These sheets had dimensions of 600 × 400 mm and a thickness of 2.14 mm, featuring two folded edges and pre-drilled holes for bolting. They were fastened to the support structure with thick steel clamping bars and six bolts. The effective unsupported span exposed to the blast was 431 mm, corresponding to the L value shown in Equation (2).
The blast events were recorded using high-speed imaging equipment positioned over 30 m from the charge, ensuring the safety of the devices. The camera used was a Phantom VEO 640 [40] manufactured by Vision Research (Wayne, NJ, USA), operating at 10,000 frames per second with a resolution of 640 × 576 pixels. It was equipped with a Sigma 120–300 mm f/2.8 telephoto lens manufactured by Sigma Corporation (Kawasaki, Japan).
Three tests were initially conducted with a standoff distance of 500 mm between the explosive and the sheet. Subsequently, three more tests were carried out at a reduced standoff distance of 300 mm, with all other parameters kept unchanged.
More detailed information about the tests and the method used to measure the maximum displacement of the steel sheets during the experiments can be found in a previously published paper by the authors [37].

2.3. Constitutive Material Models

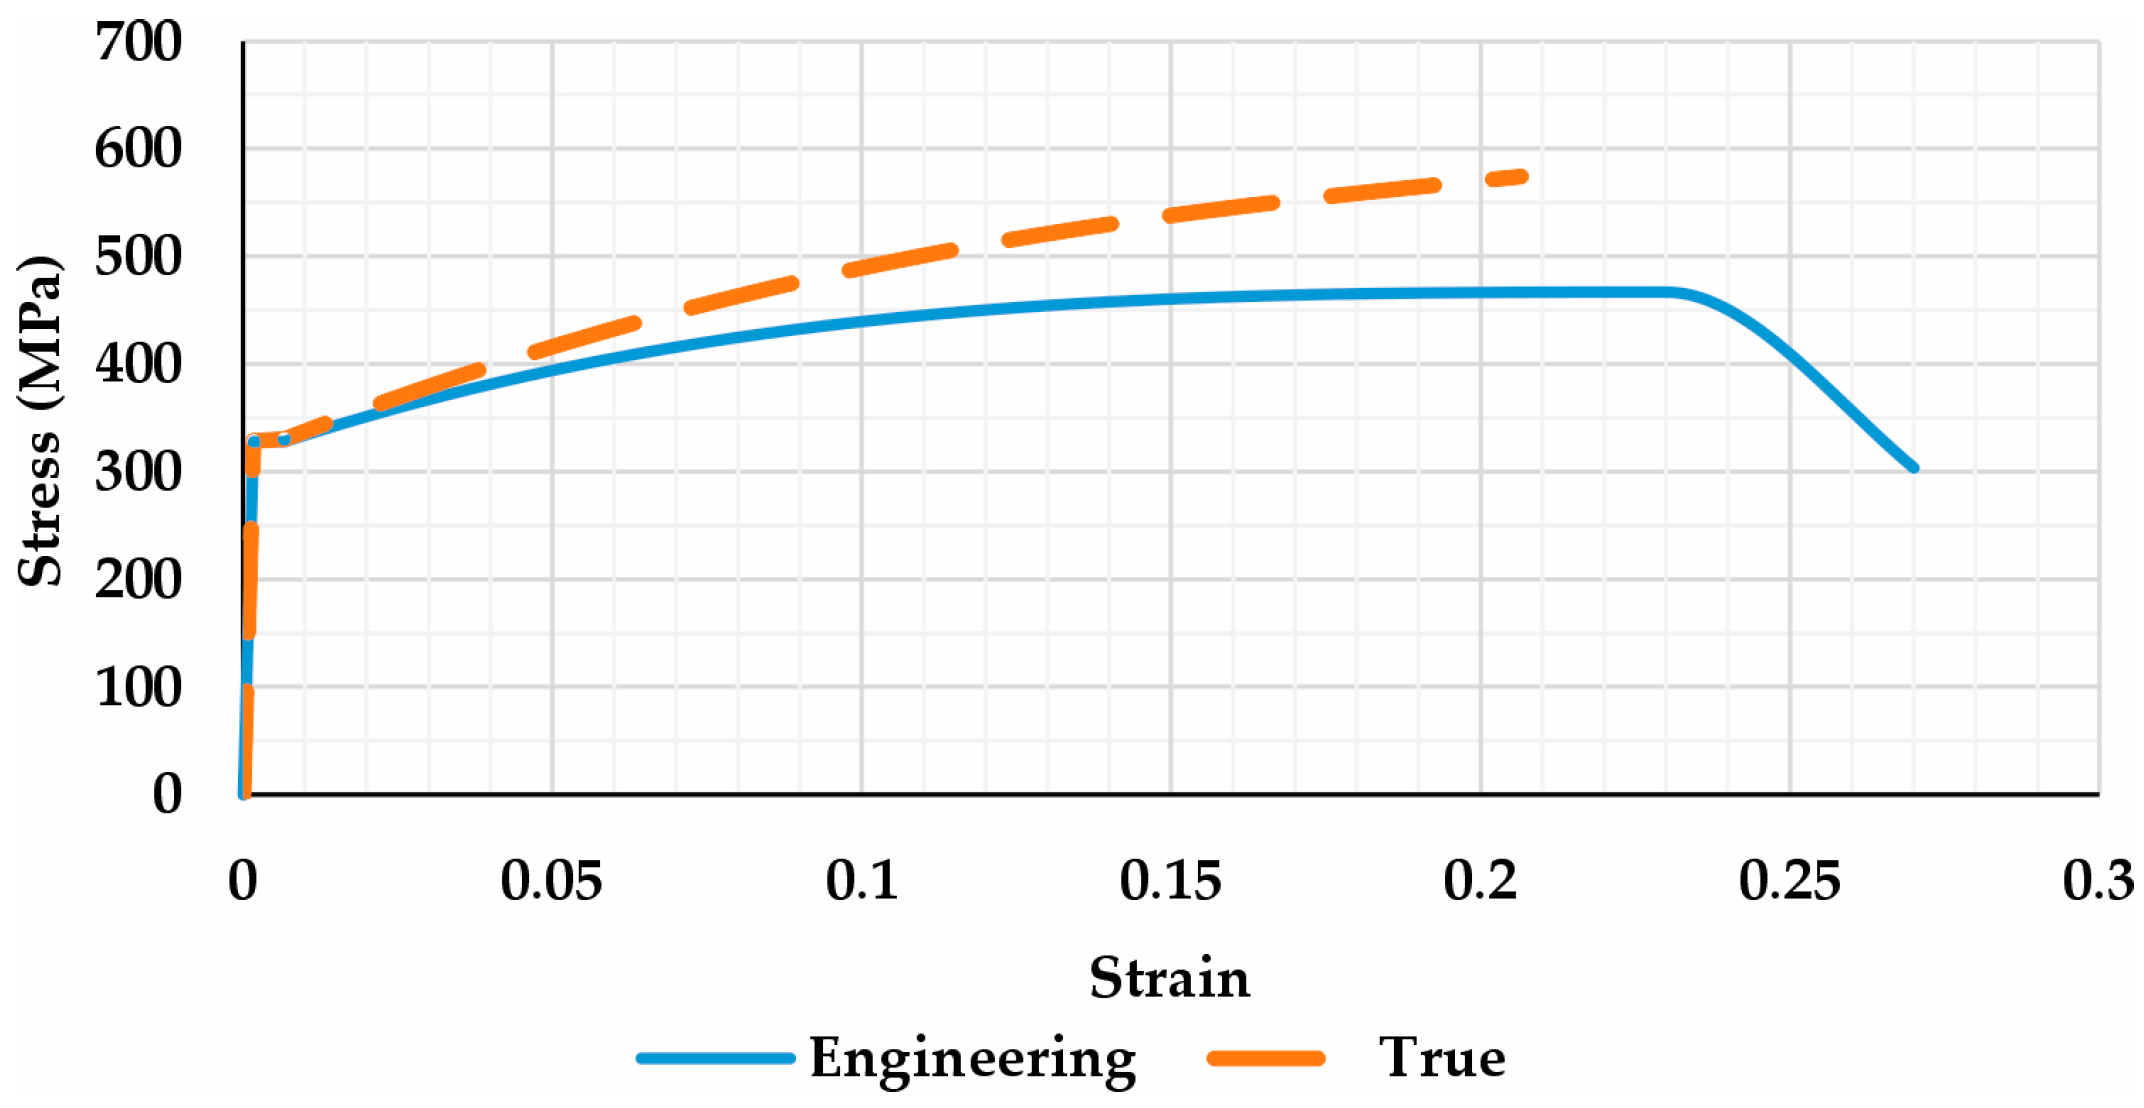
Three different constitutive material models were considered during the FEM numerical simulations. The first was the traditional stress–strain curve based on actual laboratory data provided by the steel manufacturer for the material batch used, including both elastic and plastic regions without strain-rate effects. The second was the Johnson–Cook (JC) model, which included strain-rate effects but disregarded temperature effects. The third model was also Johnson–Cook, but with both temperature and strain-rate effects disregarded. For both JC models, the material parameters were taken from published studies involving A36 steel, although not from the specific material batch used in the present work.

2.3.1. A36 Steel Stress–Strain Curve

The steel sheets were provided by Companhia Siderúrgica Nacional, a Brazilian steel manufacturer [41], and acquired in the city of São José dos Campos, SP. Table 1 presents the steel characteristics provided by the manufacturer. These values originate from laboratory tests conducted on the specific batch used in the experiments. The engineering stress–strain curve was converted into the true stress–strain curve before being implemented in FEM software and is shown in Figure 3.

2.3.2. Johnson–Cook Constitutive Model

The Johnson–Cook (JC) constitutive material model [42] used in the present study was developed in 1983 to describe the behavior of metals under varying temperatures, high strain rates, and large plastic deformations. Equation (1) presents the Von Mises stress used in the JC model, which incorporates plastic strain hardening and strain-rate effects. The temperature-related softening effect was excluded from the equation and not considered in the simulations. According to the studies by [15,43], the detonation event occurs so rapidly that it does not significantly raise the temperature of metallic elements to a level that would affect their mechanical strength. Moreover, the adopted CONWEP model does not account for any temperature effects in the applied load.
σ v = ( A + B ε n ) ( 1 + C l n   ε ˙ * )
where:
σv—Von Mises stress;
ε—Equivalent plastic strain;
ε ˙ —Strain rate;
ε ˙ * —Dimensionless equivalent strain rate equal to ε ˙ / ε ˙ o ;
ε ˙ o —Reference strain in s−1;
A—Material constant obtained in tests related to the yield stress;
B, n—Material constants obtained in tests related to the strain hardening;
C—Material constant obtained in tests related to the strain rate effect.
If the value of the material constant C is set to 0, the strain-rate effect is disregarded in the model. This scenario corresponds to the third material model simulated in the present work.
The determination of the JC parameters requires an extensive and costly series of tests, including the use of highly specialized equipment. Neither the company that supplied the steel nor the authors of the present work had access to such equipment. As in most of the review literature cited in this paper, the JC material constants considered were obtained from previously published academic literature for A36 steel. These parameters are listed in Table 2.
The value of A presented in Table 2 is slightly different from the yield stress results obtained in the laboratory tests detailed in Table 1. This value, found in references [44,45], is commonly used for A36 steel in other publications in the field. Although this difference may influence the results, the A value was kept unchanged during the simulations for several reasons. The main objective was to compare the use of unmodified literature values, as commonly adopted in published studies, with results from simpler laboratory tests such as the stress–strain curve. Another reason is that changing the A constant would require recalibration of the other multiplicative constants in the model.
The ideal scenario would involve conducting all of the required tests for the JC model for each steel batch used. However, this is far from practical, as the necessary equipment is rarely available at research institutions, and the associated costs are prohibitive. A more detailed parameterization study of these constants and their effects would go beyond the scope of the current work and is therefore suggested in the conclusion as a topic for future research. The results and analyses showed that, despite these differences, all material models produced displacements with good agreement with the blast field tests.

2.4. FEM Simulations

2.4.1. General Aspects

More than 460 FEM simulations were conducted using Abaqus/Explicit software. The first 22 simulations were performed to test the model’s convergence. The next six simulations reproduced the exact conditions of the blast tests described in Section 2.2. Each standoff distance was simulated for the three constitutive material models. Once the comparison with the experimental results was considered reliable, an additional extensive series of simulations was carried out, varying both the standoff distances and the steel sheet thicknesses.
Ten A36 steel sheet thicknesses were considered: 1.50, 1.80, 2.00, 2.25, 2.65, 3.00, 3.75, 4.00, 4.25, and 4.75 mm. These correspond to commercially available dimensions on the Brazilian market for A36 hot-rolled thin steel sheets [46]. For each thickness, a total of 46 different standoff distances were simulated, ranging from 100 mm to 5000 mm. A Python macro program was implemented to automate all simulations and their variations. This macro was capable of adjusting input values, running the Abaqus simulations, reading the main results, and exporting them as images and data files.
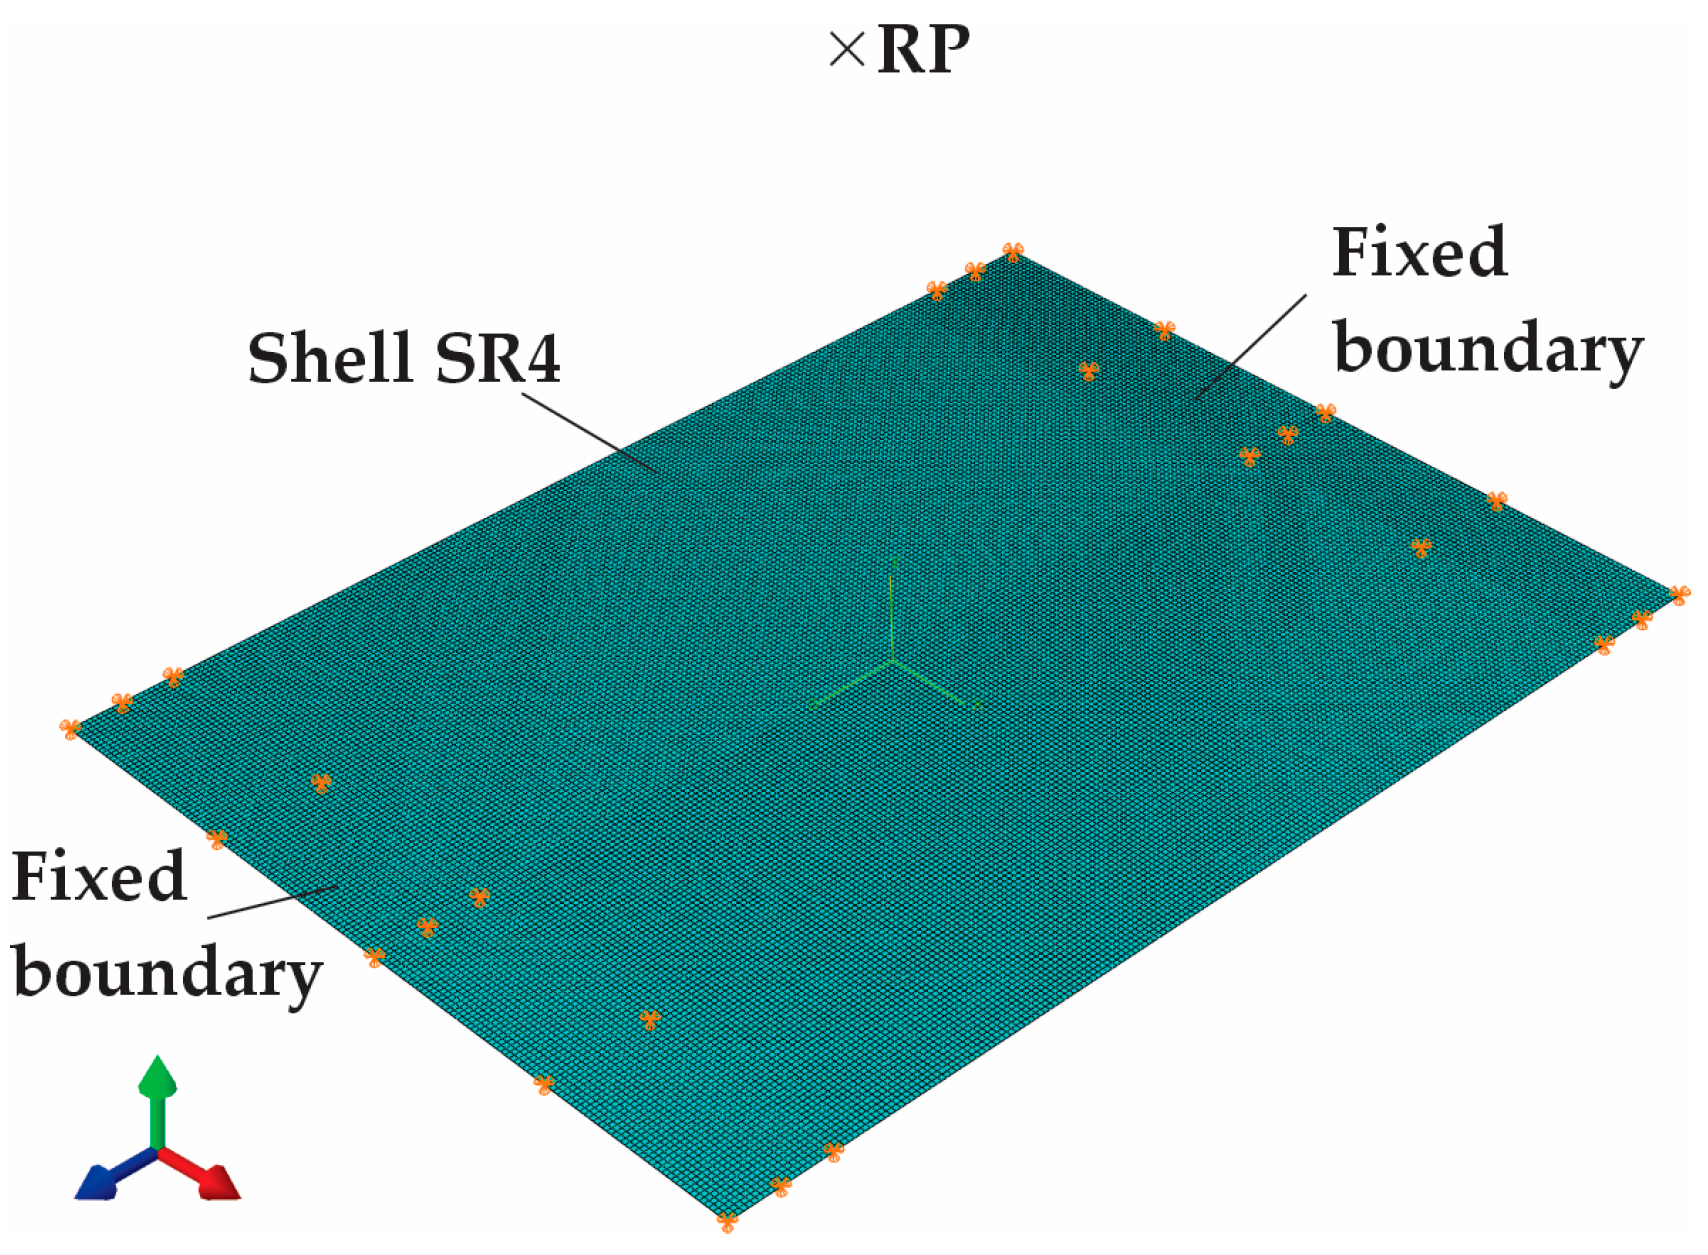
To model the A36 steel sheets, Lagrangian shell elements (S4R) were used, considering their small thickness relative to the other dimensions. Appropriate boundary conditions were applied during the simulations by fully constraining the lateral edges of the sheet that were fixed to the rigid support. The folds and fastening holes of the sheets were not modeled, as they were fully constrained and thus not affected by the airblast.
To activate the CONWEP code, an incident wave interaction of type “air blast” must be defined using the Abaqus keyword *INCIDENT WAVE INTERACTION PROPERTY, TYPE=AIR BLAST, CONWEP. This interaction connects a designated reference point (RP), which represents the detonation center, to the surface subjected to the blast. The RP location was adjusted for each standoff distance. The TNT equivalent mass of the explosive charge was defined as described in Section 2.1 [47].
Figure 4 shows the resulting model as inserted into Abaqus 6.10.
Each simulation was numerically solved on a computer with a processor featuring 16 cores, 32 threads, and a clock speed of 3.4 GHz, along with 64 GB of RAM. For standoff distances less than or equal to 1200 mm, the simulated duration was 5 ms, requiring approximately 1 min of computational time. For larger standoff distances, the simulated duration increased due to the longer delay before the airblast reached the steel sheet and the slower deformations. These simulations spanned 20 ms and required approximately 4 min to complete. Considering all 460 simulations, including the time required by the macro program to read and export the results, the total computational time was approximately 26 h.

2.4.2. Model Convergence

To determine the optimal mesh size, a series of simulations was initially carried out at standoff distances of 300 mm and 500 mm using 2 mm thick steel sheets, employing the stress–strain material model and a simulation duration of 5 ms. The mesh size was varied from 40 mm to 1 mm, and the maximum displacement was recorded for each case, along with its variation relative to the immediately coarser mesh. These results allowed for the assessment of model convergence, as summarized in Table 3.
Analyzing Table 3, it is evident that the model converged, with variations in maximum displacement below 1% for mesh sizes less than or equal to 5 mm. Between mesh sizes of 2.5 mm and 1 mm, the differences are negligible; however, the computational effort and model size increase significantly. Considering these factors, a mesh size of 2.5 mm was adopted, as it lies within the converged region while ensuring a reasonable computational cost.
The mesh with 2.5 mm element size resulted in simulations with 34,293 nodes and 33,920 linear quadrilateral elements of the reduced integration type S4R.
The Gaussian quadrature method was used to perform numerical integration through the thickness of the shell elements. The number of integration points directly influences the accuracy of stress, strain, and displacement calculations, particularly under nonlinear deformation. To ensure reliable results without excessive computational cost, a convergence test was conducted to determine the appropriate integration order. Table 4 presents the results of this test, using a mesh size of 2.5 mm, the stress–strain curve as the material model, and a simulation duration of 5 ms. Seven integration points were adopted, as the computational cost with five points was similar, but a small residual displacement error remained. Increasing to nine points increased the computational effort without further improving the results.

2.5. Structural Damage Evaluation

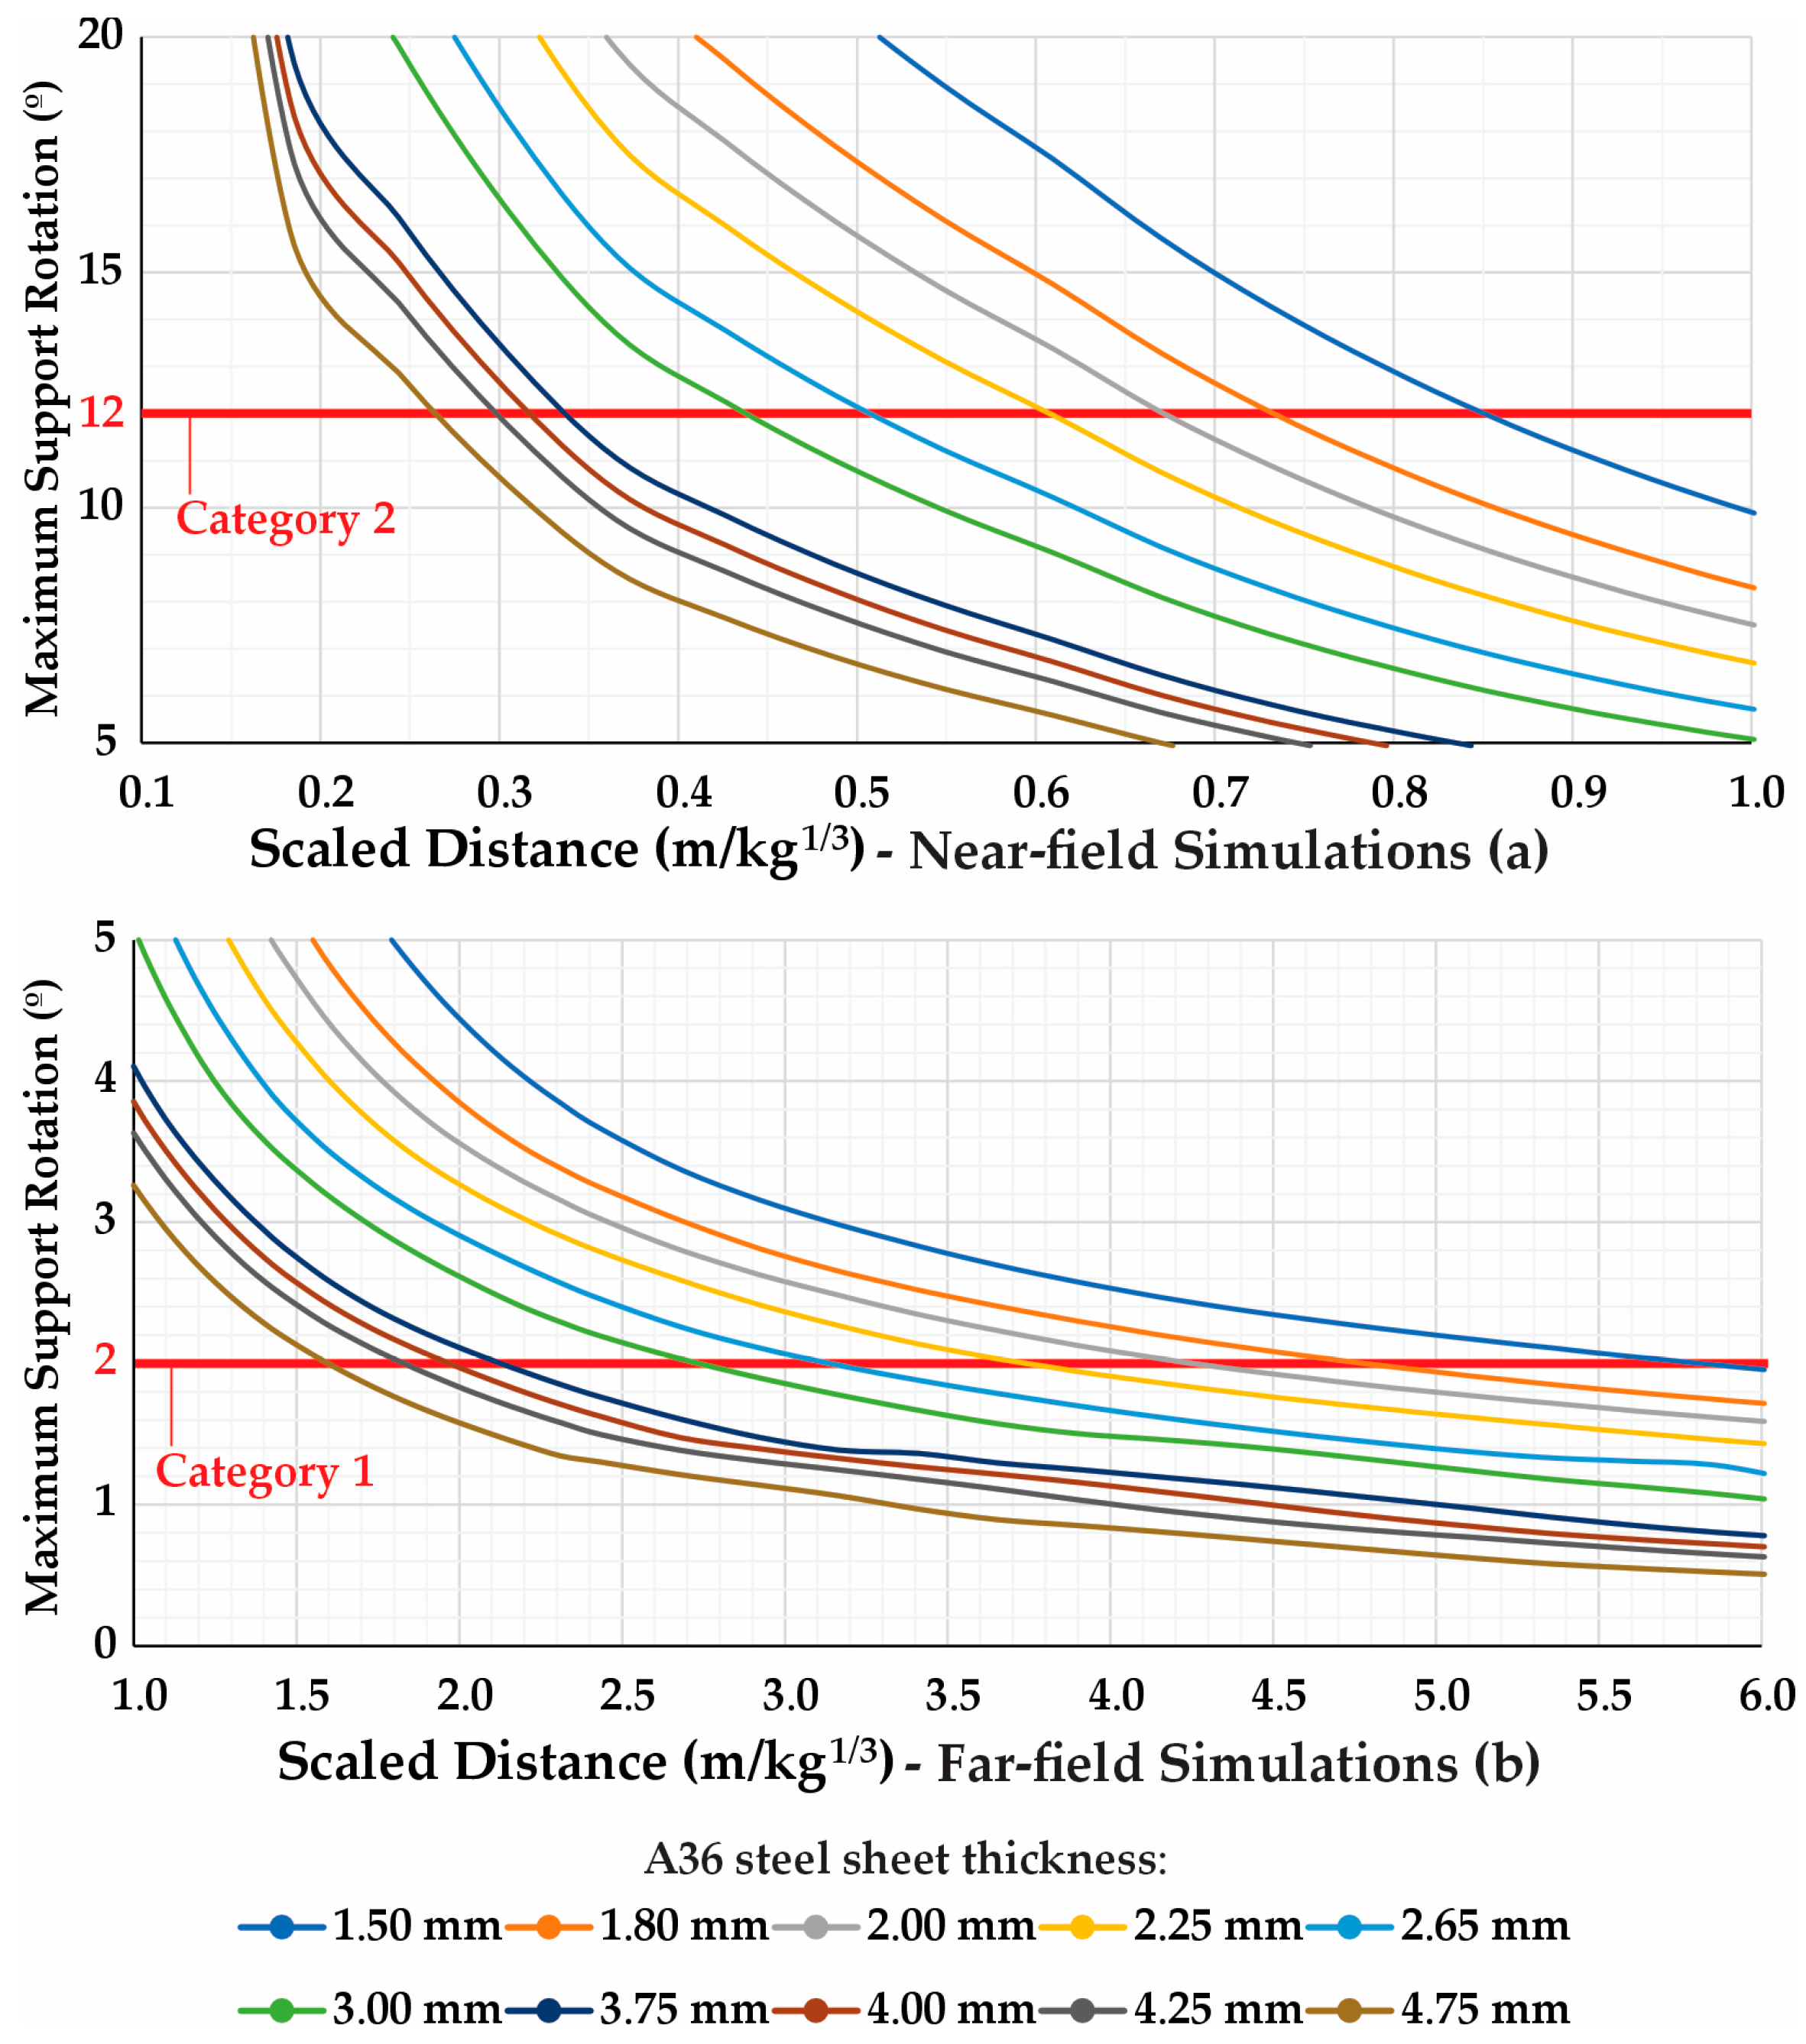
There are several methods for evaluating structural damage under blast loading. The method adopted in this research considers the maximum support rotation of structural elements, where larger angles naturally represent more severe damage. This approach is referenced, with slight variations, in design manuals [3], books [48], and research papers [12]. The chosen method follows the classification proposed by Cormie and Geoff [48], which defines two damage categories based on the deformation angle.
Category 1 is intended to protect personnel and equipment by mitigating blast pressures and shielding against primary and secondary fragments, as well as falling debris. For this category, a support rotation of 2° is recommended. Category 2 focuses on preventing structural collapse under blast loading, for which a support rotation of 12° is suggested. These limits generally correspond to significant plastic deformation and would require repair or replacement before reuse [48].
For bi-fixed problems dominated by bend efforts, like the proposed layout, the maximum support rotation θmax can be calculated using Equation (2) [48].
θ m a x = arctan 2   δ m a x L  
where:
δmax—Maximum displacement at the center of the sheet, obtained from the simulation;
L—Free span of the sheet.
An additional key parameter for assessing the intensity of a detonation is the scaled distance (Z), a metric commonly used to compare blast effects across varying standoff distances and explosive charge sizes. This parameter is generally determined using Equation (3) [39]
Z = R / W 3
where:
R—actual distance from the explosive charge to the target;
W—the mass of the explosive.
Using the scaled distance, it is possible to compare different events involving various types of explosives, charge masses, and distances. Two distinct detonation events with the same scaled distance at a given point in space—even if involving different explosive masses and standoff distances—will result in similar incident pressure (Pso). Therefore, it is possible to compare the present tests with real scenarios, such as bomb attacks.
Table 5 illustrates the TNT equivalent masses for selected explosive charges and devices, which will be used in the results analysis to compare the current study with real blast events.

3. Results

3.1. Blast Test Results

The maximum displacement at the center of the steel sheet was successfully measured for all six field tests using a high-speed camera. Figure 5 shows two examples of the steel sheets after detonation, for 500 mm (a) and 300 mm (b) standoff distances. The other sheets behaved similarly under the blast effect.
Figure 6 shows an example of a high-speed camera image capturing the maximum displacement of the steel sheet in one of the 300 mm standoff tests. This frame was recorded 3 ms after the detonation.

3.2. Preliminary Setup Simulation Results

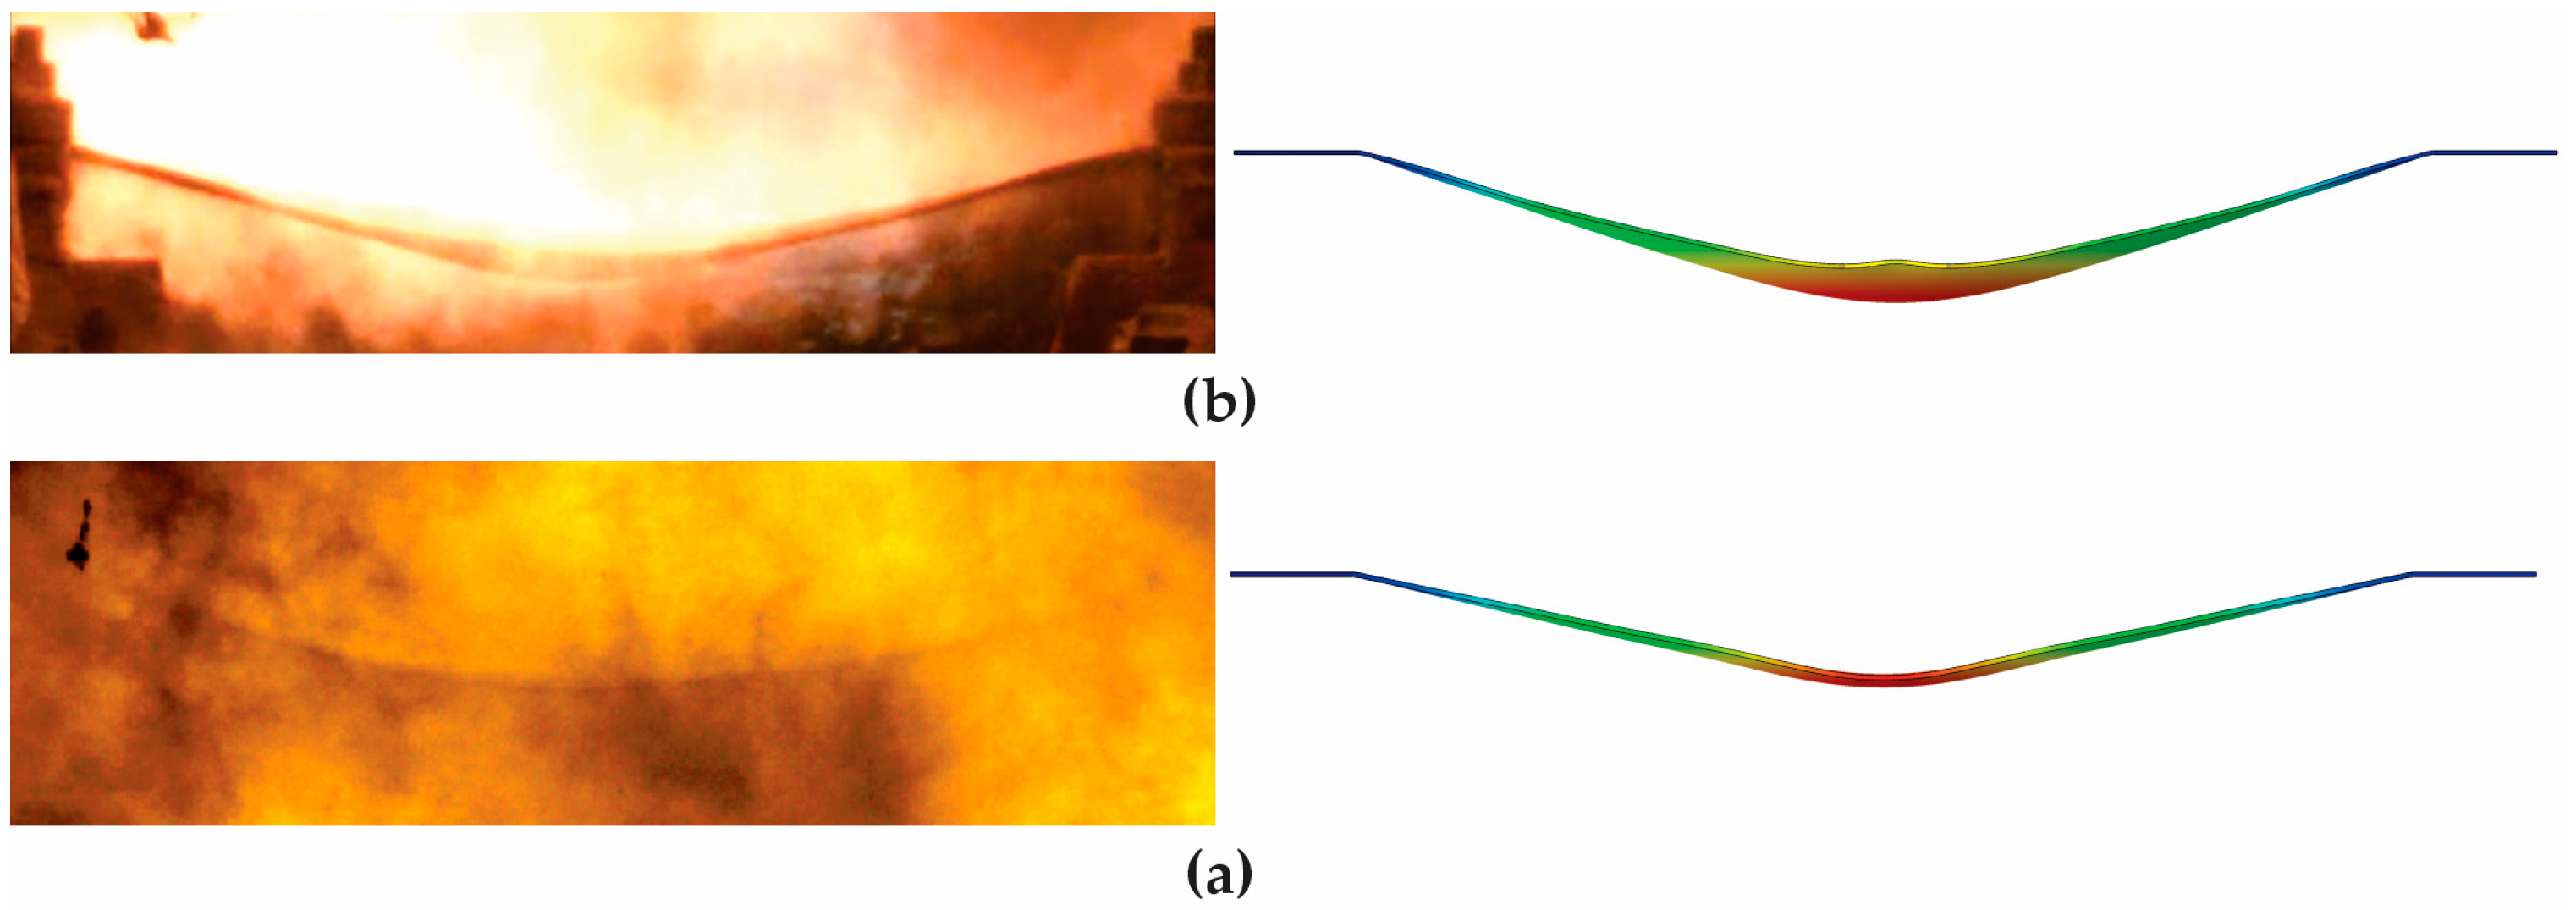
As described previously, the first six simulations were intended to be compared with the blast tests and to verify their reliability. Table 6 summarizes these results, comparing the maximum displacement at the center of the steel sheets in both the simulations and the tests. Figure 7 shows a lateral view comparing the peak displacements captured by the HSC during the blast tests (left side of the figure) and those predicted busingy the FEM simulations (right side) for standoff distances of 500 mm (a) and 300 mm (b).
As the stress–strain curve material model presented more conservative results, with greater maximum displacement, it was selected for the subsequent simulations. A deeper analysis of these results is presented in the Discussion section.

3.3. Global Simulation Results

The main set of 460 simulations was divided into two groups: near-field simulations, with standoff distances up to 1000 mm, and far-field simulations, with distances exceeding 1000 mm. This classification facilitated both the visualization and analysis of the results, as the differences between near-field and far-field responses are substantial. Figure 8 summarizes all of these results for the near-field (a) and far-field (b) regions. Each point on the curves represents a simulation. The maximum displacement is shown as a function of standoff distance for each A36 steel sheet thickness. Displacements greater than 150 mm were omitted, as they represent exaggerated scenarios.
On the other hand, Figure 9 presents the results in scaled units, providing a better representation of structural damage and making them applicable to different explosion scenarios. Each curve represents the structural maximum support rotation as a function of the scaled distance for a given steel sheet thickness. The graphs were also divided into near-field and far-field regions, with the division set at a scaled distance of 1 m/kg1/3. Horizontal red lines indicate the rotation thresholds for Category 1 (2°) and Category 2 (12°) protection levels. Individual simulations were omitted to improve visualization.
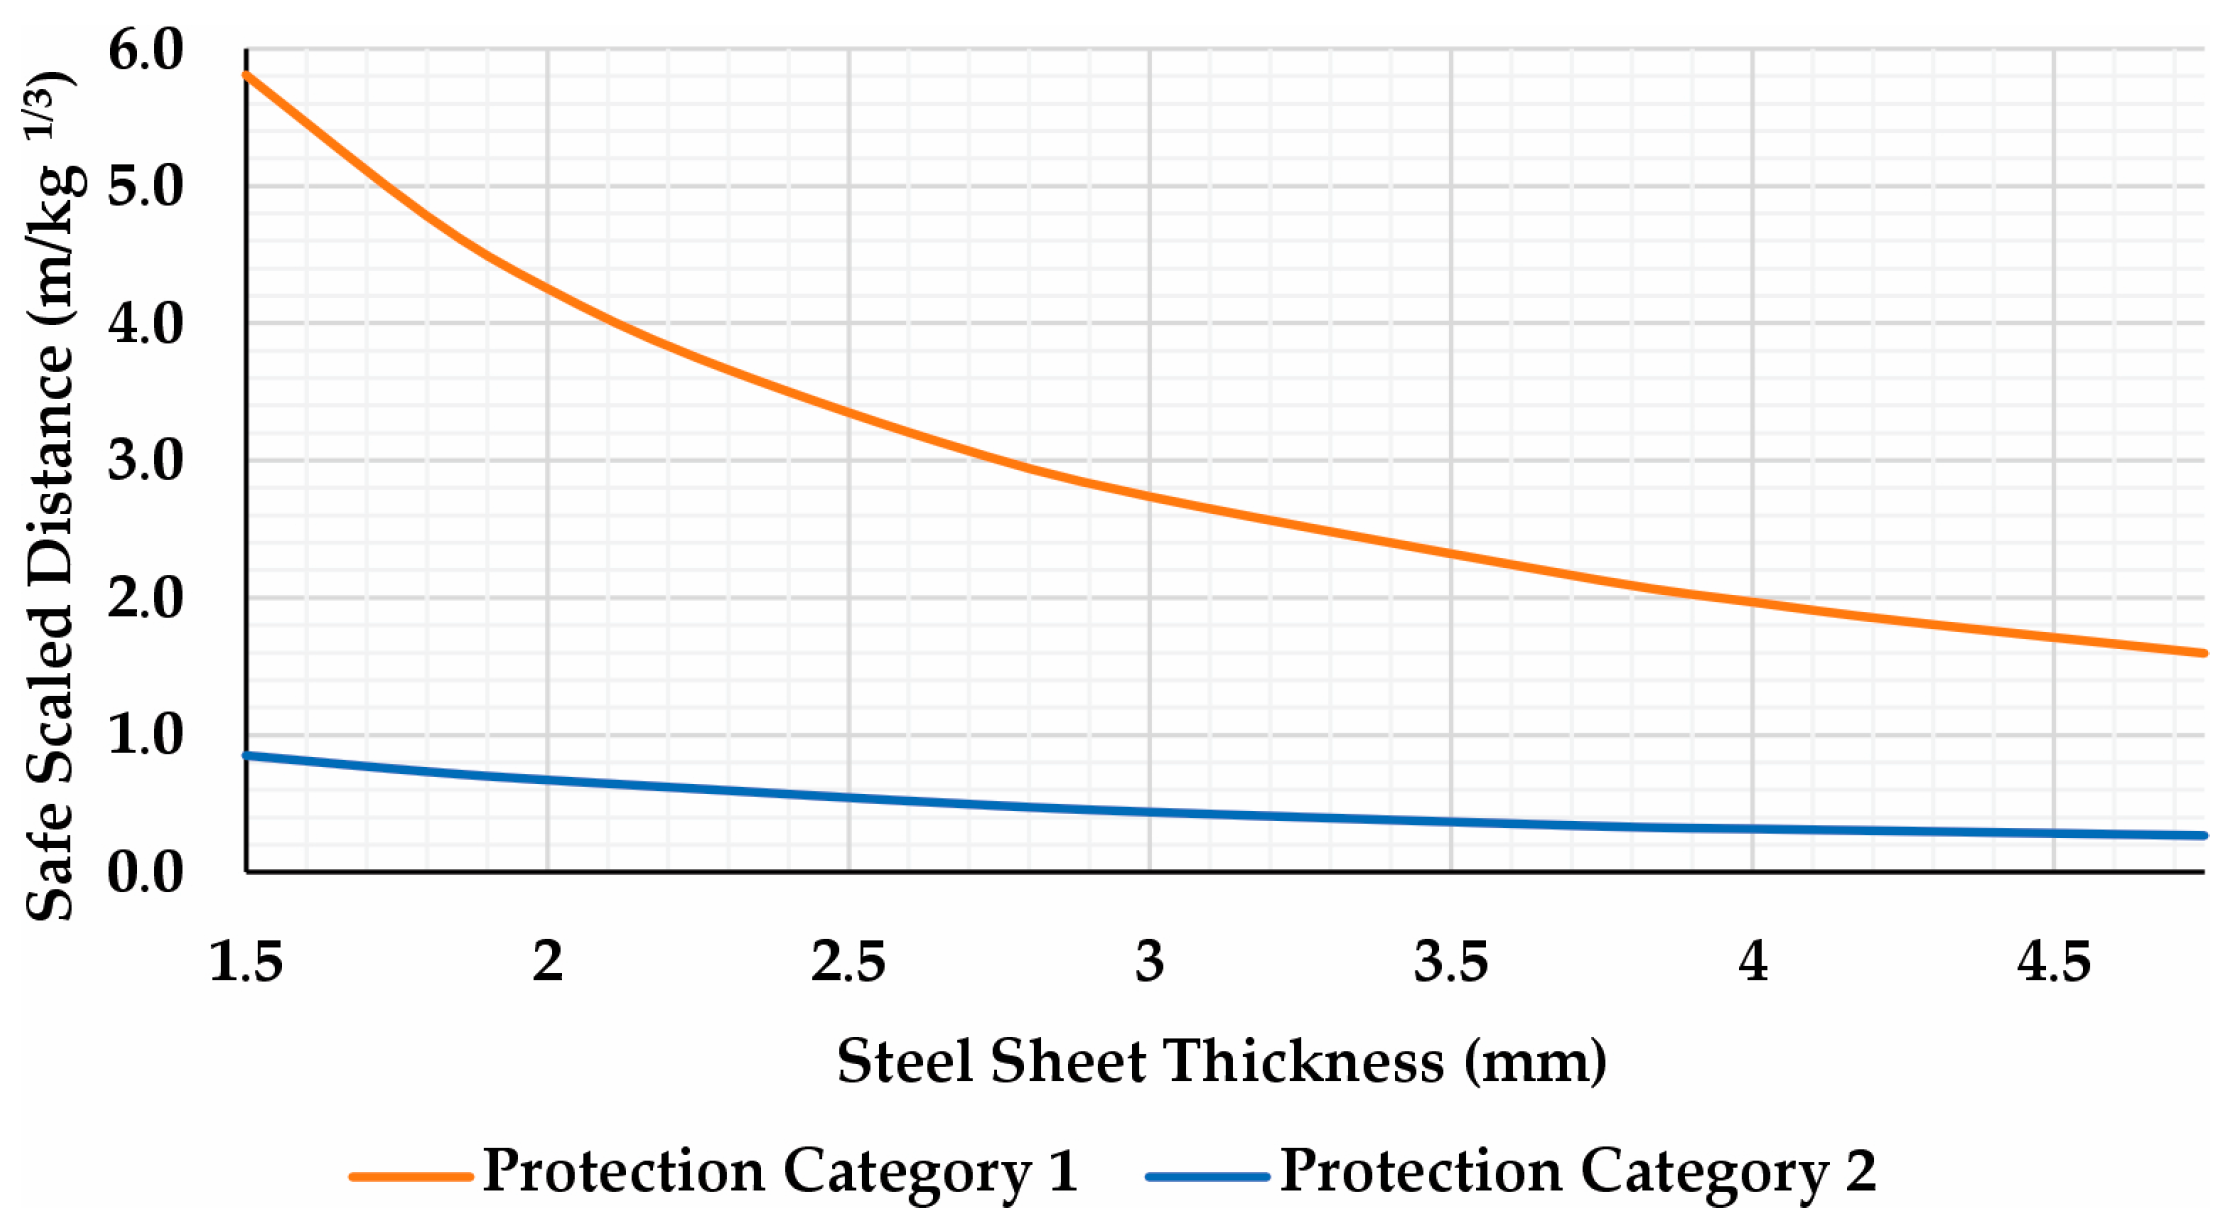
By intersecting the category lines with the curves in Figure 9, it is possible to determine the safe scaled standoff distance as a function of steel sheet thickness for each protection level, as shown in Figure 10.

3.4. Detailed Simulation Cases

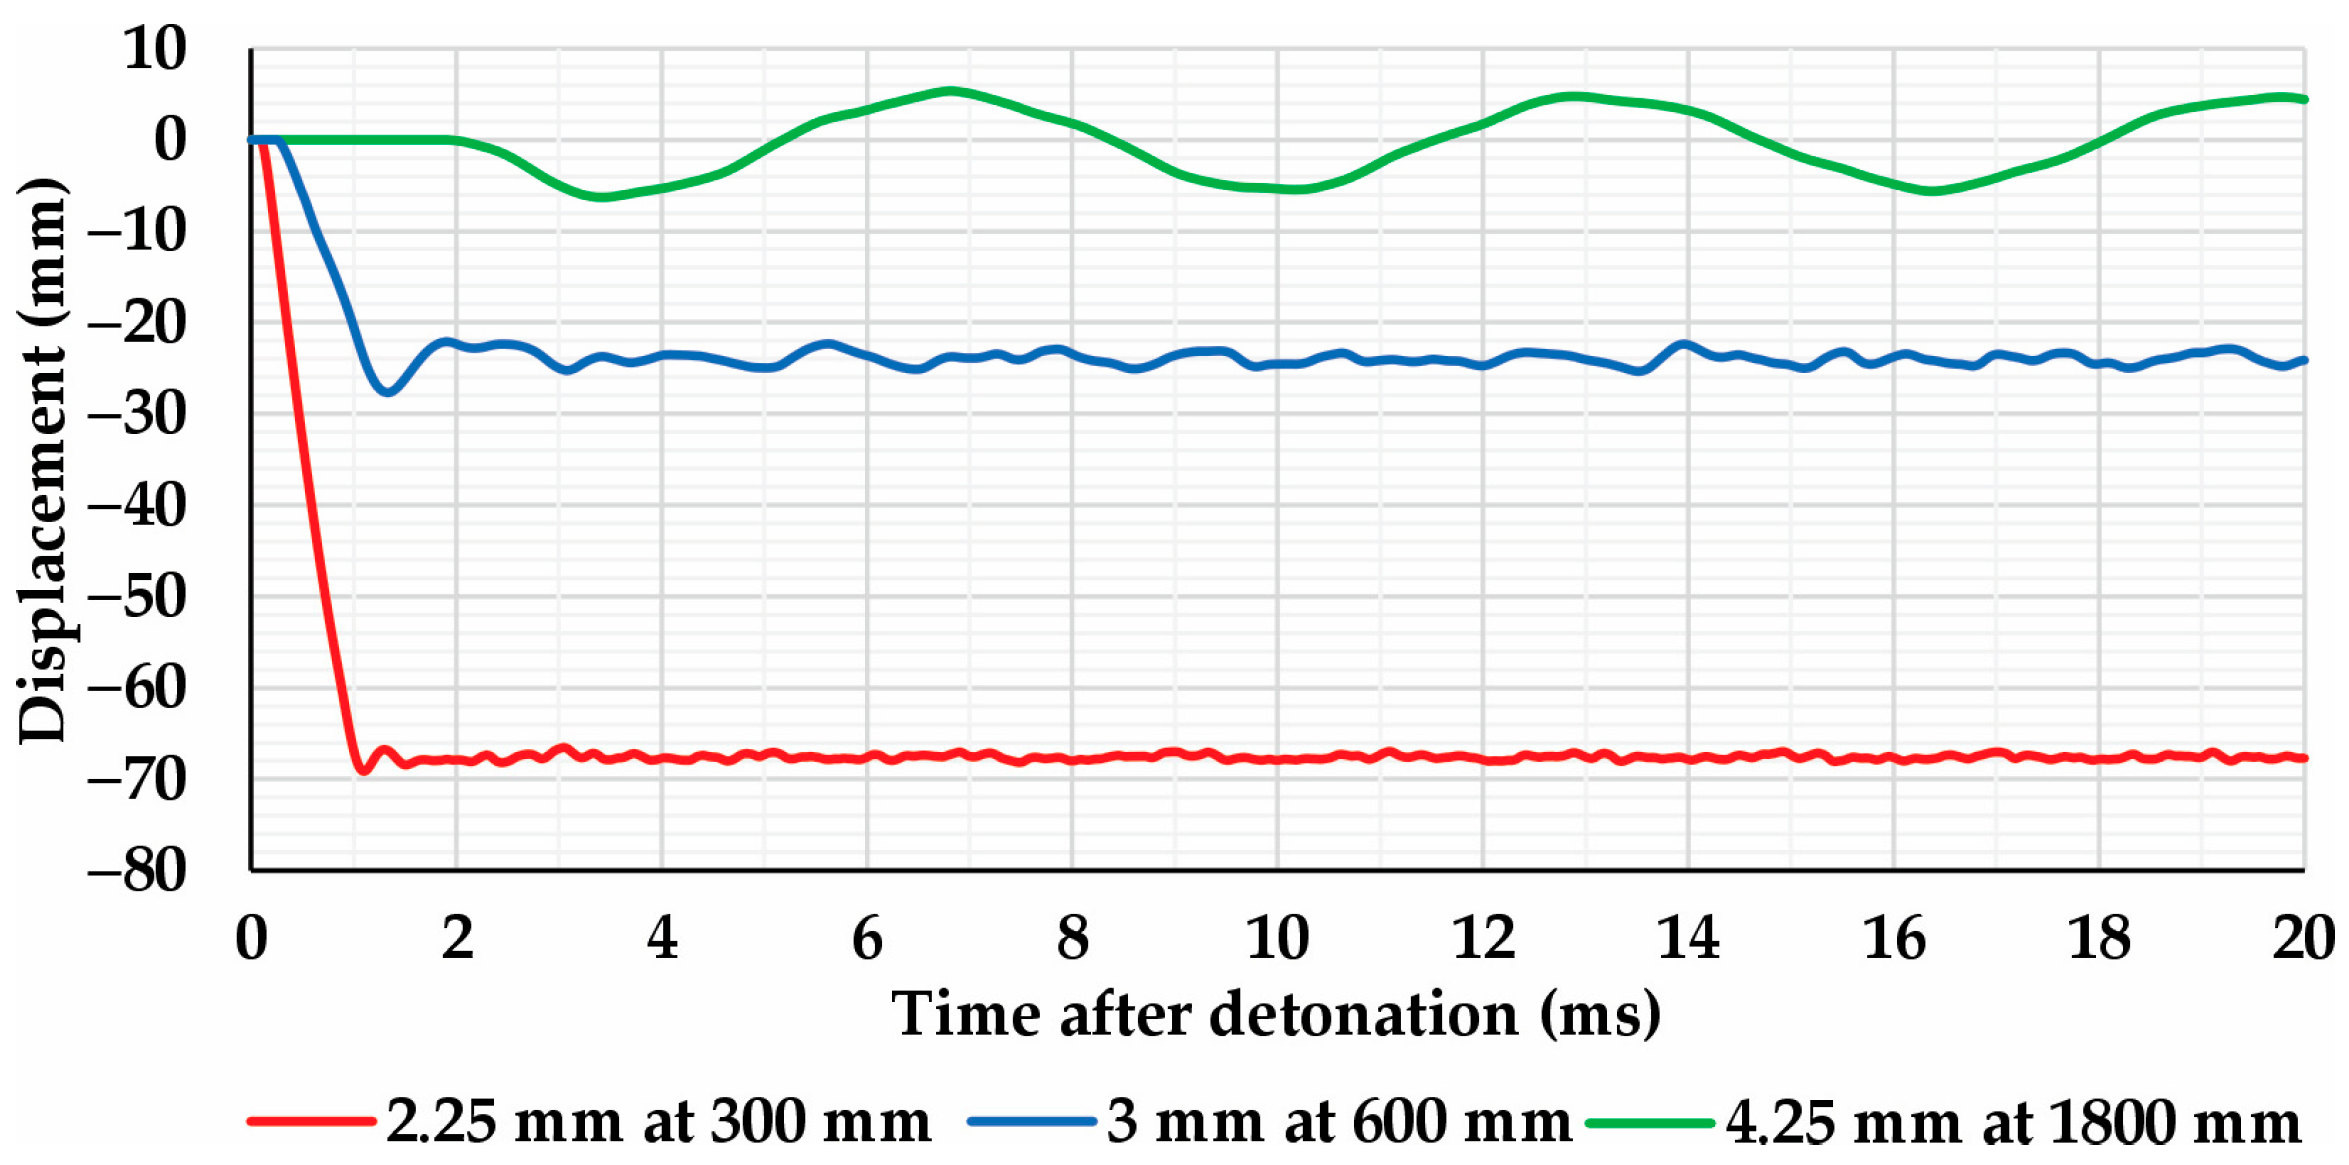
This section presents three representative simulation cases in greater detail, aiming to illustrate the structural response of A36 steel sheets under different blast intensities. The first case represents a high-intensity scenario, with a standoff distance of 300 mm and a sheet thickness of 2.25 mm. It resulted in a maximum displacement of approximately 69 mm and a support rotation of about 18°, exceeding the threshold for Category 2 protection. The second case corresponds to an intermediate condition, with a 600 mm standoff distance and 3.00 mm thickness, yielding a maximum displacement of around 27 mm and a rotation of approximately 7°. This configuration meets the Category 2 protection level but does not satisfy the stricter limits of Category 1. The third case represents a mild blast condition, with a standoff distance of 1800 mm and a sheet thickness of 4.25 mm, resulting in a maximum displacement of about 7 mm and a rotation of 1.7°, remaining within the limits of Category 1 protection. The simulations for these cases were conducted over a duration of 20 ms.
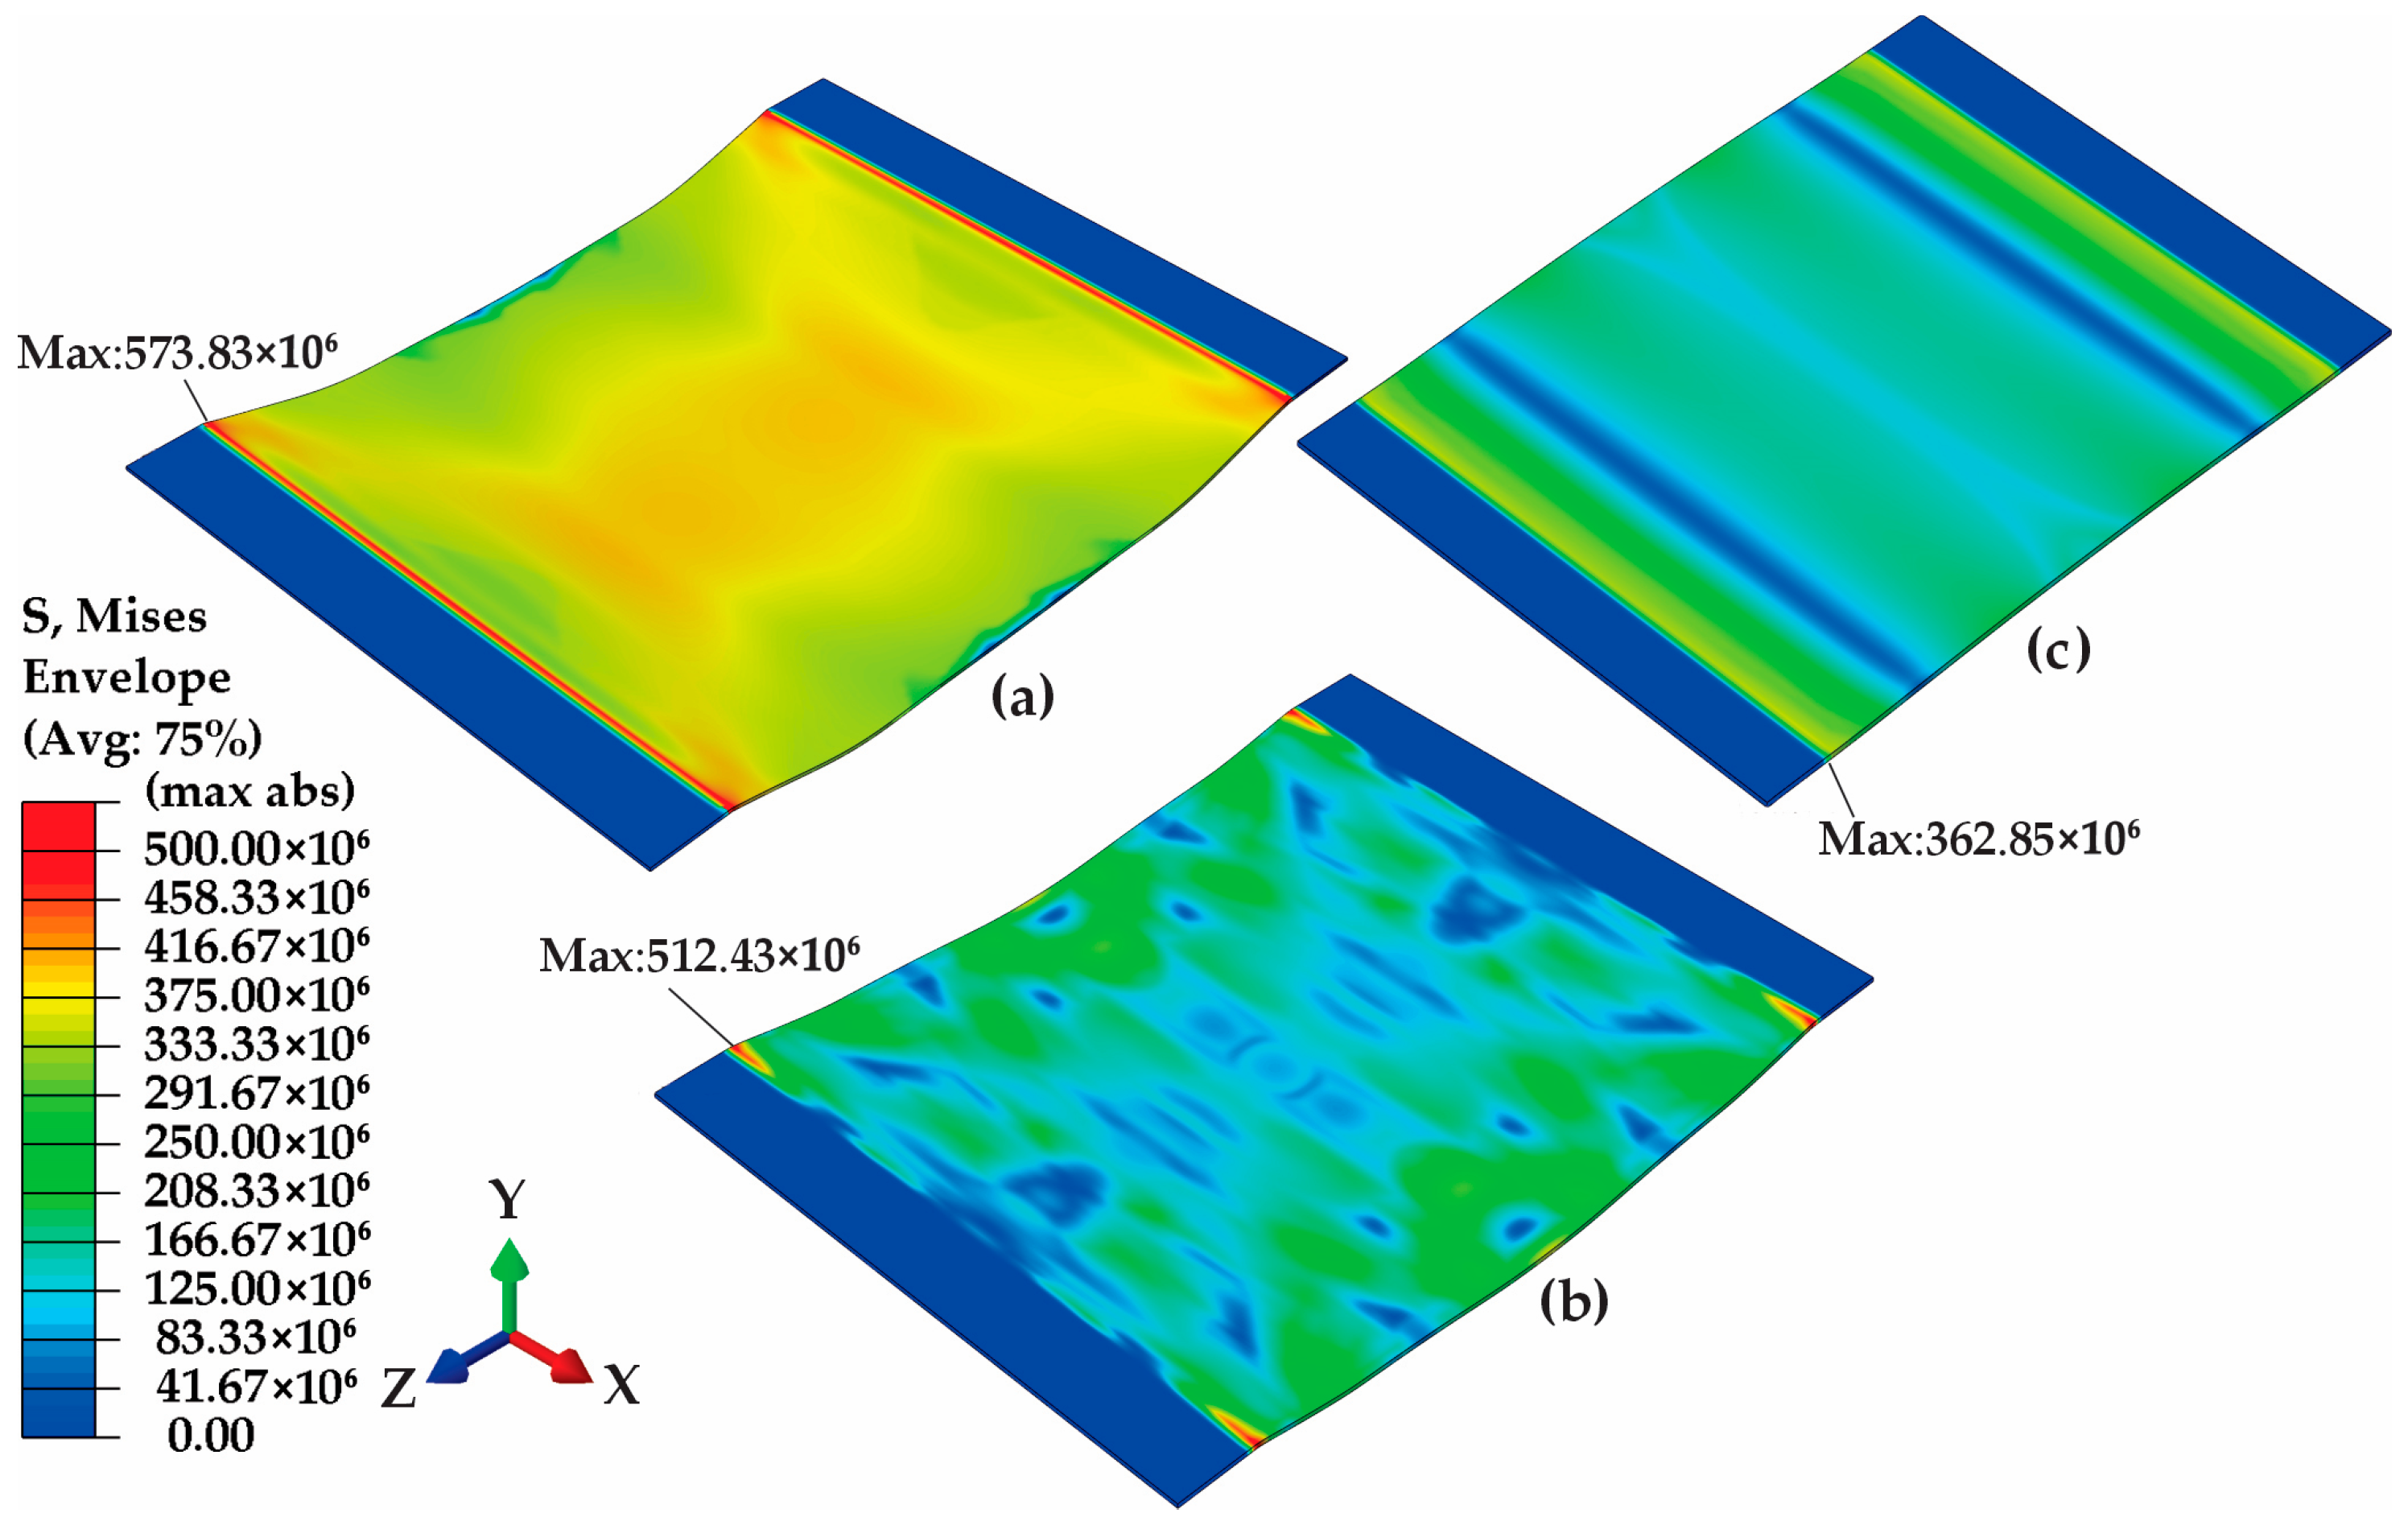
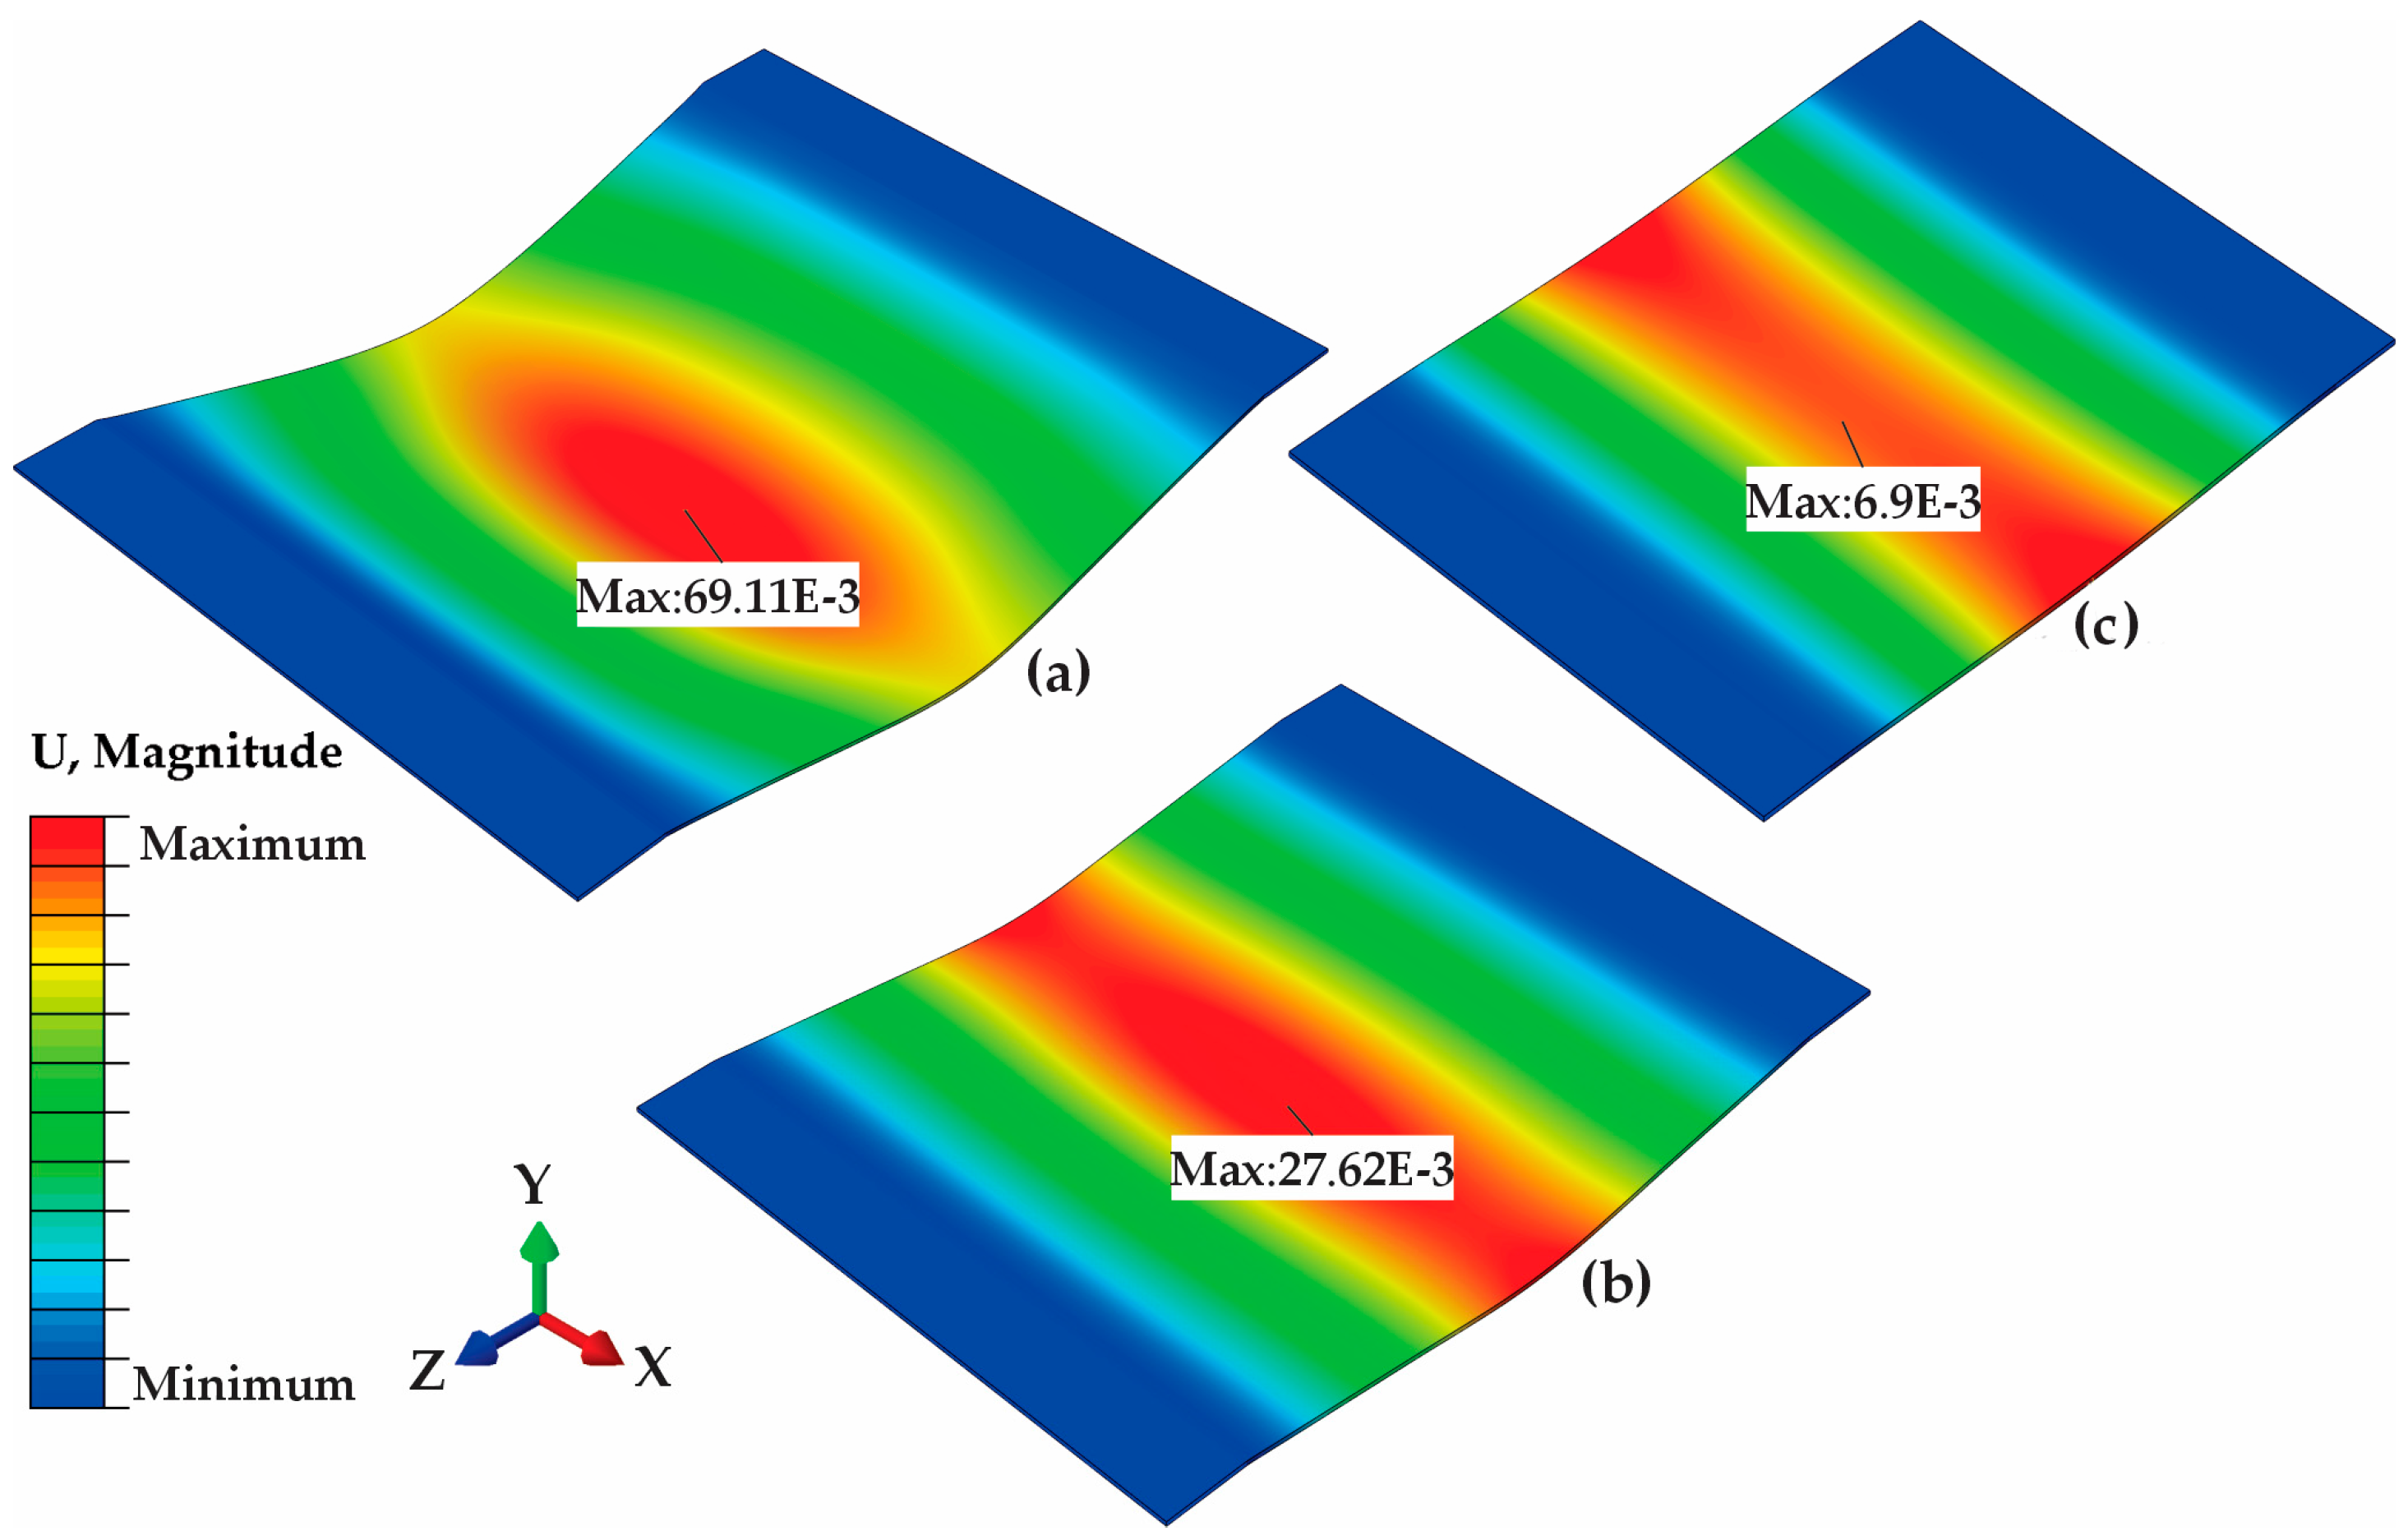
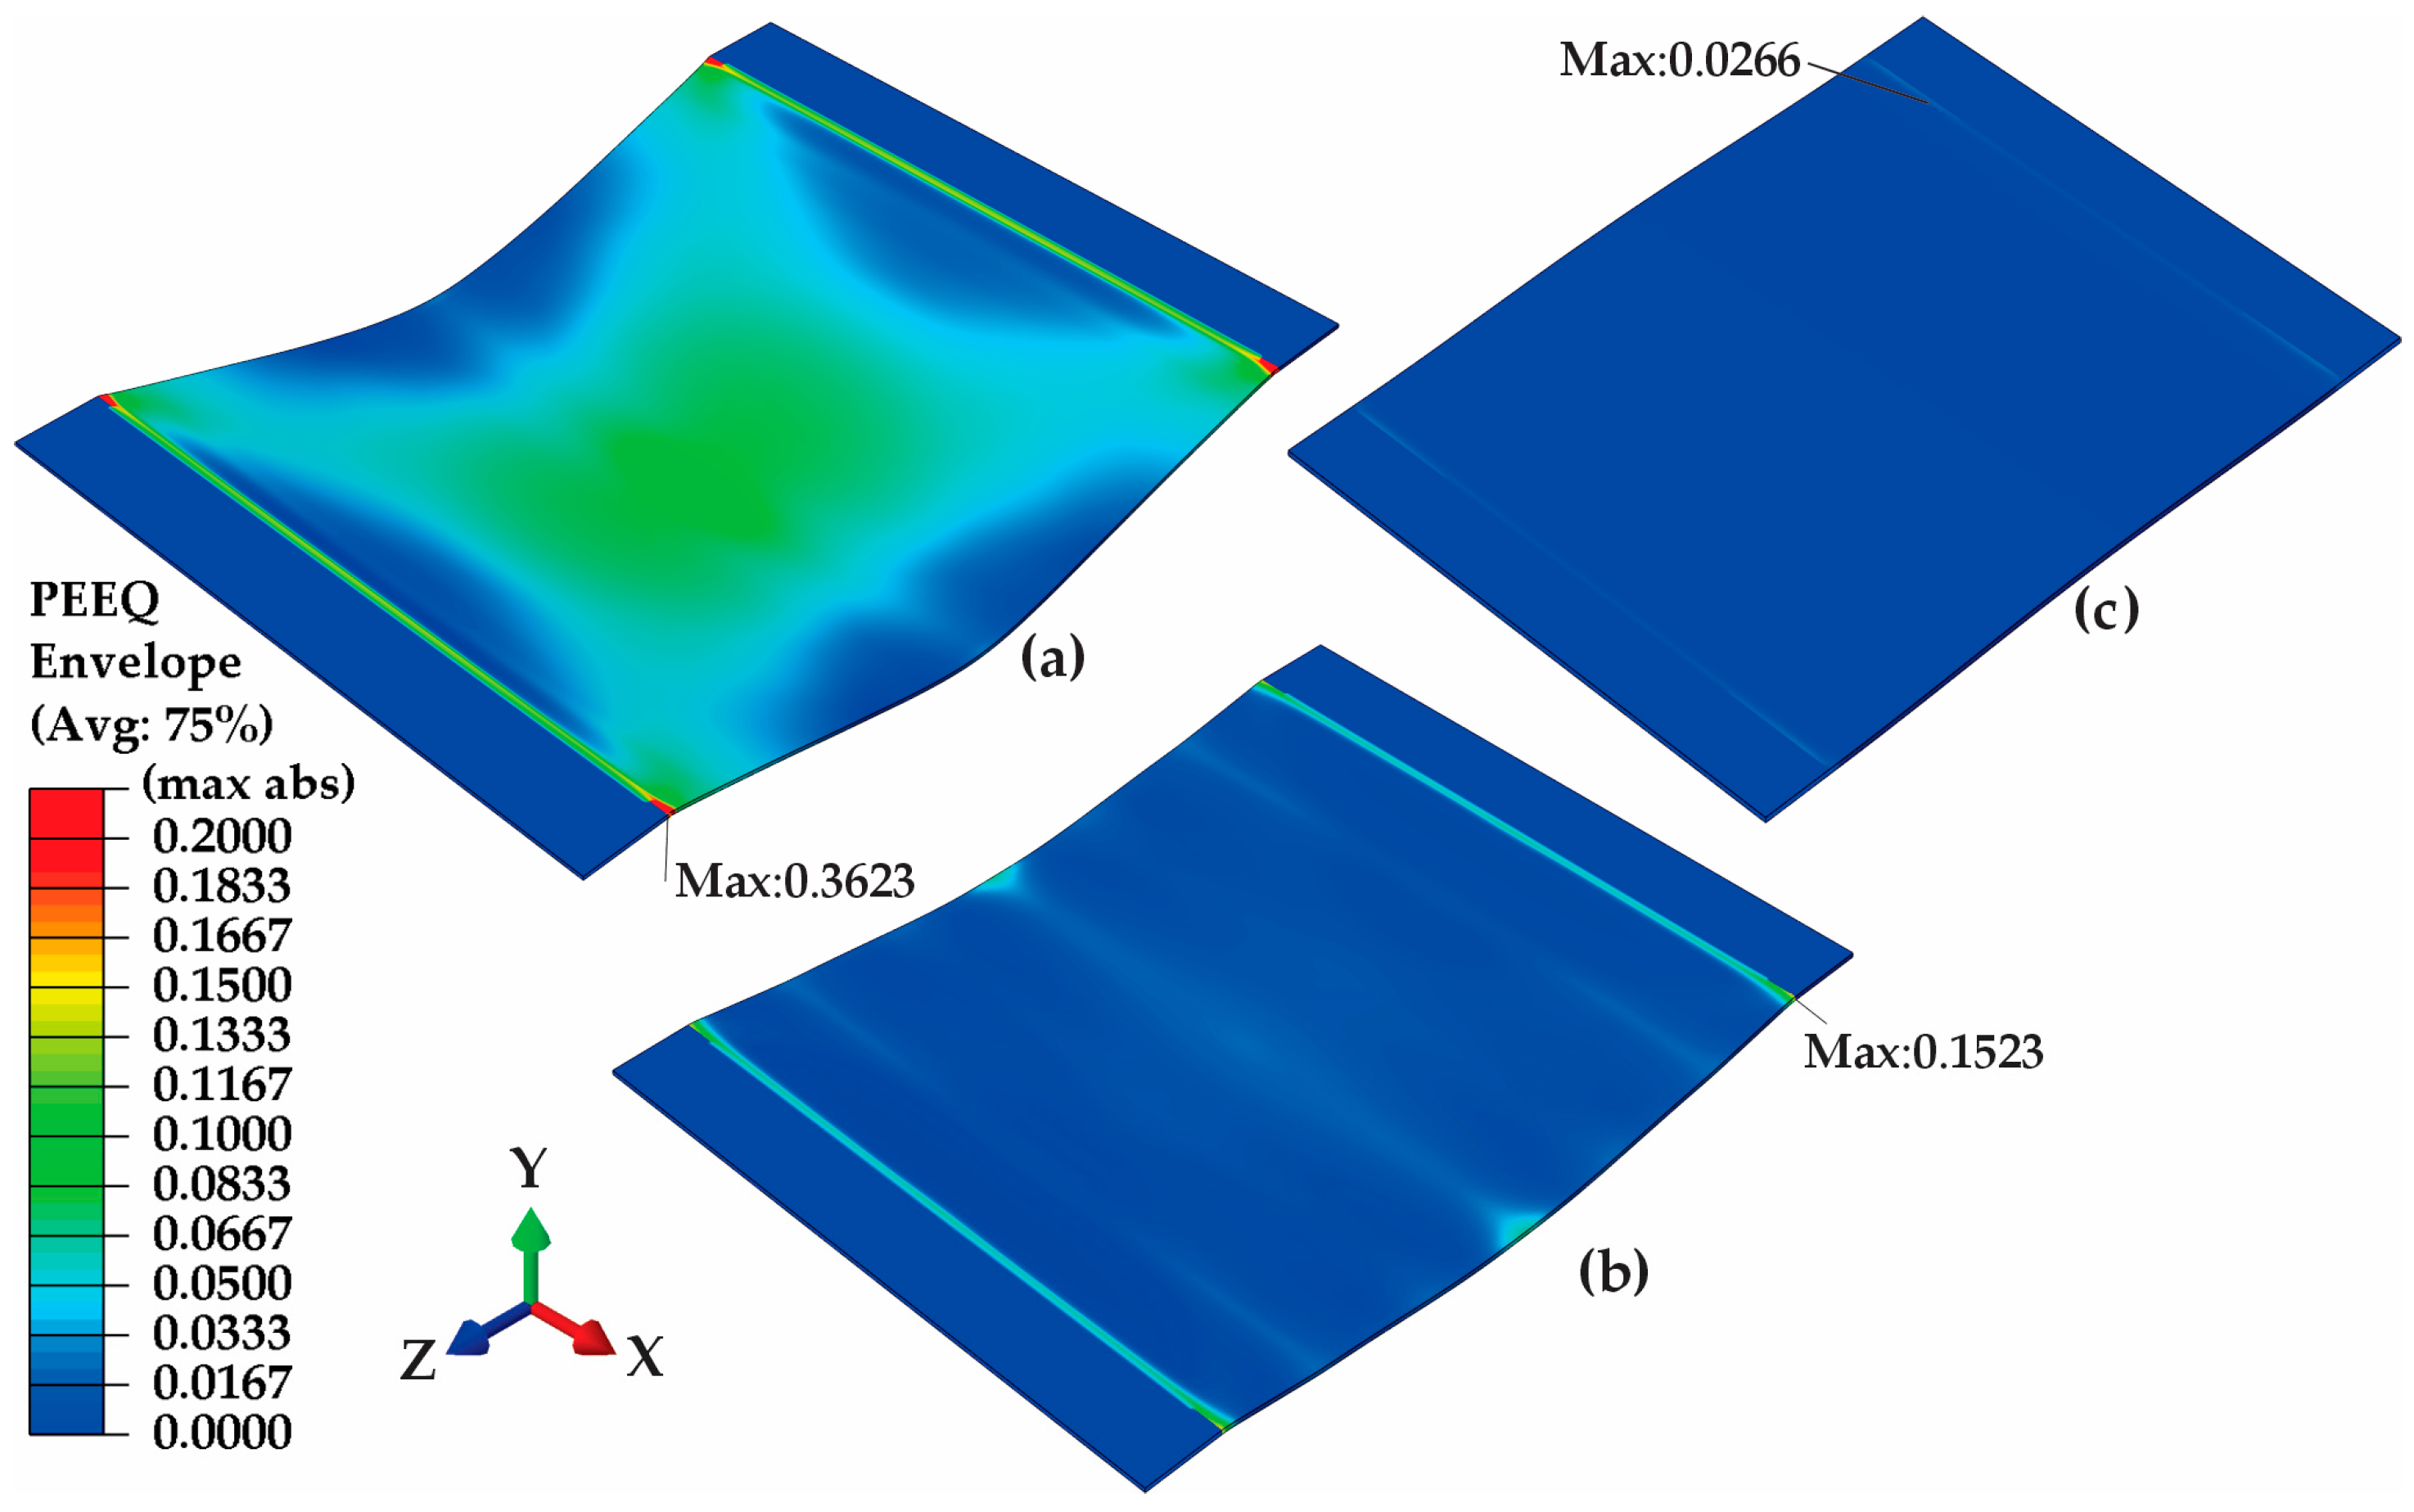
Figure 11, Figure 12 and Figure 13 present, respectively, the maximum values recorded throughout the entire simulation for Von Mises stress (S), displacement (U), and equivalent plastic strain (PEEQ), for a 2.25 mm thick steel sheet at 300 mm standoff distance (a), 3.00 mm at 600 mm (b), and 4.25 mm at 1800 mm (c). The position and value of each maximum are indicated by lines in each image. Additionally, Figure 14 shows the displacement at the center of the steel sheet over time for each scenario, allowing a direct comparison of the structural response dynamics.
Figure 15 presents the results of the finite element simulations (FEM), showing the displacement over time at three specific positions along the midline of the steel sheet: the center, one-third of the distance from the center to the edge, and one-sixth of that same distance. The results are shown for three blast scenarios: (a) a 2.25 mm thick sheet at a 300 mm standoff distance, (b) a 3.00 mm thick sheet at 600 mm, and (c) a 4.25 mm thick sheet at 1800 mm. These curves allow for a detailed comparison of the deformation distribution across the sheet for each condition.
Finally, Table 7 summarizes the maximum values at the sheet center for the three studied scenarios, including displacement, support rotation (θmax), velocity, and acceleration.

4. Discussion

4.1. Preliminary Simulations Analysis

Analyzing Table 6, the first conclusion is that the simulation using the stress–strain curve yielded the most conservative results. For this reason, it was adopted for the remaining simulations. At the standoff distance of 500 mm, this material model showed excellent agreement with the experimental results, with an error of less than 1 mm. On the other hand, at the 300 mm standoff distance, the stress–strain curve model produced a larger displacement than observed in the tests, confirming its suitability as a safe and conservative approach. It is important to note that a 20% safety margin was applied to the explosive mass, which increased the equivalent TNT charge used in the simulations.
The Johnson–Cook (JC) models produced smaller displacements compared to the stress–strain curve approach. At the 500 mm standoff distance, the use of JC resulted in a displacement lower than that observed in the tests. At 300 mm, the results were closer to the experimental values but still smaller than those obtained with the stress–strain curve. The difference in maximum displacement between the JC models with and without the strain-rate dependent term was less than 4%, indicating that, under the conditions evaluated in the present study, the influence of strain rate was not significant. This supports the use of the stress–strain curve, which does not account for strain-rate effects.
The previously published studies discussed in the Introduction section did not compare the FEM simulations using the JC material model with and without strain-rate effects. In the current research, the low influence of strain rate on the maximum displacement can be explained by the concentration of plastic strain. As observed in Figure 13, even in an aggressive blast environment, the more intense deformation occurred in the boundary regions of the steel sheet, where the velocities and strain rates involved are significantly lower than at the center of the structure.
The better results obtained with the stress–strain curve, a simpler method compared to the JC model, can be attributed to the adoption of actual values specific to the batch of steel sheets employed in this study, as provided by the manufacturer through laboratory testing. In contrast, the JC parameters were referenced from the open literature and may utilize steel produced in different markets and industrial settings. Variations between steel batches may influence the mechanical response and, consequently, the simulation results.
It is important to clarify that this difference occurred in the specific scenario presented in the current work. The comparison was conducted to identify the most suitable material model to be used exclusively in our proposed layout. It is not necessarily true that all structures subjected to blast effects will exhibit the same behavior. This analysis is important to highlight to academic researchers the relevance of evaluating different material models using the FEM method.
Nevertheless, the material models investigated herein yielded acceptable results. The relative difference between the simulations and the experimental data was always below 17% across all scenarios and was considerably smaller in most cases. These differences are expected, given the assumptions made, the simplifications inherent to the FEM simulations, and the natural variations between physical testing and numerical modeling. The order of magnitude of these differences is consistent with that observed in similar studies, as discussed in the literature review included in the Introduction section. Furthermore, the selected material model resulted in displacements that were similar to or greater than those observed in the tests, which is expected when loads are increased by a safety factor.
Finally, Figure 7 demonstrates the similarity between the frame captured by the HSC during the blast field tests and the FEM simulations. This comparison, taken at the peak moment of deformation, shows a matching silhouette of the steel sheet under both conditions, confirming the validity of the numerical method presented.

4.2. Global Simulation Analysis

The primary observation from the results presented in Section 3.3 is that thicker steel sheets and greater standoff distances lead to smaller maximum displacements and support rotations. This outcome is expected and physically meaningful, indicating consistency in the simulation. Another aspect highlighted by the results is the variation in damage intensity as a function of distance. In the near-field range, displacement varies significantly even with small changes in distance, whereas in the far-field, the variation is more gradual. This behavior is explained by the cubic reduction of blast effects, as the shock wave disperses spherically through the air.
On the other hand, the variation in steel sheet thickness has a more consistent effect on the safe scaled distance. For example, in Figure 10, for Protection Category 1, when the sheet thickness increases from 1.5 mm to 4.75 mm—approximately a 3.2-fold difference—the safe scaled distance decreases from 5.8 m·kg−1/3 to 1.6 m·kg−1/3, resulting in a reduction factor of about 3.6. In this same graph, it is evident that Category 1 requires much larger safe distances compared to Category 2. In other words, ensuring occupant safety is a more challenging design objective than merely preventing structural failure. This difference is especially noticeable in thinner steel sheets, highlighting the importance of robust structural elements for effective human protection.

4.3. Comparison of the Simulations with Real Blast Events

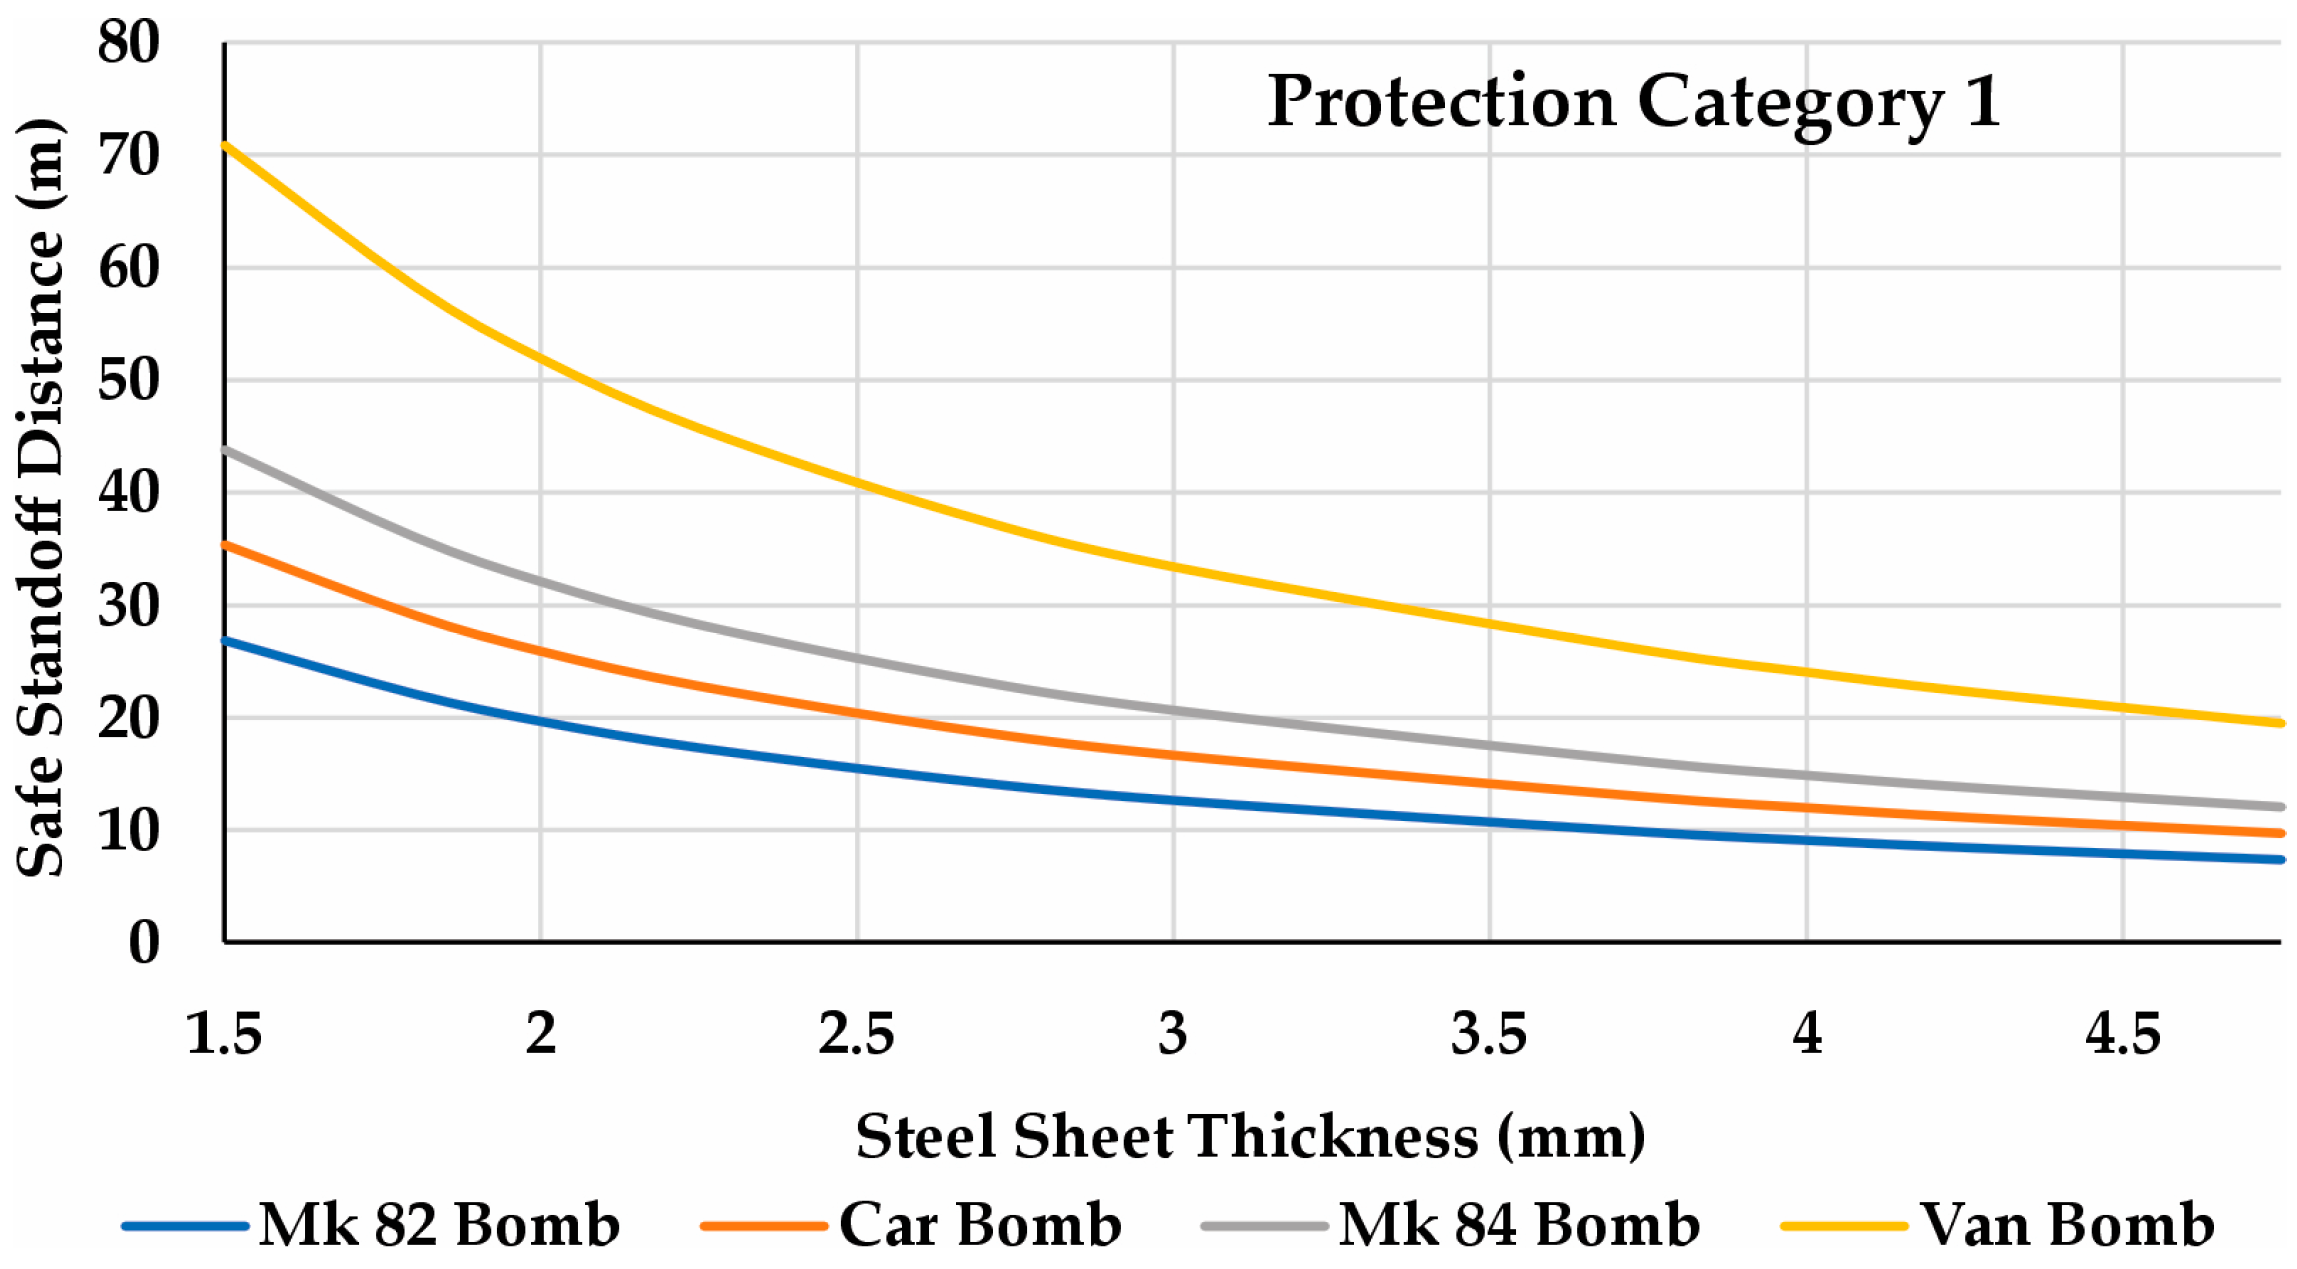
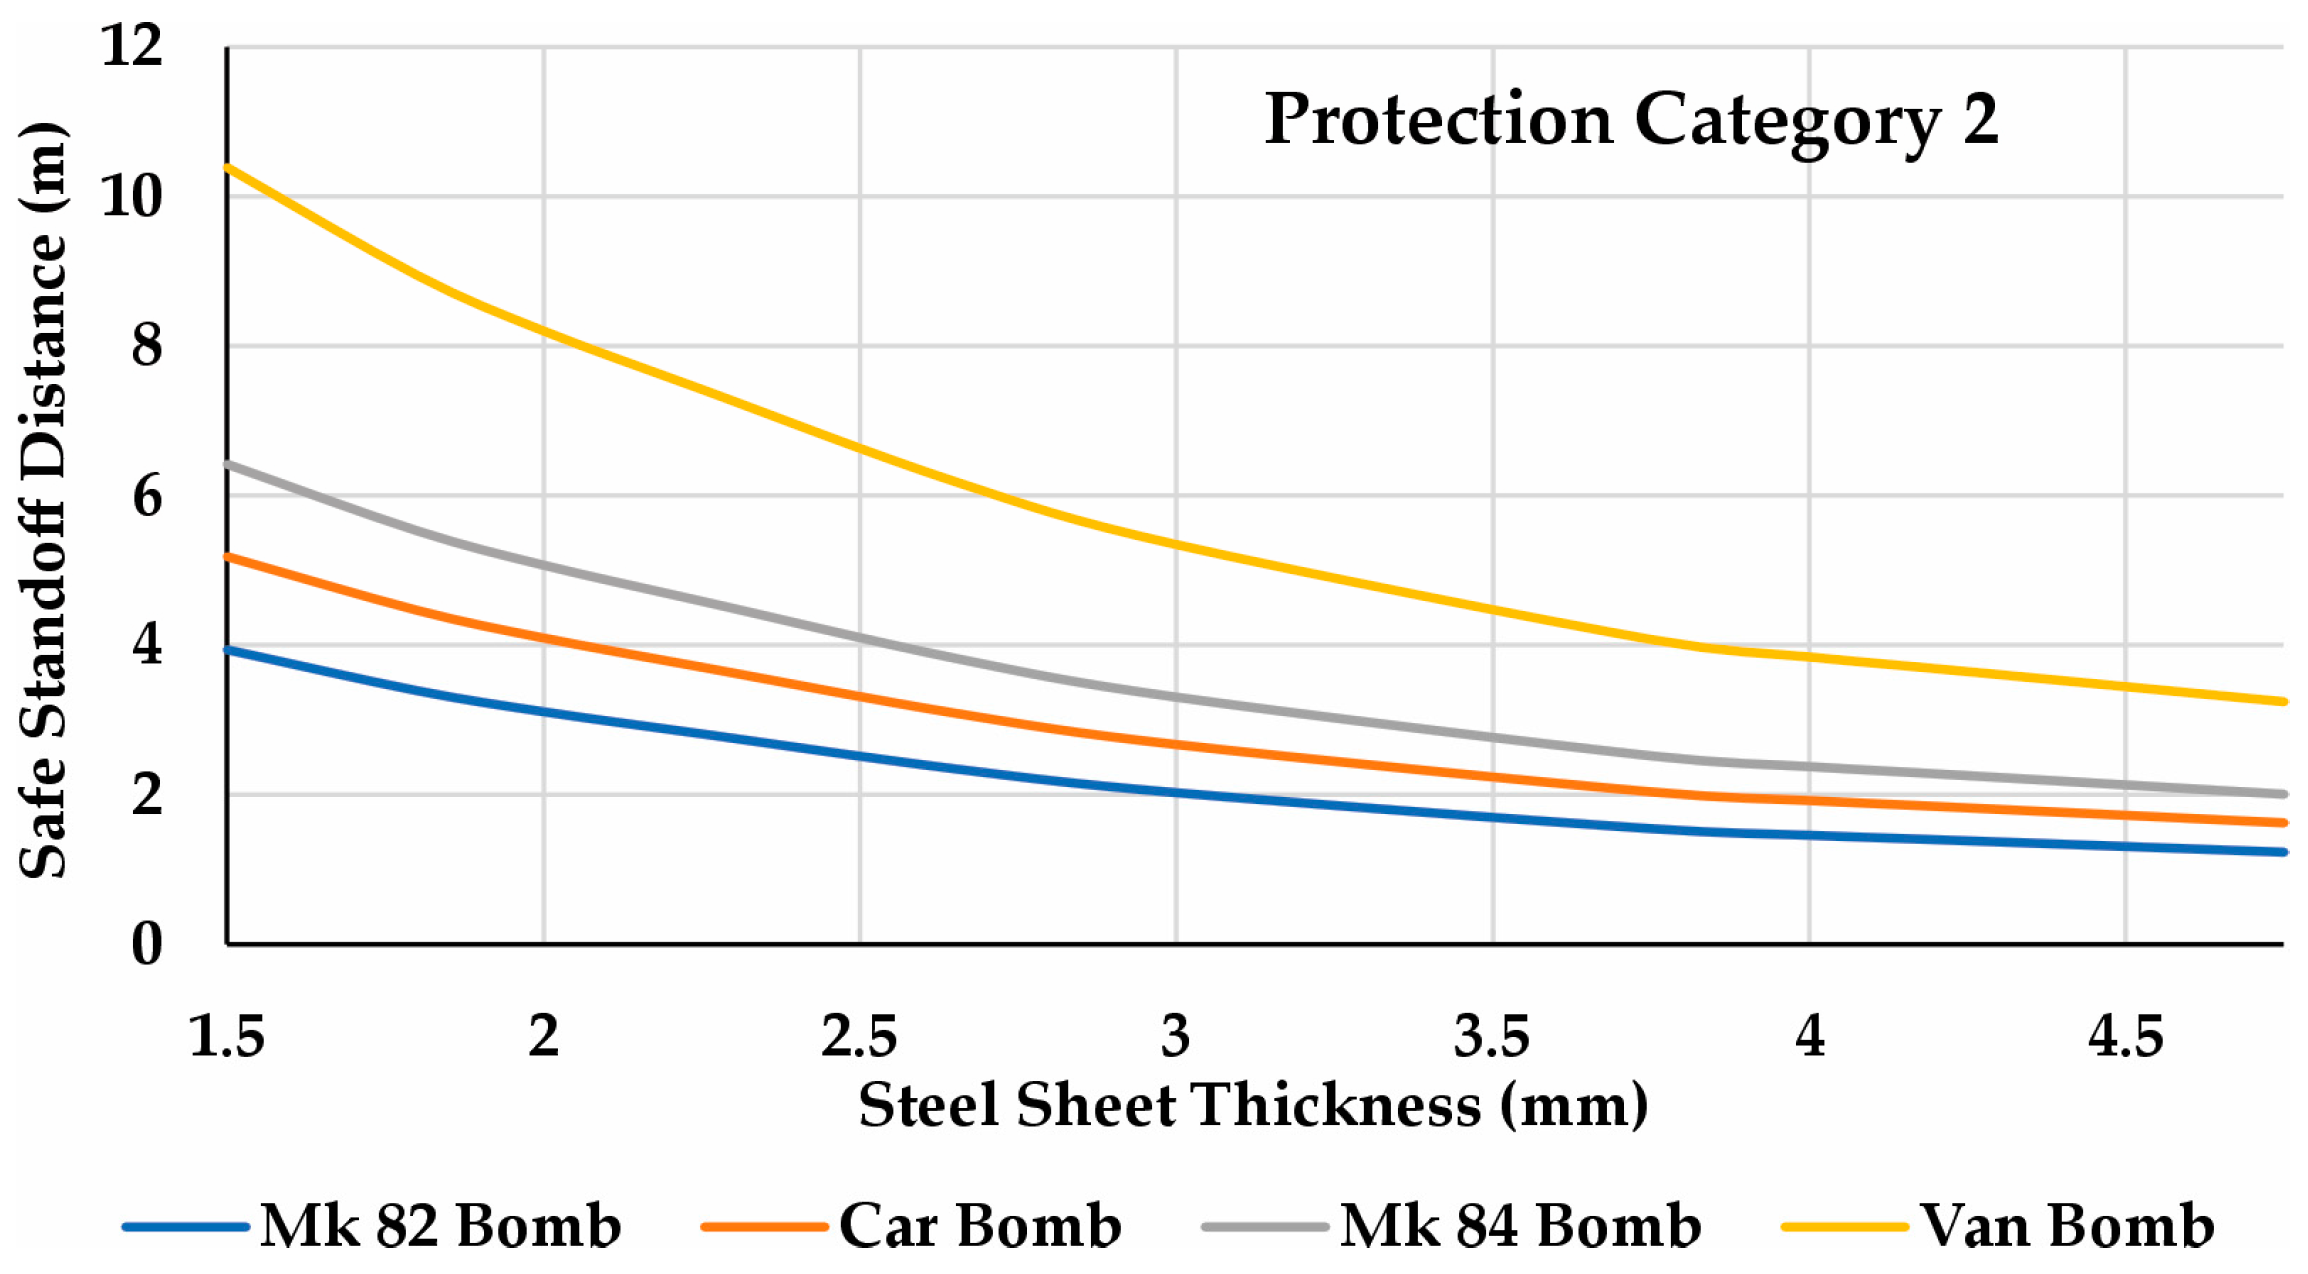
The results presented in the graph from Figure 10, while providing a good understanding of how steel sheet thickness affects the required safe scaled distance for different protection categories, do not offer a direct indication of how these conditions relate to real blast events. However, by applying the concept of scaled distance (Equation (3)) and the TNT equivalence values for explosive charges listed in Table 5, it is possible to establish a relationship between steel sheet thickness and the actual safe standoff distance for each explosive device and protection category. Figure 16 and Figure 17 present, for Protection Category Levels 1 and 2, respectively, the curves defining the minimum actual safe standoff distance as a function of A36 steel sheet thickness for various explosive devices.
The graphs presented above provide important insights for determining safety distances in existing buildings that may be potential targets of explosive attacks. Some conclusions drawn from the analysis of these curves are similar to those obtained from the scaled distance graph, such as the importance of using more robust and thicker structures under severe explosive conditions, and the significantly more restrictive requirements associated with Category 1 protection.
It is evident that the 1.5 mm sheet is highly vulnerable to more intense explosive attacks, requiring a standoff distance of over 70 m to ensure personnel protection and more than 10 m to prevent structural collapse under a van bomb detonation. These values are reduced to approximately 20 m and 4 m, respectively, when using a 4.75 mm thick sheet. Even for thicker structures, the destructive potential of large explosive charges remains considerable, as they are still capable of causing significant damage to both people and buildings, thus requiring substantial standoff distances. This underscores the importance of implementing protective barriers around critical and historical buildings to prevent the approach of potentially harmful vehicles.

4.4. Detailed Simulation Analysis

To simplify references throughout the text, the simulation carried out with a standoff distance of 300 mm and a sheet thickness of 2.25 mm will be referred to as the aggressive condition, since the deformation exceeded the threshold for Protection Category 2. The simulation at a 600 mm standoff distance with a 3.00 mm thick sheet will be referred to as the intermediary condition, falling between Categories 1 and 2. Finally, the simulation conducted at 1800 mm with a 4.25 mm thick sheet, which met even the limits of Category 1, will be referred to as the milder condition.
Figure 11 shows the maximum Von Mises stresses observed during the simulations, reaching 573 MPa, 512 MPa, and 362 MPa for the aggressive, intermediary, and milder conditions, respectively. In all cases, the maximum stresses exceeded the yield strength of the steel in certain regions, resulting in plastic deformation. In the aggressive condition, the stress reached the ultimate strength of the material, indicating the onset of rupture—an expected outcome after exceeding the threshold defined by Protection Category 2. Throughout the sheet, the stress levels were high, with the peak stress concentrated along the edges near the fixed boundaries. This edge concentration was also observed in the intermediary and milder conditions; however, in those cases, the stress levels across the remainder of the sheet were lower and did not reach the material’s strength limit.
Figure 12 shows the instant when the displacement at the center reached its maximum value—approximately 69 mm, 28 mm, and 7 mm for the aggressive, intermediary, and milder simulations, respectively. In the aggressive condition, the deformation at the center is more pronounced, while in the milder condition, the deformations are more evenly distributed along the midline of the sheet. The displacement over time at the center of the sheet, shown in Figure 14, highlights important differences in the material’s behavior under blast loading. In the aggressive condition, the steel sheet reaches its maximum deformation in about 1 ms and shows no elastic response, maintaining this deformation throughout the simulation. In the intermediary condition, the sheet reaches a lower displacement over a slightly longer time and exhibits a small oscillatory response after the first peak, while remaining close to its maximum deformation. On the other hand, in the milder condition, the steel sheet begins to vibrate as an elastic element and takes longer to reach its maximum displacement due to both the delayed arrival of the blast wave and the slower dynamic response. These results confirm that more aggressive blast environments lead to plastic and irrecoverable deformation, whereas milder conditions allow for partial elastic recovery.
The maximum equivalent plastic strain, presented in Figure 13, helps to illustrate and better understand this plastic deformation behavior. In the aggressive condition, plastic deformation is distributed across the entire sheet, with severe damage concentrated at the corners of the fixed boundaries. In these regions, the strain level indicates imminent failure, as the plastic strain exceeds 36%. In the intermediary blast condition, plastic deformation is primarily concentrated along the same edges and in some regions along the sheet’s midline, with a maximum value of approximately 15%. Finally, in the milder condition, plastic strain appears exclusively near the boundaries and remains below 3%, which explains the predominantly elastic behavior observed.
Figure 15 shows a detailed analysis of the displacement behavior of the steel sheet at different positions along its central line under varying blast scenarios. As expected, the displacement is not uniform across the surface. The central region consistently exhibits the highest displacement, while the areas closer to the supports—one-third and one-sixth of the midline—show significantly lower values. This gradient is consistent with the mechanical response of a bi-supported structure subjected to a distributed dynamic load, where the boundary conditions restrict deformation near the edges.
Moreover, the differences in displacement between the three monitored positions become more pronounced under more severe blast conditions—that is, when the explosive is placed closer to the sheet and the steel is thinner. This effect is clearly observed in scenario (a), corresponding to the 2.25 mm thick sheet at a 300 mm standoff distance. In this case, the increased blast intensity and reduced structural stiffness result in greater central deformation and a sharper contrast between the displacement at the center and near the edges. Conversely, in scenario (c), which uses a thicker 4.25 mm sheet and a larger 1800 mm standoff distance, the overall displacements are smaller, and the differences between the three monitored positions are less pronounced. This suggests a more uniformly distributed structural response due to the reduced blast pressure and increased stiffness.
The final analysis refers to Table 7, which presents a series of maximum values at the center of the steel sheets. All values are physically consistent, showing a clear decrease in intensity under milder conditions. The velocities at the center reached significant levels of approximately 90 m/s, 35 m/s, and 7 m/s for the aggressive, intermediary, and milder conditions, respectively. The most remarkable result relates to acceleration, which reached about 2.5 × 10⁵ g in the aggressive scenario. Even in the milder condition, acceleration exceeded 2 × 10³ g. These values demonstrate the extremely rapid response and the intense forces involved in the dynamic behavior of structures subjected to blast loading.

5. Conclusions

The conclusions of this article can be summarized as follows:
  • This research investigated the behavior of A36 steel thin sheets under the effects of blast loads generated by high-explosive detonations. Results from field blast tests were compared with FEM simulations, and the numerical approach was expanded to include more than 460 simulations. The observed errors were consistent with those reported in the literature, but the significantly larger number of simulations allowed for a more comprehensive analysis of the structural dynamic response across various sheet thicknesses and a broad range of standoff distances. To the authors’ knowledge, no previous studies in the open literature have examined thin steel sheets under blast loading with this level of detail and simulation coverage.
  • FEM simulations once again proved to be a reliable method for designing and predicting the structural response to blast loads. This approach is an important tool that reduces the need for field testing, which is expensive, time-consuming, and hazardous, requiring restricted materials and highly specialized personnel.
  • Among the different material models evaluated in this study, the stress–strain curve proved to be the most conservative and was therefore adopted in the FEM simulations. It is important to note that the Johnson–Cook model used parameters for A36 steel obtained from publicly available literature, while the stress–strain curve was based on specific laboratory tests conducted on the actual steel batch used in the experiments. For the blast conditions tested in this study, the strain-rate effect did not significantly influence the results.
  • This paper presents a comprehensive study on the behavior of steel sheets under different standoff distances and thicknesses. Comparative graphs related real blast events to the required safe distances for different protection categories and steel thicknesses. The results highlight the importance of using more robust structural elements, as thicker steel sheets required significantly shorter safe distances, especially for more restrictive protection categories. Another important conclusion is the relevance of implementing barriers around critical buildings to mitigate potential attacks, since the required safe distance for personnel protection can reach several tens of meters—even when using thicker steel sheets.
  • Future work to advance the field should include testing additional cross-sections, spans, boundary conditions, and types of structural steel, using both FEM simulations and blast field tests. This would expand the validation range of the applied methods and provide further insights into the protection of buildings against blast loads. A more in-depth study on the strain-rate effect and the influence and sensitivity of key material parameters of the Johnson–Cook material model applied to blast simulations is also highly recommended.

Author Contributions

Conceptualization, A.S.A., G.U., F.B.M., J.A.F.F.R. and K.I.; methodology, A.S.A., G.U., F.B.M. and J.A.F.F.R.; validation, A.S.A. and G.U., formal analysis, A.S.A.; investigation, A.S.A.; resources, A.S.A. and G.U.; data curation, A.S.A. and G.U.; writing—original draft preparation, A.S.A. and, J.A.F.F.R. writing—review and editing, G.U., F.B.M. and K.I.; visualization, A.S.A., G.U., F.B.M., J.A.F.F.R. and K.I.; supervision, K.I.; project administration, A.S.A. and G.U. All authors have read and agreed to the published version of the manuscript.

Funding

This research received no external funding.

Institutional Review Board Statement

Not applicable.

Informed Consent Statement

Not applicable.

Data Availability Statement

The original contributions presented in the study are included in the paper. Further inquiries can be directed to the corresponding author.

Acknowledgments

We express our sincere appreciation to RJC Defesa Aeroespacial Ltd. for generously supplying the explosive materials at no cost. We are also grateful to the Instituto de Aeronáutica e Espaço (IAE) for granting access to the detonation test site, providing use of its Abaqus® software, and supporting the project with specialized teams in explosives handling, occupational safety, perimeter security, and emergency response. Special acknowledgment is extended to the Divisão de Sistemas de Defesa (ASD) of the IAE for its key role in assigning armament engineers and instrumentation specialists.

Conflicts of Interest

The authors declare no conflicts of interest.

References

  1. Hong, X.; Geng, S.; Feng, R. Study on Dynamic Factors of Damped Beam Members Under Exponential Attenuation Loading. Buildings 2024, 14, 3469. [Google Scholar] [CrossRef]
  2. United Nations. International Ammunition Technical Guidelines—IATG 01.08, 3rd ed.; United Nations: New York, NY, USA, 2021; Available online: https://data.unsaferguard.org/iatg/en/IATG-01.80-Formulae-ammunition-management-IATG-V.3.pdf (accessed on 3 April 2025).
  3. USDOD. Structures to Resist the Effects of Accidental Explosions—UFC 3-340-02; United States Department of Defense (USDOD): Washington, DC, USA, 2008; p. 1943. Available online: https://www.wbdg.org/FFC/DOD/UFC/ARCHIVES/ufc_3_340_02.pdf (accessed on 3 April 2025).
  4. Mendonça, F.B.; Urgessa, G.S.; Almeida, L.E.N.; Rocco, J.A.F.F. Damage diagram of blast test results for determining reinforced concrete slab response for varying scaled distance, concrete strength and reinforcement ratio. An. Acad. Bras. Ciênc. 2021, 93, e20200511. [Google Scholar] [CrossRef] [PubMed]
  5. Ding, L.; Wang, Y.; Lin, J.; Ma, M.; Hu, J.; Qiu, X.; Wu, C.; Feng, C. Recent advances in polyurea elastomers and their applications in blast protection: A review. J. Mater. Sci. 2024, 59, 14893–14923. [Google Scholar] [CrossRef]
  6. Anas, S.M.; Alam, M.; Umair, M. Experimental and numerical investigations on performance of reinforced concrete slabs under explosive-induced air-blast loading: A state-of-the-art review. Structures 2021, 31, 428–461. [Google Scholar] [CrossRef]
  7. Yue, Z.; Zhou, J.; Kong, X.; Xu, Y.; Chen, Y.; Wang, B.; Huang, Y.; Wang, P. Anti-Blast Performance of Polyurea-Coated Concrete Arch Structures. Polymers 2023, 15, 1263. [Google Scholar] [CrossRef]
  8. Mohotti, D.; Fernando, P.; Weerasinghe, D.; Remennikov, A. Evaluation of effectiveness of polymer coatings in reducing blast-induced deformation of steel plates. Def. Technol. 2021, 17, 1895–1904. [Google Scholar] [CrossRef]
  9. Cui, Y.; Song, M.; Qu, Z.; Sun, S.; Zhao, J. Research on Damage Assessment of Concrete-Filled Steel Tubular Column Subjected to Near-Field Blast Loading. Shock Vib. 2020, 2020, 8883711. [Google Scholar] [CrossRef]
  10. He, Y.; Liu, Z.; Li, M.; Li, P.; Zhao, Y.; Liu, Q.; Liu, C.; Ye, P. The Damage to Thick Steel Plates by Local Contact Explosions. Materials 2023, 16, 2966. [Google Scholar] [CrossRef]
  11. Nawar, M.T.; Eisa, A.S.; Elshazli, M.T.; Ibrahim, Y.E.; El-Zohairy, A. Numerical Analysis of Rubberized Steel Fiber Reinforced Concrete Beams Subjected to Static and Blast Loadings. Infrastructures 2024, 9, 52. [Google Scholar] [CrossRef]
  12. Nawar, M.T.; El-Zohairy, A.; Arafa, I.T. Finite Element Modeling and Analysis of Perforated Steel Members under Blast Loading. Modelling 2023, 4, 628–649. [Google Scholar] [CrossRef]
  13. Lim, K.M.; Yoo, D.G.; Lee, B.Y.; Lee, J.H. Prediction of Damage Level of Slab-Column Joints under Blast Load. Appl. Sci. 2020, 10, 5837. [Google Scholar] [CrossRef]
  14. Wang, R.; Zhou, G.; Zuo, X. Test and Numerical Study on Blast Resistance of Main Girders Coated with Polyurea in Self-Anchored Suspension Bridges. Appl. Sci. 2024, 14, 9280. [Google Scholar] [CrossRef]
  15. Ding, Y.; Wang, M.; Li, Z.-X.; Hao, H. Damage evaluation of the steel tubular column subjected to explosion and post-explosion fire condition. Eng. Struct. 2013, 55, 44–55. [Google Scholar] [CrossRef]
  16. Nasry, N.Y.; Aboshok, M.A.; Elsalakawy, T.S.; Hariri, M.O.R.A. Numerical Study for a Reinforced Concrete Structure Under Partially Vented Blast Loads Using LS-DYNA and CONWEP Method. Eng. Res. J. 2025, 54, 111–119. [Google Scholar] [CrossRef]
  17. Vaghefi, M.; Mobaraki, B. Evaluation of the Effect of Explosion on the Concrete Bridge Deck Using LS-DYNA. Int. Rev. Civ. Eng. 2021, 12, 135. [Google Scholar] [CrossRef]
  18. Khan, R.; Farooq, S.H.; Usman, M. Blast Loading Response of Reinforced Concrete Panels Externally Reinforced with Steel Strips. Infrastructures 2019, 4, 54. [Google Scholar] [CrossRef]
  19. Abada, M.; Ibrahim, A.; Jung, S.J. Improving Blast Performance of Reinforced Concrete Panels Using Sacrificial Cladding with Hybrid-Multi Cell Tubes. Modelling 2021, 2, 149–165. [Google Scholar] [CrossRef]
  20. Anas, S.M.; Al-Dala’ien, R.N.; Shariq, M.; Alam, M. Fortifying Slab Resilience against Touch-Off Explosions: Integration of Innovative Stud Reinforcements and Computational Analysis. Buildings 2024, 14, 1468. [Google Scholar] [CrossRef]
  21. Yang, J.; Guo, Y.; Wu, Y.; Zhang, J. Dynamic Response of Fiber–Metal Laminates Sandwich Beams under Uniform Blast Loading. Materials 2024, 17, 4482. [Google Scholar] [CrossRef] [PubMed]
  22. Jamil, A.; Guan, Z.W.; Cantwell, W.J.; Zhang, X.F.; Langdon, G.S.; Wang, Q.Y. Blast response of aluminium/thermoplastic polyurethane sandwich panels–experimental work and numerical analysis. Int. J. Impact Eng. 2019, 127, 31–40. [Google Scholar] [CrossRef]
  23. Mortar, N.A.M.; Abdullah, M.M.A.B.; Hussin, K.; Razak, R.A.; Hamat, S.; Hilmi, A.H.; Shahedan, N.N.; Li, L.Y.; Aziz, I.H.A. Finite Element Analysis on Structural Behaviour of Geopolymer Reinforced Concrete Beam using Johnson-Cook Damage in ABAQU. Arch. Metall. Mater. 2022, 67, 1349–1354. [Google Scholar] [CrossRef]
  24. Al-Rifaie, H.; Studziński, R.; Gajewski, T.; Malendowski, M.; Sumelka, W.; Sielicki, P.W. A New Blast Absorbing Sandwich Panel with Unconnected Corrugated Layers—Numerical Study. Energies 2021, 14, 214. [Google Scholar] [CrossRef]
  25. Zhang, B.; Feng, S. A Numerical Study of Blast Resistance of Carbon Fiber Reinforced Aluminum Alloy Laminates. Appl. Sci. 2023, 13, 4906. [Google Scholar] [CrossRef]
  26. Alias, A.; Amin, A. Blast loaded steel-concrete composite slab. J. Mech. Eng. Sci. 2021, 15, 7874–7884. [Google Scholar] [CrossRef]
  27. Mubarok, M.A.H.; Prabowo, A.R.; Muttaqie, T.; Muhayat, N. Dynamic Structural Assessment of Blast Wall Designs on Military-Based Vehicle Using Explicit Finite Element Approach. Math. Probl. Eng. 2022, 2022, 5883404. [Google Scholar] [CrossRef]
  28. Mendonça, F.B.; Urgessa, G.S.; Augusto, A.S.; Rocco, J.A.F.F. Experimental Records from Blast Tests of Ten Reinforced Concrete Slabs. CivilEng 2020, 1, 51–74. [Google Scholar] [CrossRef]
  29. Kontogeorgos, M.; Fuggini, C. Meta-Material Layout for the Blast Protection of Above-Ground Steel Pipes. Geotechnics 2023, 3, 584–600. [Google Scholar] [CrossRef]
  30. Ali, E.; Althoey, F. Numerical Investigation on Blast Response of Cold-Formed Steel Framing Protected with Functionally Graded Composite Material. Buildings 2022, 12, 118. [Google Scholar] [CrossRef]
  31. Abdallah, M. Numerical study of steel structures responses to external explosions. Int. J. Civ. Environ. Eng. 2020, 14, 117–125. [Google Scholar]
  32. Derseh, S.A.; Mohammed, T.; Urgessa, G. Numerical study on hybrid metallic sandwich structures subjected to air burst. SN Appl. Sci. 2023, 5, 248. [Google Scholar] [CrossRef]
  33. Kohzadialvar, S.; Komasi, M.; Beiranvand, B. Analysis of Blast Effect on Nonlinear Behavior of Steel Flexural Frames Using Abaqus Software. J. Civ. Eng. Mater. Appl. 2022, 6, 13–24. [Google Scholar] [CrossRef]
  34. Abdelrahim, A.; Ali, O.; Mettwaly, I. Inelastic damage of RC slabs subject to blast loads using dynamic analysis: Numerical model validation. Aswan Univ. J. Sci. Technol. 2022, 2, 105–114. [Google Scholar] [CrossRef]
  35. Simulia. Abaqus, Version 6.10; Dassault Systèmes: Vélizy-Villacoublay, France, 2010. [Google Scholar]
  36. Augusto, A.S.; Urgessa, G.; Amorim, C.B.; Lopes Júnior, R.E.; Mendonça, F.B.; Rocco, J.A.F.F.; Iha, K. Experimental Characterization of Cast Explosive Charges Used in Studies of Blast Effects on Structures. CivilEng 2025, 6, 20. [Google Scholar] [CrossRef]
  37. Augusto, A.S.; Urgessa, G.; Rocco, J.A.F.F.; Mendonça, F.B.; Iha, K. Experimental Study on the Use of Polyurethane Elastomers to Enhance Structural Performance of A36 Steel Sheets Under Near-Field Detonation. Appl. Mech. 2025, 6, 28. [Google Scholar] [CrossRef]
  38. Hyde, D.W. Conventional Weapons Effect (CONWEP)—Application of TM5-855-1; Department of the Army: Vicksburg, MS, USA, 1988. [Google Scholar]
  39. Kingery, C.N.; Bulmash, G. Technical Report ARBRL TR-02555—Airblast Parameters from TNT Spherical Air Burst and Hemispherical Surface Burst; Aberdeen Proving Ground, Army Armament and Development Center, Ballistic Research Laboratory: Bethseda, MD, USA, 1984. [Google Scholar]
  40. Phantom. Phantom VEO 640/VEO 440 High-Speed Camera Datasheet; Phantom: Wayne, NJ, USA, 2024; p. 4. Available online: https://www.phantomhighspeed.com/products/cameras/veo/veo640 (accessed on 3 April 2025).
  41. Companhia Siderúrgica Nacional. Aços Planos Laminados a Quente (Hot-Rolled Flat Steel Sheets). Available online: https://www.csn.com.br/homepage/acos-planos/laminados-a-quente/ (accessed on 3 April 2025).
  42. Johnson, G.; Cook, W. A constitutive model and data for metals subjected to large strains, high strain rates and high temperatures. In Proceedings of the 7th International Symposium on Ballistics, Hague, The Netherlands, 19–21 April 1983. [Google Scholar]
  43. Jama, H.H.; Bambach, M.R.; Nurick, G.N.; Grzebieta, R.H.; Zhao, X.-L. Numerical modeling of square tubular steel beams subjected to transverse blast loads. Thin-Walled Struct. 2009, 47, 1523–1534. [Google Scholar] [CrossRef]
  44. Gomah, M.; Demiral, M. An Experimental and Numerical Investigation of an Improved Shearing Process with Different Punch Characteristics. J. Mech. Eng. 2020, 66, 2020. [Google Scholar] [CrossRef]
  45. Lee, S.-W.; Chang, S.-H. Experimental investigation of pull-through force of wing-type fastening inserts co-cured in long fiber prepreg sheet (LFPS). Compos. Struct. 2018, 206, 978–986. [Google Scholar] [CrossRef]
  46. Catálogo de Produtos Laminados (Rolled Products Catalogue). Available online: https://brasil.arcelormittal.com/pdf/produtos-solucoes/catalogos/catalogo-acos-planos.pdf?asCatalogo=pdf (accessed on 1 August 2025).
  47. Simulia. Abaqus Theory Manual, Version 6.10; Dassault Systèmes: Vélizy-Villacoublay, France, 2010. [Google Scholar]
  48. Cormie, D.; Geoff, M. Blast Effects on Buildings, 2nd ed.; Thomas Telford: London, UK, 2009. [Google Scholar]
  49. National Academies; Department of Homeland Security. IED Attack—Improvised Explosive Devices; Department of Homeland Security: Washington, DC, USA. Available online: https://www.dhs.gov/xlibrary/assets/prep_ied_fact_sheet.pdf (accessed on 3 April 2025).
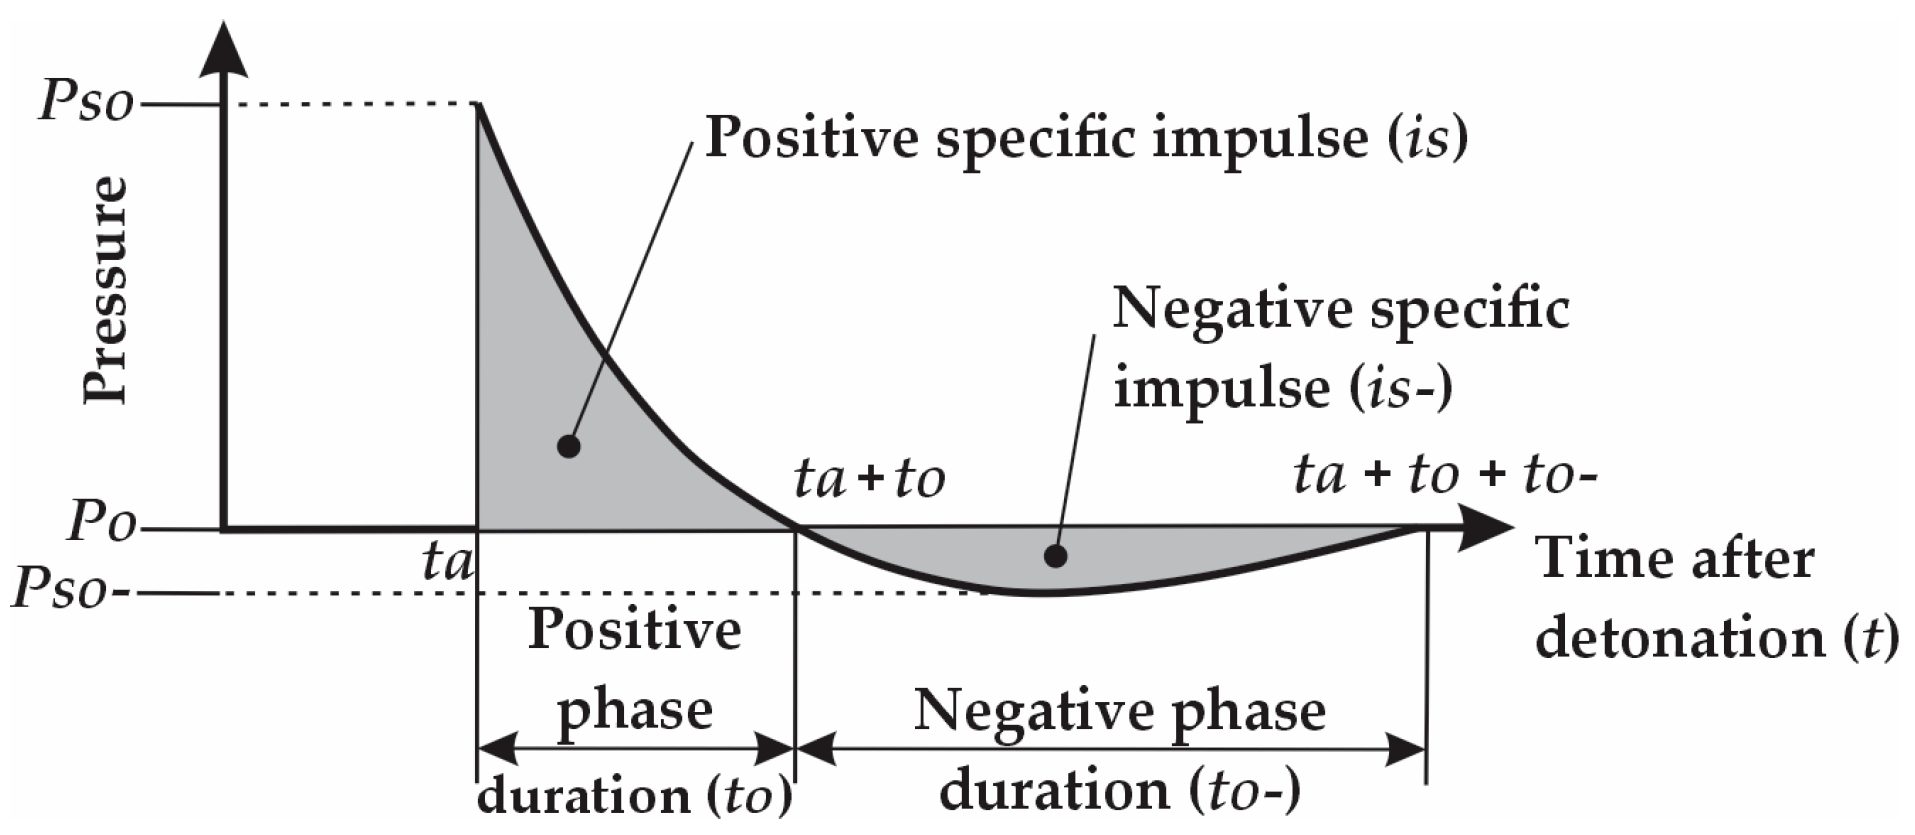
Figure 1. Schematic representation of a typical blast overpressure versus time curve, illustrating the key parameters [3].
Eng 06 00187 g001
Figure 2. Layout of the tests, showing the A36 sheet fixed to the support (a) and the complete apparatus including the explosive charge (b).
Eng 06 00187 g002
Figure 3. Stress–strain curves for the A36 steel batch adopted in the current study.
Eng 06 00187 g003
Figure 4. FEM simulation model as implemented in the software. The Reference Point (RP) represents the location of the detonation center.
Eng 06 00187 g004
Figure 5. (a) Final deformation of an A36 steel sheet, still fixed to the test base, with a standoff distance of 500 mm. (b) Deformation of another steel sheet exposed to the blast at a 300 mm standoff distance. A straight yellow bar was placed over the steel sheets to enhance the visualization of the deformation.
Eng 06 00187 g005
Figure 6. High-speed camera frame captured during a 300 mm standoff blast test, 3 ms after detonation. (a) Wider view showing the steel sheet and the surrounding setup. (b) Close-up view focused on the steel sheet at the moment of maximum displacement.
Eng 06 00187 g006
Figure 7. Lateral view comparison of the maximum displacement between the blast field tests and the FEM simulations at standoff distances of 500 mm (a) and 300 mm (b).
Eng 06 00187 g007
Figure 8. Maximum displacement at the center of the steel sheet for near-field (a) and far-field (b) simulations, as a function of standoff distance. Each point represents a simulation performed using the FEM method, and each curve corresponds to a different sheet thickness.
Eng 06 00187 g008
Figure 9. Structural maximum support rotation as a function of scaled distance for different steel sheet thicknesses. The graphs are divided into near-field (a) and far-field regions (b). Horizontal red lines indicate the rotation thresholds for Category 1 (2°) and Category 2 (12°) protection levels. Individual simulation results were omitted to improve clarity.
Eng 06 00187 g009
Figure 10. Curves defining the minimum safe scaled standoff distance as a function of A36 steel sheet thickness, based on the deformation thresholds for Category 1 (2°) and Category 2 (12°) protection levels. These curves were derived from the intersection between the simulation results and the limits shown in Figure 9.
Eng 06 00187 g010
Figure 11. Maximum Von Mises stress (S) values in SI units for a 2.25 mm thick steel sheet at a 300 mm standoff distance (a), 3.00 mm thick sheet at 600 mm (b), and 4.25 mm thick sheet at 1800 mm (c).
Eng 06 00187 g011
Figure 12. Maximum displacement (u) values in SI units for a 2.25 mm thick steel sheet at a 300 mm standoff distance (a), 3.00 mm thick sheet at 600 mm (b), and 4.25 mm thick sheet at 1800 mm (c).
Eng 06 00187 g012
Figure 13. Maximum Equivalent Plastic Strain (PEEQ) values in SI units for a 2.25 mm thick steel sheet at a 300 mm standoff distance (a), 3.00 mm thick sheet at 600 mm (b), and 4.25 mm thick sheet at 1800 mm (c).
Eng 06 00187 g013
Figure 14. Displacement at the center of the steel sheet over time for each simulated scenario. Negative values in the graph represent downward displacement, while positive values indicate upward displacement.
Eng 06 00187 g014
Figure 15. Comparison of the displacement at three positions along the central line of the steel sheet over time for three different scenarios: 2.25 mm thick sheet at a 300 mm standoff distance (a), 3.00 mm thick sheet at 600 mm (b), and 4.25 mm thick sheet at 1800 mm (c). The three monitored positions correspond to the center of the sheet, one-third of the sheet’s midline, and one-sixth of the sheet’s midline. Negative values in the graphs represent downward displacement, while positive values indicate upward displacement.
Eng 06 00187 g015
Figure 16. Curves defining the minimum actual safe standoff distance as a function of A36 steel sheet thickness, for Protection Category 1 and various explosive devices.
Eng 06 00187 g016
Figure 17. Curves defining the minimum actual safe standoff distance as a function of A36 steel sheet thickness, for Protection Category 2 and various explosive devices.
Eng 06 00187 g017
Table 1. Main characteristics of the ASTM A36 steel used.
ParameterUnitValue
Yield strengthMPa328
Tensile strengthMPa467
Elongation (50 mm gauge)%27
Young’s modulus GPa200
Poisson’s ratio-0.26
Densityg/cm37.85
Table 2. Johnson–Cook parameters adopted for A36 steel, based on data from [44,45].
ParameterUnitValue
AMPa285.9
BMPa499.8
N-0.228
ε ˙ o s−11.0
C (considering strain rate)-0.0171
C (disregarding strain rate)-0
Table 3. Model convergence as a function of mesh size.
Mesh SizeCPU Time 1Number of ElementsMax Displacement
500 mm Standoff
Variation
500 mm
Max Displacement
300 mm Standoff
Variation
300 mm
(mm)(min)-(mm)(%)(mm)(%)
400.412045.43-72.12-
300.425248.997.84%73.201.50%
200.552050.422.92%75.613.29%
100.6206050.991.13%76.791.56%
50.7848051.180.37%77.150.47%
2.51.033,92051.270.18%77.280.17%
18.0212,80051.310.08%77.350.09%
1—Total computational runtime for each individual 5 ms simulation.
Table 4. Model convergence as a function of the number of integration points through the shell thickness.
Number of
Integration Points
CPU Time 1Max Displacement
500 mm Standoff
Variation
500 mm
Max Displacement
300 mm Standoff
Variation
300 mm
-(min)(mm)(%)(mm)(%)
31.051.15-77.23-
51.051.260.22%77.270.05%
71.051.270.02%77.280.01%
91.251.270.00%77.280.00%
1—Total computational runtime for each individual 5 ms simulation.
Table 5. TNT equivalent masses for selected explosive charges and devices.
Explosive ChargeTNT EquivalenceReference 1
Airdropped Mk-82 bomb99 kg[38]
Car bomb226 kg[49]
Airdropped Mk-84 bomb429 kg[38]
Van bomb1815 kg[49]
1—Reference for the TNT equivalence.
Table 6. Comparison between the simulations, using different material models, and the blast tests.
FEM SimulationsField Blast Tests
Strain–Stress Curve ModelJC Model Rate
Dependent
JC Model NOT Rate
Dependent
Test #1Test #2Test #3
Max Displacement (mm) at 500 mm standoff51.2744.1745.4651.2 ± 0.552.5 ± 0.552.0 ± 0.5
Max Displacement (mm) at 300 mm standoff77.2866.7869.1366.0 ± 0.565.6 ± 0.565.9 ± 0.5
Table 7. Comparison of the maximum values at the center of the steel sheet for the three scenarios studied.
ScenarioDisplacement 1θmax 1Velocity 1Acceleration 2
(mm)(°)(mm/ms)(g)
2.25 mm at 300mm69.1117.7889.892.47 × 105
3.00 mm at 600 mm27.687.3235.285.06 × 104
4.25 mm at 1800 mm6.291.677.182.34 × 103
1—Maximum values at the center of the steel sheet. 2—Maximum acceleration at the center of the steel sheet, expressed in g (gravitational acceleration units), with g = 0.00981 mm/ms2.
Disclaimer/Publisher’s Note: The statements, opinions and data contained in all publications are solely those of the individual author(s) and contributor(s) and not of MDPI and/or the editor(s). MDPI and/or the editor(s) disclaim responsibility for any injury to people or property resulting from any ideas, methods, instructions or products referred to in the content.