Article

A Standard Test Apparatus and Method for Validating the Accuracy of Mobile Phone Apps in Measuring Concrete Crack Widths

by
Chyuan-Hwan Jeng
1,*,
Min Chao
2 and
Jian-Hung Chen
3
1
Department of Civil Engineering, National Chi Nan University, Nantou 545301, Taiwan
2
Department of Civil Engineering and Geomatics, Cheng Shiu University, Kaohsiung 833301, Taiwan
3
Department of Information Management, National Chi Nan University, Nantou 545301, Taiwan
*
Author to whom correspondence should be addressed.
Eng 2025, 6(6), 122; https://doi.org/10.3390/eng6060122
Submission received: 30 April 2025 / Revised: 24 May 2025 / Accepted: 25 May 2025 / Published: 2 June 2025
(This article belongs to the Special Issue Interdisciplinary Insights in Engineering Research)

Abstract

:
This paper presents a standardized apparatus and method for testing the accuracy of mobile phone apps designed to measure concrete crack widths. The apparatus comprises a standardized crack-width calibration plate (CWCP) and a simulated wall (SW), along with a pose adjusting and fixing device (PAFD) and a spatial distance measuring assemblage (SDMA). The test method employs an innovative two-stage procedure associated with the SDMA to calculate the distances (Ki) from the phone’s four corners to the SW. The phone’s position is adjusted using the PAFD until the four monitored Ki values match the target Ki. An app installed on the phone then measures crack widths on the CWCP. A standard experimental procedure was established to assess the accuracy of a preliminary Android app in measuring concrete crack widths, with results presented and discussed. This apparatus and method, grounded in their underlying physical meaning, can realistically simulate actual engineering conditions precisely and cost-effectively.

1. Introduction

Traditional methods for measuring concrete crack widths require a trained worker to press a measuring gadget against the concrete surface and visually read the scale with the naked eye. Over the past decade, the capability-to-price ratio of mobile phones has continually increased. Smartphones with digital cameras have become ubiquitous, featuring significant improvements in both mobile computing capabilities and camera performance. Consequently, a smartphone app now has the potential to transform a phone into a convenient tool for measuring concrete cracks, offering an alternative to the relatively cumbersome traditional methods.
While the functionalities of mobile app software and hardware have greatly improved, many general-purpose apps for queries, entertainment, and other uses only offer visual precision adequate for the human eye. In contrast, a crack-measuring app must provide sufficient accuracy and precision for engineering applications. Therefore, verifying and confirming the accuracy of crack measurements made using a mobile phone app is key. To address this issue, an innovative standard apparatus and method have been developed to test the accuracy of a mobile phone app in measuring concrete crack widths [1].
This standard apparatus includes a standardized crack-width calibration plate (CWCP) and a simulated wall (SW), a device used to adjust and fix the phone’s position, as well as a spatial distance measuring assemblage (SDMA). Using the SDMA, a specialized two-stage method is followed to simultaneously calculate and display the spatial position of the mobile phone relative to the SW. With this continuous feedback, the phone’s spatial position can be adjusted (translated and/or rotated) using the adjusting device. During a standard test, the phone’s position is adjusted until it reaches the desired position, after which an app installed on the phone is used to measure the widths of the simulated cracks on the CWCP embedded in the SW.
This paper describes the configuration and components of the standard apparatus and presents the methodology and experimental procedure of the standard test method. The experimental procedure was applied to conduct standard tests on a preliminary app, and the experimental results of these standard crack-width measurement tests are presented.

1.1. Literature Review

When using a mobile phone app to measure concrete cracks, the app first captures a color digital image of the crack surface using the phone’s camera and then applies a digital image analysis process to extract a monochrome (black-and-white) crack image from the original color image. The app then determines the required crack-width values based on this monochrome image.

1.1.1. Applications of Digital Image Processing Techniques

To extract characteristic and representative monochrome crack images for detecting and/or measuring concrete surface cracks, numerous studies in the literature have employed digital image processing [2] techniques. For example, over the past two decades, Abdel-Qader et al. (2003) [3] compared the effectiveness of four edge-detection algorithms (Fast Haar Transfom, Fast Fourier Transform, Sobel, and Canny) for identifying cracks in concrete bridge deck images. Hutchinson and Chen (2006) [4] proposed an automated statistical procedure to find optimal parameter sets for the two more reliable algorithms (Canny and Fast Haar Transfom) found in Abdel-Qader et al.’s work [3]. Yamaguchi and Hashimoto (2009, 2010) [5,6] introduced a percolation-based image processing method for crack detection and proposed using a crack scale attached to the concrete surface during image acquisition, enabling crack-width measurement with sub-pixel accuracy. Zhu et al. (2011) [7] adopted and slightly modified Yamaguchi and Hashimoto’s percolation-based crack detection method. In addition, they applied an image-thinning algorithm to extract cracks’ (center) skeletons and used a Euclidean distance transform to calculate a distance field containing each crack pixel’s nearest distance to its boundaries, thus allowing for the retrieval of cracks’ properties including crack length, orientation, maximum width, and average width.
The digital image correlation (DIC) method has also been commonly applied to measure concrete cracks. For example, Choi and Shah (1997), Destrebecq et al. (2010), Dutton (2012), Zhao et al. (2018), Bertelsen et al. (2019), and Mehmandari et al. (2024, 2025) [8,9,10,11,12,13,14] employed DIC for this purpose. Lawler et al. (2001) [15] combined two-dimensional DIC with three-dimensional X-ray microtomography to measure the deformation and crack development in concrete cubes under uniaxial compression.
In more recent advancements, Nguyen et al. (2014) [16] utilized the symmetric and line-like characteristics of concrete cracks to remove non-crack noise. They extracted crack skeletons from the filtered images using thresholding and morphological thinning and refined the skeleton connections with cubic splines. The crack edges were determined from crack pixels perpendicular to the spline curves. Yang et al. (2015) [17] captured crack images with two cameras (a stereo vision approach) and analyzed minute relative displacements on either side of the cracks, achieving a measurement accuracy of 0.2 pixels. This approach contributed to the advancement of related studies and damage assessment applications [18,19]. Rivera et al. (2015) [20] employed the Prewitt edge-detection algorithm and morphological operations in MATLAB to detect cracks and surface defects. They segmented cracks from surface defects based on two criteria: orientation angle and major-to-minor axes length ratio, and calculated crack widths using MATLAB’s built-in regionprops function.
Recent years have also seen a surge in studies employing machine learning and deep learning methods for crack detection (e.g., [21,22,23,24,25,26,27,28,29,30,31,32]). In an earlier study, Cha et al. (2017) [21] used a dataset of 40,000 small images (256 × 256 pixels each) to train a convolutional neural network (CNN) for crack identification with 98% accuracy. The trained CNN was tested on 55 large images (5888 × 3584 pixels) of other structures using a scanning window, demonstrating a better crack-detection performance compared to the Canny and Sobel edge-detection algorithms. To address the time-consuming process of scanning-window approaches and localize crack regions for subsequent crack segmentation, later studies employed region-based (bounding-box) methods such as a region proposal network in Faster R-CNN [25,26], the crack candidate region method [27,28], and the YOLO-based methods [29,30]. Mask R-CNN further extended Faster R-CNN by adding a branch for predicting segmentation masks [30,31].
However, these machine learning and deep learning methods primarily addressed crack detection and segmentation. The quantification of crack length, orientation, and width still relied on earlier digital image processing methods, such as image thinning and distance transform procedures [26]. In a study focused on automatic crack-width measurement, Carrasco et al. (2021) [32] applied k-means clustering to determine the center points of crack skeletons and classify the pixels across a crack-width profile into two groups: crack or background.

1.1.2. Studies Related to the Application of Mobile Phone Apps

Research on the application of mobile phone apps for concrete crack detection or measurement remains relatively limited in the literature (e.g., [33,34,35,36,37,38]). Chen et al. (2015) [33] developed an Android app capable of capturing crack images and determining the maximum crack width from the captured images. When measuring a crack surface with this app, a shim block was placed between the phone and the surface to maintain the phone parallel to and at a fixed distance of 10 cm from the crack surface, as the calibration coefficient used for the phone was based on this distance.
Kong et al. (2017) [34] proposed a system for detecting the type and size of road cracks. The system’s data capture module enabled smartphones to take crack photos and record readings from the phone’s accelerometer, magnetometer, and GPS. The crack size estimation module then used the captured photos and sensor readings to estimate crack length and width. This system detected road cracks with widths ranging from 6 cm to 25 cm, which was unsuitable for detecting finer cracks in concrete structures or components.
By conducting experiments on seven smartphone models from four different brands, Ni et al. (2020, 2021) [35,36] found that, for a fixed distance between the phone’s camera and the target, the size of a single pixel (η′) in the captured images decreased exponentially as the zoom ratio increased from 1 to 10. They quantified these exponential functions for η′ at a shooting distance of 1 m. Overall, their results showed that η′ decreased from approximately 0.37 mm to 0.03 mm as the zoom ratio increased.
Gepiga et al. (2022) [37] proposed an automated crack detection and measurement system using smartphones to capture crack images. The phone app also recorded the object-to-camera distance using Google’s ARCore library, and the phone’s alignment was guided with gyroscope measurements to approximate a 90° angle to the surface. The captured images, along with the recorded distances, were processed on a laptop using Musk R-CNN for image segmentation and Carrasco et al.’s method [32] for crack quantification.
Wang et al. (2024) [38] developed a specialized handheld image acquisition device for collecting crack video images, which were wirelessly transmitted to a smartphone. An app on the phone performed crack detection and crack-width measurement based on the transmitted video images.
Of the abovementioned studies, the measured crack-width values ranged from approximately 0.3 mm to 1.0 mm [33], 0.6 mm to 1.2 mm [35,36], 0.2 mm to 2.2 mm [37], and 0.17 mm to 2.9 mm [38]. The smallest value (0.17 mm) was still insufficient to replace traditional crack-width gauges in engineering practice. Traditional gauges, such as crack measuring magnifiers and crack-width comparator cards, can measure crack widths as thin as 0.05 mm or at least 0.1 mm to meet practical engineering and structural concrete requirements.
Verifying the accuracy and precision of crack-width measurement is another issue. In the studies mentioned above, the crack-width values obtained using the phone apps [33,35,36,38] or laptop processing [37] were compared with manual measurements performed with a measuring magnifier [33] or an electronic instrument [35,36]. However, these comparisons were based on limited sample sizes.
Various electronic crack-width measuring instruments are commercially available and generally fall into two main categories. The first category includes advanced versions of traditional crack measuring magnifiers or microscopes, where optical lenses are replaced with high-definition digital cameras. The second category (e.g., [39]) utilized digital image processing techniques to generate crack-width measurements. However, the specifications provided by manufacturers should only reflect the instruments’ electronic or mechanical performance indices, not statistically significant accuracy indices. This is because no standardized test procedures exist in the literature. The standard test apparatus and method presented in this paper aim to address this issue and could help develop a phone app capable of measuring crack widths as thin as 0.05 mm or 0.1 mm.

1.2. Research Significance

Smartphone apps have the potential to improve concrete crack measurement by providing a more convenient alternative to traditional methods. However, ensuring their accuracy for engineering applications is essential. This study presents an innovative standardized apparatus and method for testing the accuracy of mobile phone apps in measuring concrete crack widths. By enabling precise, repeatable accuracy assessments, this approach facilitates the development of apps capable of achieving engineering-grade precision, with the potential to measure crack widths as thin as 0.05 mm or 0.1 mm. Thus, this study contributes to the advancement of reliable, practical, and widely applicable mobile crack measurement solutions.

2. Apparatus for Testing Concrete Crack Measurement Using a Mobile Phone App

The constituent parts of the standard test apparatus and their configuration are described in this section.

2.1. Crack Width Calibration Plate (CWCP) and Simulated Wall (SW)

The standard tests required a standardized and repeatable target for crack-width measurements. Therefore, a standard crack-width calibration plate (CWCP) was designed based on commonly used crack-width comparator cards. As depicted in the design drawing in Figure 1a, the CWCP has lateral dimensions of 130 mm by 130 mm, with a thickness of 10 mm, and includes 21 simulated cracks with widths ranging from 0.05 mm to 2.00 mm, each extending to a length of 100 mm. Based on the design specifications, the metal CWCP was fabricated by a professional manufacturer, using laser engraving for 19 of the simulated cracks with widths from 2.0 mm to 0.10 mm, and a milling cutter for the two finest cracks, with widths of 0.08 mm and 0.05 mm. Each simulated crack has an engraving depth of 1 mm. Photographs of the finished CWCP are shown in Figure 1b. Seven vertical black stripes were added to the CWCP to mark 14 potential width-measurement points along each of the 21 simulated cracks.
Standard tests also require a wall to retain the CWCP, for which purpose a wooden simulated wall (SW) was created. As shown in the photographs in Figure 2, the CWCP can be embedded in a square opening at the center of the SW for crack-width measurement tests (Figure 2a,c), with the vertical tilt of the SW being adjustable (Figure 2b). The SW also features a slot opening adjacent to the square opening to accommodate a lux meter, allowing the illuminance at the surface of the CWCP to be measured prior to conducting a crack-width measurement test (Figure 2c). In addition to being sufficient to simulate actual concrete surfaces (see Section 2.7), the wooden SW is also cost-effective, lightweight, and portable. These features contribute to the overall portability and ease of installation of the entire test apparatus.

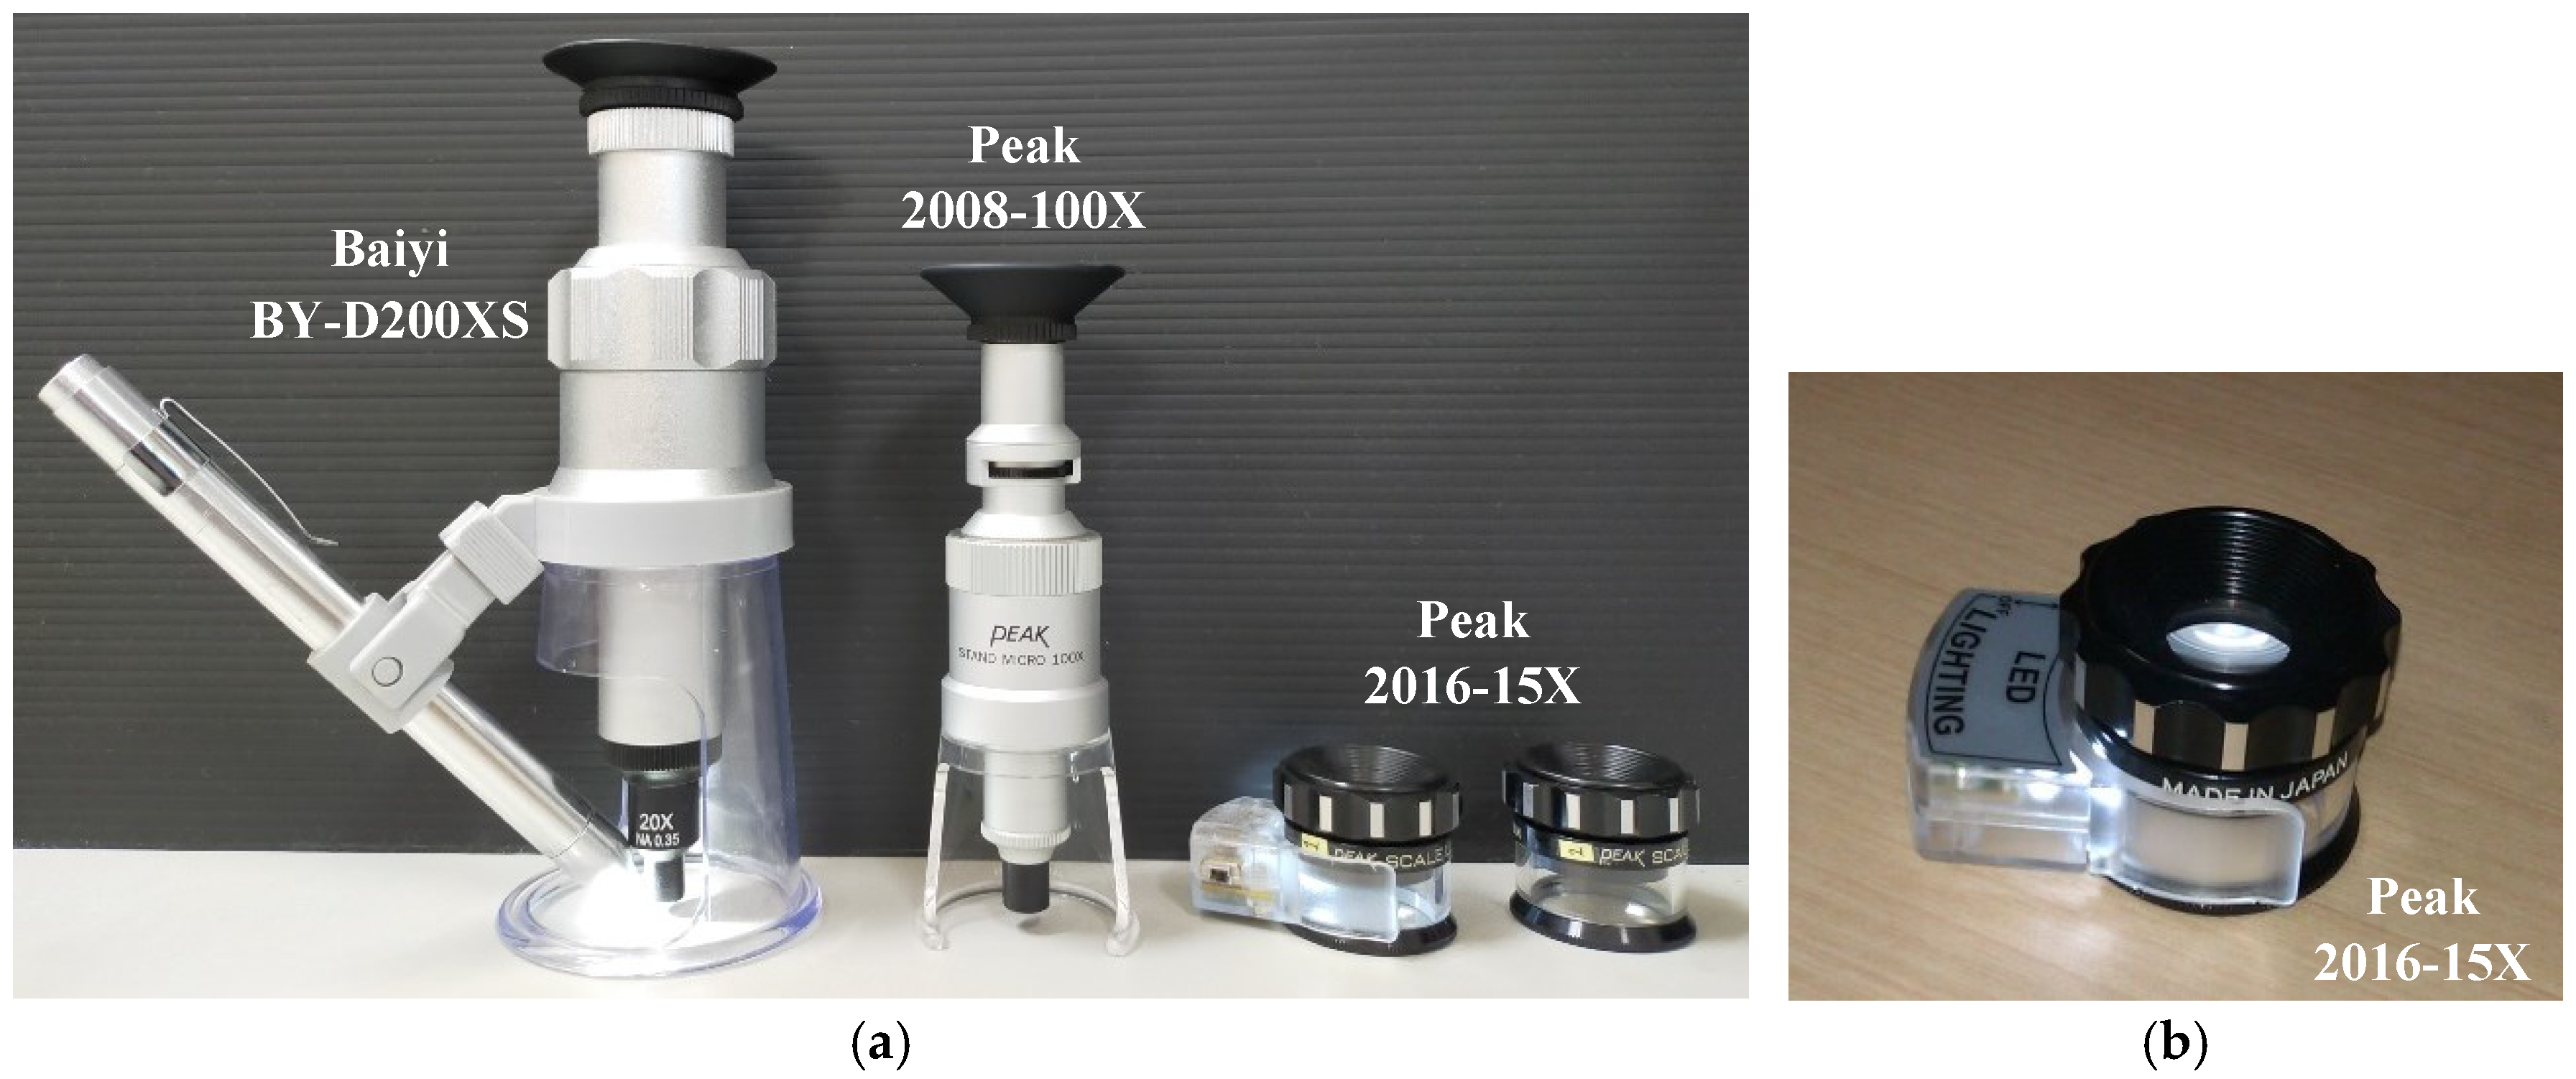
2.2. Determining the “True” Crack-Width Values for the CWCP

The crack-width measurements obtained from the mobile phone app during standard tests must be compared with the corresponding “true” crack-width values to determine the app’s measurement error. For this purpose, three types of precision crack-width measuring magnifiers, as shown in Figure 3 and detailed in Table 1, were used to manually measure the crack widths at the designated positions on each simulated crack of the CWCP. The measurements were conducted by at least three individuals, with each person performing at least two rounds of measurements. For each designated position on the simulated cracks (which were also the positions used by the app for crack-width measurements), at least 30 manual measurements were taken using five crack-width magnifiers (one Baiyi BY-D200XS, two Peak 2016-15X, and two Peak 2008-100X). The two finest cracks with designed widths of 0.05 mm and 0.08 mm were measured only using the two high-precision crack-width magnifiers. Each set of 30 measurements was examined and compared, with outliers removed and measurements redone if necessary. The final true crack-width value was obtained by averaging the valid measurement values at each designated width-measurement position of the cracks. These true values were compared with the app’s measurements to determine the measurement error.

2.3. Pose Adjusting and Fixing Device (PAFD)

During a standard test, the spatial position of the mobile phone used for testing should undergo a series of coarse and fine adjustments until reaching the desired position and then remain unchanged. As shown in Figure 4, a tripod and tripod-head paired with an additional accessory were used as the pose adjusting and fixing device (PAFD) for the phone used for testing. An accessory attached on top of the tripod head (Figure 4b) allows for perpendicular bidirectional translational adjustments.

2.4. Stainless-Steel Holder and Spatial Distance Measuring Assemblage (SDMA)

The spatial position of the phone must be discerned before it can be adjusted using the PAFD. A specialized Spatial Distance Measuring Assemblage (SDMA), consisting of a stainless-steel holder, four laser displacement sensors (LDSs), and the mobile phone used for testing, was developed to measure the phone’s spatial position relative to the simulated wall (SW). As illustrated in Figure 5, within the SDMA, the custom-designed stainless-steel holder grips the mobile phone at its upper center and secures the four high-precision LDSs near its corners.

2.5. Overall Test Setup

Figure 6 presents photographs of the complete setup of the standard apparatus for crack-width measurement tests. In the overall setup, the SDMA is mounted on top of the PAFD (Figure 5b and Figure 6), with the phone and the four LDSs aimed at the SW and the embedded CWCP. The measurement signals from the four LDSs are fed to a data logger, which is connected to a computer for real-time calculation and display of results.
During a standard crack-width measurement test, the four LDSs continuously measure the spatial distances from the four laser-emitting points to their terminal points on the SW. These LDS measurements are used simultaneously to calculate and display the phone’s spatial position relative to the SW. With this continuous feedback, the SDMA can be adjusted (translated and/or rotated) via the PAFD to adjust the phone’s relative spatial position during testing.

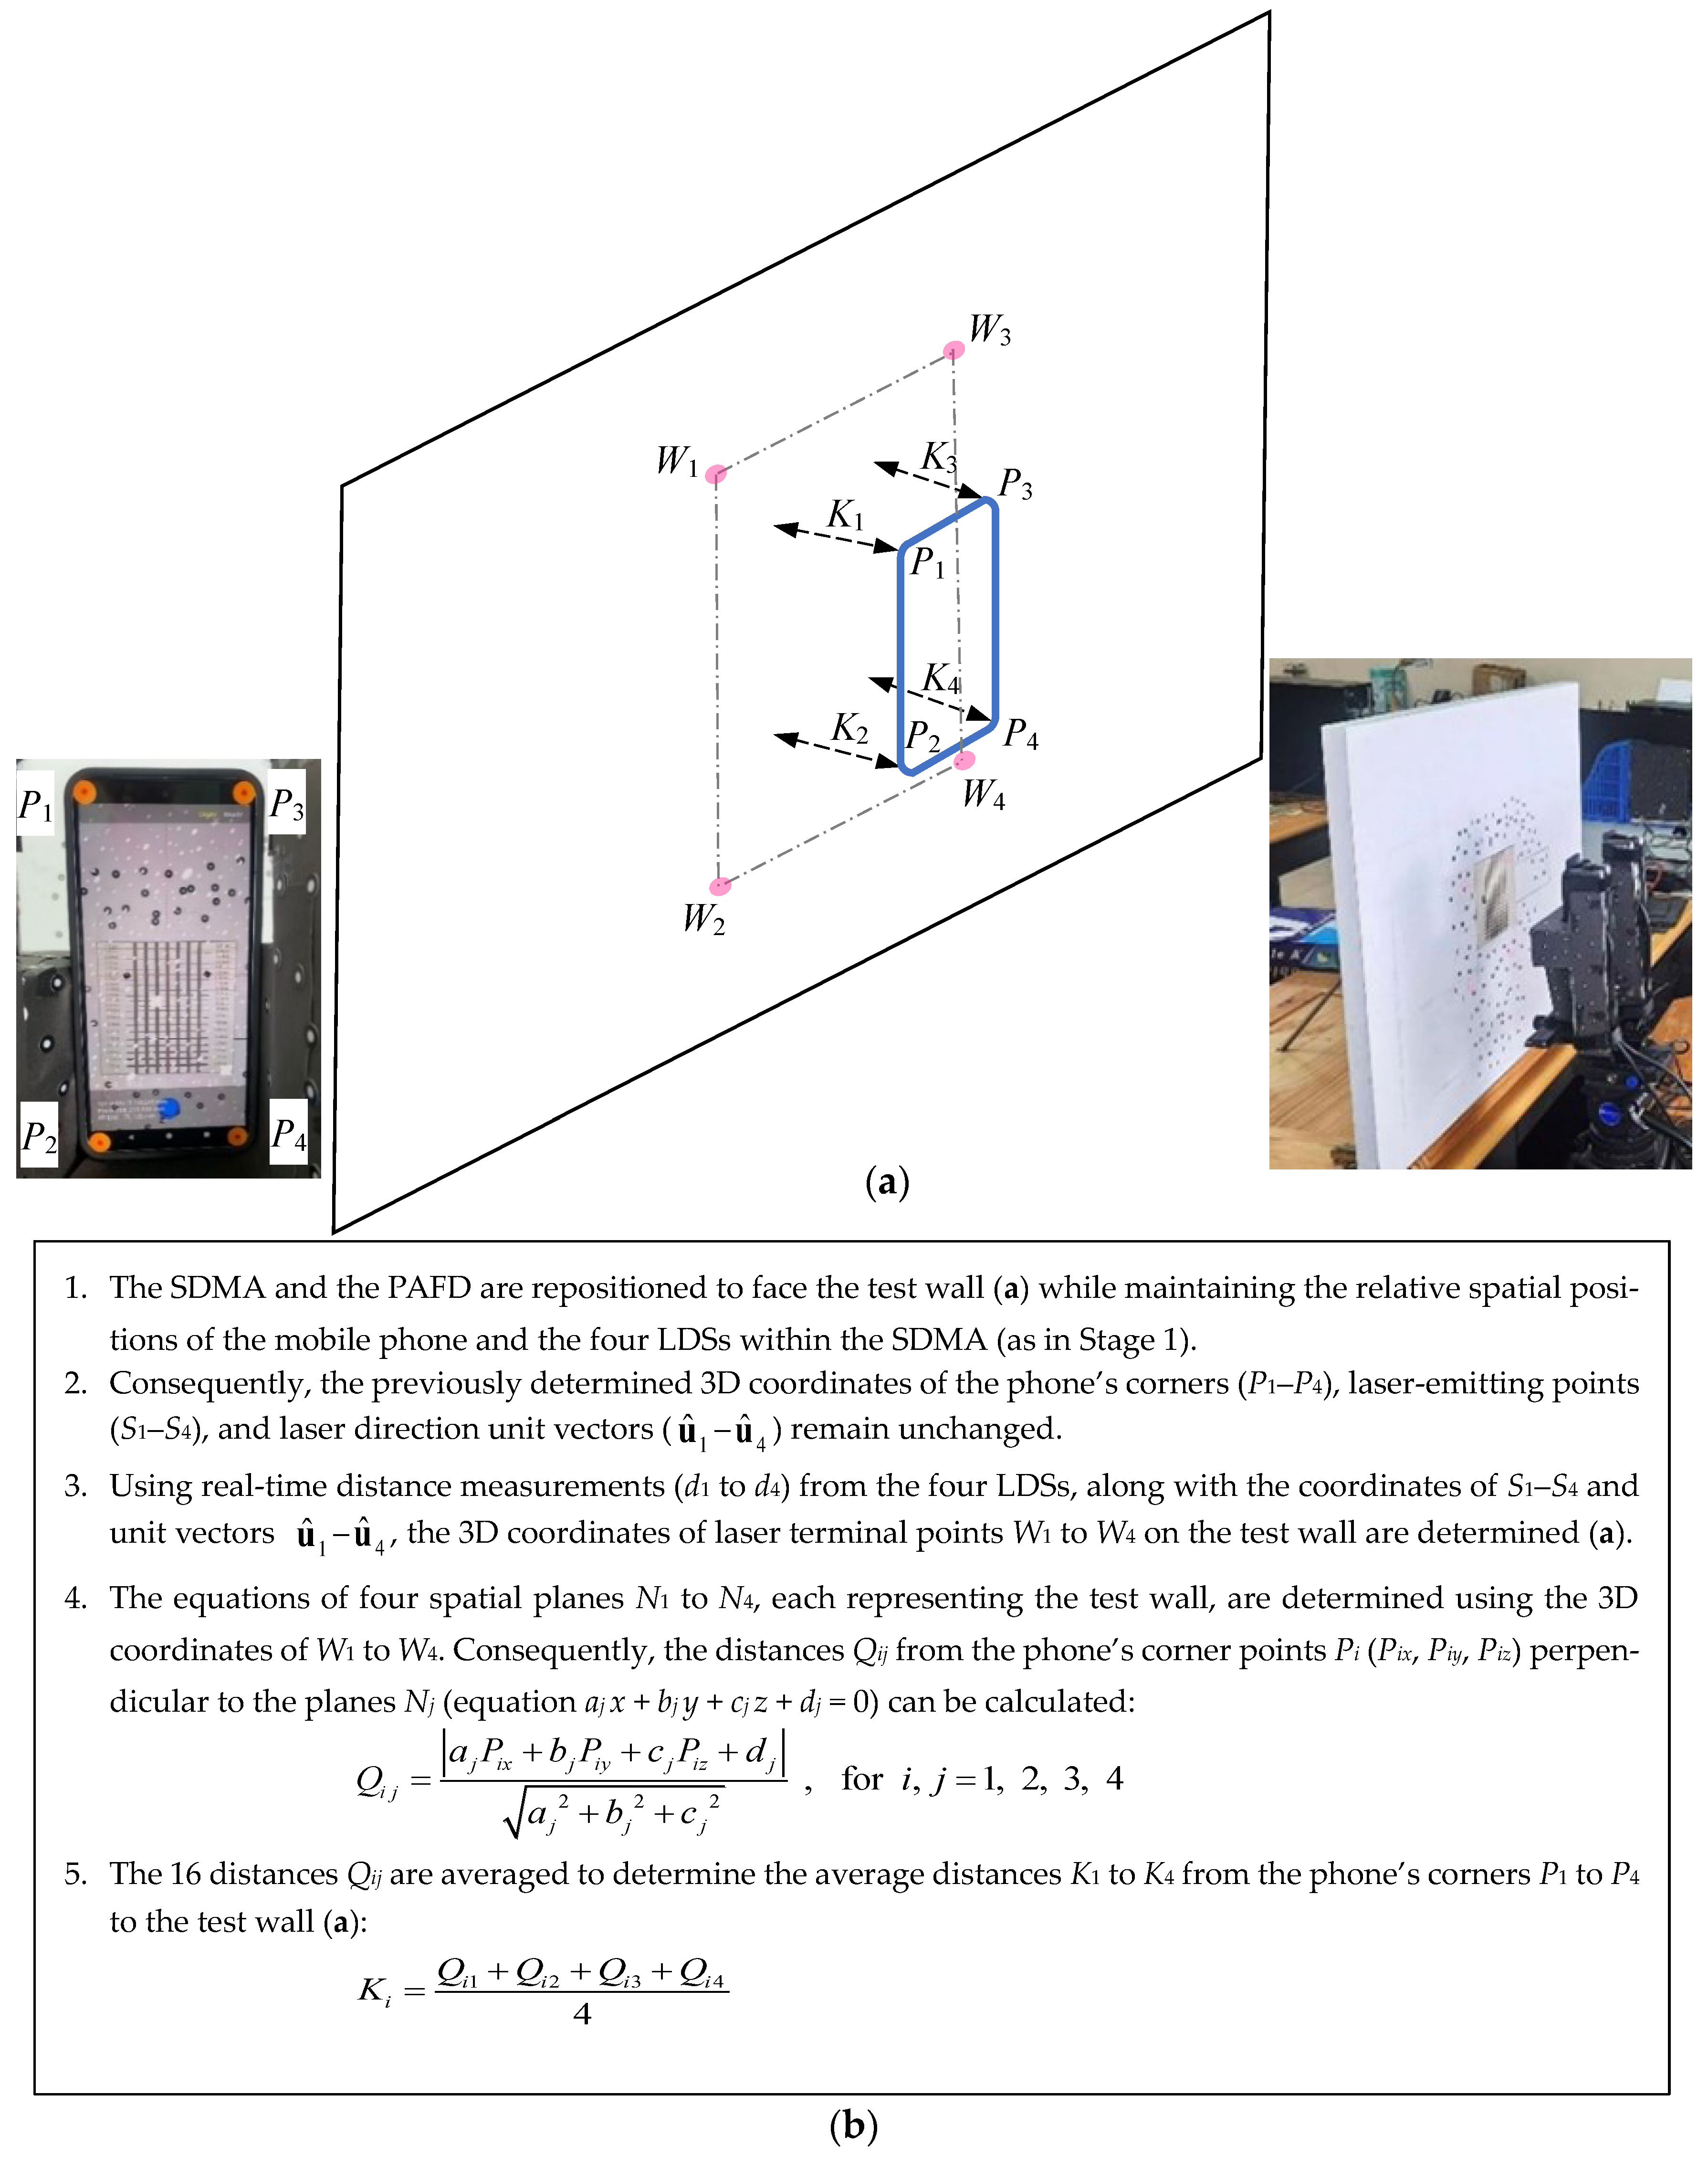
2.6. Two-Stage Method for Determining Phone Position

A specialized two-stage method is proposed to simultaneously calculate and display the spatial position of the mobile phone relative to the test wall, as illustrated in Figure 7 and Figure 8.
Figure 7 illustrates Stage 1 of the method. Before a crack-width measurement test is conducted, 3D scanning is utilized to determine the spatial relationship between the mobile phone and the four LDSs in the SDMA. The outcome of this stage is the determination of the 3D coordinates of eight spatial points, P1P4 and S1S4, and four 3D unit vectors, u ^ 1 u ^ 4 . The four points P1P4, representing the corners of the mobile phone, determine the spatial position of the phone. The four points S1S4, representing the laser-emitting points of the four LDSs, along with the four unit vectors u ^ 1 u ^ 4 , pointing from the laser-emitting points (S1S4) toward their terminal points, determine the spatial positions and directions of the four LDSs’ laser beams. To enhance the accuracy of 3D scanning, the stainless-steel holder is wrapped to create relatively regular exterior surfaces (Figure 7a–d).
The subsequent crack-width measurement test is conducted during Stage 2, as illustrated in Figure 8. The SDMA and the PAFD are repositioned to face the test wall, and the real-time distance measurements d1d4 obtained from the four LDSs, along with the previously determined 3D coordinates of P1P4 and S1S4 and the four unit vectors u ^ 1 u ^ 4 , are used to synchronously calculate and display the four average distances Ki from the phone’s corner points Pi (i = 1–4) to the test wall (Figure 8b). These Ki values can then be used to move (translate and/or rotate) the SDMA using the PAFD, thereby adjusting the phone’s relative spatial position during the test.

2.7. Physical Meaning of the Test Method

The spatial geometric relationships among the phone’s corner points P1P4, the laser terminal points W1W4 on the test wall, and the average distances K1K4 from P1P4 to the test wall are illustrated in Figure 8a. In fact, K i = 1 / 4 Q i 1 + Q i 2 + Q i 3 + Q i 4 (Figure 8b) is mathematically equivalent to the distance from the phone’s corner point Pi to an “average spatial plane”, a plane that is interpolated from W1W4.
A typical concrete crack surface is rarely a perfect mathematical plane, given that it aligns only to the precision of surface finishing or similar construction standards (this also justifies the use of the wooden SW). When using a phone app to measure a concrete crack surface, the user is essentially engaging with a “perceived crack plane”. Therefore, the distance Ki from point Pi to the average spatial plane essentially simulates the distance from Pi to this user-perceived crack plane. In other words, this test method, in essence, simulates the user-perceived crack plane by using the average spatial plane interpolated from the four laser terminal points W1W4 on the wall. This innovative approach, which mimics actual engineering conditions, should be highly reasonable and appropriate.

3. Standard Method for Testing Concrete Crack Measurement Using a Mobile Phone App

3.1. Precise Distance Measurement Using LDSs

As mentioned above, in Stage 2, the real-time measured distances d1d4 from the four LDSs are used to synchronously calculate and display the four Ki values. To enable real-time calculation and display of the Ki values, the four LDSs must measure d1d4, which are the absolute distances from the laser-emitting points to their terminal points on the test wall (Figure 8).
However, these LDSs are not rangefinders. Typically, high-precision LDSs, such as those used in experiments and connected to data loggers, function as displacement transducers. Standard practice with displacement sensors or transducers involves setting up the sensors in a fixed location and measuring only the relative displacement values with respect to an initial reference position. Thus, while the four LDSs have a specified effective measurement range, they lack a precise fixed reference point. This poses a challenge, as the LDSs need to accurately provide the absolute distances d1d4 while mounted on the nonstationary stainless-steel holder.
To address this challenge, we developed an innovative methodology. By conducting validation experiments involving multiple comparisons with 3D scanning and 3D point-cloud measurements, this methodology successfully achieves high-precision, real-time measurements of the four absolute spatial distances di using standard LDSs. Detailed descriptions of the development process and results of this methodology can be found in Ref. [1].

3.2. Validation Experiments

To verify the accuracy of the LDSs’ measurement values (di) and their use in calculating the Ki values (Figure 8b), validation experiments were conducted within the framework of the proposed methodology described above [1]. These experiments also included the previously described two-stage procedure (Figure 7 and Figure 8). In Stage 1 of these validation experiments, the setup and method were the same as those illustrated in Figure 7. As shown in Figure 9, the Stage 2 procedure of these validation experiments was similar to that of the crack-width measurements shown in Figure 6, with the sole difference being that the test wall in Figure 9a–c was not the wooden SW. This modification was made to facilitate subsequent 3D scanning and enhance the accuracy of distance measurements derived from the 3D point cloud. A 3D scanner was used to scan the setup and wall (Figure 9a–c), generating the 3D point cloud illustrated in Figure 9d,e. From this 3D point cloud, the spatial distances d1d4 and K1K4 were measured [40] and compared with the di and Ki values obtained from the LDS/data logger measurements.
The validation experiment was repeated numerous times. The results showed that for the LDS measurement values of d1d4 and the real-time calculated distance values of K1K4, most of their differences relative to the 3D scanning/point-cloud measurement values could be controlled within ranges of ±1.0 mm and ±0.8 mm, respectively [1]. These ranges (±1.0 mm and ±0.8 mm) for the measurement differences ( Δ d i and Δ K i ) were adopted as permissible criteria in the standard experimental procedure presented in the following section.

3.3. Standard Experimental Procedure

Based on the aforementioned investigation results, a standard experimental procedure was established to conduct tests assessing the accuracy of a mobile phone app in measuring concrete crack widths. Figure 10 illustrates and summarizes the 15 steps ((a) through (o)) of this procedure. The standard crack-width measurement test begins by determining the target Ki in Step (a). Steps (b) through (l) comprise a validation experiment within the standard test. The final steps, (n) and (o), correspond to the Stage 2 procedure of the standard test, where a mobile phone app is used to measure crack widths on the CWCP embedded in the wooden SW (Figure 6).
As previously described, the validation experiment (Steps (b) through (l)) also includes the two-stage procedure, with Stage 2 conducted using the setup shown in Figure 9a–c, excluding the wooden SW. In Step (m), the results of this validation experiment—comprising the 3D scanning measurements of distances d1d4 and K1K4, as well as the corresponding values di and Ki obtained from the LDS/data logger—are compared. The differences, Δ d i and Δ K i , are then checked against the allowable limits (±1.0 mm and ±0.8 mm, respectively). If these differences fall within the permissible range, the final two steps ((n) and (o)) are performed. If not, the entire validation experiment (Steps (b) through (l)) must be repeated before proceeding.

3.4. Examples of Experimental Results

The standard experimental procedure (Figure 10) was applied to conduct standard crack-width measurement tests on a preliminary Android app developed in research projects led by the authors [41,42]. This app employs Google’s ARCore-AR [43] routines to detect a physical distance on the measurement surface and determine the physical size per unit pixel for the captured images. Thus, the app can measure crack widths independently, without any auxiliary apparatus. Part of the app’s usage is demonstrated in two videos on YouTube [44,45]. A brief introduction to the app is given in Appendix A.

3.4.1. Procedure for Crack-Width Measurements in a Standard Test

In the final Stage 2 (Steps (n) and (o) in Figure 10) of these standard tests, the app, installed on a Pixel 8 Pro mobile phone within the SDMA, was used to measure crack widths on the CWCP embedded in the SW (Figure 6). Figure 11 presents the detailed operating procedure of steps (n) and (o) in these standard tests, while Figure 12 provides photographs of this Stage 2 procedure.
Figure 11 delineates nine specific steps (<1> to <9>) for performing crack-width measurements using the mobile phone app after the validation experiment has been successfully completed (Step (m) in Figure 10). The first two steps (Steps <1> and <2>) involve repositioning the SDMA–PAFD assembly to face the wooden SW (Figure 12a) and then checking and adjusting the lighting conditions (Figure 12b) [46]. Steps <3> through <8> include pre-aligning the mobile phone (<3>), performing AR detection (<4>), re-aligning the mobile phone (<5>), capturing a crack image (<6>), and measuring crack widths in the image (<7> and <8>). The final step (<9>) is to repeat steps <3> to <8> if necessary, to capture another crack image and measure its crack widths.
It should be noted that AR (augmented reality) detection in Step <4> is required for the preliminary app to detect physical distances using ARCore [43] routines. For an app that does not use AR detection, Step (<4>) can be excluded, and Steps <3> and <5> are consolidated into a single step.
For capturing a crack image (Steps <3>, <5>, and <6> for the preliminary app), the CWCP cracks are divided into four groups, as depicted in Figure 13. During Steps <3> and <5> (Figure 11), the vertical center line (red) in the phone app’s preview screen is aligned with the CWCP’s L4 edge (Figure 13), and the horizontal center line (red) is aligned with the center of a desired crack. This horizontal alignment corresponds to the center crack in each group shown in Figure 13. In other words, for each of the four groups on the CWCP, the phone is aligned accordingly (Steps <3> and <5>), and a crack image is captured (Step <5>). Consequently, a total of four crack images, one for each group (Figure 13), are captured during a complete standard test.
For each crack in a captured image, the app measures its widths at three positions (L2, L4, and L6 edges in Figure 13). Each captured image thus contains 15 or 18 crack-width values, depending on whether the group has 5 cracks (Groups 1–3) or 6 cracks (Group 4) on the CWCP.

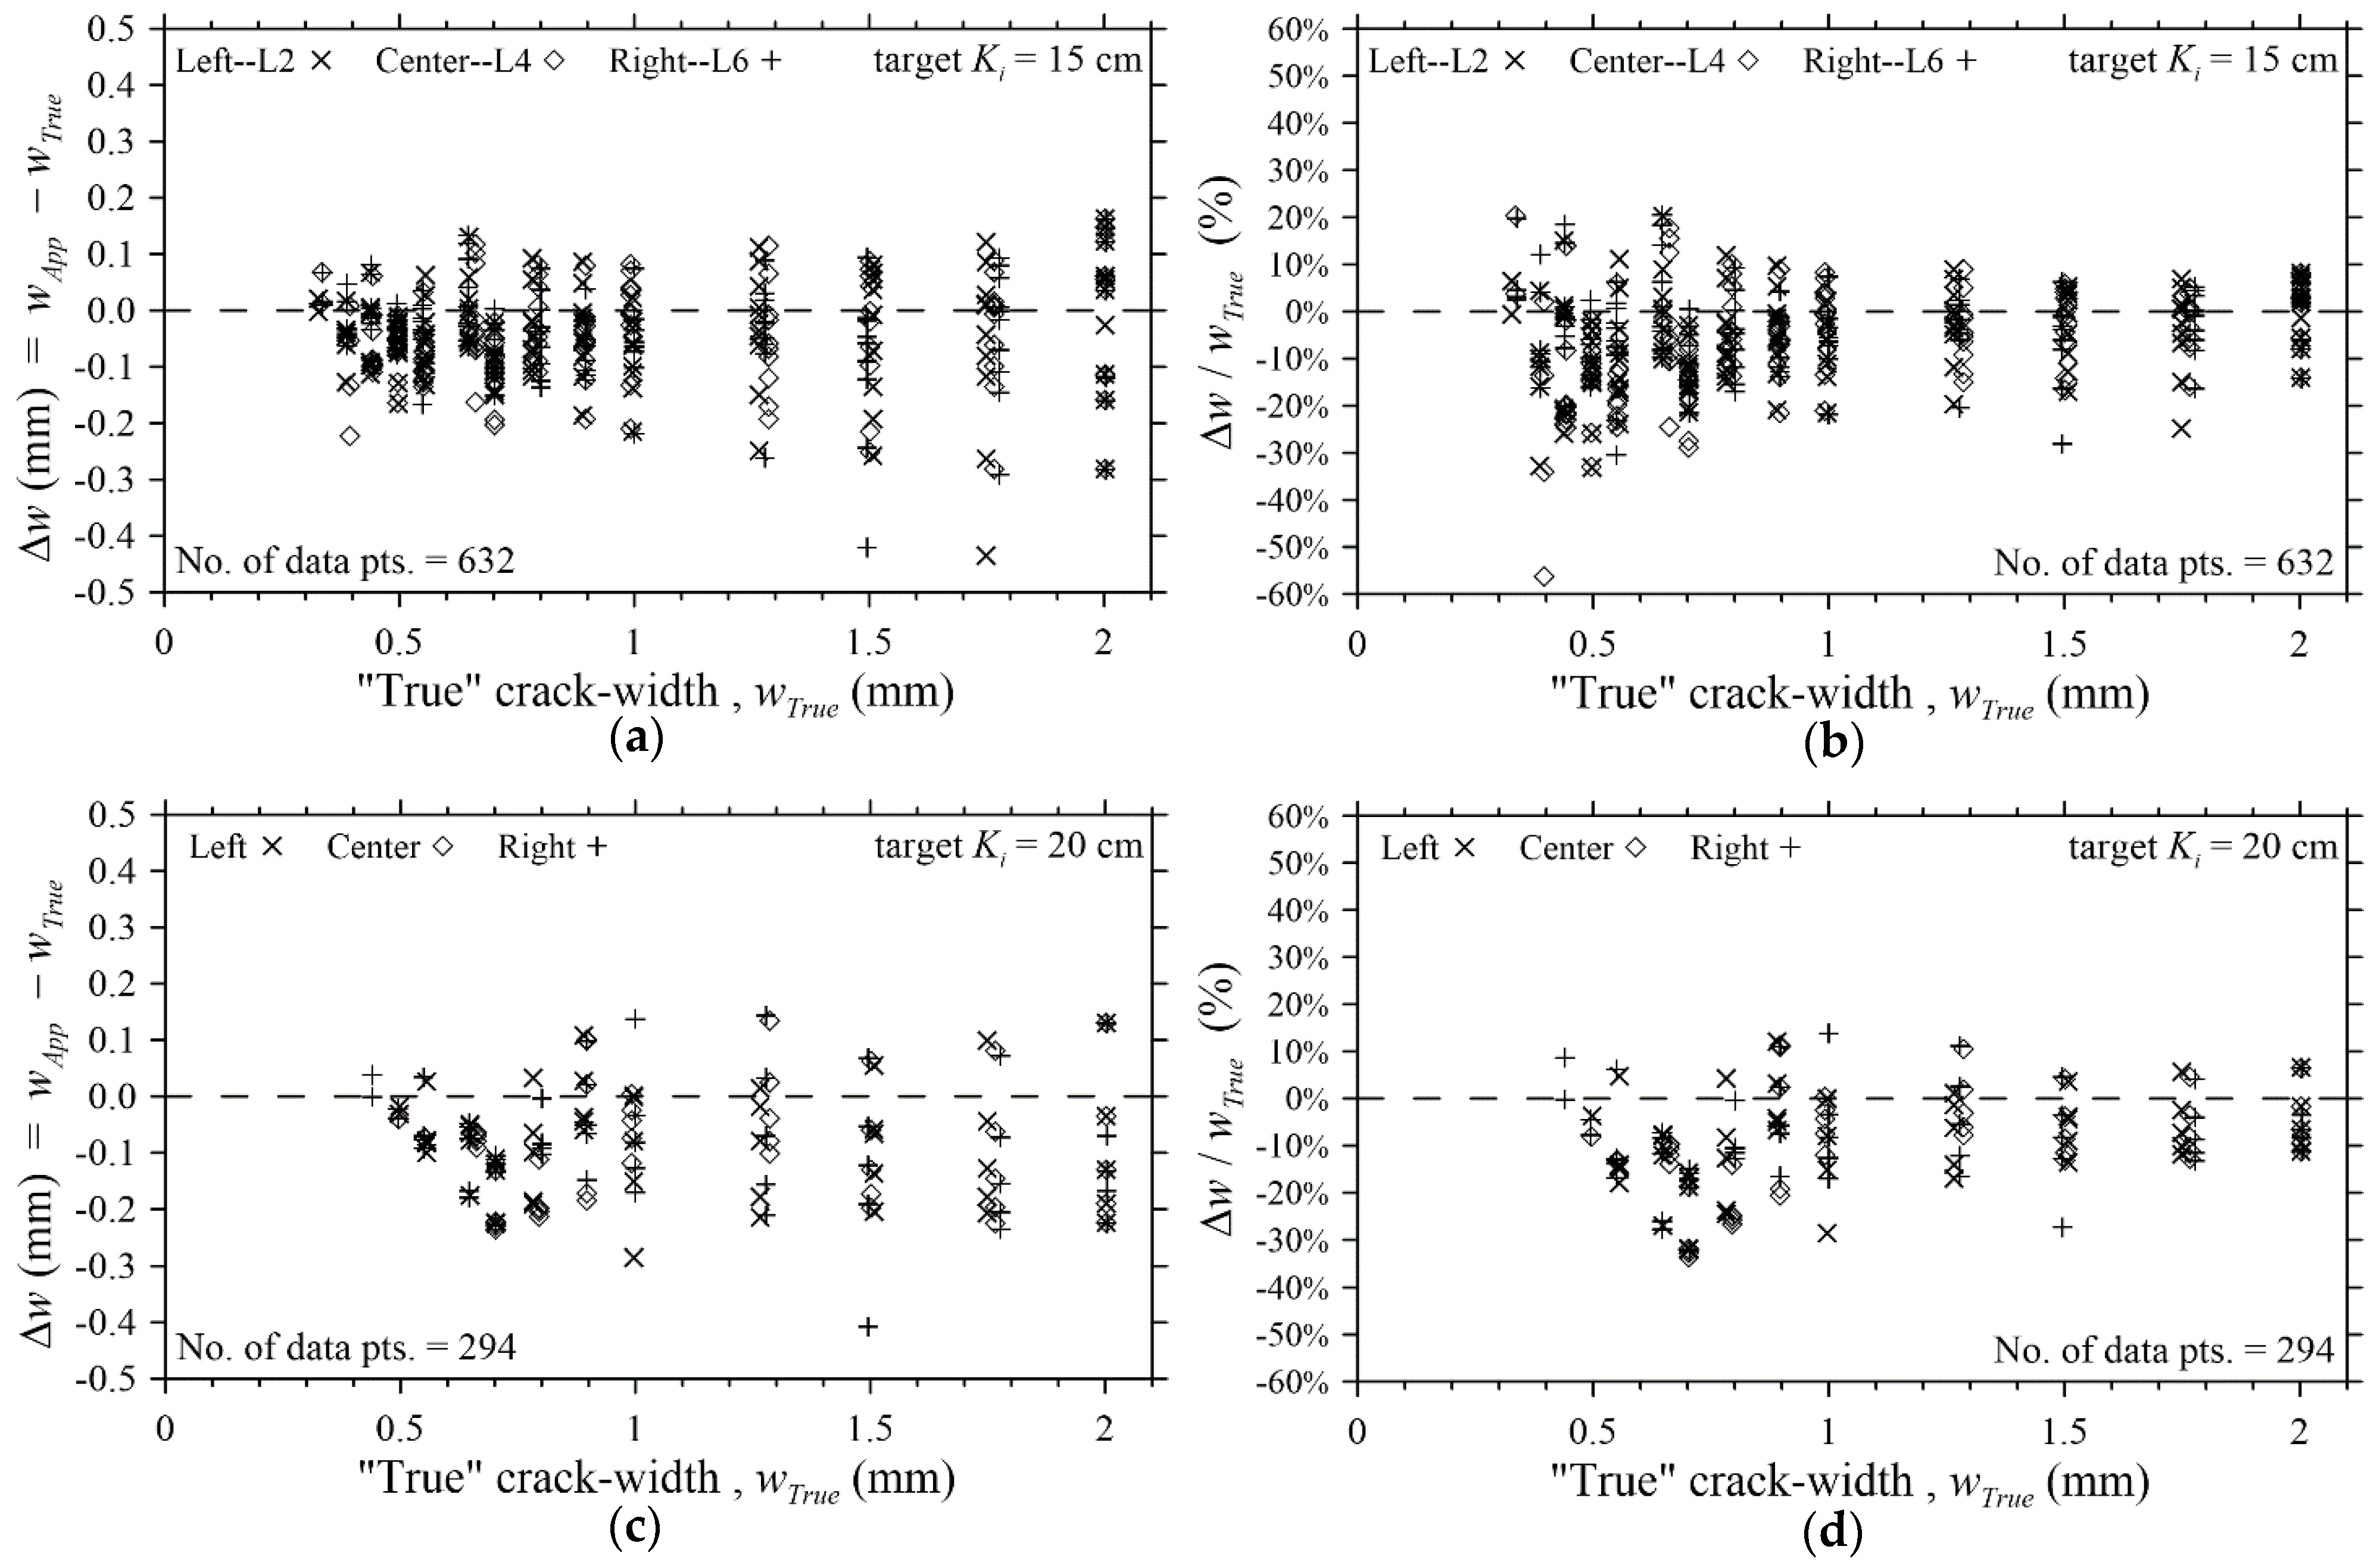
3.4.2. Experimental Results

The experimental results of these standard crack-width measurement tests using the preliminary app are illustrated in Figure 14. In this figure, the “true” crack-width values wTrue corresponding to the app-measured values wApp were obtained through systematic repeated manual measurements using the five crack-width measuring magnifiers, as described in Section 2.2. Figure 14a,b present the results of 10 standard tests with a target Ki of 15 cm, while Figure 14c,d show the results of 5 standard tests with a target Ki of 20 cm.
A measured value wApp can be divided by the “physical size per unit pixel”, calculated by the app using ARCore-AR routines, to determine the corresponding pixel count. If the pixel count is too low, the error in converting the crack width to an integer number of pixels could be significant. Therefore, the experimental results in Figure 14 only include wApp measurements with a pixel count of 4 or more, discarding those with fewer than 4 pixels. This also helps determine the app’s minimum measurable crack width, which corresponds to a wApp value with a pixel count of 4. The main difference between Figure 14a,b and Figure 14c,d is the minimum measurable crack width. In the former, the minimum wApp is 0.33 mm due to the shorter target distance Ki of 15 cm between the phone and the SW. In the latter, the minimum wApp is 0.50 mm because of the longer target Ki of 20 cm.

3.4.3. Brief Discussion of the Experimental Results

The smallest target Ki is approximately 15 cm, as the phone’s camera cannot capture clear images for target Ki values smaller than this. Consequently, the experimental results (Figure 14a,b) also indicate the app’s minimum measurable crack width as 0.33 mm, which is too large for most engineering applications. This limitation can be attributed to the relatively low resolution of the preview images captured via ARCore routines, rather than a limitation of the phone’s camera hardware. The preliminary app executes its preview function with the camera controlled by ARCore-AR, which restricts image capture to the resolution of the phone’s screen display—typically much lower than the camera’s full resolution.
Lower image resolution increases the physical length represented by each pixel, thereby limiting the app’s ability to detect finer cracks. The current minimum measurable crack width of 0.33 mm corresponds to a unit pixel length of approximately 0.0825 mm at a target Ki of 15 cm. In an ongoing study, the authors used the same Pixel 8 Pro device to capture images at full camera resolution with a zoom ratio of 1.0~3.0, achieving a unit pixel length of less than 0.015 mm at the same target distance. This higher-resolution configuration could potentially reduce the minimum measurable crack width to approximately 0.06 mm, suggesting that capturing images at full camera resolution may significantly enhance the app’s measurement capability.
The experimental results (Figure 14) could be further investigated from various perspectives, such as (1) the wide scattering of the Δw distribution in Figure 14, and (2) the skewness toward negative values in the Δw distribution. The wide scattering of the Δw distribution is likely due to the precision level of the AR-detected physical distances (Step <4> in Figure 11), which is meant to meet human vision requirements rather than the higher accuracy needed for engineering measurements. The negative skewness in the Δw distribution, approximately half a pixel in size, is likely related to the app’s method for determining crack edges. More in-depth investigations, beyond the scope of this paper, could be pursued through highly repeated and systematic experiments using the proposed standard test apparatus and method.

4. Results and Discussion

Summary of results. In this study, a standard apparatus and method were developed to test and validate the accuracy of mobile phone apps in measuring concrete crack widths. The apparatus incorporates a standard CWCP and SW, along with a specialized PAFD and SDMA. In the test method, the innovative two-stage procedure associated with the SDMA synchronously calculates and displays the four average distances Ki from the phone’s corner points Pi (i = 1–4) to the SW. With continuous feedback, the phone’s position can be adjusted using the PAFD until the monitored Ki values match the target Ki. Subsequently, the app installed on the phone is used to measure the crack widths on the CWCP. A standard experimental procedure was established to conduct standard tests assessing the accuracy of the preliminary Android app in measuring concrete crack widths.
Cost effectiveness of the two-stage method. The specialized SDMA consists of a custom-designed stainless-steel holder, four LDSs, and the mobile phone used for testing. The outcome of 3D scanning in Stage 1 of the procedure—3D coordinates of the eight spatial points (P1P4 and S1S4) and the four 3D unit vectors ( u ^ 1 u ^ 4 )—represents the spatial relationships between the phone and the four LDS laser beams in the SDMA. In Stage 2, these 3D coordinates are used with the LDS real-time distance measurements (d1d4) to synchronously calculate and display the four Ki values.
An alternative strategy for determining the spatial relationship between the phone and the four LDSs is to predefine a specific spatial arrangement and then manufacture a holder that conforms precisely to this arrangement to secure the four LDSs. However, this strategy requires high-precision machinery to fabricate such a metal holder, which may be cost-prohibitive. Therefore, the Stage 1 method is employed: the stainless-steel holder is fabricated using conventional sheet metal processing to secure the four LDSs, and the spatial relationship between the phone and the four LDS laser beams is then determined using widely available 3D scanning technology. This approach should be significantly more cost-effective.
In addition, the stainless-steel holder and SDMA presented in this paper hold the mobile phone in a vertical (portrait) orientation. As shown in Figure A3 in Appendix B, a cost-effective stainless-steel holder and SDMA can also be easily fabricated to hold the phone in a horizontal (landscape) orientation to investigate the effects of phone orientation.
Adequacy of the allowable limits. In Step (m) of the standard experimental procedure (Figure 10), the permissible criteria for the measurement differences Δ d i and Δ K i are set to ±1.0 mm and ±0.8 mm, respectively. These represent the differences between the real-time monitored di and Ki values (obtained from the LDS/data logger measurement) and their corresponding 3D scanning/point-cloud measurement values. As 3D scanning/point-cloud measurements inherently include minute random errors, a subtle question may arise regarding the adequacy of the allowable limits (±1.0 mm and ±0.8 mm), which are based on the inexact 3D scanning measurements. However, considering the underlying physical meaning of the test method (as described in Section 2.7), these limits (±1.0 mm and ±0.8 mm) [approximately equivalent to ±0.63% (±1.0 mm/160 mm) and ±0.53% (±0.8 mm/150 mm), respectively] should be precise enough for the standard tests to realistically mimic actual engineering conditions, where the app user is engaging with a perceived crack plane rather than a true mathematical plane (see Section 2.7).
Extensibility to accommodate inclined-phone conditions. The standard tests conducted on the preliminary app, along with the experimental procedure (Figure 10, Figure 11 and Figure 12) and results (Figure 14) presented in this paper, all had the four monitored K 1 K 2 K 3 K 4 matching the target Ki. In other words, the standard test method described here addresses the scenario where the mobile phone’s screen is parallel to the test wall (SW). However, the standard test method can be extended to accommodate conditions where the phone’s screen is inclined relative to the wall. This can be achieved by setting varied K1K4 values to produce a predefined inclination angle.
Merits and primary functions of the standard test method. In summary, the standard test apparatus and method developed in this study have two primary functions: (1) controlling the required experimental parameters of the test conditions, and (2) reproducing the required test conditions for repeated experiments. These two functions (a) enable the investigation of the effects of various experimental parameters, (b) allow for the comparison of experimental results under identical test conditions, and (c) facilitate repeated, systematic experiments to establish the reliability of the app’s accuracy validation.
A crack-width measuring app still requires real-world validation on actual concrete cracks. However, drawing a comparison to global efforts in vaccine and drug development, the standard crack-width measurement test is analogous to easily repeatable “animal trials”, whereas validation using real concrete cracks is akin to “human trials”. Just as human trials are difficult to conduct frequently and systematically, real-world concrete crack measurements present similar challenges. Therefore, standard measurement tests, which are easy to repeat frequently, are indispensable, much like animal trials in drug development.
To provide a reference and comparison to the standard test results (Figure 14), Appendix C presents a set of tests measuring actual concrete crack widths using the preliminary Android app.
Future possibilities. In addition to testing and verifying the accuracy of apps in measuring crack widths, the standard test method may also serve to standardize concrete crack-width measurements and provide, for the first time, an objective and unified definition for concrete-surface crack widths. Traditional methods for measuring concrete crack widths, such as crack measuring magnifiers or crack-width comparator cards, rely on subjective visual readings with the naked eye. As a result, the determination and use of concrete crack widths have been somewhat self-evident, and to the authors’ knowledge, there is no precise objective definition of concrete crack widths to date. The ability of apps to perform objective crack-width measurements, combined with a standard test method for validating their accuracy, could help resolve this issue in the future.

5. Conclusions

  • This study developed a standard apparatus and method for testing and validating the accuracy of mobile phone apps in measuring concrete crack widths. The proposed test method includes an innovative two-stage process that simultaneously calculates and displays the spatial position of the mobile phone relative to the test wall.
  • A standard experimental procedure was established for conducting standard tests to assess the accuracy of a preliminary Android app in measuring concrete crack widths. The experimental results of these standard tests demonstrate the effectiveness of the proposed test method.
  • This standard test apparatus and method, grounded in their underlying physical meaning, realistically simulate actual engineering conditions precisely and cost-effectively.
  • The standard test method can control experimental parameters and reproduce the required test conditions for repeated experiments. This allows for investigating the effects of various parameters, comparing results under identical conditions, and establishing the reliability of app accuracy validation through repeated, systematic experiments.

6. Patents

The design concepts of the standard test apparatus and method proposed in this paper have been submitted for invention patent applications in both Taiwan and the United States. The corresponding application numbers are 113149405 (Taiwan) and 19/072,810 (U.S.).

Author Contributions

Conceptualization, C.-H.J.; Methodology, C.-H.J. and M.C.; Software, C.-H.J. and J.-H.C.; Investigation, C.-H.J.; Resources, M.C.; Writing—original draft, C.-H.J.; Supervision, C.-H.J.; Project administration, C.-H.J.; Funding acquisition, C.-H.J. All authors have read and agreed to the published version of the manuscript.

Funding

This research was funded by the National Science and Technology Council, Taiwan, through grants NSTC111-2221-E-260-003 and NSTC112-2221-E-260-009.

Data Availability Statement

The original contributions presented in this study are included in the article. Further inquiries can be directed to the corresponding author.

Acknowledgments

The authors gratefully acknowledge the assistance of Ting-Yu Hu, Yu Cheng Liu, Chien Chen Kuo, and Jhih-Cheng Syu, former or current students at National Chi Nan University, Taiwan.

Conflicts of Interest

The authors declare no conflicts of interest.

Appendix A. Brief Introduction to the Preliminary Android App for Crack-Width Measurement

Appendix A.1. Background

Previous digital image processing methods for concrete crack detection, as reviewed in this paper, can be divided into two classes based on their purpose and functionality: (1) those that only detect the presence of cracks and generate crack maps (e.g., [3,4,6,21,22,25]), and (2) those that further measure crack-related parameters such as width, length, and orientation from the crack maps (e.g., [5,7,9,10,16,17,18,19,20,28,32,33,34,35,36,37,38]). The developed preliminary Android app uses the phone’s camera to capture color digital images of the crack surface, from which the corresponding monochrome (black-and-white) crack images are generated to determine the required crack widths. However, unlike most methods in the literature, the app’s measurement targets are predefined, eliminating the need to detect the presence of cracks or tackle complex issues such as noise separation. On the other hand, capturing images with the phone’s camera limits the ability to use specialized cameras or control specific image-capturing conditions, as seen in some previous studies (e.g., [17,18,19,28,38]).
In the reviewed image processing methods, digital image correlation (DIC) requires the surface to be covered with speckles in advance. Some methods rely on special auxiliary tools and/or image-capturing techniques. Certain machine learning and deep learning methods focused only on crack detection without quantitative measurements. They are unsuitable for use in this study’s mobile app. Given the limited computational performance of mobile phones compared to computers, the developed app applies simpler edge detection and image binarization to generate monochrome crack images and measure crack widths.
An edge in digital images can be defined as a tiny region where the intensity changes abruptly [2]. Common edge-detection algorithms, such as Sobel, Prewitt, and Canny, detect edges by comparing the spatial gradient of pixel intensities in two-dimensional space. The Sobel and Prewitt detectors are computationally simpler but less effective at handling noise. The Canny detector first applies a Gaussian mask to smooth the image and filter out noise, then identifies edges by locating the local maxima of directional gradients of pixel intensities.
Image binarization, also categorized as a thresholding method [2], converts grayscale images into binary images by assigning maximum intensity (white) to pixels with values above a given threshold and minimum intensity (black) to those below the threshold. Since the target surfaces to be measured by mobile apps are predefined and often monochrome-painted, simple binarization can usually generate clear crack maps. Therefore, the developed app also implemented a binarization process.

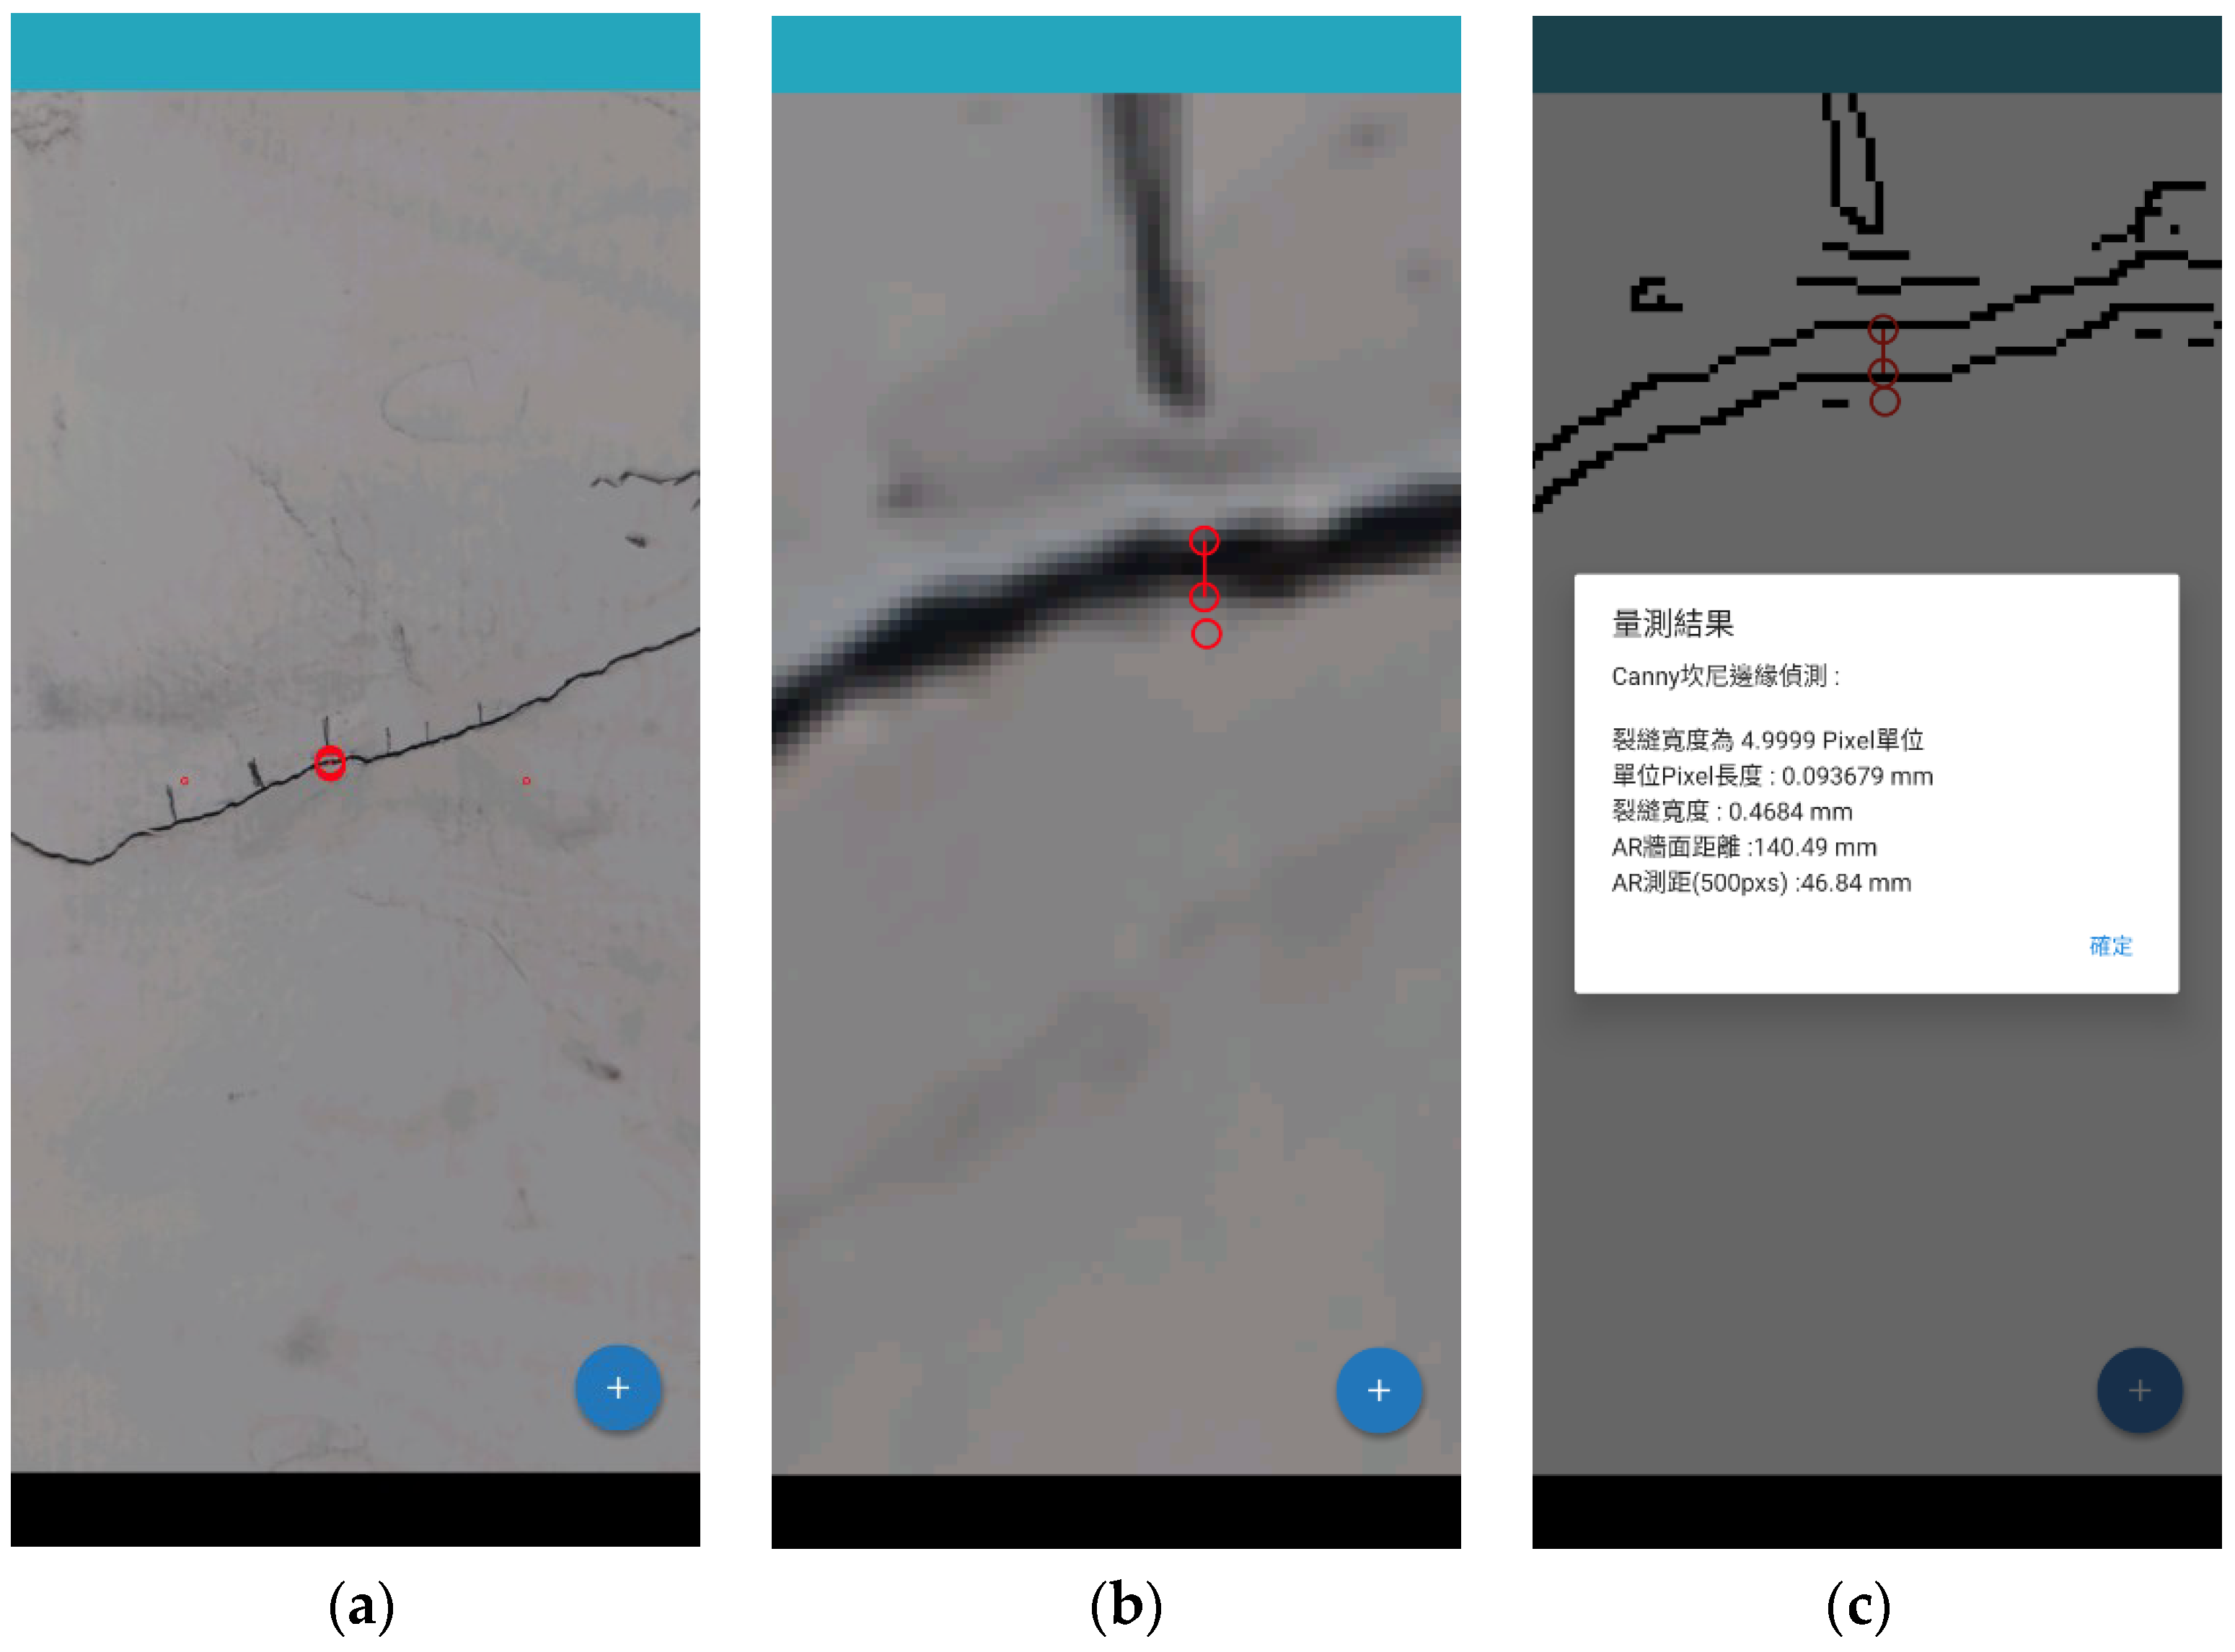
Appendix A.2. Interactive Crack-Width Measurement and Immediate Image Inspection Functions of the App

The starting screen of the developed app is shown in Figure A1a, with two command icons: one for measuring crack widths (left) and another for querying records (right). Tapping the left icon (measuring crack widths) brings up the full-screen camera preview for capturing an image. The camera preview integrates augmented reality (AR) detection provided by ARCore [43] routines, allowing the user to detect the crack plane by moving the phone. When a crack plane is AR-detected, fluorescent dots appear on the preview screen, as shown in Figure A1b, and the screen also displays the unit pixel size and AR-detected distance in real-time. The user can switch between the two image processing methods by tapping the “CANNY” or “BINARY” label at the top-right corner of the screen.
Next, the user can press the light-blue shutter button at the bottom of the screen in Figure A1b to capture a color image of the previewed crack surface. After the photo is taken, the app switches to the screen shown in Figure A1c, displaying the captured color crack image. On this screen (Figure A1c), the user can drag to shift the displayed area or zoom in/out to adjust the displayed image size. Once the adjustments are complete, the user can tap on the desired measurement location, and the app will automatically locate the nearest crack point to measure the crack width at that spot, as illustrated in Figure A1d,e.
Figure A1. AR detection and crack-width measurement: (a) starting of the app; (b) preview with an AR-detected plane; (c) display of the captured color image; (d) confirmation prompted before a crack-width measurement; (e) display of the measurement result.
Eng 06 00122 g0a1
Figure A2. Switching between color and monochrome images and adjusting parameter values for Canny edge detection: (a) monochrome image generated by the app’s Canny detection; (b) a dragged and zoom-in view of the monochrome image; (c) immediate switching to the corresponding view of the color image; (d) switching to the monochrome-image view with a light-blue seek bar at the top of the screen; (e) adjusting the image processing parameter values by dragging the adjustment knob on the seek bar.
Eng 06 00122 g0a2
If “CANNY” is selected before capturing the image (as shown in Figure A1b), the initial crack width measurement will apply Canny edge detection for image processing (Figure A1e). After exiting the measurement result display in Figure A1e, the app returns to the monochrome (black-and-white) crack image generated by Canny detection, as shown in Figure A2a. On this monochrome image screen (Figure A2a), the user can still drag or zoom in/out to adjust the image display. Figure A2b illustrates an example of the image display after being dragged and zoomed from Figure A2a. Both Figure A2a and Figure A2b contain three small red circles. The independent red circle at the bottom marks the most recent tap location for crack-width measurement (Figure A1d,e). The upper pair of red circles connected by a red line represents the two edge points of the crack automatically identified by the app near the tapped location. The length of this red line, connecting the centers of the two circles, indicates the measured crack width.
In Figure A1c–e and Figure A2a,b, a set of five floating action buttons (FABs) is available, which can appear or disappear at any time to perform five different functions. By tapping the [Switch (Color/Monochrome) Image] FAB on the screen in Figure A2b, the black-and-white crack image is instantly switched to its original color version, as shown in Figure A2c. The same three red circles marking the crack-width measurement location are also displayed in the color image (Figure A2c). Similarly, tapping the same FAB in Figure A2c switches the display back to the black-and-white version in Figure A2b. This [Switch (Color/Monochrome) Image] function allows users to easily verify whether the crack width detected in the processed monochrome image corresponds to the required crack width in the original color image.
If the [Adjust Image Analysis Parameters] FABs is tapped on the screen in Figure A2b or Figure A2c, the display switches to the processed black-and-white image, with a light-blue horizontal seek bar appearing at the top of the screen, as shown in Figure A2d. By dragging the adjustment knob on the seek bar, the user can adjust the image processing parameter values in real time, with the screen dynamically displaying the black-and-white crack images corresponding to different parameter values. For example, Figure A2d shows the Canny-processed black-and-white image when the adjustment knob is moved to the far right, representing the maximum parameter value, while Figure A2e shows the image when the knob is shifted to the left, resulting in a smaller parameter value.
Demonstrations of the app’s functionalities, including zooming in/out on images, measuring crack widths, and switching between color and monochrome images for verification, can be viewed in a short video on YouTube (https://youtube.com/shorts/MCmQjrtBR8Y) [44]. Another YouTube video (https://youtu.be/UwgEolddrms) [45] shows the functions of real-time adjustment of image processing parameters, measuring crack widths on monochrome crack images, and switching between different monochrome images.

Appendix B. SDMA for Mobile Phones in a Horizontal (Landscape) Orientation

Figure A3. Stainless-steel holder and SDMA for mobile phones in a horizontal (landscape) orientation: (a) 3D drawings of the stainless-steel holder and four LDSs; (b) photographs.
Eng 06 00122 g0a3

Appendix C. Crack-Width Measurement Tests on Actual Concrete Surfaces Using the Mobile Phone App

This appendix presents the testing process and results of measuring actual concrete crack widths using the preliminary Android app (as described in Appendix A). However, as previously mentioned, with a minimum measurable crack width of approximately 0.33 mm and other constraints, the app is not yet suitable for practical engineering applications and remains a prototype for research and testing purposes. Therefore, the primary objective of these tests is to provide a reference and comparison to the standard test results (Figure 14), rather than to validate the accuracy of the app itself.

Appendix C1. Test Setup and Method

Figure A4 illustrates the overall test setup. After the target concrete surface was detected using the phone app’s AR function, the phone (the same Pixel 8 Pro mobile phone used in the standard tests) was secured on a tripod, and appropriate lighting conditions were adjusted. Then, as shown in Figure A5, a steel ruler and an electronic inclinometer were used for manual measurements and adjustments to ensure that the distances from the phone’s four corner points to the concrete surface matched the target Ki value (15 cm). Subsequently, the phone app was used to capture a color image of the crack surface, followed by one or more crack-width measurements (wApp) in the captured image, as described previously in this paper.
Figure A4. Overall setup.
Eng 06 00122 g0a4
Figure A5. Measuring distances and inclination angles: (a) measuring Ki distances with a steel ruler; (b) measuring inclination angles with an electronic inclinometer.
Eng 06 00122 g0a5
As in the standard tests, at each app-measured crack-width location, manual measurements were conducted using crack-width measuring magnifiers (as shown in Figure 3 and Table 1) to obtain the corresponding “true” crack width wTrue. The measured wTrue values were then compared with the app’s measurements (wApp) to determine the measurement difference Δw = wAppwTrue. However, due to the app’s minimum measurable crack width of approximately 0.33 mm and the relatively challenging measurement conditions on actual concrete surfaces, the two high-precision crack-width magnifiers (Baiyi BY-D200XS and Peak 2008-100X) used in the standard tests (Figure 3 and Table 1) were not used for this experiment. Instead, two Peak 2016-15X magnifiers were used. Each crack width was measured twice, once with each magnifier, and the average of the two measurements was taken as wTrue. Additionally, to achieve better comparability with the standard tests, only relatively clear or distinct cracks were selected, while those affected by blurring, stains, or peeling paint were excluded.

Appendix C2. Test Results

Figure A6 and Figure A7 show phone screen captures from two instances of crack-width measurements using the app. In these figures, Figure A6a and Figure A7a display the full-frame color crack images along with the crack-width measurement locations, while Figure A6b and Figure A7b provide zoomed-in views of the color crack images around the measurement points. Additionally, Figure A6c and Figure A7c present the corresponding monochrome (black-and-white) crack images processed using Canny edge detection, along with the measurement result display dialog. To ensure consistency with the standard tests, the measurement locations were selected near the center of the crack images, as shown in Figure A6a and Figure A7a. The screen captures in Figure A6a,b and Figure A7a,b with the manual auxiliary marks also serve as location references for the manual measurements (wTrue) obtained using crack-width measuring magnifiers.
Figure A6. Phone screen captures from app crack-width measurement #1: (a) display of the full-frame color crack image with the crack-width measurement locations; (b) a zoom-in view of the color image; (c) display of the measurement result.
Eng 06 00122 g0a6
Figure A7. Phone screen captures from app crack-width measurement #2: (a) display of the full-frame color crack image with the crack-width measurement locations; (b) a zoom-in view of the color image; (c) display of the measurement result.
Eng 06 00122 g0a7
Figure A8 presents the results of 99 crack-width measurement tests on actual concrete surfaces. The 99 red solid circles represent the results of these tests, while the 632 standard test data points from Figure 14a,b are plotted as light gray hollow triangles for comparison.
Figure A8. Experimental results of the actual concrete crack-width measurement tests using the mobile phone app.
Eng 06 00122 g0a8

Appendix C3. Discussion and Conclusions

  • In these crack-width measurement tests on actual concrete surfaces, the determinations of Ki and wTrue values were less precise than those in the standard tests. Additionally, the experimental conditions and crack-width measurement targets were much more difficult to control and reproduce, making systematic and repeatable testing nearly impossible.
  • Figure A8 shows that the distribution of measurement differences (Δw and Δw/wTrue) in these tests is generally consistent with the results of the standard tests (Figure 14a,b). This consistency supports the reliability of the standard test apparatus and method presented in this paper.

References

  1. Jeng, C.H. Upgrading the Efficacy and Validating the Accuracy of an Android App for Measurement of Concrete-Surface Crack Widths; Report for a Research Project Funded by the National Science and Technology Council, Taiwan through grant NSTC111-2221-E-260-003; National Chi Nan University: Nantou, Taiwan, 2024. (In Chinese) [Google Scholar]
  2. Gonzalez, R.C.; Woods, R.E. Digital Image Processing, 4th ed.; Pearson Education Limited: Essex, UK, 2018. [Google Scholar]
  3. Abdel-Qader, I.; Abudayyeh, O.; Kelly, M.E. Analysis of edge-detection techniques for crack identification in bridges. J. Comput. Civ. Eng. 2003, 17, 255–263. [Google Scholar] [CrossRef]
  4. Hutchinson, T.C.; Chen, Z. Improved image analysis for evaluating concrete damage. J. Comput. Civ. Eng. 2006, 20, 210–216. [Google Scholar] [CrossRef]
  5. Yamaguchi, T.; Hashimoto, S. Practical image measurement of crack width for real concrete structure. Electron. Commun. Jpn. 2009, 92, 1–12. [Google Scholar] [CrossRef]
  6. Yamaguchi, T.; Hashimoto, S. Fast crack detection method for large-size concrete surface images using percolation-based image processing. Mach. Vis. Appl. 2010, 21, 797–809. [Google Scholar] [CrossRef]
  7. Zhu, Z.; German, S.; Brilakis, I. Visual retrieval of concrete crack properties for automated post-earthquake structural safety evaluation. Autom. Constr. 2011, 20, 874–883. [Google Scholar] [CrossRef]
  8. Choi, S.; Shah, S.P. Measurement of deformations on concrete subjected to compression using image correlation. Exp. Mech. 1997, 37, 307–313. [Google Scholar] [CrossRef]
  9. Destrebecq, J.F.; Toussaint, E.; Ferrier, E. Analysis of cracks and deformations in a full scale reinforced concrete beam using a digital image correlation technique. Exp. Mech. 2010, 51, 879–890. [Google Scholar] [CrossRef]
  10. Dutton, M. Digital Image Correlation for Evaluating Structural Engineering Materials. Master’s Thesis, Department of Civil Engineering, Queen’s University, Kingston, ON, Canada, 2012. [Google Scholar]
  11. Zhao, P.; Zsaki, A.M.; Nokken, M.R. Using digital image correlation to evaluate plastic shrinkage cracking in cement-based materials. Constr. Build. Mater. 2018, 182, 108–117. [Google Scholar] [CrossRef]
  12. Bertelsen, I.M.G.; Kragh, C.; Cardinaud, G.; Ottosen, L.M.; Fischer, G. Quantification of plastic shrinkage cracking in mortars using digital image correlation. Cem. Concr. Res. 2019, 123, 105761. [Google Scholar] [CrossRef]
  13. Mehmandari, T.A.; Shokouhian, M.; Josheghan, M.Z.; Mirjafari, S.A.; Fahimifar, A.; Armaghani, D.J.; Tee, K.F. Flexural properties of fiber-reinforced concrete using hybrid recycled steel fibers and manufactured steel fibers. J. Build. Eng. 2024, 98, 111069. [Google Scholar] [CrossRef]
  14. Mehmandari, T.A.; Shokouhian, M.; Imani, M.; Tee, K.F.; Fahimifar, A. Split tensile behavior of recycled steel fiber-reinforced concrete. ACI Mater. J. 2025, 122, 15–28. [Google Scholar]
  15. Lawler, J.S.; Keane, D.T.; Shah, S.P. Measuring three-dimension damage in concrete under compression. Mater. J. 2001, 98, 465–475. [Google Scholar]
  16. Nguyen, H.N.; Kam, T.Y.; Cheng, P.Y. An automatic approach for accurate edge detection of concrete crack utilizing 2D geometric features of crack. J. Signal Process. Syst. 2014, 77, 221–240. [Google Scholar] [CrossRef]
  17. Yang, Y.S.; Yang, C.M.; Huang, C.W. Thin crack observation in a reinforced concrete bridge pier test using image processing and analysis. Adv. Eng. Softw. 2015, 83, 99–108. [Google Scholar] [CrossRef]
  18. Yang, Y.S.; Wu, C.L.; Hsu, T.T.C.; Yang, H.C.; Lu, H.J.; Chang, C.C. Image analysis method for crack distribution and width estimation for reinforced concrete structures. Autom. Constr. 2018, 91, 120–132. [Google Scholar] [CrossRef]
  19. Woods, J.E.; Yang, Y.S.; Chen, P.C.; Lau, D.T.; Erochko, J. Automated crack detection and damage index calculation for RC structures using image analysis and fractal dimension. J. Struct. Eng. 2021, 147, 04021019. [Google Scholar] [CrossRef]
  20. Rivera, J.P.; Josipovic, G.; Lejeune, E.; Luna, B.N.; Whittaker, A.S. Automated detection and measurement of cracks in reinforced concrete components. ACI Struct. J. 2015, 112, 397–405. [Google Scholar] [CrossRef]
  21. Cha, Y.J.; Choi, W.; Büyüköztürk, O. Deep learning-based crack damage detection using convolutional neural networks. Comput.-Aided Civ. Infrastruct. Eng. 2017, 32, 361–378. [Google Scholar] [CrossRef]
  22. Dung, C.V.; Anh, L.D. Autonomous concrete crack detection using deep fully convolutional neural network. Autom. Constr. 2019, 99, 52–58. [Google Scholar] [CrossRef]
  23. Rezaie, A.; Achanta, R.; Godio, M.; Beyer, K. Comparison of crack segmentation using digital image correlation measurements and deep learning. Constr. Build. Mater. 2020, 261, 120474. [Google Scholar] [CrossRef]
  24. Chun, P.J.; Izumi, S.; Yamane, T. Automatic detection method of cracks from concrete surface imagery using two-step light gradient boosting machine. Comput.-Aided Civ. Infrastruct. Eng. 2021, 36, 61–72. [Google Scholar] [CrossRef]
  25. Cha, Y.J.; Choi, W.; Suh, G.; Mahmoudkhani, S.; Büyüköztürk, O. Autonomous structural visual inspection using region-based deep learning for detecting multiple damage types. Comput.-Aided Civ. Infrastruct. Eng. 2018, 33, 731–747. [Google Scholar] [CrossRef]
  26. Kang, D.; Benipal, S.S.; Gopal, D.L.; Cha, Y.J. Hybrid pixel-level concrete crack segmentation and quantification across complex backgrounds using deep learning. Autom. Constr. 2020, 118, 103291. [Google Scholar] [CrossRef]
  27. Kim, H.; Ahn, E.; Shin, M.; Sim, S.H. Crack and noncrack classification from concrete surface images using machine learning. Struct. Health Monit. 2019, 18, 725–738. [Google Scholar] [CrossRef]
  28. Kim, H.; Sim, S.H.; Spencer, B.F. Automated concrete crack evaluation using stereo vision with two different focal lengths. Autom. Constr. 2022, 135, 104136. [Google Scholar] [CrossRef]
  29. Yu, Z.; Shen, Y.; Shen, C. A real-time detection approach for bridge cracks based on YOLOv4-FPM. Autom. Constr. 2021, 122, 103514. [Google Scholar] [CrossRef]
  30. Choi, Y.; Bae, B.; Han, T.H.; Ahn, J. Application of Mask R-CNN and YOLOv8 algorithms for concrete crack detection. IEEE Access 2024, 12, 165314–165321. [Google Scholar] [CrossRef]
  31. He, K.; Gkioxari, G.; Dollár, P.; Girshick, R. Mask R-CNN. In Proceedings of the 2017 IEEE International Conference on Computer Vision (ICCV), Venice, Italy, 22–29 October 2017. [Google Scholar] [CrossRef]
  32. Carrasco, M.; Araya-Letelier, G.; Velázquez, R.; Visconti, P. Image-based automated width measurement of surface cracking. Sensors 2021, 21, 7534. [Google Scholar] [CrossRef]
  33. Chen, S.; Shi, Z.; Yan, Q. Concrete crack width detecting system for Android platform. Open Civ. Eng. J. 2015, 9, 846–851. [Google Scholar] [CrossRef]
  34. Kong, Y.; Yu, Z.; Chen, H.; Wang, Z.; Chen, C.; Guo, B. Detecting type and size of road crack with the smartphone. In Proceedings of the 2017 IEEE International Conference on Computational Science and Engineering (CSE) and IEEE International Conference on Embedded and Ubiquitous Computing (EUC), Guangzhou, China, 21–24 July 2017. [Google Scholar] [CrossRef]
  35. Ni, T.; Zhou, R.; Gu, C.; Yang, Y. Measurement of concrete crack feature with Android smartphone app based on digital image processing techniques. Measurement 2020, 150, 107093. [Google Scholar] [CrossRef]
  36. Ni, T.; Zhou, R.; Yang, Y.; Yang, X.; Zhang, W.; Lin, C. Research on detection of concrete surface cracks by image processing based on smartphone app. Acta Metrol. Sin. 2021, 42, 163–170. (In Chinese) [Google Scholar] [CrossRef]
  37. Gepiga, C.S.; Magana, J.P.; Sandoval, G.A.D.; Angelia, R.E. Automated crack detection and measurement based on Mask R-CNN and image analysis with mobile application. In Proceedings of the 5th International Conference on Electronics and Electrical Engineering Technology (EEET), Beijing, China, 2–4 December 2022. [Google Scholar] [CrossRef]
  38. Wang, H.; Peng, H.; Tang, Y.; Guan, Y.; Liang, Y.; Wang, L.; Zhao, Y.; Wang, X.; Gao, R.; Huang, H. Portable structure surface crack detection system based on Android platform. Wuhan Univ. J. Nat. Sci. 2024, 29, 154–164. [Google Scholar] [CrossRef]
  39. Tokyo Electron Device. Launch of Sales of “Tablet-Type Crack Width Measuring Instrument FCV-40 CRACK VIEWER”. Available online: https://www.teldevice.co.jp/pro_info/2021/press_211220.php (accessed on 26 April 2025). (In Japanese).
  40. Official Website of the CloudCompare Project. Available online: https://www.cloudcompare.org/ (accessed on 26 April 2025).
  41. Jeng, C.H. Developing Mobile App for Measurement of Concrete Surface Cracks; Report for a Research Project Funded by the Ministry of Science and Technology, Taiwan through Grant MOST107-2221-E-260-009; National Chi Nan University: Nantou, Taiwan, 2020. (In Chinese) [Google Scholar]
  42. Jeng, C.H. Integration and Implementation of an Android App for Measurement of Concrete Surface Cracks; Report for a Research Project Funded by the Ministry of Science and Technology, Taiwan through Grant MOST109-2221-E-260-005; National Chi Nan University: Nantou, Taiwan, 2022. (In Chinese) [Google Scholar]
  43. Official Website of ARCore—Google for Developers. Available online: https://developers.google.com/ar (accessed on 26 April 2025).
  44. Jeng, C.H. A Video on YouTube: Usage Demonstration of the Preliminary Android App: Zoom in and out, Measure a Crack-Width on a Captured Colored Crack Image, and Switch Between Colored and Monochrome Images. Available online: https://youtube.com/shorts/MCmQjrtBR8Y (accessed on 26 April 2025).
  45. Jeng, C.H. A Video on YouTube: Adjusting Values of the Parameters for Digital Image Processing in Real Time, Measuring Crack Widths on Monochrome Crack Images, and Switching Between Different Monochrome Images. Available online: https://youtu.be/UwgEolddrms (accessed on 26 April 2025).
  46. Bureau of Standards, Metrology and Inspection. Taiwan National Standards CNS 12112: Lighting of Indoor Work Places; Ministry of Economic Affairs: Taipei, Taiwan, 2012. [Google Scholar]
Figure 1. Crack width calibration plate (CWCP): (a) design drawing; (b) photographs of the finished CWCP.
Eng 06 00122 g001
Figure 2. Photographs of the simulated wall (SW): (a) front view; (b) rear view; (c) square and slot opening with a lux meter.
Eng 06 00122 g002
Figure 3. Photographs of the crack-width measuring magnifiers used to determine the “true” crack widths for the CWCP: (a) three types of the measuring magnifiers; (b) one of the three types.
Eng 06 00122 g003
Figure 4. Pose adjusting and fixing device (PAFD): (a) tripod and tripod-head unit; (b) tripod and tripod-head unit paired with a bilateral translational accessory.
Eng 06 00122 g004
Figure 5. Spatial distance measuring assemblage (SDMA): (a) 3D drawings of the stainless-steel holder and four LDSs; (b) photographs of the SDMA.
Eng 06 00122 g005
Figure 6. Overall test setup for crack-width measurements using a mobile phone app.
Eng 06 00122 g006
Figure 7. Stage 1—Determining the spatial relationship between the LDSs and mobile phone before crack-width measurement: (a) setup with an arbitrary wall panel; (b) 3D scanning; (c) monochrome 3D point cloud; (d) 3D color texture generated from point cloud and camera images; (e) methodology and procedure.
Eng 06 00122 g007
Figure 8. Stage 2—Real-time distance calculation between the mobile phone and test wall using LDS readings: (a) spatial geometric relationship among points P1P4, points W1W4, and distances K1K4; (b) methodology and procedure.
Eng 06 00122 g008
Figure 9. Stage 2 setup and 3D point cloud of a validation experiment: (ac) three photographs of the setup; (d,e) images of the 3D point cloud and 3D texture.
Eng 06 00122 g009
Figure 10. Standard experimental procedure for assessing the accuracy of a mobile phone app in measuring concrete crack widths.
Eng 06 00122 g010
Figure 11. Standard operating procedure for the crack-width measurements in a standard test.
Eng 06 00122 g011
Figure 12. Photographs of the crack-width measurements in a standard test: (a) repositioning the SDMA–PAFD assembly to face the wooden SW; (b) checking the lighting conditions; (c) display of the operating software of the data logger; (d,e) app’s preview screen after aligning the mobile phone; (f,g) detecting the crack-measurement surface (the SW and the CWCP) via the app’s AR-detection function.
Eng 06 00122 g012
Figure 13. Grouping and vertical alignment of the CWCP cracks for crack-width measurement tests.
Eng 06 00122 g013
Figure 14. Experimental results of the standard crack-width measurement tests using a mobile phone app: (a,b) the results of 10 standard tests with a target Ki of 15 cm; (c,d) the results of 5 standard tests with a target Ki of 20 cm.
Eng 06 00122 g014
Table 1. Specifications of the crack-width measuring magnifiers in Figure 3.
Brand and ModelMagnificationSmallest
Scale
(mm)
Maximum
Measurement
Value (mm)
Precision of
Estimated
Digit (mm)
Manufacturer
Baiyi BY-D200XS200×0.0020.60.001BAIYI, Taoyuan, Taiwan
Peak 2008-100X100×0.0050.80.0025Peak Optics, Osaka, Japan
Peak 2016-15X15×0.1140.05Peak Optics, Osaka, Japan
Disclaimer/Publisher’s Note: The statements, opinions and data contained in all publications are solely those of the individual author(s) and contributor(s) and not of MDPI and/or the editor(s). MDPI and/or the editor(s) disclaim responsibility for any injury to people or property resulting from any ideas, methods, instructions or products referred to in the content.

