Article

Influence of Key Parameters of GDL on Performance of Anion Exchange Membrane Electrolytic Cells

Marine Engineering College, Dalian Maritime University, Dalian 116026, China
*
Author to whom correspondence should be addressed.
Eng 2025, 6(6), 111; https://doi.org/10.3390/eng6060111
Submission received: 18 April 2025 / Revised: 22 May 2025 / Accepted: 23 May 2025 / Published: 26 May 2025

Abstract

:
Anion exchange membrane electrolyzer (AEMEC) is a promising hydrogen production technology device. An electrochemical model is developed using MATLAB/Simulink to analyze the impact of factors such as anion exchange membrane (AEM) thickness, operating temperature, pressure, and gas diffusion layer (GDL) parameters including GDL thickness, porosity, and pore size. The results showed that as the thickness of AEM, operating pressure, and GDL decreased, the electrolysis efficiency significantly improved, and energy consumption decreased. When the thickness of AEM decreases from 70 microns to 65 microns, it will cause a decrease of 24 mV in cell voltage. This study also found that increasing pressure slightly increases voltage due to higher diffusion overpotential. In addition, changes in GDL porosity and pore size have a significant impact on performance. The lower porosity reduces ohmic loss and improves efficiency. This study highlights the importance of optimizing the design of AEMEC components to improve hydrogen production performance.

1. Introduction

Energy is the cornerstone of societal advancement. As the imperative to lower carbon emissions intensifies, wind and solar power have seen swift expansion. Yet, the inherent inconsistency, variability, and uneven dispersion of these renewable energies present significant challenges for their storage and consumption [1]. Consequently, a pressing requirement exists for novel energy sources to facilitate energy transformation. Hydrogen energy stands out as a key new energy form for the 21st century. Currently, there are four mainstream hydrogen production technologies through water electrolysis: AWE, PEMEC, AEMEC, and SOEC. Among them, the AWE is currently the most widely used electrolyzer for hydrogen production through water electrolysis. Compared with the proton exchange membrane electrolysis cell, it occupies a larger space and has a lower working efficiency. In contrast, PEMEC uses an extremely thin proton exchange membrane to replace the diaphragm and alkaline electrolyte in the AWE and thus has a relatively high electrolysis efficiency. The SOEC is currently one of the research hotspots for electrolyzer used in hydrogen production through water electrolysis. It has the highest efficiency among the three types of electrolyzers. However, the SOEC has relatively high requirements for the operating temperature, which ranges from 600 °C to 1000 °C, and the selection conditions for the catalyst layer materials and electrode materials are extremely stringent. The AEMEC water technology is an emerging technology that has developed by combining the advantages of AWE and PEMEC in the past decade. It not only maintains a relatively low cost but also improves the electrolysis performance through multiple ways and is hailed as the “next-generation green hydrogen production technology” [2,3]. The AEMEC is a new technology for producing high-purity hydrogen from water. It can be used in an alkaline environment, allowing electrodes to adopt low-cost non-platinum/low-platinum catalysts and common metal materials. Compared with technologies such as PEMEC that require expensive noble metal catalysts, it has significantly reduced the material cost. The AEMEC combines the advantages of the low cost of AWE and the high current density as well as the dynamic response ability of PEMEC [4,5]. Realizing the industrial application of AEMEC has important strategic significance for China’s energy transformation in the future.
A few researchers have conducted studies on AEMEC. Katerina et al. [6] proposed a new type of composite catalytic material and found that the membrane electrode assembly (MEA) using the newly prepared catalyst exhibited better performance during long-term operation. Tang et al. [7] utilized a composite perovskite with a dual-phase of Ruddlesden–Popper and single perovskite as the anode in the AEMEC and found that it exhibited very promising performance. Nafchi et al. [8] studied the impacts of working temperature and cathode pressure on hydrogen concentration, current density, and temperature distribution through numerical simulation. Abdelhafiz et al. [9] reported the production of a new type of non-PGM (Platinum Group Metal) catalyst for the Oxygen Evolution Reaction (OER) in alkaline aqueous media which exhibited stable performance for 550 h without significant attenuation of industrial-level current density.
In AEMEC, the GDL is a crucial component, sandwiched between the catalyst layer and the bipolar plate. The characteristics of the GDL exert a substantial influence on the performance and durability of the electrolytic cells. Its primary function lies in effectively transporting reactants and products either to the reaction sites or away from them, in addition to facilitating the transfer of heat and electrical currents. Therefore, the selection and optimization of the porous anode GDL are essential for reducing mass transfer losses and improving the efficiency of the AEMEC under high current density.
Several scholars have undertaken thorough investigations into how the parameters of liquid/gas diffusion layers affect the efficiency of electrolyzer. Li et al. [10] proposed an optimal structure for negative electrode PTL based on 316L stainless steel felt in AEMWE. Tricker et al. [11] explained through the combination of experimental work and modeling how the body structure of PTL electrodes provides additional design dimensions to further improve the performance of electrolytic cells. Sampathkumar et al. [12] studied the potential cycling (PC) benefits of 316L stainless steel felt porous transport layers (PTLs) for anion exchange membrane water electrolysis. Ul Hassan et al. [13] found that one of the key components for achieving high AEMEC performance is the porous transport layer. Singh et al. [14] explored the recurring nature of chaos and bifurcations in Rivlin–Ericksen fluid layer proceeding through porous media. Dubey et al. [15] investigated the double diffusive convective instability of a horizontal through flow in a fluid-saturated porous layer confined between two infinitely long boundaries. Barman et al. [16] investigated the linear and nonlinear stability analyses of micropolar fluid flow in a horizontal porous layer heated from below in the presence of throughflow. Daniela et al. [17] studied the performance on the cathode side of PEMEC with various carbon paper gas diffusion layers and investigated how characteristics such as electrical conductivity, porosity, and gas permeability affect the performance. Wang et al. [18] introduced a method utilizing wet etching to fabricate a porous transport layer with a 3D structure which named the flow-enhanced liquid/gas diffusion layer. The successful fabrication and performance verification of the FELGDL have opened a new direction for the manufacturing of high-performance 3D structured porous transport layers. Jiang et al. [19] proposed an in-plane transport enhancement layer for through-thickness liquid/gas diffusion layers to create a dual-layer LGDL structure to enhance mass diffusion and the performance of PEMEC. Frida et al. [20] studied how different types of diffusion media would affect the polarization in different regions of the effective area. Zhu et al. [21] studied the impact mechanism of the structural parameters and types of porous transport layers on the electrolysis performance based on the voltage decomposition method and surface topography characterization. Li et al. [22] proposed an engineered liquid/gas diffusion layer with adjustable pore morphology, which can achieve high performance for AEMEC.
Most of the studies on GDL focus on the impact on the performance of PEMEC. There are relatively few studies on the impact of GDL on the performance of the AEMEC. And it is rather rare to study the impact of porous GDL parameters on AEMEC through simulation. In this paper, a mathematical model of AEMEC was established in MATLAB/Simulink, and the influences of porous GDL parameters, including the thickness, porosity, and pore size of the porous GDL, on the performance of the AEMEC were subjected to study and analysis. The results demonstrate that the performance of the AEMEC is improved as the thickness of the porous GDL decreases. Moreover, as the porosity and pore size of the porous GDL decrease, the performance of the AEMEC is gradually boosted. It is worth noting that the impact of the pore size on the performance of the AEMEC is relatively less compared to that of the thickness.

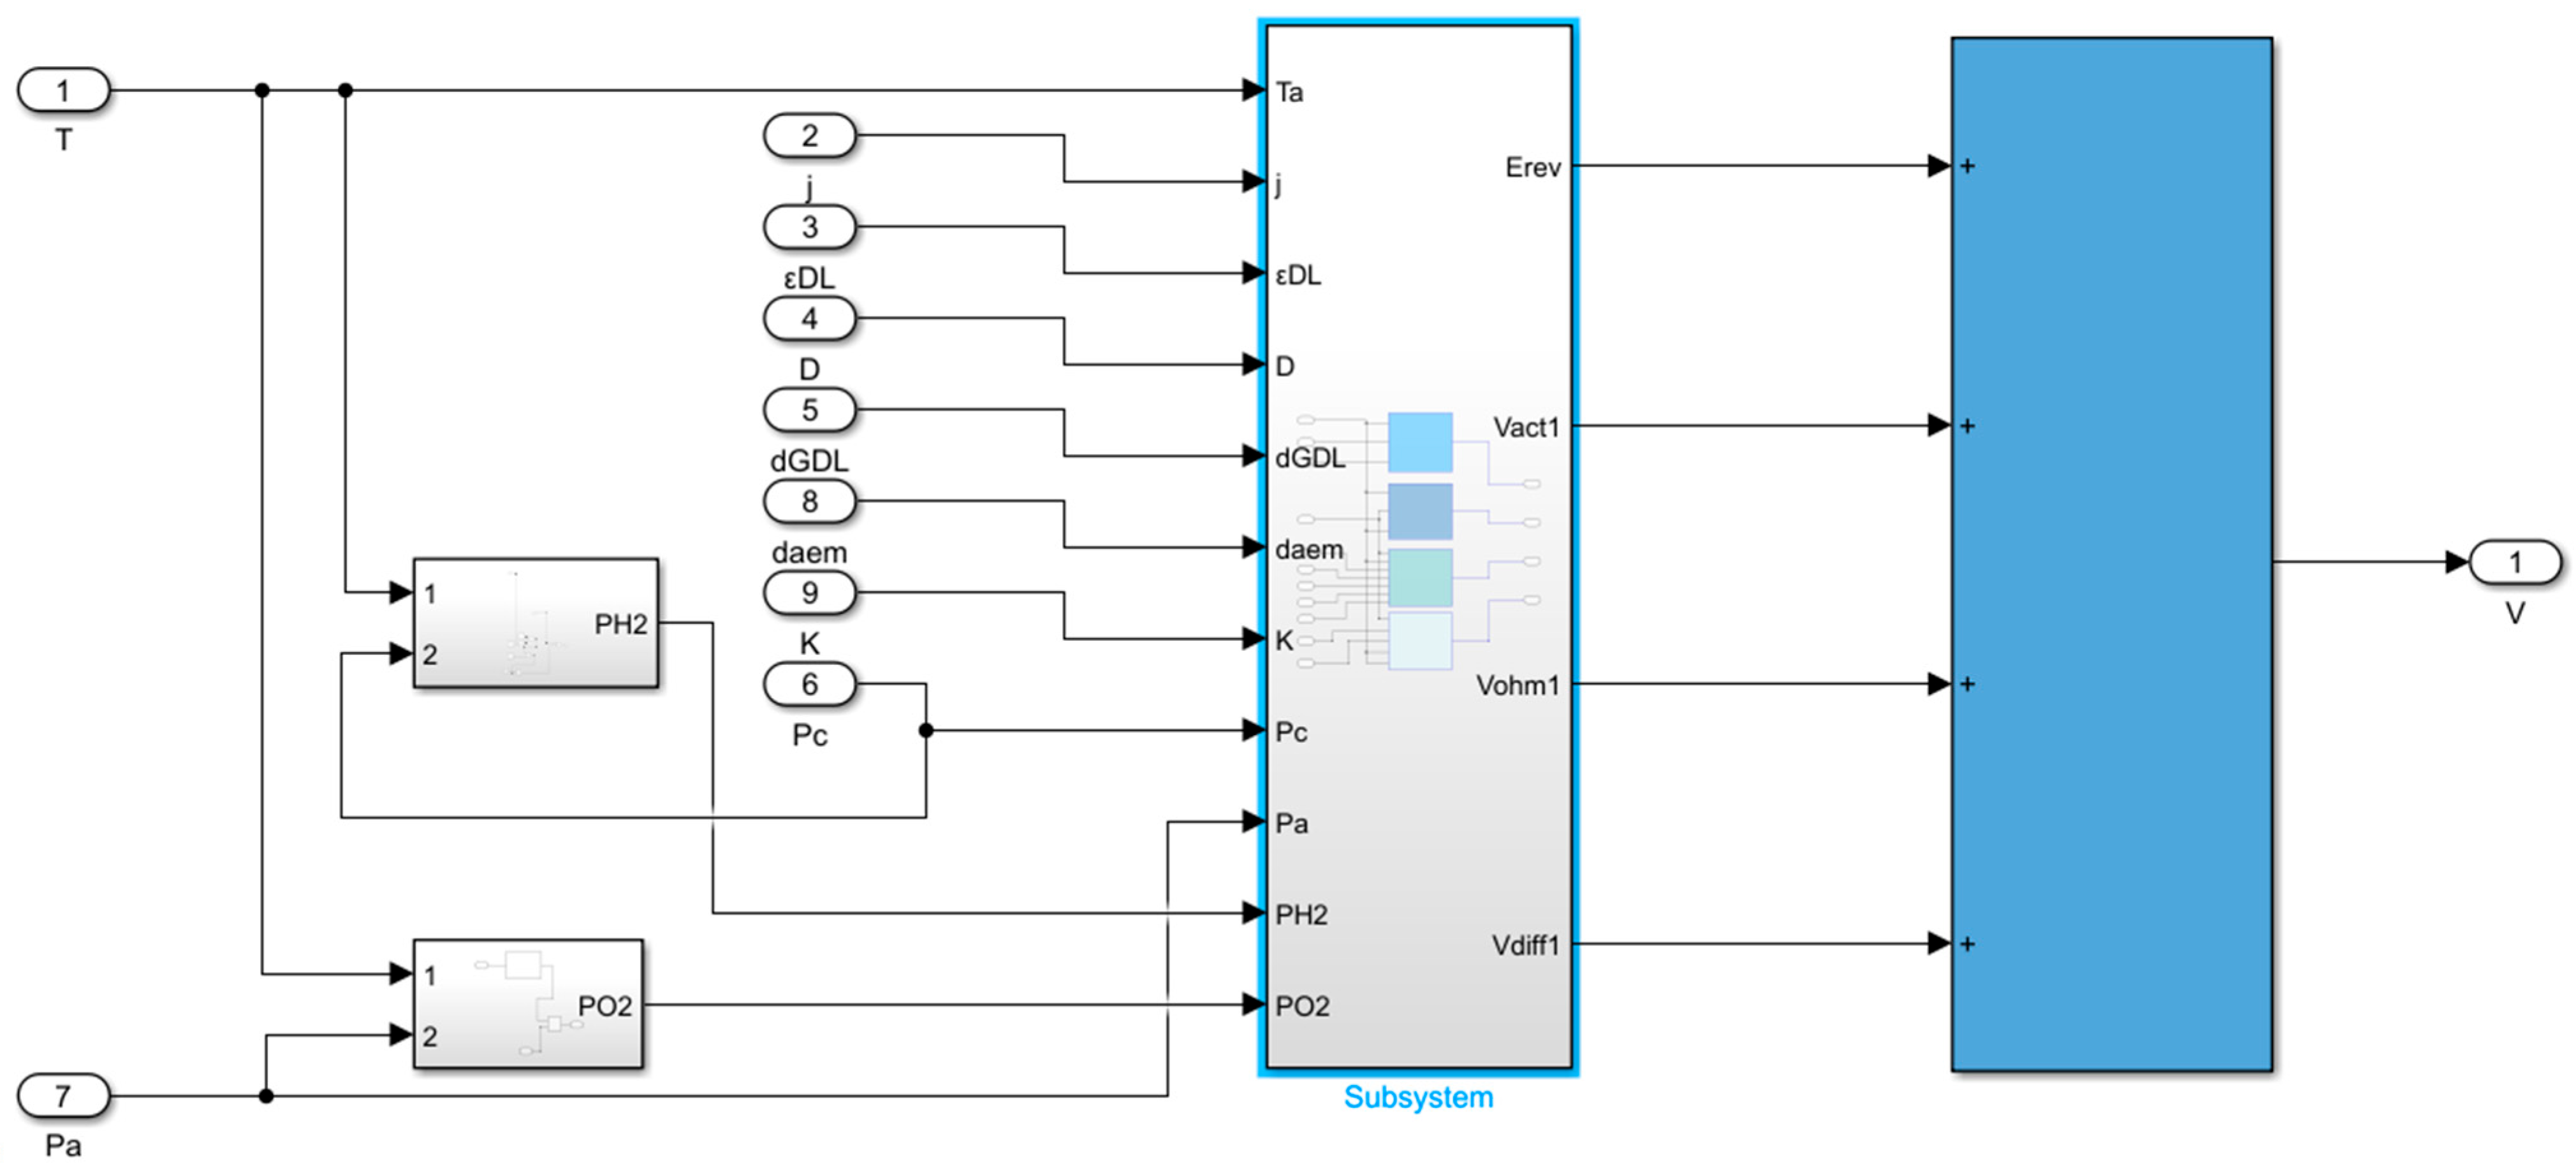
2. Mathematical Models

The Anion Exchange Membrane Electrolysis Cell is composed of “bipolar plates”, gas/liquid flow channels, gas diffusion layers, catalyst layers, and anion exchange membranes. The working mechanism of AEMEC can be described in this way: on the anode side, the hydroxide ions transfer from the cathode undergo oxidation which gives birth to water and oxygen along with the release of electrons. As a result, the produced water and oxygen are expelled via the anode flow field while the free electrons traverse the external electrical circuit to reach the cathode. On the cathode side, water is transported to the cathode catalyst layer through the cathode gas diffusion layer, and then it merges with the electrons sent from the anode, resulting in the formation of hydrogen gas and hydroxide ions. The hydrogen gas is discharged through the cathode flow field while the hydroxide ions that are produced are transferred to the anode of the electrolyzer through the AEM.
The reaction equations for the anode and cathode in AEMEC are presented as follows:
C a t h o d e :   2 H 2 O + 2 e H 2 ( g ) + 2 O H
A n o d e :   2 O H 1 2 O 2 ( g ) + H 2 O + 2 e
This article develops a model to explain the present and future traits of electrolysis. This model is built on MATLAB/Simulink, as illustrated in Figure 1.
The overall voltage relationship of AEMEC consists of the open circuit voltage, activation overpotential, ohmic overpotential, and diffusion overpotential, as detailed below [23]:
V = V r e v + V a c t + V o h m + V d i f f
Among them, Vrev represents the open circuit voltage, Vact is the activation overpotential, Vohm is the ohmic overpotential and Vdiff is the diffusion overpotential. The following section provides a detailed description of these four types of overpotentials.

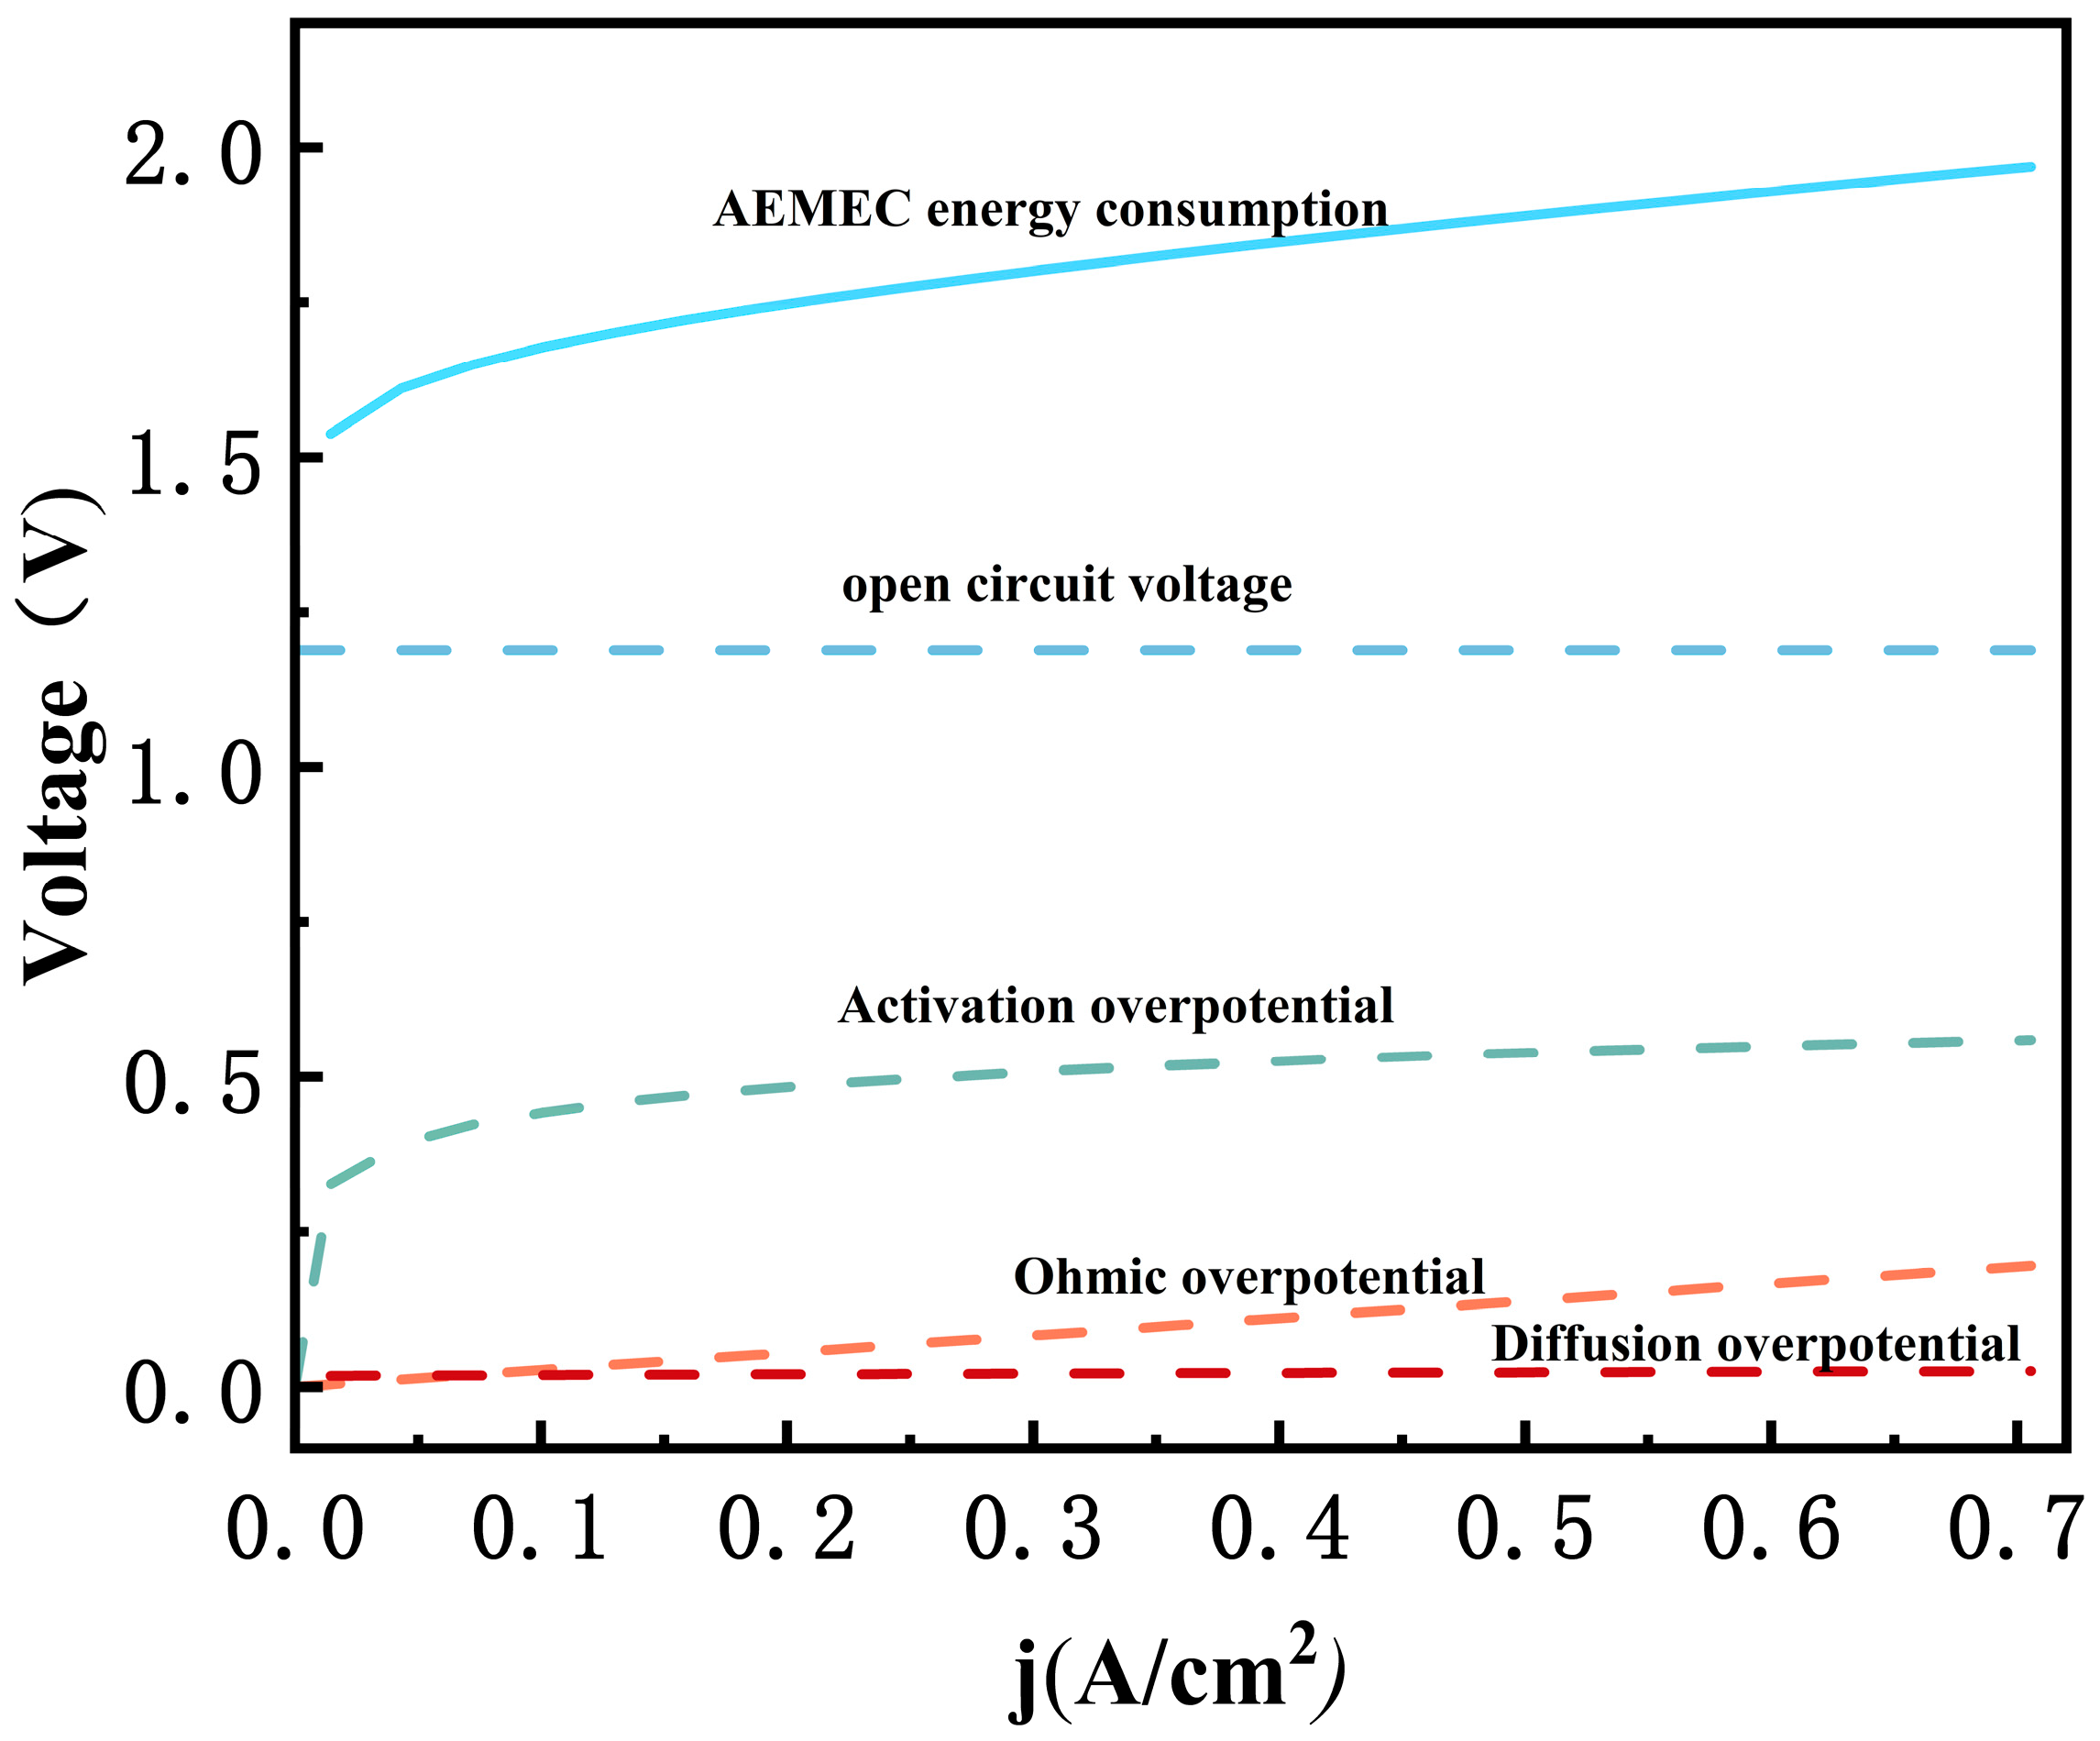
2.1. Reversible Potential

The AEM water electrolysis cell can generate hydrogen and oxygen through electrochemical reactions that convert electrical energy. The entire electrolysis process involves the decomposition of water molecules and the phase transition of hydrogen and oxygen. To achieve electrochemical reactions, a minimum voltage called reversible potential is required. The reversible potential of the electrolysis process can be calculated using the Nernst equation as follows:
V r e v = V c + R T 2 F l n P H 2 P O 2 0.5 a
where V c can be calculated by the following Equation (5).
V c = 1.229 0.9 × 10 3 ( T 298.15 )
where T is the temperature under standard conditions. Due to the liquid water being sent into the cells, the water activity a is equal to 1. PH2 and PO2 can be obtained by subtracting the saturation pressure of water vapor from the anode pressure and cathode pressure, respectively, as shown in Formulas (6) and (7).
P O 2 = P a P H 2 O , s
P H 2 = P c P H 2 O , s
The saturation pressure of water vapor is calculated by the Antoine Equation (8) [24]:
P H 2 O , s = 10 8.07131 1730.63 233.426 + T

2.2. Activation Overpotential

The Vact can characterize the electrochemical kinetic behavior on the electrode surface. The voltages of the anode and cathode can be articulated using the methodologies outlined in Equations (9) and (10) [19]. The model does not consider the temperature dependence of parameters and the heterogeneity of catalyst layers, which may introduce errors under high current or extreme temperature conditions; the model assumes that the charge transfer coefficient (αₐₙ, αcat) and exchange current density (jₐₙ, jcat) do not vary with temperature. There is a two-phase transfer behavior between GDL and catalyst layer. Therefore, this article introduces the liquid water saturation S. The expression for S will be described in the following text.
V a c t ,   a n = R T a n α a n F s i n 1 j 2 j a n = R T a n α a n F l n j / 2 j a n + 1 + j / 2 j a n S £ C 2
V a c t , c a t = R T c a t α c a t F s i n 1 j / 2 j c a t = R T c a t α c a t F l n j / 2 j c a t + 1 + j / 2 j c a t 2
where Vact,an and Vact,cat are the anode and cathode voltages, Tan and Tcat are the operating temperatures of the anode and cathode, αan and αcat are the charge transfer coefficients of the anode and cathode, jan and jact are the current densities of the anode and cathode, respectively. Sc is the liquid water saturation of the catalyst layer (CL). £ is the coverage coefficient with a median of £ in Chen et al. [24] validation. Modeling with water saturation Sc can be expressed according to the following Equation (11).
S c 4 0.2415 + 0.6676 s 0.6135 s 2 = I 2 F M H 2 O ν σ c o s θ c L ε K x + C
where SC is the liquid water saturation, σ is the surface tension, θ c L is the contact angle and ε is the porosity of the electrode. C is an integral constant determined by boundary conditions. K represents magnetic permeability with the unit of m2. ν being the kinematic viscosity of water.

2.3. Ohmic Overpotential

This model employs a simplified circuitry of AEMEC to calculate Vohm. This circuit includes the resistance from the AEM and the porous GDL, and the interface contact resistance between the AEM and the porous GDL. The ohmic resistance of AEM can be computed as follows [25]:
V A E M = d A E M σ A E M j
where dAEM is the thickness of the membrane and σAEM is the conductivity of the membrane.
The thickness dAEM belongs to the structural parameter of the membrane which generally does not change with the change in the working environment of the electrolyzer, but membrane conductivity will change with the change in temperature, and the calculation method chosen here is the empirical formula of Springer [26]:
σ A E M = 0.005139 λ 0.00326 e x p 1268 1 / 303 1 / T
where λ is a parameter describing the degree of wetness (hydration) of the membrane.
The ohmic resistance of porous GDL can be computed as Equation (14) [27]:
V G D L = d G D L σ G D L j
The effective conductivity of porous GDL can be stated as Equation (15):
σ G D L = σ 1 ε G D L 1.5
where σ is the conductivity and εGDL is the porosity of the porous GDL.
The catalyst layer exhibits a high electrical resistance, impeding the flow of electrons through it. Consequently, an electrochemical reaction takes place at the junction between the catalyst layer and the porous GDL. This occurrence is referred to as the interface contact resistance at the porous GDL and the catalyst layer. The efficiency of AEMEC is contingent upon the number of reactive sites which is presumed to be directly correlated with porosity, as illustrated in the equation provided below [28]:
R = K d 0 ε 0
where K is the interface contact resistance coefficient, d0 and ε0 are the relative pore size and porosity, and d0 and ε0 are dimensionless coefficients. The objective is to remove the units associated with pore size and porosity. Subsequently, the calculation formulas for d0 and ε0 are as follows:
ε 0 = ε 0.1
d 0 = D 1000

2.4. Diffusion Overpotential

The Vdiff is the additional voltage applied throughout the procedure of an electrolyzer when the concentration of a substance near the electrode is not equal to the concentration of the main phase due to diffusion limitations. Overall, the diffusion overpotential has a small effect on the electrolyzer and the methods for its precise calculation are more limited. For OH ions, their transport is mainly based on electromigration, and concentration polarization can be ignored in high concentration electrolytes. Currently, a calculation method combining a variant of the Nernst equation with some empirical formulas is more commonly used, which is calculated as follows [29]:
V d i f f , a n = R T a n 4 F l n ( C O 2 , A E M / C O 2 , A E M , 0 )
V d i f f , a c t = R T a n 2 F l n ( C H 2 , A E M / C H 2 , A E M , 0 )
where F denotes Faraday constant, C O 2 , A E M , C H 2 , A E M refers to the concentration of oxygen and hydrogen at the reaction interface, respectively. The subscript “0” denotes the concentration of the substance in the reference state. The core of the formula lies in the acquisition of the concentration of the gas on the membrane, according to Fick law:
C O 2 , A E M = p a n O 2 / ( n O 2 + n H 2 O , a ) R T + δ a n O 2 D e f f , a n
C H 2 , A E M = p c n H 2 / ( n H 2 + n H 2 O , c ) R T + δ c n H 2 D e f f , c a t
where pa is the anode working pressure, n denotes the substance flux, δ denotes the anode electrode thickness, and Diff denotes the diffusion coefficient at the electrode. For the substance fluxes of oxygen and hydrogen, they can be calculated rooted in the transfer of charge conservation of the electrode reaction [30]:
n O 2 = j 4 F
n H 2 = j 2 F

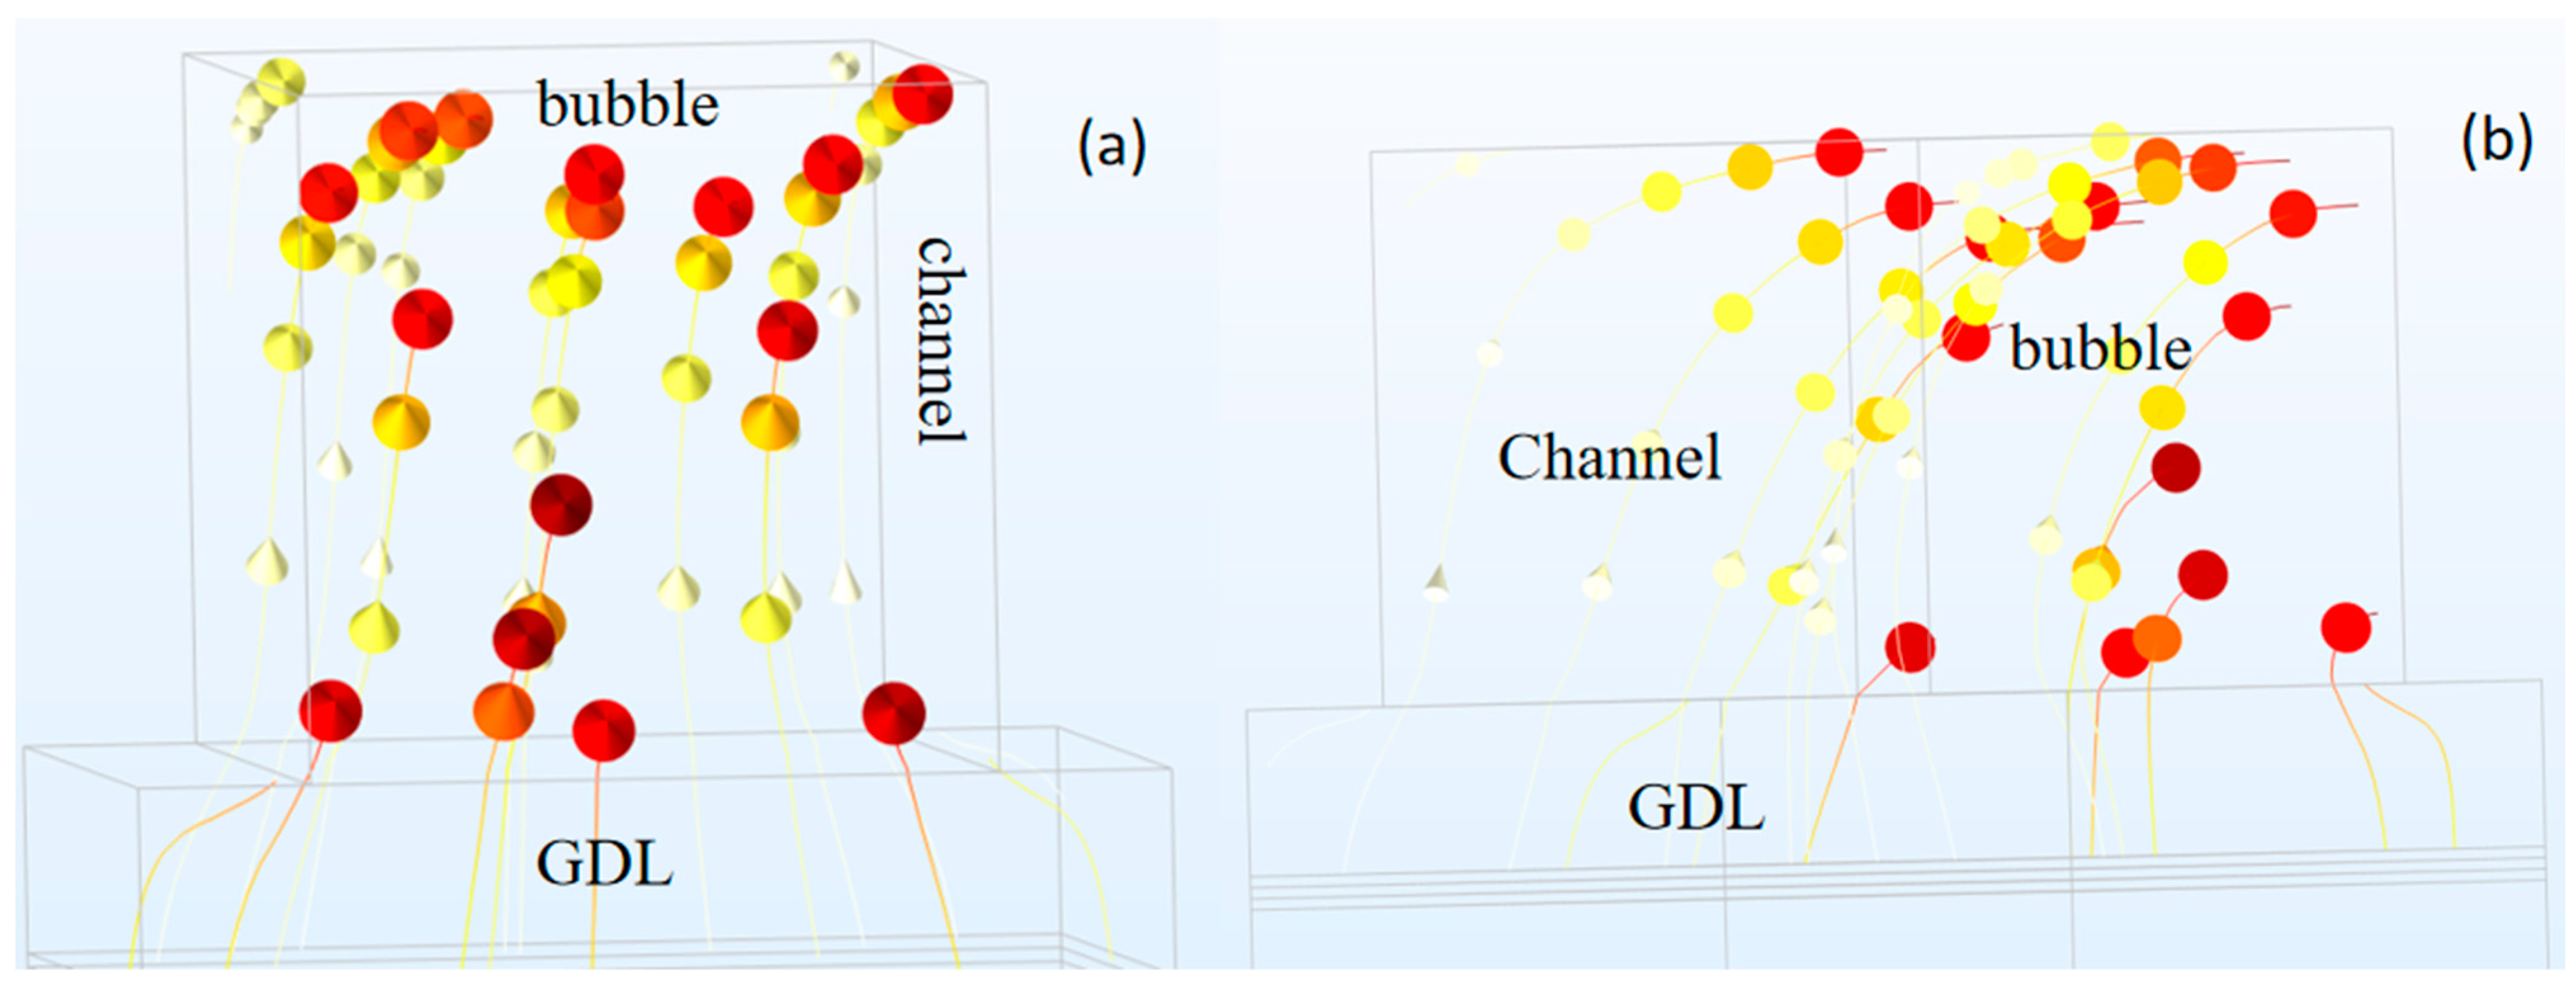
2.5. Interface Model Between Flow Channel and GDL

Figure 2a,b, respectively, show schematic diagrams of the anode side. At the interface between the anode GDL and the flow channel, it can be observed that bubbles form and adhere to the surface of the GDL, similar to the dynamics of liquid water droplets on the GDL surface in PEM fuel cells. The liquid water saturation on the anode GDL surface is given by Equation (25). In this study, bubbles were not considered at the interface between the flow channel and GDL.
The below equation can be established at the GDL/Channel interface, relating the surface liquid fraction to the current density [31]:
s G D L / C h = I C + C 0
C and C0 are constants. In this study, we considered C0 = 1 which means that when no oxygen is produced, liquid water completely occupies the surface of GDL. Table 1 lists the values of different s G D L / C h at their corresponding current densities.
Mass convection transport at the interface between the flow channel and porous GDL in the absence of bubbles on the surface of porous GDL Equation (26):
S O 2 = h m a s s C O 2 C O 2 , b u l k f l o w

3. Results and Discussion

3.1. Model Validation

Based on the above analysis, we have established a model. By comparing different simulation results with corresponding experimental data at temperatures of 353.15 K, 333.15 K, and 323.15 K, the accuracy and reliability of AEMEC were verified. The specific modeling data can be found in reference [30]. The fitting results are shown in Figure 3, and the simulation results are in good agreement with the experimental data, with a maximum error of less than 5%. The specific modeling parameters of AEMEC are shown in Table 2.

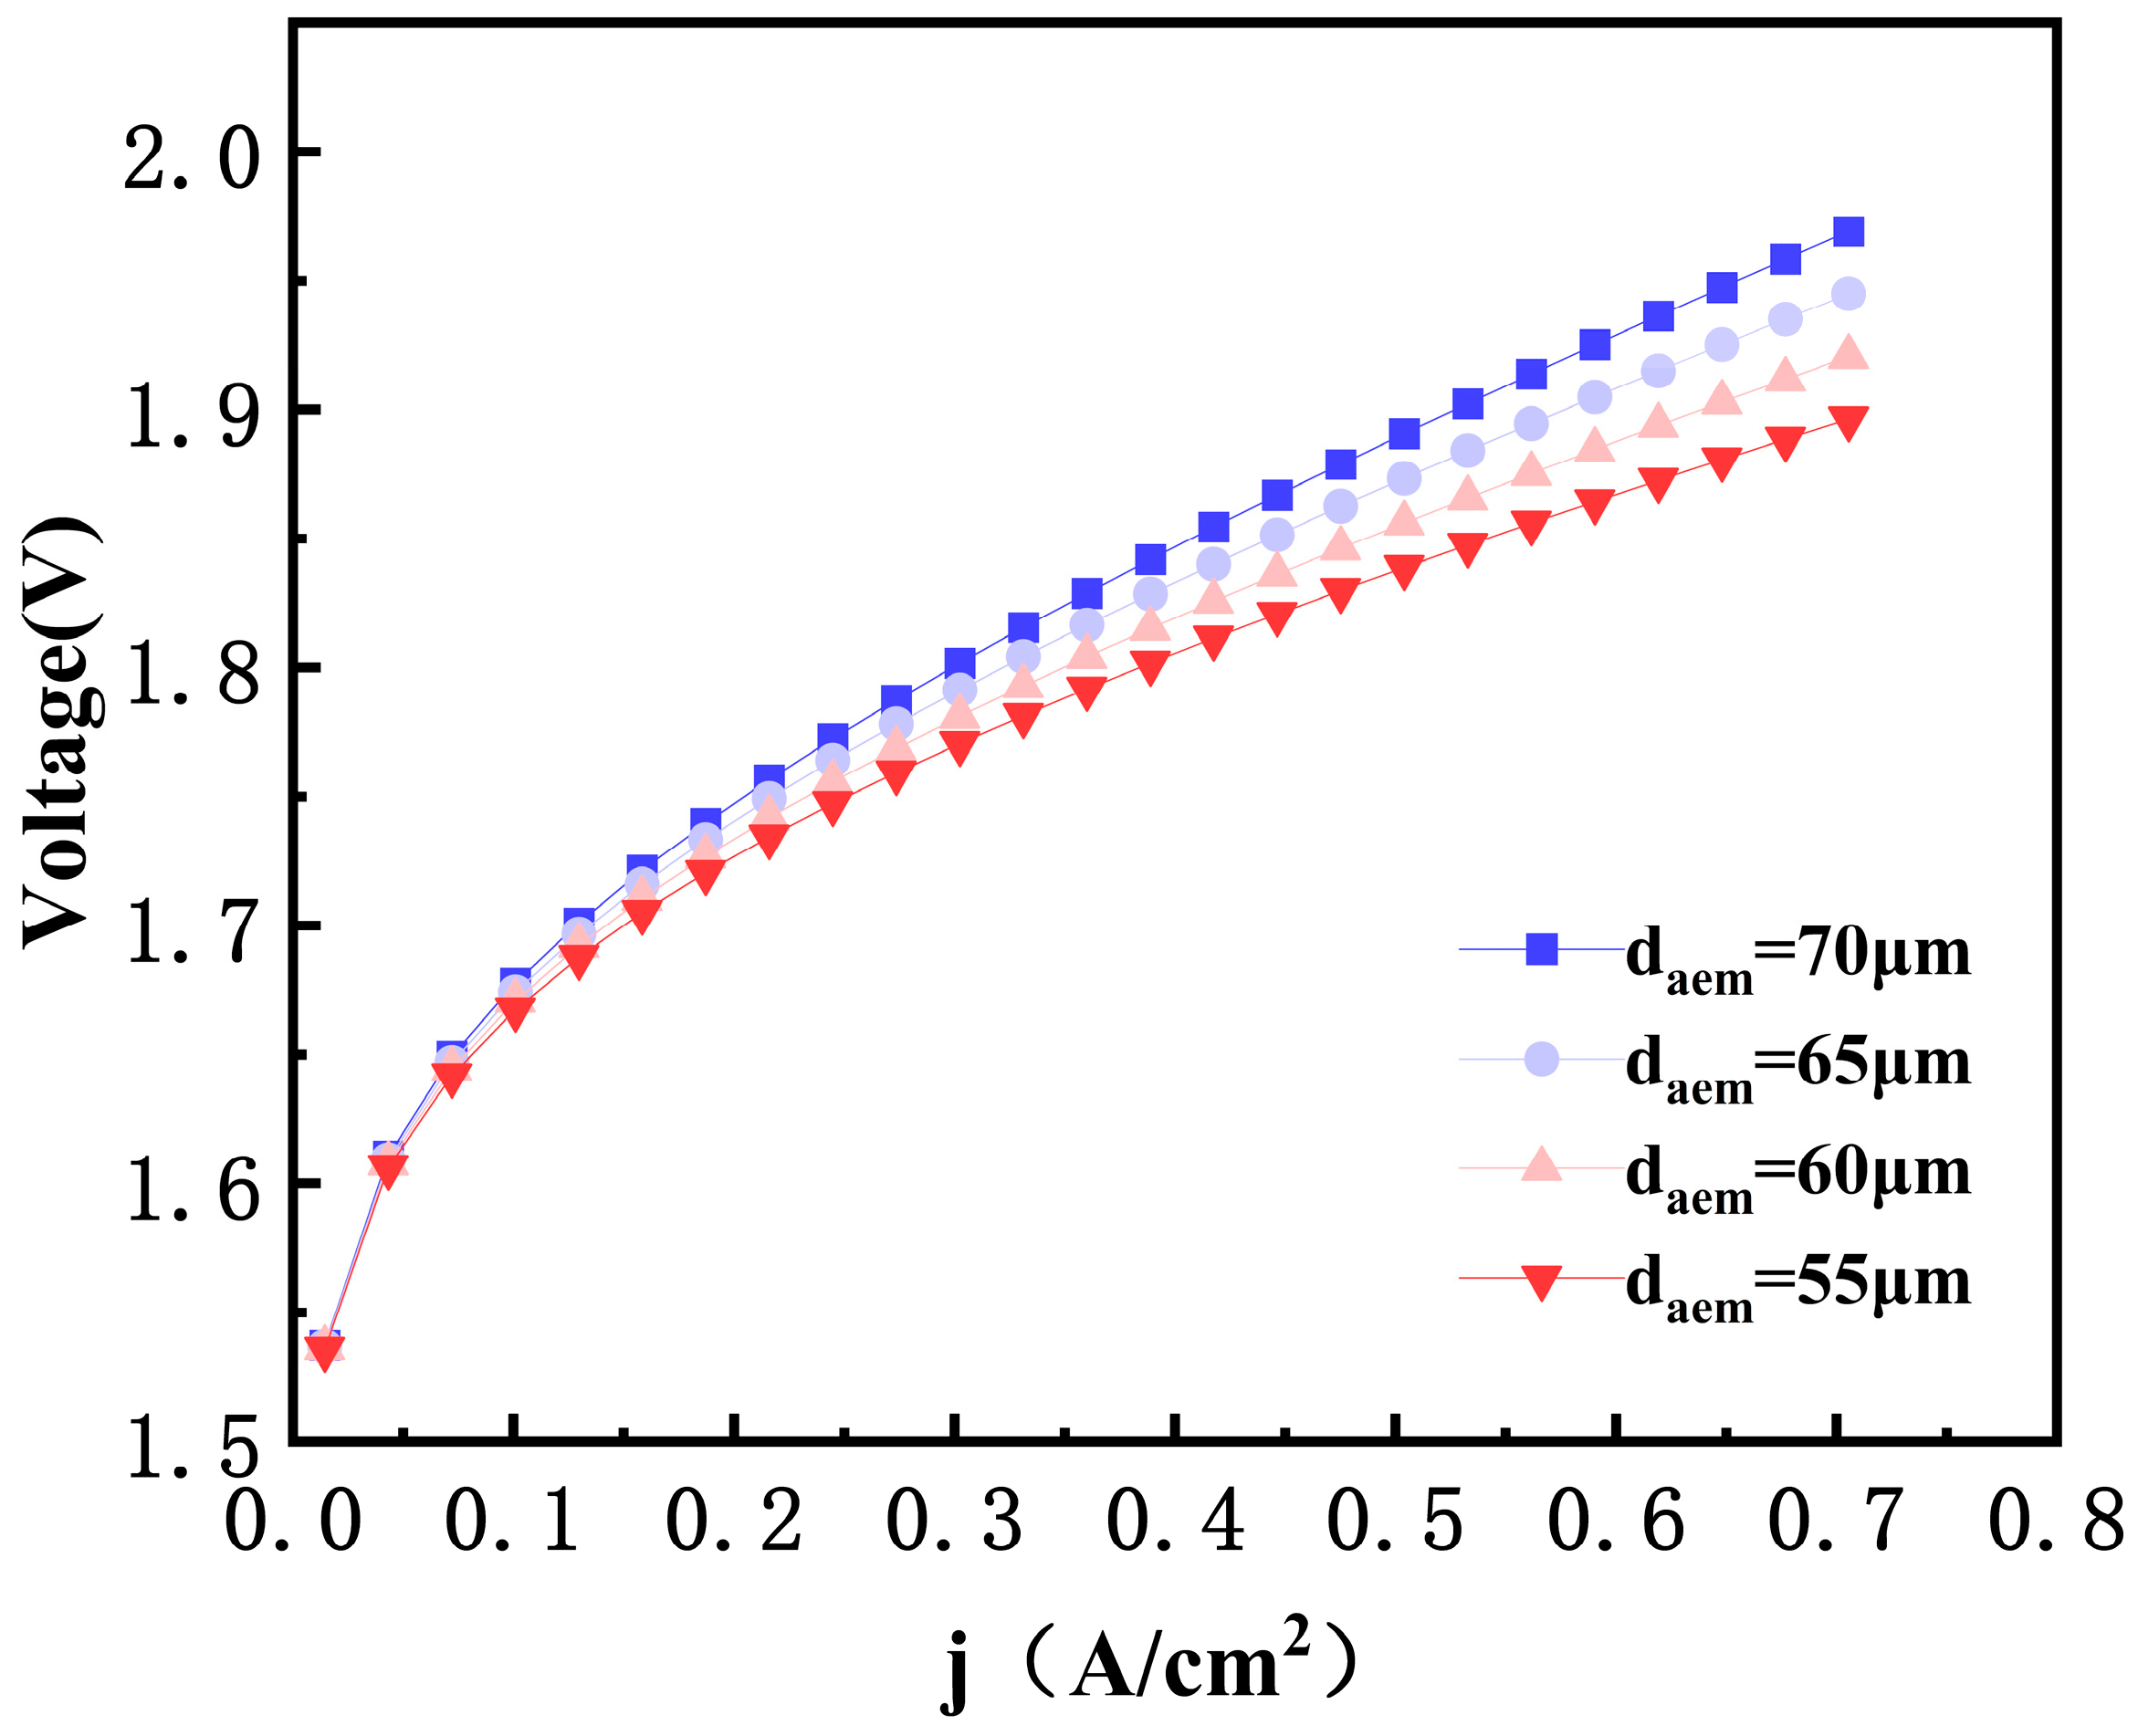
3.2. Effects of AEM Thickness

Figure 4 shows the energy consumption changes in the anion exchange membrane electrolysis cell when the thickness of the anion exchange membrane decreased from 70 microns to 65 microns, 60 microns, 55 microns, and 50 microns, respectively. A decrease in membrane thickness will shorten the transport path of anions (such as OH), reduce ion migration resistance, thereby increasing ion conductivity and reducing Ohmic polarization loss. This helps to improve the voltage efficiency of the electrolytic cell, especially at high current densities. An increase the thickness will significantly increase the film resistance, resulting in higher ohmic losses (decreased voltage efficiency). For example, reducing the membrane thickness from 70 microns to 65 microns results in a decrease of 24 mV in the electrolytic cell voltage. And the film can promote the uniform distribution of water.

3.3. Effects of the Temperature

Figure 5 and Figure 6 show the energy consumption and proportion of four different potentials generated at a temperature of 343.15 K. From the graph, the current density gradually increases from around 1.5 V when approaching 0 to around 2.0 V when approaching 0.7 A/cm2. This indicates that as the current density increases, the overall energy consumption of AEMEC continues to increase, as an increase in current density means an accelerated electrochemical reaction rate in the electrolytic cell, requiring more energy to sustain the reaction. The open circuit voltage curve is basically a horizontal straight line, with values ranging from 1.2 V to 1.3 V. At a given temperature (343.15 K), the open circuit voltage does not significantly change with changes in current density. It mainly depends on the inherent properties of the electrode material, electrolyte, and other systems, and is a relatively stable value. At low current densities (close to 0), the activation overpotential curve rises rapidly, rapidly increasing from near 0 V to about 0.4 V at around 0.1 A/cm2. Then, as the current density further increases, the upward trend slows down, reaching about 0.6 V at 0.7 A/cm2. This reflects that the activation overpotential has a significant limiting effect on the reaction rate in the initial stage of the reaction (low current density). As the reaction progresses (increasing current density), the reaction gradually adapts and the increase in activation overpotential decreases. The ohmic overpotential curve shows a slow upward trend, gradually rising from near 0 V at current density 0 to about 0.2 V at 0.7 A/cm2. The diffusion overpotential curve also rises slowly and remains at a low level throughout the entire range of current density changes, rising from nearly 0 V to about 0.1 V at 0.7 A/cm2. Although the diffusion process also generates overpotential energy consumption, its impact is relatively small in this system.

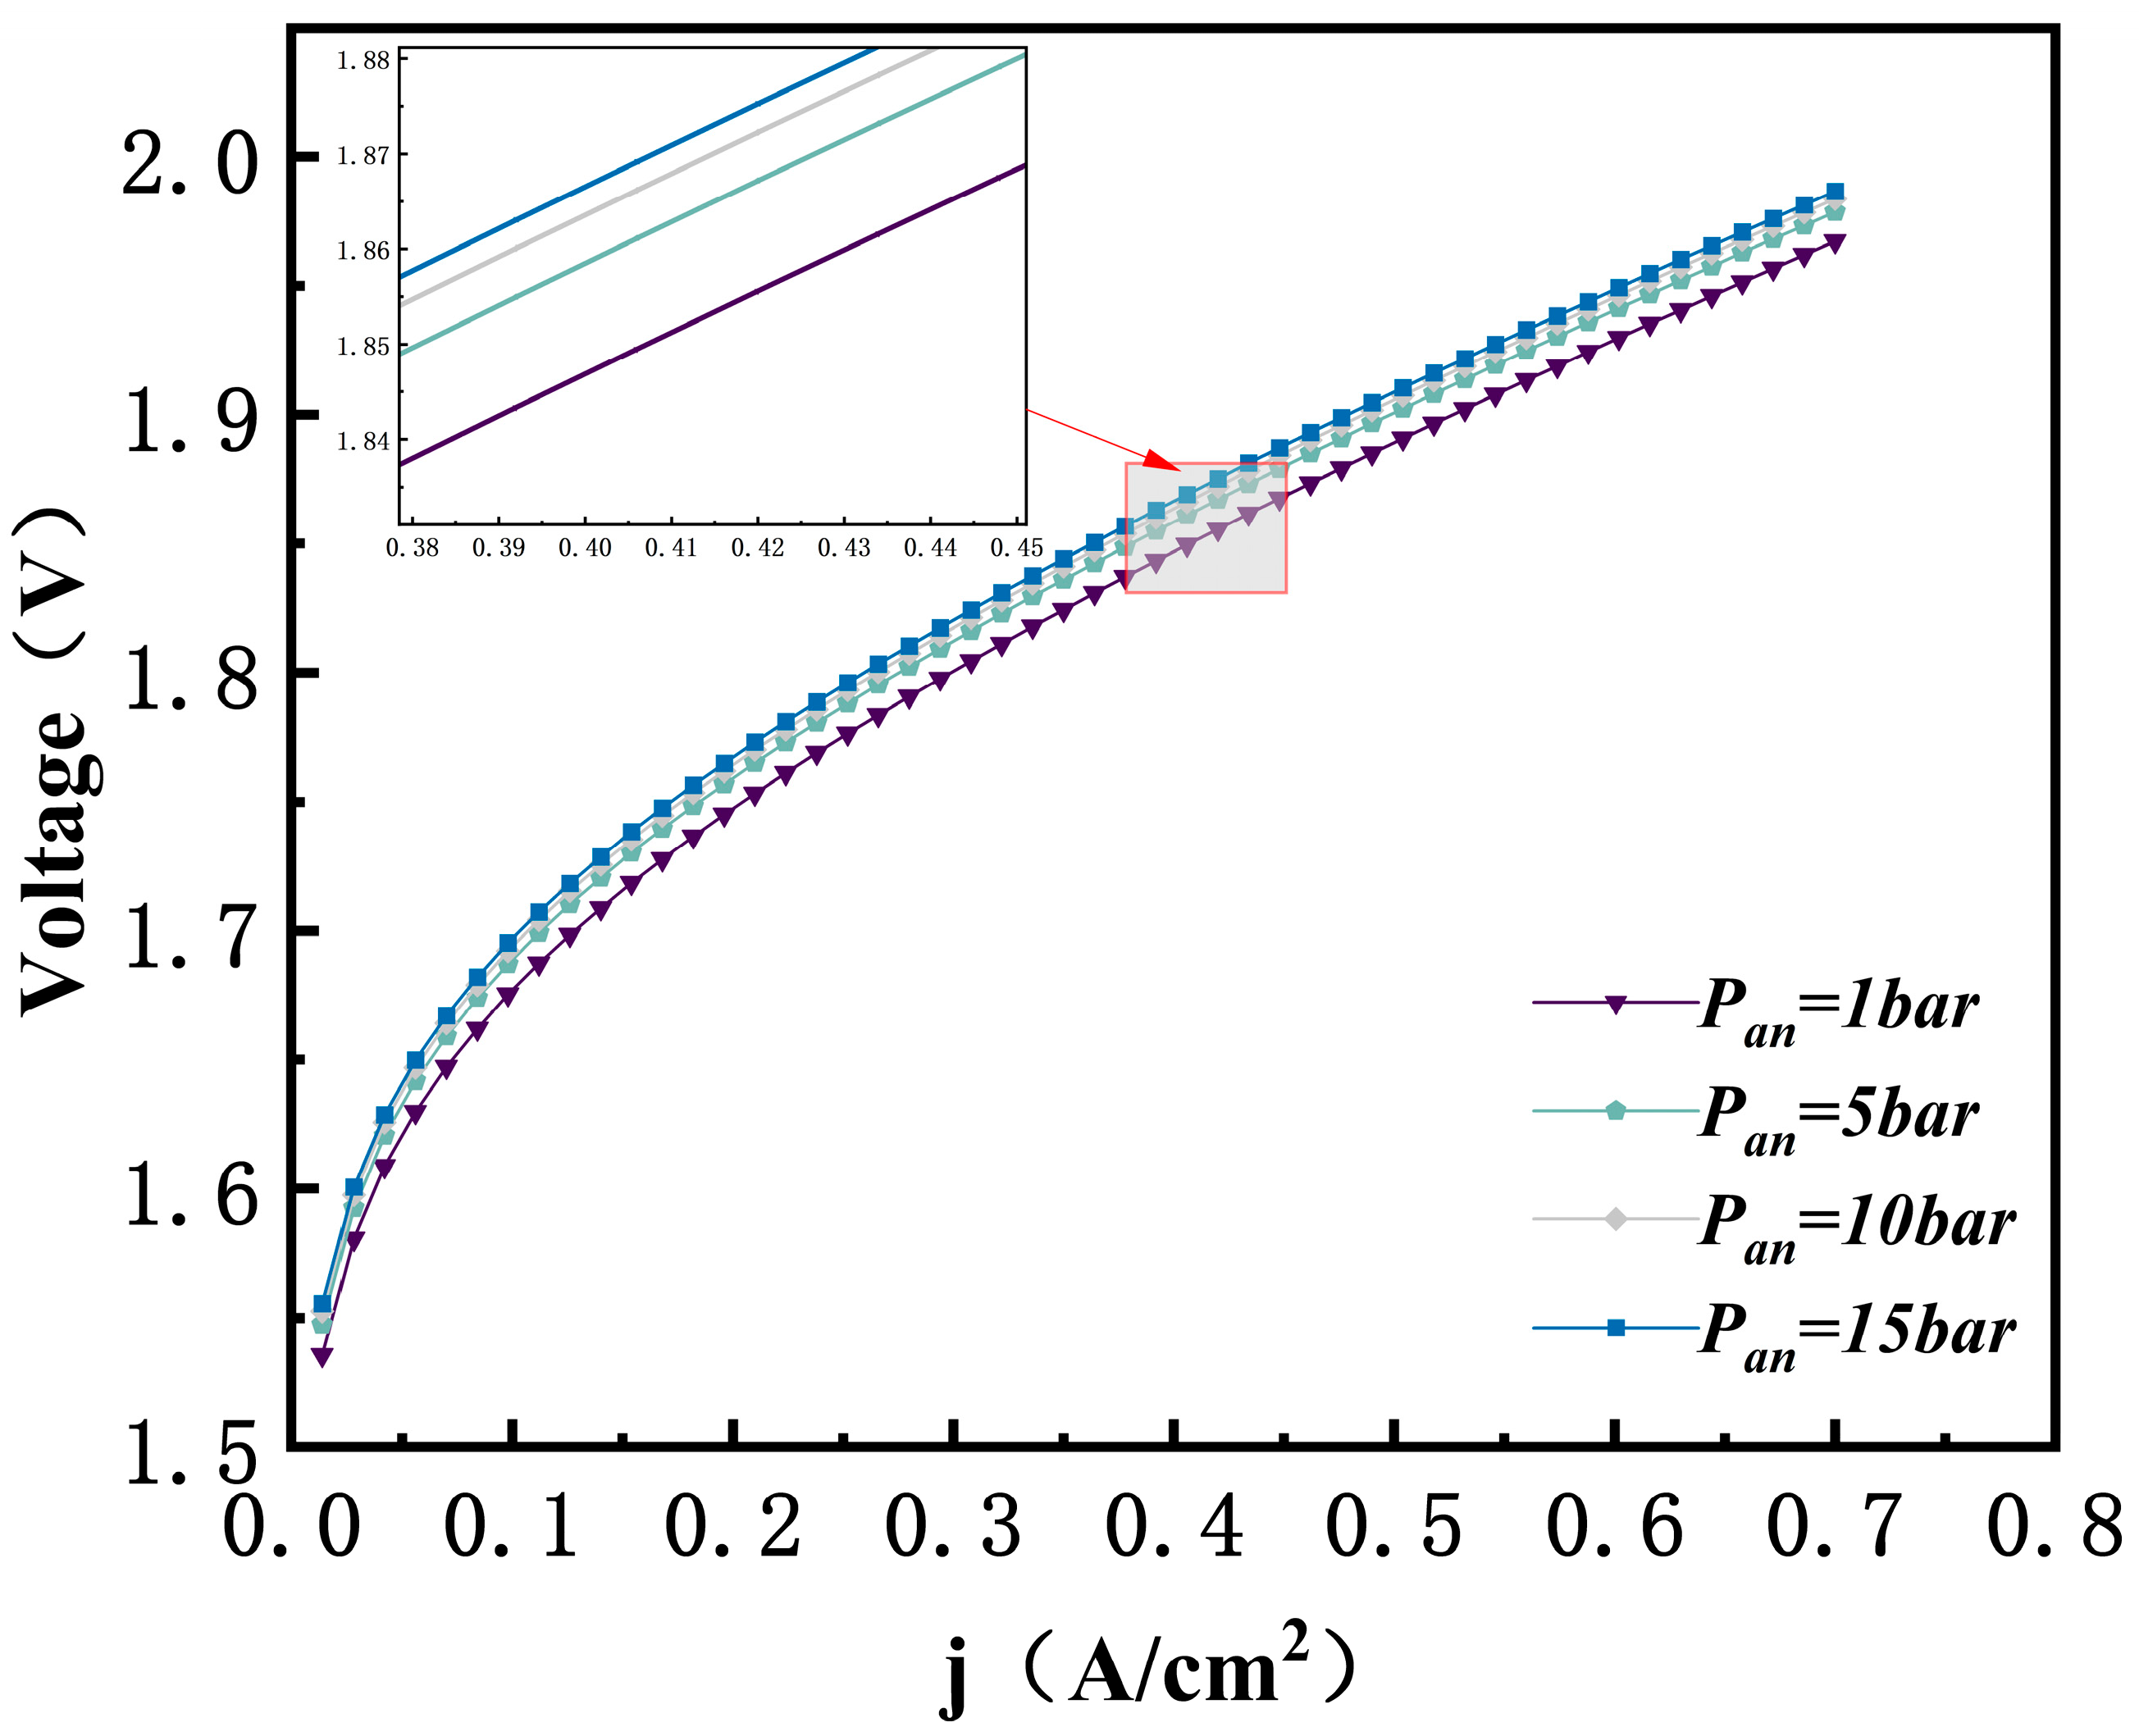
3.4. Effect of Anode Pressure

Pressure is a key element influencing the performance of AEMEC. An increase in pressure will affect the solubility and emission rate of gaseous products. Under relatively high pressure, the solubility of gasses in the electrolyte will increase which will impact the collection and separation of gasses. Moreover, due to limitations in mechanical and material properties, the maximum pressure can reach is 30 bar [23]. Figure 7 displays the impact of pressure on the performance of AEMEC. While keeping the cathode pressure constant, the polarization curves of the AEMEC performance were studied when the anode pressure was 1 bar, 5 bar, 10 bar, and 15 bar. At a current density of 0.7 A/cm2, the voltage increased by 19.44 mV when the anode pressure increased from 1 bar to 15 bar. According to Equation (19), the oxygen concentration on the reaction interface increases with the increase in anode pressure. In turn, this leads to an increase in the diffusion overpotential. Consequently, as the anode pressure gradually increases, the performance of the AEMEC decreases accordingly.

3.5. Effect of Porous GDL Thickness

In addition to the temperature and pressure, an additional key factor influencing the efficiency of AEMEC is the thickness of the porous GDL. Thicker, porous GDL typically costs more and increases mass transfer resistance. Thinner, porous GDL allows for more rapid gas transfer and improved electrolysis efficiency while also reducing cost and overall anion exchange membrane electrolysis cell size. In this paper, the AEMEC voltage polarization curves were investigated for porous GDL thicknesses of 0.5 mm, 1 mm, 1.5 mm, and 2 mm. Figure 8 illustrates the voltage polarization curves of AEMEC with four different GDL thicknesses under the same temperature. It can be observed from the figure that as the thickness of GDL increases from 0.5 mm to 2 mm. The performance of AEMEC experiences a gradual decline. When the porous Gas Diffusion Layer is on the thinner side, the gas transmission path becomes shorter and the diffusion speed of substances turns out to be relatively quicker. This is beneficial for the reaction gasses to swiftly reach the electrode surface and engage in the reaction, thereby facilitating an improvement in the electrolysis reaction rate and further promoting the enhancement of the electrolysis efficiency. On the other hand, in line with Equation (14), an increase in the thickness of the porous GDL will give rise to a higher resistance within the electrolyzer which in turn will lead to a higher ohmic overpotential.
Figure 9 presents the variation pattern of the voltage polarization curves of AEMEC with temperature under different thicknesses of GDL when the current density is 5 A/cm2. It can be observed from the figure that under the same thickness of the porous GDL. As the temperature increases from 20 °C to 100 °C, the voltage of the AEMEC gradually decreases with the rising temperature which optimizes the performance of the AEMEC. This is consistent with what has been described in Section 3.2 of this paper. When the working temperature is 80 °C, a reduction in the thickness of the porous GDL will lead to the optimization of the performance of the AEMEC. When the thicknesses of the porous GDL are 2 mm, 1.5 mm, 1 mm, and 0.5 mm, respectively, the voltages of the AEMEC decrease to 2.068 V, 2.019 V, 1.97 V, and 1.9197 V, respectively. Therefore, it can be concluded that a higher temperature and a thinner porous GDL can optimize the performance of the AEMEC.

3.6. Effect of Porous GDL Porosity

The porosity directly dictates the gas transmission capacity, water management performance, and current distribution of the porous GDL. It exerts a notable influence on the electrochemical performance and stability of the electrolyzer. The porosity level of the porous GDL not only does it impact the mass transfer capacity, but it also leads to ohmic resistance losses. This research has delved into the consequences of changes in the porosity of the porous GDL. from 0.35 to 0.80 on the performance of AEMEC. Figure 10 illustrates the influence of different porosities of the porous GDL on the performance of AEMEC under fixed temperature and pressure. As can be observed from the diagram, the performance of AEMEC gradually decreases as the porosity increases. According to Equation (15), the electrical conductivity of the porous GDL will decrease remarkably as the porosity increases. As the porosity increases, the resistance of the porous GDL will grow, thereby giving rise to a greater amount of ohmic overpotential. When the current density remains fixed, the voltage of AEMEC will increase to a certain extent with the increase in porosity. As depicted in Figure 11. The voltage difference caused by the porosities of the porous Gas Diffusion Layer (GDL) being 0.2 and 0.7 is approximately 57.7 mV when the current density is 0.7 A/cm2. When the porosity of the porous GDL is 0.2, the voltage of the membrane electrode can reach a minimum value of 114.8 mV. Under the same temperature and pressure, as the porosity increases from 0.2, 0.3, 0.4, 0.5, 0.6, 0.7 to 0.8, the voltage of the membrane electrode gradually increases to 114.8 mV, 118.3 mV, 123.6 mV, 132 mV, 145.9 mV, and 172.5 mV, respectively. Consequently, a decreased porosity of the porous GDL can help cut down on energy usage of the AEMEC.

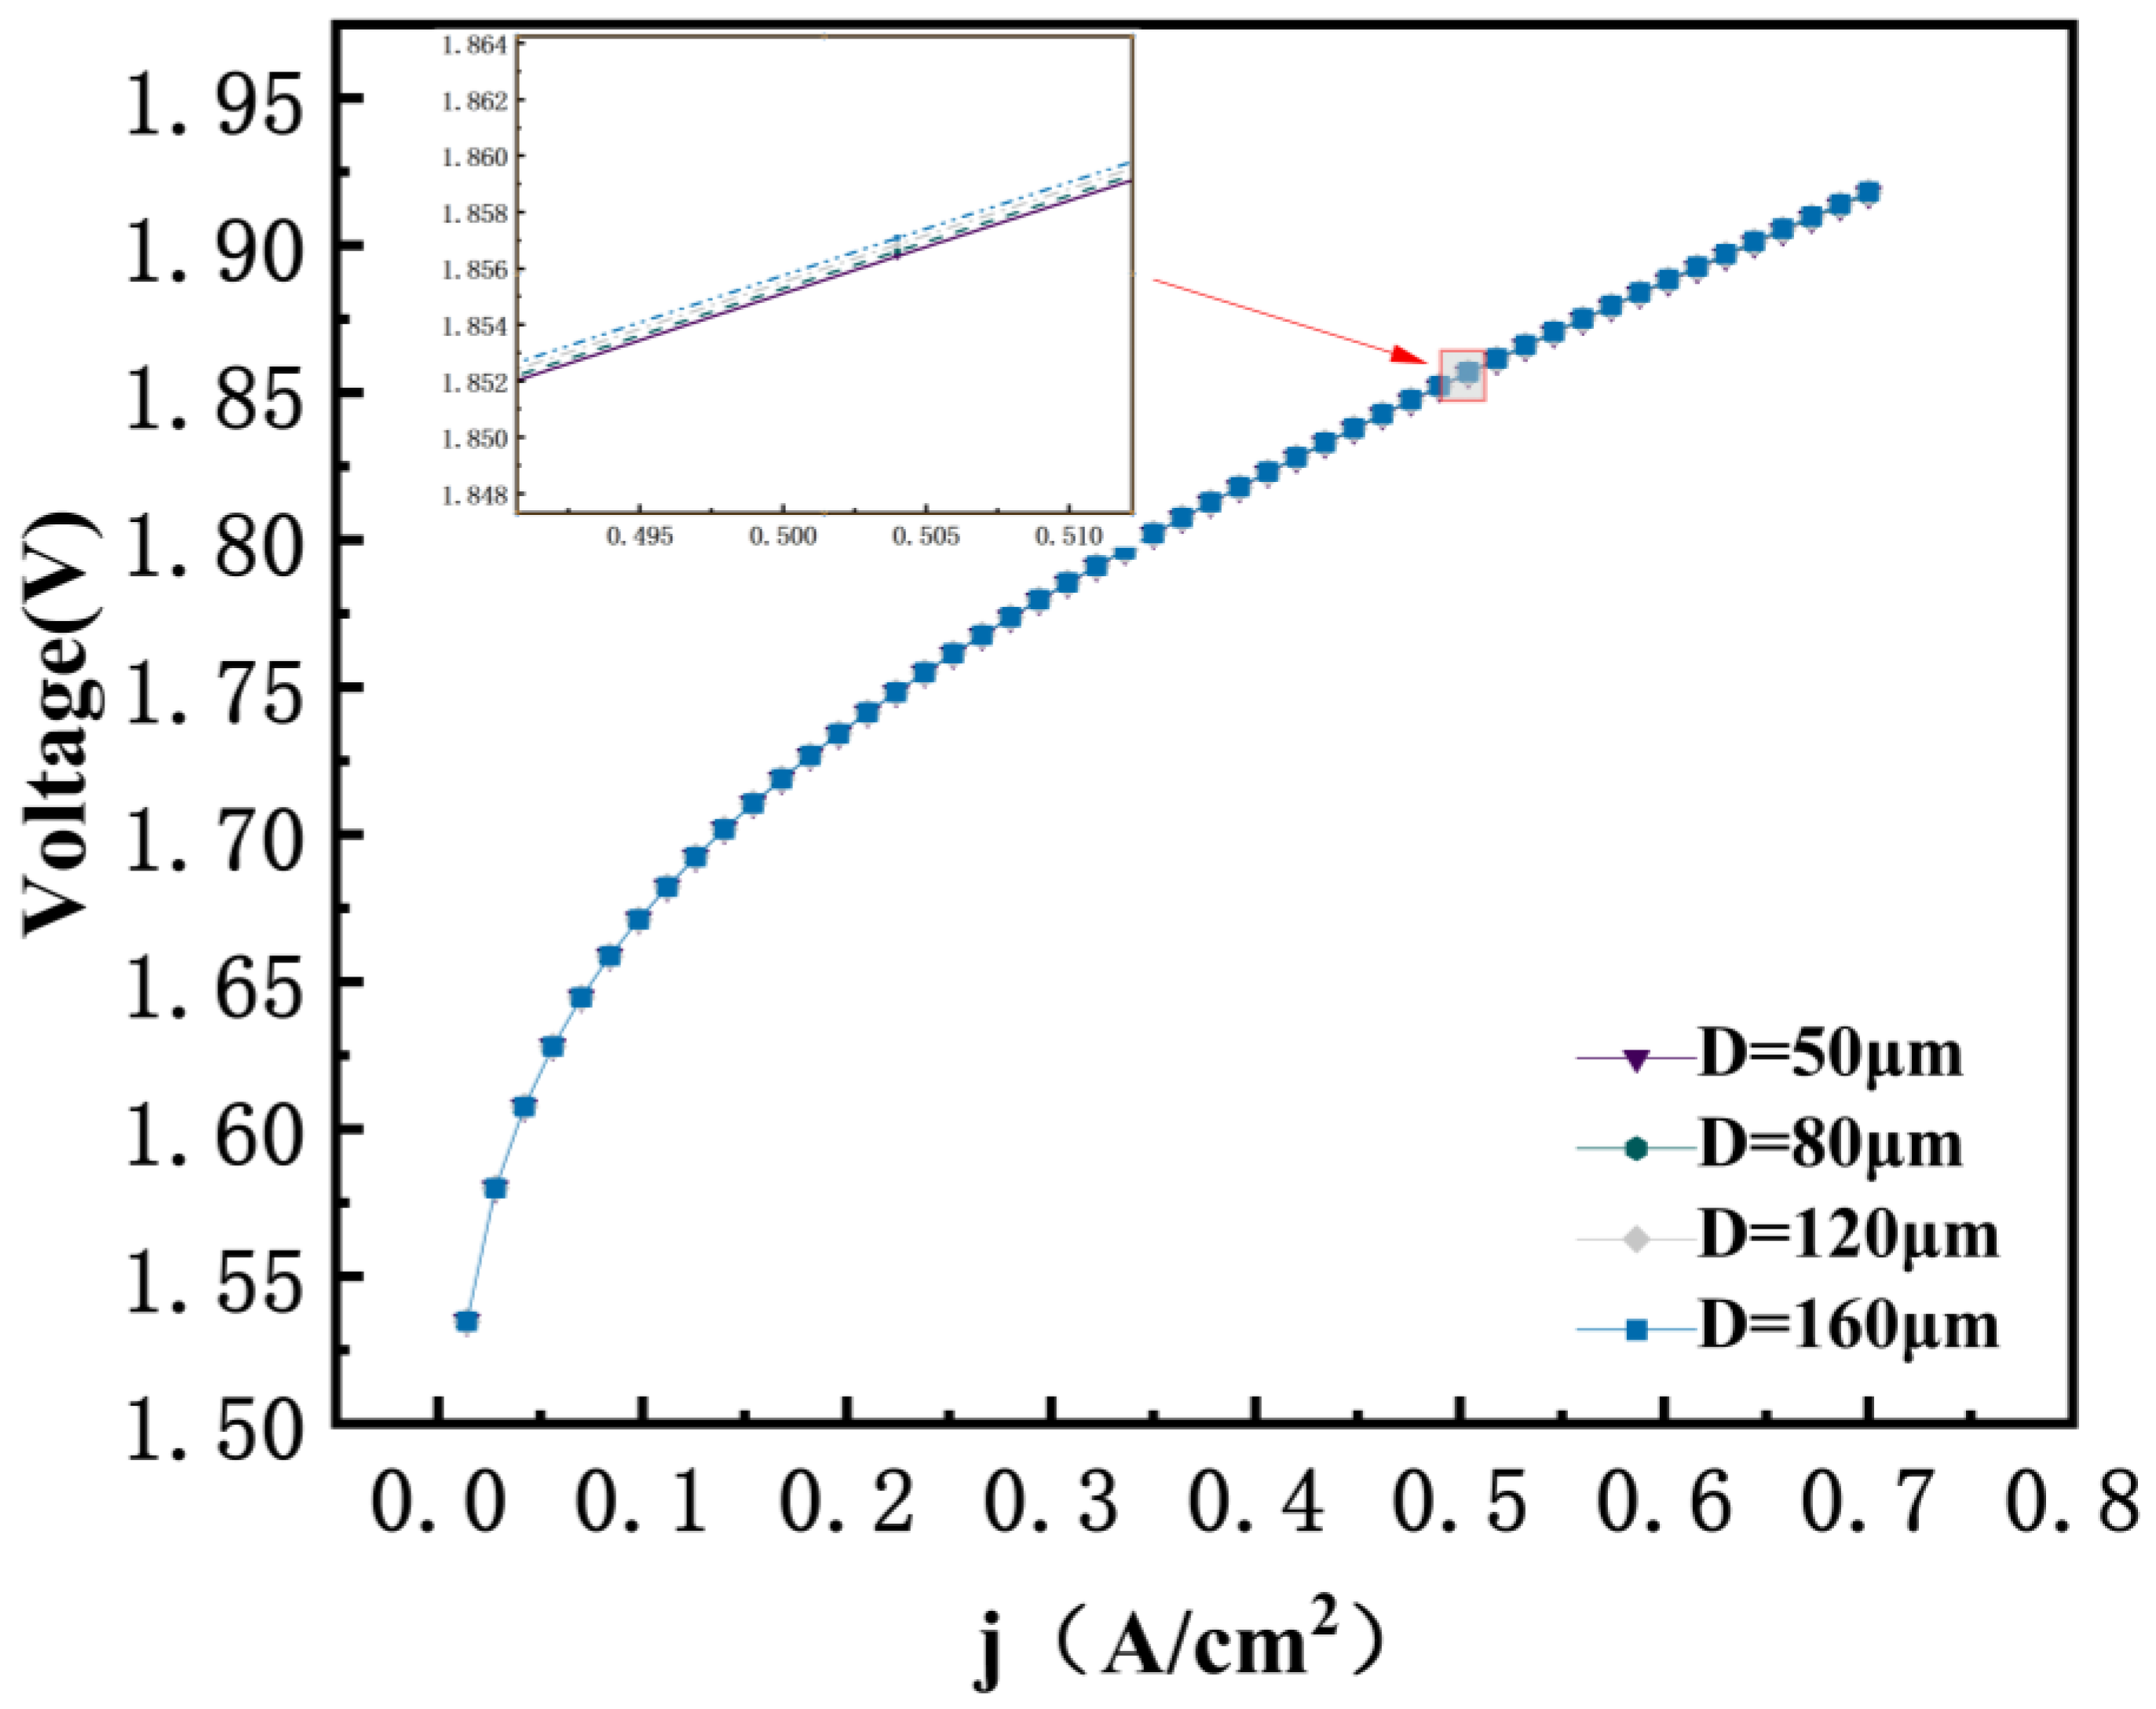
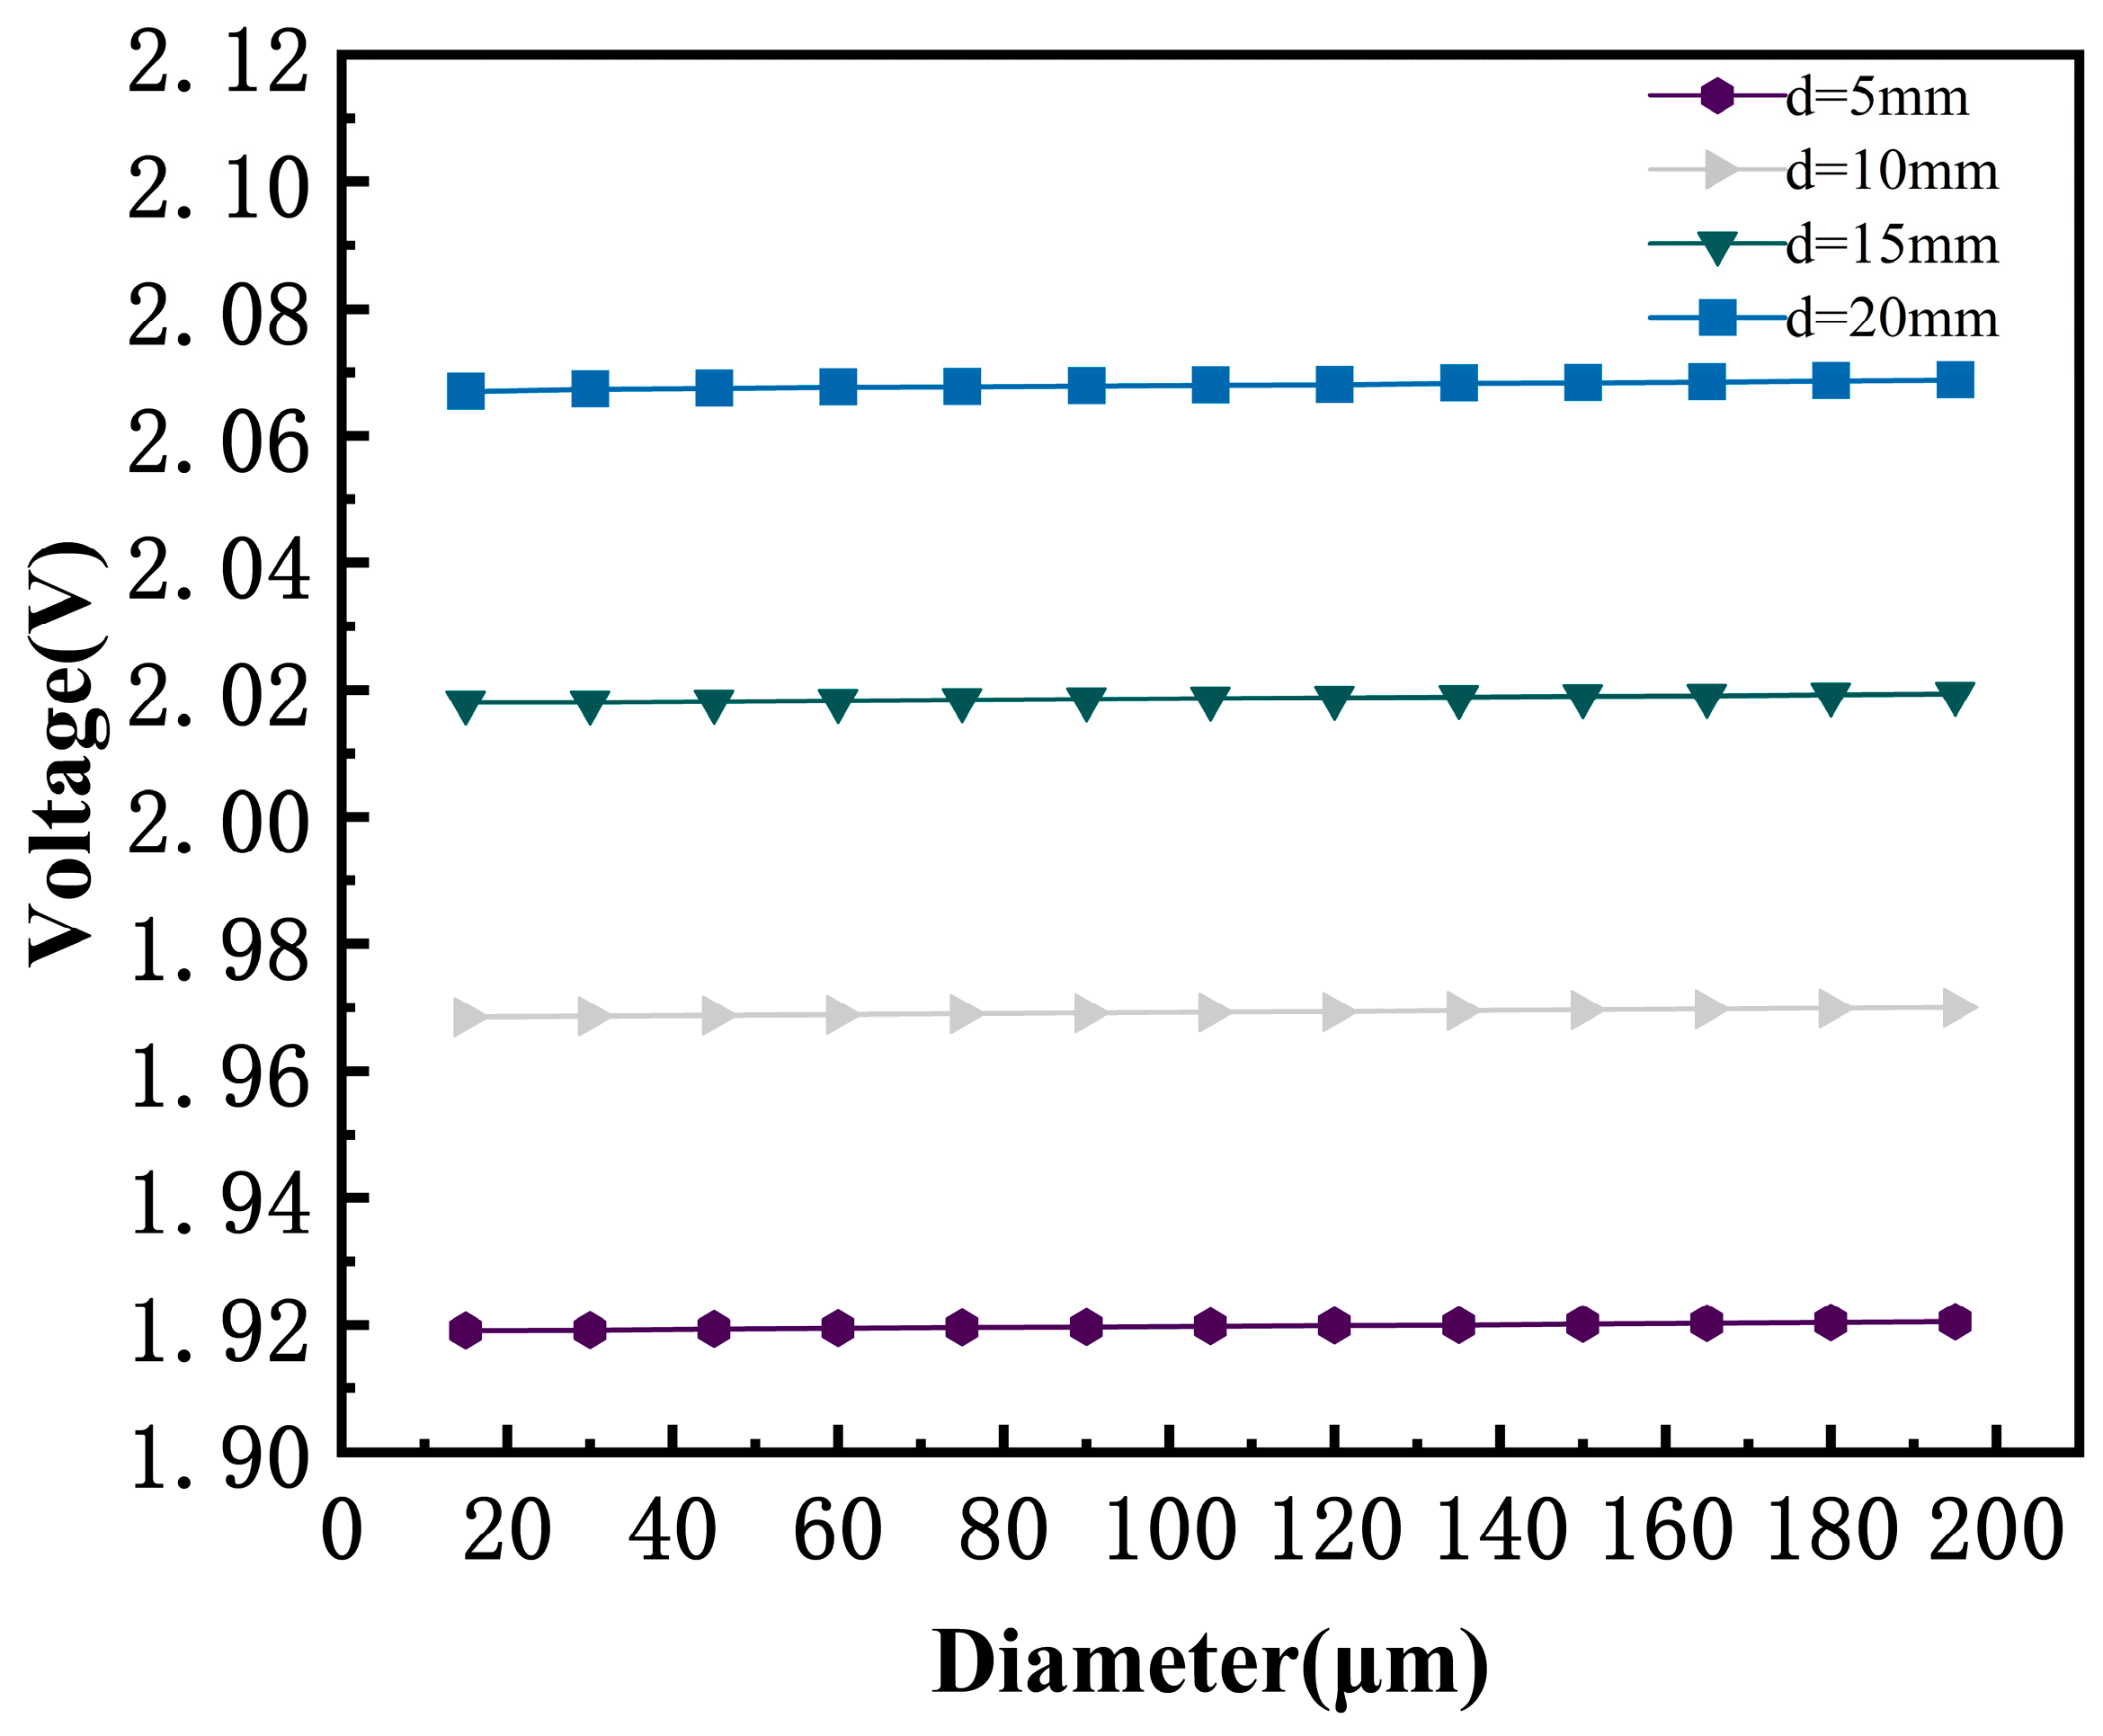
3.7. Effect of Porous GDL Pore Size

Figure 12 presents the voltage polarization curves of AEMEC under different pore diameters of the porous GDL. It can be observed from the figure that the pore diameter of the porous GDL has a minor impact on the voltage polarization curves of the AEMEC. When the current density is 0.7 A/cm2 and the pore diameters are 50 μm and 160 μm, respectively, the voltage difference between them is merely 0.9 mV. A larger pore diameter is conducive to the rapid expulsion of the gasses (such as hydrogen and oxygen) generated during the reaction, reducing the bubble retention effect, thereby enhancing the active surface area of the electrode and the reaction efficiency. However, an increase in the pore diameter usually implies a reduction in the solid framework, which may potentially degrade the electrical conductivity of the porous GDL and increase the ohmic resistance.
Thickness and pore diameter are two important parameters of the porous GDL. As can be known from the above content, appropriately reducing the porosity and pore diameter of the porous GDL is beneficial for reducing the energy consumption of AEMEC. Figure 13 displays the voltages of the AEMEC under different thicknesses and pore diameters of the porous GDL. As shown in the figure, the voltage of AEMEC gradually increases as the pore diameter increases when the thickness of the porous GDL is fixed. However, compared with the voltage change caused by the variation in thickness, it is rather insignificant. When the thickness of the porous GDL is 15 mm and the pore diameter of the porous GDL increases from 15 μm to 195 μm, the voltage of the AEMEC increases from 2.018 V to 2.0194 V. Under the same pore diameter and porosity, a reduction in the thickness of the porous GDL will result in a decrease in the voltage of the AEMEC. Therefore, simultaneously reducing the pore diameter and thickness of the porous GDL is conducive to optimizing the performance of the AEMEC.

4. Conclusions

This paper investigates the crucial role of AEM thickness, operating temperature, pressure, and GDL design parameters in influencing the electrolytic performance of AEMEC. The model is validated by comparing different experimental results. The main conclusions from this study are as follows:
(1)
A reduction in AEM thickness significantly enhances electrolysis efficiency. When the AEM thickness decreased from 70 microns to 65 microns, the electrolysis voltage dropped by 24 mV. This indicates that a thinner membrane reduces ion migration resistance, which increases conductivity and reduces ohmic polarization loss.
(2)
Operating pressure and working temperature have a dual effect on AEMEC performance. An increase in operating pressure and working temperature has a dual effect on AEMEC performance. The increase in temperature and pressure raises the electrolysis voltage. This effect is especially noticeable at higher current densities and results in a significant rise in energy consumption. When the anode pressure increased from 1 bar to 15 bar, the electrolysis voltage increased by 19.44 mV. This suggests that excessive pressure reduces the overall efficiency of the system.
(3)
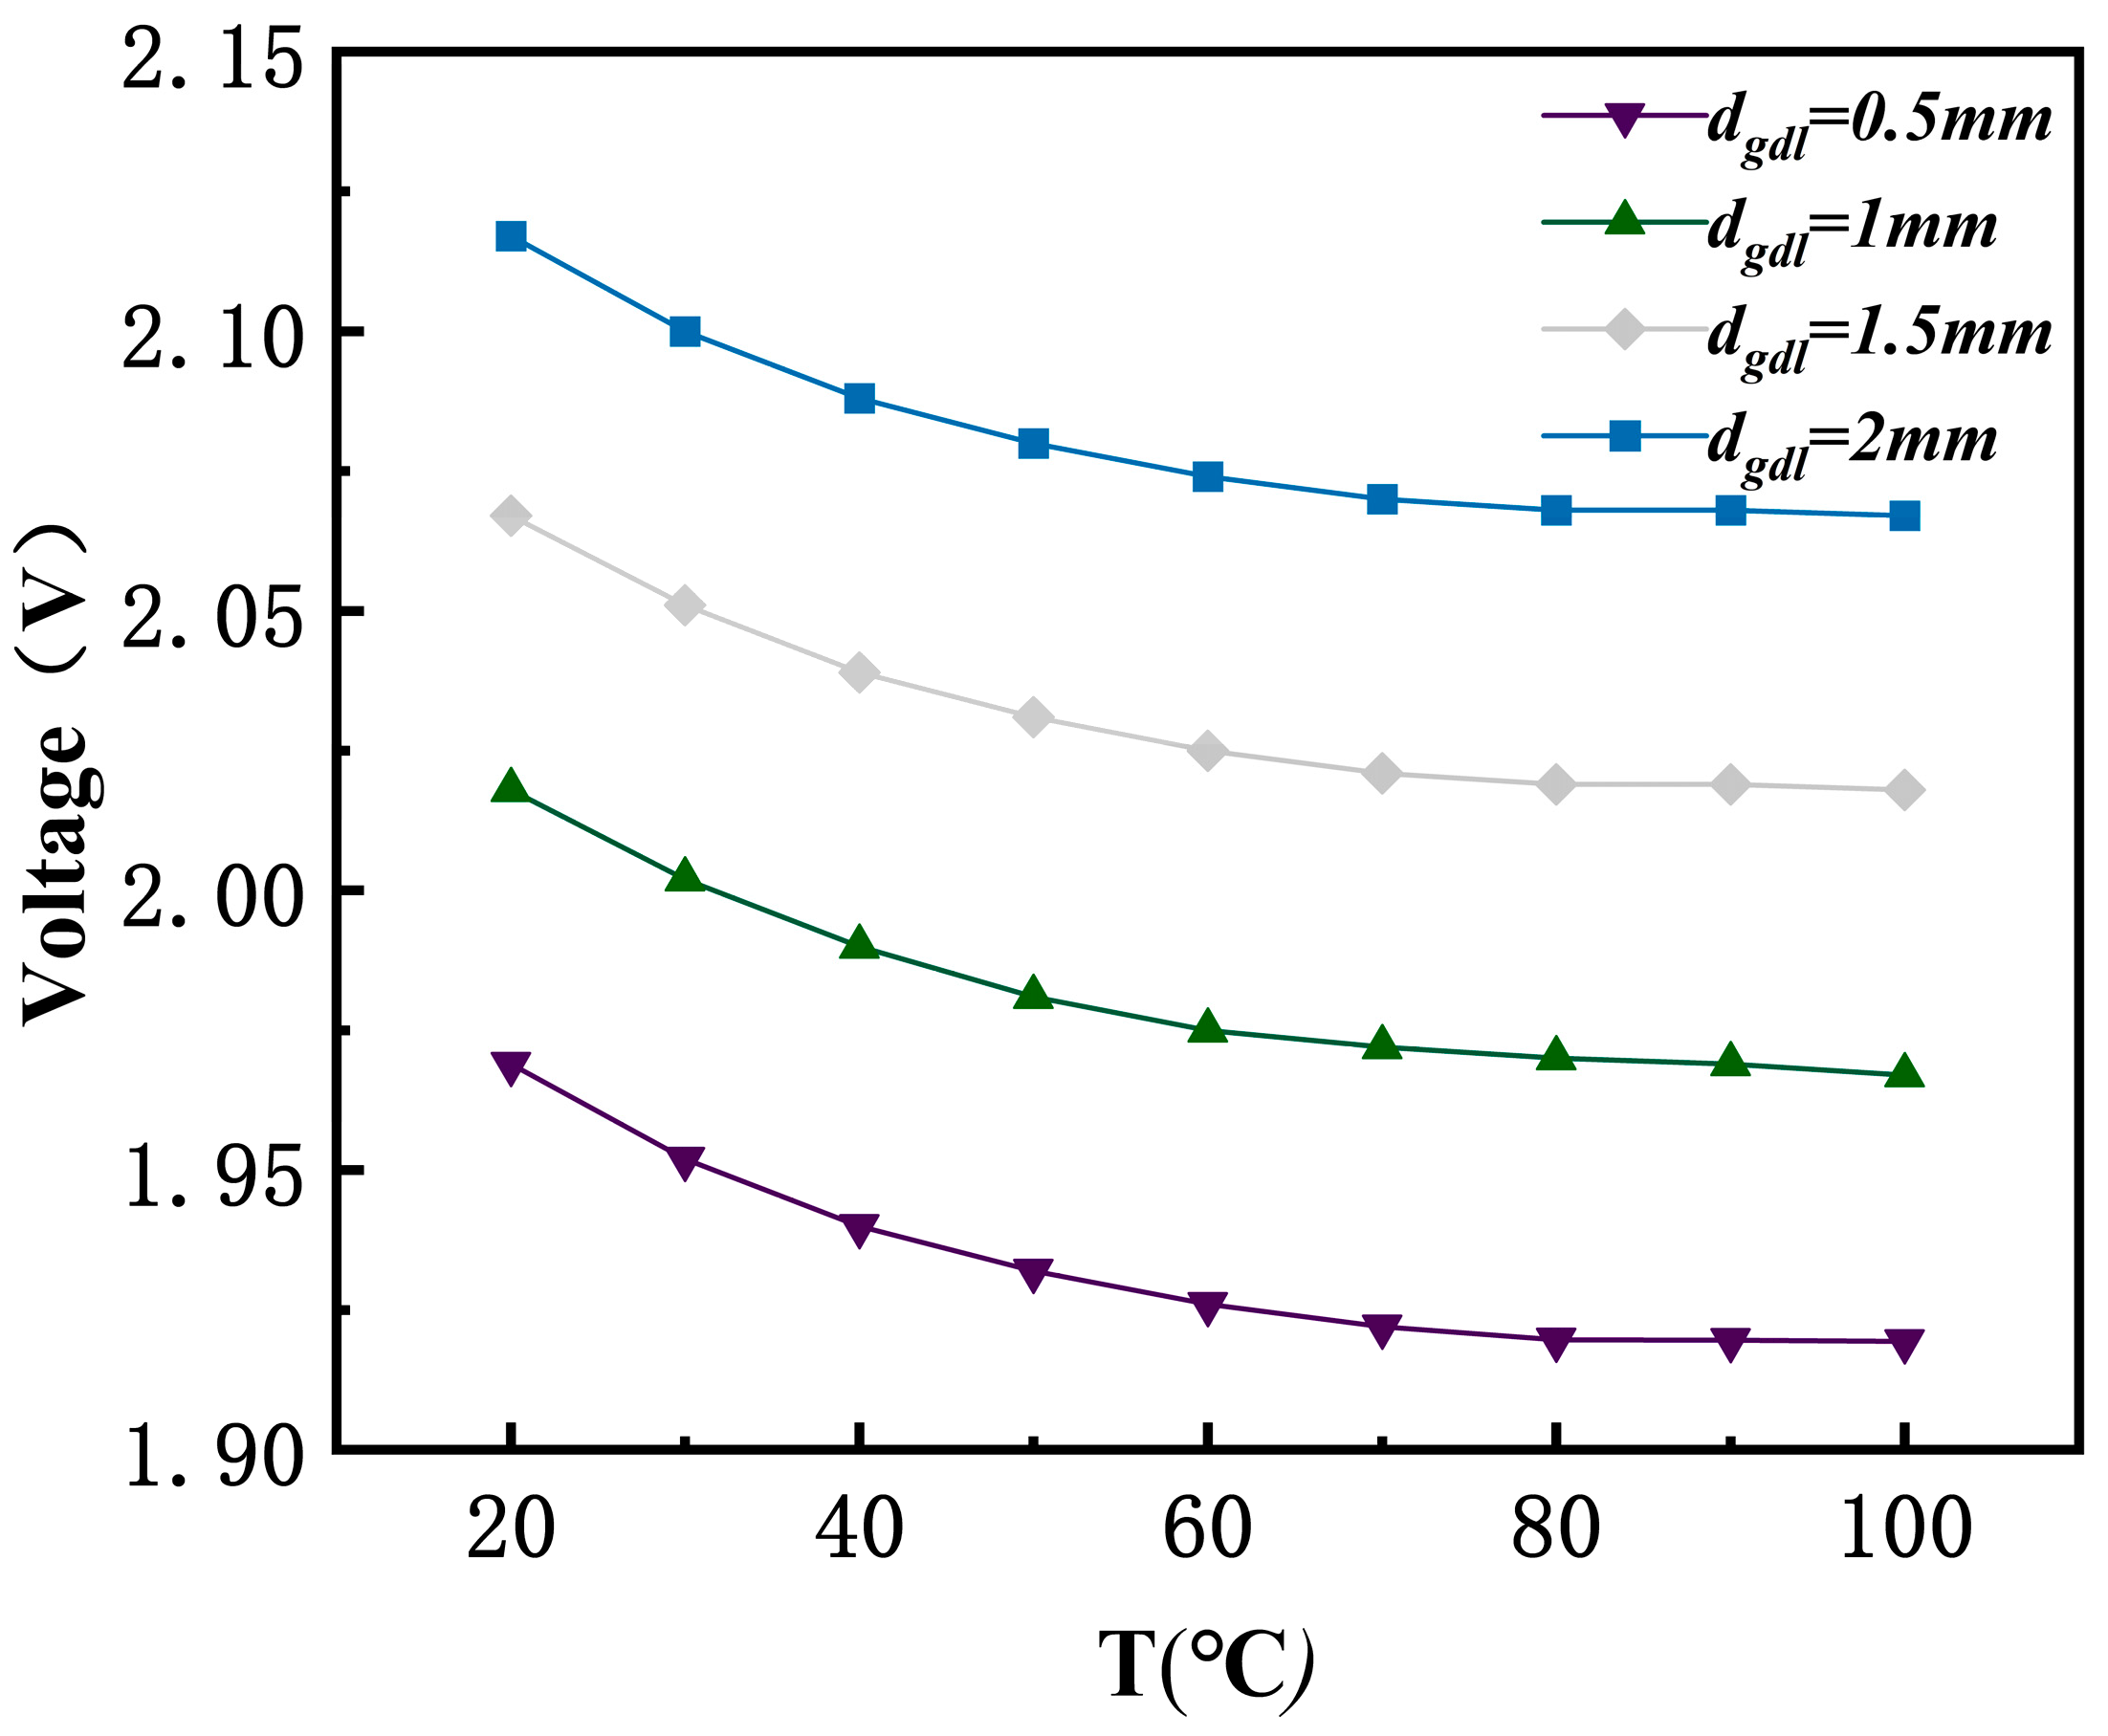
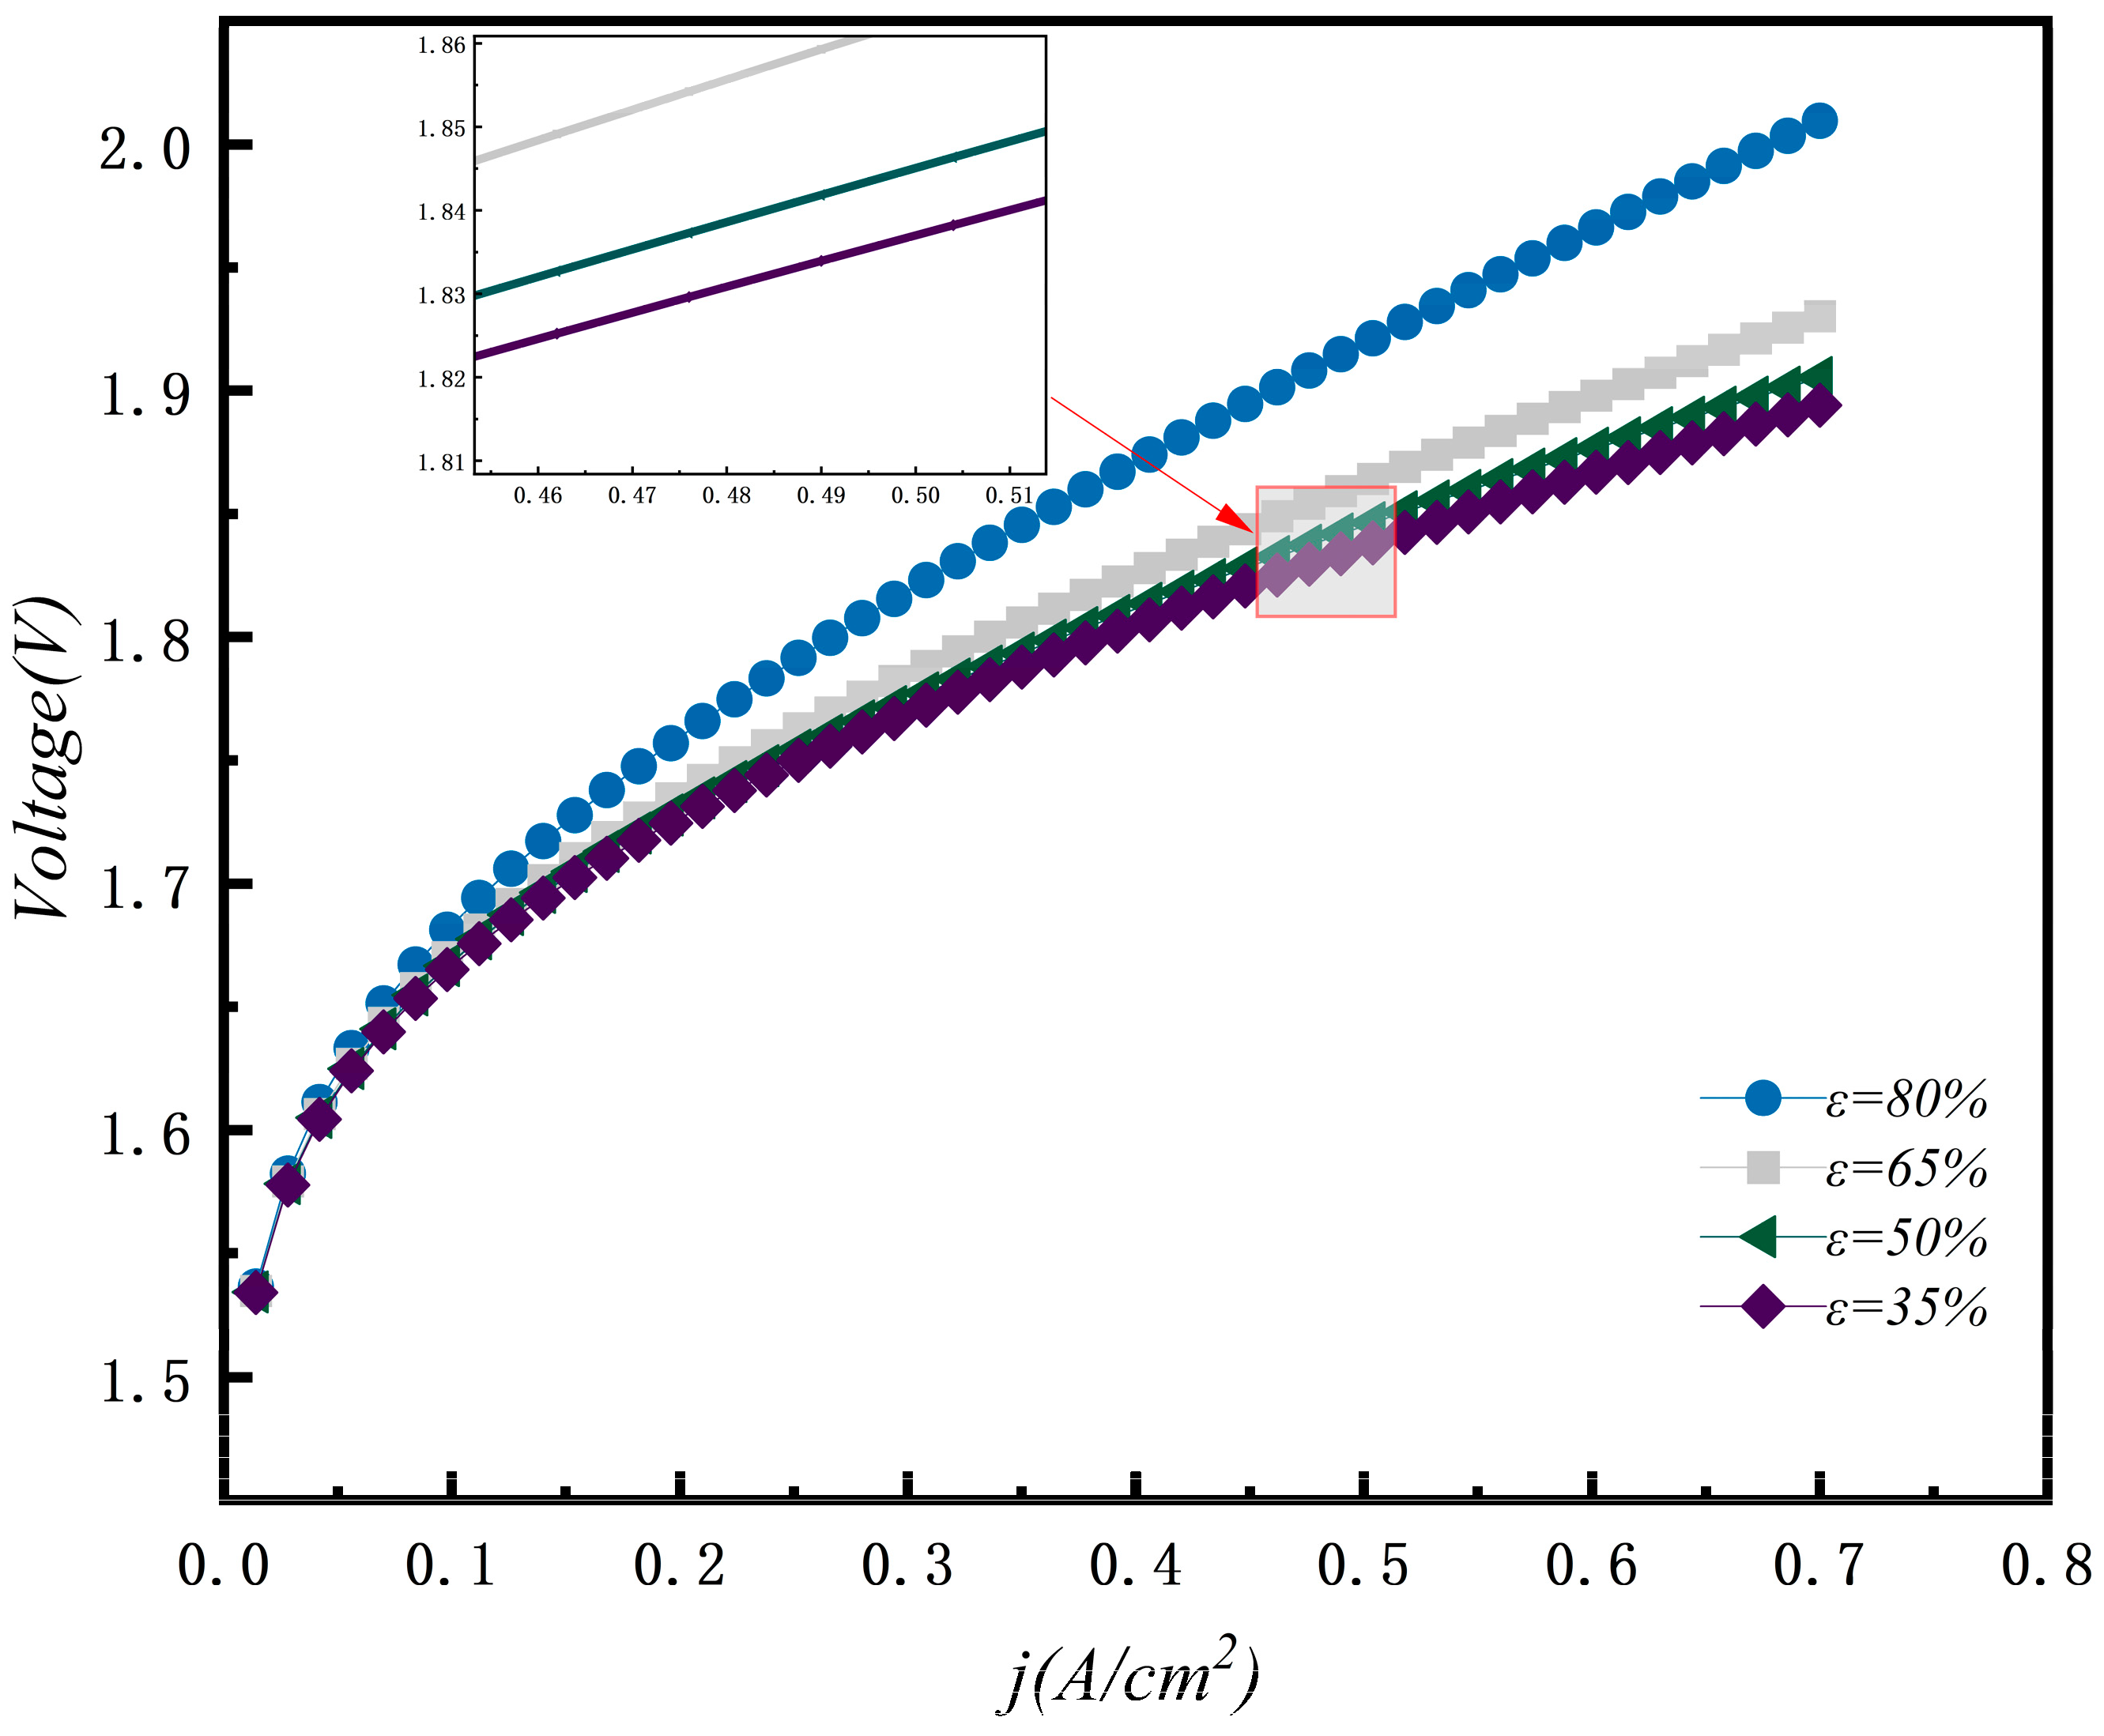
GDL design parameters such as thickness and porosity are key for reducing mass transfer resistance and enhancing electrolysis efficiency. A reduction in GDL thickness significantly lowers the electrolysis voltage and boosts efficiency. For instance, when the GDL thickness decreased from 2 mm to 0.5 mm, the voltage dropped from 2.068 V to 1.92 V. Furthermore, reducing GDL porosity to 0.2 helps to decrease ohmic losses and further optimize performance.
Overall, this model not only reveals the key influencing factors of AEMEC performance but also provides a full process theoretical tool from “parameter optimization” to “structural design”, laying the foundation for the commercialization of next-generation green hydrogen production technology.

Author Contributions

Conceptualization, X.Z. and Q.S. Writing—original draft, X.Z. Writing—review & editing, Q.S. and S.L. Software, X.Z. and H.L. Funding acquisition, Q.S. Formal analysis, X.Z. Investigation, X.Z. Project administration, Q.S. Supervision, Q.S. and S.L. Validation, Q.S. and Z.Z. Resources, Z.Z. Methodology, S.L. Project administration, S.L. All authors have read and agreed to the published version of the manuscript.

Funding

This work was supported by the Science and Technology Projects of Liaoning Province (No. 2023JH1/10400077), and the National Natural Science Foundation of China (No. 52001045).

Data Availability Statement

Data will be made available on request.

Conflicts of Interest

The authors declare that they have no known competing financial interests or personal relationships that could have appeared to influence the work reported in this paper.

Nomenclature

List of symbols
RGas constant
TTemperature
FFaraday constant
jCurrent density
xThe number of reaction sites
DThe pore size of GDL
xThe total number of reaction sites
AReaction area
εGDL porosity
dAEMAEM thickness
dGDLGDL thickness
CO2,mThe oxygen concentration at the interface between the electrode and the membrane
CH2,mThe hydrogen concentration at the interface between the electrode and the membrane
Subscripts and superscripts
ananode
catcathode
revopen circuit voltage
actactivation overpotential
ohmohmic overpotential
diffdiffusion overpotential
AEMAnion Exchange Membrane
0the reversible voltage
Greek
αananode charge transfer coefficient
αcatCathode charge transfer coefficient
σAEMAEM conductivity
σGDLGDL conductivity

References

  1. Hermesmann, M.; Müllerte, T.E. Green, Turquoise, Blue, or Grey? Environmentally friendly Hydrogen Production in Transforming Energy Systems. Prog. Energy Combust. Sci. 2022, 90, 100996. [Google Scholar] [CrossRef]
  2. Biswas, S.; Kaur, G.; Paul, G.; Giddey, S. A critical review on cathode materials for steam electrolysis in solid oxide electrolysis. Int. J. Hydrogen Energy 2023, 48, 12541–12570. [Google Scholar] [CrossRef]
  3. Lima, A.; Torrubia, J.; Valero, A.; Valero, A. Non-Renewable and Renewable Exergy Costs of Water Electrolysis in Hydrogen Production. Energies 2025, 18, 1398. [Google Scholar] [CrossRef]
  4. Pavel, C.C.; Cecconi, F.; Emiliani, C.; Santiccioli, S.; Scaffidi, A.; Catanorchi, S.; Comotti, M. Highly Efficient Platinum Group Metal Free Based Membrane-Electrode Assembly for Anion Exchange Membrane Water Electrolysis. Angew. Chem.-Int. Ed. 2014, 53, 1378–1381. [Google Scholar] [CrossRef] [PubMed]
  5. Bayat, A.; Das, P.K.; Saha, G.; Saha, S.C. Proton Exchange Membrane Electrolysis Revisited: Advancements, Challenges, and Two-Phase Transport Insights in Materials and Modelling. Eng 2025, 6, 72. [Google Scholar] [CrossRef]
  6. Maksimova-Dimitrova, K.; Mladenova, B.; Borisov, G.; Slavcheva, E. Ni and Co Catalysts on Interactive Oxide Support for Anion Exchange Membrane Electrolysis Cell (AEMEC). Inorganics 2024, 12, 153. [Google Scholar] [CrossRef]
  7. Tang, J.Y.; Xu, X.M.; Tang, T.; Zhong, Y.J.; Shao, Z.P. Perovskite-Based Electrocatalysts for Cost-Effective Ultrahigh-Current-Density Water Splitting in Anion Exchange Membrane Electrolyzer Cell. Small Methods 2022, 6, e2201099. [Google Scholar] [CrossRef]
  8. Nafchi, M.; Afshari, E.; Baniasadi, E. Anion exchange membrane water electrolysis: Numerical modeling and electrochemical performance analysis. Int. J. Hydrogen Energy 2024, 52, 306–321. [Google Scholar] [CrossRef]
  9. Abdelhafiz, A.; Mohammed, M.H.; Abed, J. Tri-Metallic Catalyst for Oxygen Evolution Reaction Enables Continuous Operation of Anion Exchange Membrane Electrolyzer at 1A cm−2 for Hundreds of Hours. Adv. Energy Mater. 2024, 14, 2303350. [Google Scholar] [CrossRef]
  10. Li, L.X.; Jiang, W.X.; Wan, Q.Q.; Zhang, E.D.; Li, B.; Yuan, L.; Li, G.F.; Hou, J.B.; Zhuang, X.D.; Zhang, J.L. Production of the porous transport layer based on stainless steel felt for anion exchange membrane water electrolysis. Electrochim. Acta 2025, 513, 145598. [Google Scholar] [CrossRef]
  11. Tricker, A.W.; Ertugrul, T.Y.; Lee, J.K.; Shin, J.R.; Kushner, D.; Wang, G.Z.; Lang, J.; Zenyuk, I.V.; Weber, A.Z. Pathways Toward Efficient and Durable Anion Exchange Membrane Water Electrolyzers Enabled by Electro-Active Porous Transport Layers. Adv. Energy Mater. 2024, 14, 2303629. [Google Scholar] [CrossRef]
  12. Sampathkumar, S.N.; Ferriday, T.B.; Middleton, P.H.; Van Herle, J. Activation of stainless steel 316L anode for anion exchange membrane water electrolysis. Electrochem. Commun. 2023, 146, 107418. [Google Scholar] [CrossRef]
  13. Wang, R.X.; Inoguchi, K.; Ohashi, M.; Someya, S.; Munakata, T.; Ishida, M.; Ito, H. Effect of porous transport layer properties on the anode electrode in anion exchange membrane electrolyzers. J. Power Sources 2023, 555, 232371. [Google Scholar]
  14. Singh, A.; Gupta, V.K.; Kumar, A. Chaotic convection in Rivlin-Ericksen fluid flowing through highly permeable porous medium. Phys. Fluids 2024, 36, 114117. [Google Scholar] [CrossRef]
  15. Dubey, R.; Murthy, P.V.S.N. The onset of convective instability of horizontal throughflow in a porous layer with inclined thermal and solutal gradients. Phys. Fluids 2018, 30, 074104. [Google Scholar] [CrossRef]
  16. Barman, P.; Srinivasacharya, D. Linear and nonlinear stability analyses of micropolar fluid flow in horizontal porous layers. Phys. Fluids 2024, 36, 033122. [Google Scholar] [CrossRef]
  17. Montaño, D.L.C.; García, P.R.; Navarro, A.J. Effect of the Cathodic Gas Diffusion Layer on the Performance of a Proton Exchange Membrane Electrolyzer. Energies 2024, 17, 5298. [Google Scholar] [CrossRef]
  18. Wang, W.T.; Ding, L.; Xie, Z.Q.; Yu, S.L.; Capuano, C.B.; Keane, A.; Ayers, K.; Zhang, F.Y. 3D structured liquid/gas diffusion layers with flow enhanced microchannels for proton exchange membrane electrolyzers. Energy Convers. Manag. 2023, 296, 117665. [Google Scholar] [CrossRef]
  19. Kang, Z.Y.; Yu, S.L.; Yang, G.Q.; Li, Y.F.; Bender, G.; Pivovar, B.S.; Green, J.B.; Zhang, F.Y. Performance improvement of proton exchange membrane electrolyzer cells by introducing in-plane transport enhancement layers. Electrochim. Acta 2019, 316, 43–51. [Google Scholar] [CrossRef]
  20. Roenning, F.H.; Roy, A.; Aaron, D.S.; Mench, M.M. Mass transport limitations in polymer electrolyte water electrolyzers using spatially-resolved current measurement. J. Power Sources 2022, 542, 231749. [Google Scholar] [CrossRef]
  21. Zhu, X.H.; Zhang, J.Y.; Du, S.J.; Dang, J.; Yang, M.Y.; Liu, B.; Ma, J.G.; Yang, F.Y.; Ouyang, M.G. Exploring the Influence Mechanism of Porous Transport Layer Structure and Type on Performance in Proton Exchange Membrane Electrolyzer. J. Electrochem. Soc. 2023, 170, 124510. [Google Scholar] [CrossRef]
  22. Li, K.; Yu, S.L.; Li, D.G.; Ding, L.; Wang, W.T.; Xie, Z.Q.; Park, E.J.; Fujimoto, C.; Cullen, D.A.; Kim, Y.S.; et al. Engineered Thin Diffusion Layers for Anion-Exchange Membrane Electrolyzer Cells with Outstanding Performance. ACS Appl. Mater. Interfaces 2021, 13, 50957–50964. [Google Scholar] [CrossRef]
  23. Lawand, K.; Sampathkumar, S.N.; Mury, Z.; Van Herle, J. Membrane electrode assembly simulation of anion exchange membrane water electrolysis. J. Power Sources 2024, 595, 234047. [Google Scholar] [CrossRef]
  24. Chen, Q.; Wang, Y.; Yang, F.; Xu, H. Two-dimensional multi-physics modeling of porous transport layer in polymer electrolyte membrane electrolyzer for water splitting. Int. J. Hydrogen Energy 2020, 45, 32984–32994. [Google Scholar] [CrossRef]
  25. Yigit, T.; Selamet, O.F. Mathematical modeling and dynamic Simulink simulation of high-pressure PEM electrolyzer system. Int. J. Hydrogen Energy 2016, 41, 13901–13914. [Google Scholar] [CrossRef]
  26. Zou, L.; Shen, Q.W.; Liao, J.D.; Xu, L.Y.; Yang, G.G.; Li, S. Effect of porous transport layer parameters on the proton exchange membrane electrolyzer performance. Chem. Phys. Lett. 2023, 823, 140570. [Google Scholar] [CrossRef]
  27. Ojong, E.T.; Kwan, J.T.H.; Nouri-Khorasani, A.; Bonakdarpour, A.; Wilkinson, D.P.; Smolinka, T. Development of an experimentally validated semi-empirical fully-coupled performance model of a PEM electrolysis cell with a 3-D structured porous transport layer. Int. J. Hydrogen Energy 2017, 42, 25831–25847. [Google Scholar] [CrossRef]
  28. Kang, Z.Y.; Mo, J.K.; Yang, G.Q.; Retterer, S.T.; Cullen, D.A.; Toops, T.J.; Green, J.B.; Mench, M.M.; Zhang, F.Y. Investigation of thin/well-tunable liquid/gas diffusion layers exhibiting superior multifunctional performance in low-temperature electrolytic water splitting. Energy Environ. Sci. 2017, 10, 166–175. [Google Scholar] [CrossRef]
  29. Marangio, F.; Santarelli, M.; Cali, M. Theoretical model and experimental analysis of a high pressure PEM water electrolyser for hydrogen production. Int. J. Hydrogen Energy 2009, 34, 1143–1158. [Google Scholar] [CrossRef]
  30. Shen, M.Z.; Bennett, N.; Ding, Y.L.; Scott, K. A concise model for evaluating water electrolysis. Int. J. Hydrogen Energy 2011, 36, 14335–14341. [Google Scholar] [CrossRef]
  31. Diaz, D.F.R.; Valenzuela, E.; Wang, Y. A component-level model of polymer electrolyte membrane electrolysis cells for hydrogen production. Appl. Energy 2022, 321, 119398. [Google Scholar] [CrossRef]
Figure 1. AEMEC model based on MATLAB/Simulation.
Eng 06 00111 g001
Figure 2. Interface model between flow channel and GDL. (a) front view (b) side view.
Eng 06 00111 g002
Figure 3. Comparison of simulation results with experimental data.
Eng 06 00111 g003
Figure 4. Energy consumption of anion exchange membrane electrolyzer at different AEM thicknesses.
Eng 06 00111 g004
Figure 5. Energy consumption generated by four different potentials at a temperature of 343.15K.
Eng 06 00111 g005
Figure 6. Under different current densities, energy consumption generated by four different potentials at a temperature of 343.15K.
Eng 06 00111 g006
Figure 7. Voltage polarization curves of AEMEC at different pressures.
Eng 06 00111 g007
Figure 8. Voltage polarization curves of AEMEC for different porous GDL thicknesses.
Eng 06 00111 g008
Figure 9. AEMEC voltage at different porous GDL thicknesses.
Eng 06 00111 g009
Figure 10. Voltage polarization curves of AEMEC with different porous GDL porosity.
Eng 06 00111 g010
Figure 11. Ohmic overpotential of AEMEC with different porous GDL porosity.
Eng 06 00111 g011
Figure 12. Voltage polarization curves of AEMEC with different porous GDL pore.
Eng 06 00111 g012
Figure 13. AEMEC voltage at different porous GDL pore size.
Eng 06 00111 g013
Table 1. Numerical values for water saturation at the GDL surface.
Current Density (A/cm2) Water   Saturation   at   the   GDL   Surface   ( s G D L / C h )
01
0.10.989
0.20.978
0.30.967
0.40.956
0.50.945
0.60.934
0.70.923
Table 2. Modeling parameters of AEMEC.
DescriptionValue, Unit
Faraday constant96,485 C/mol
Gas constant8.314 J/mol K
The operating temperature353.15 K, 333.15 K, 323.15 K
Anode and cathode working pressure1 bar, 1 bar
The maximum current density0.7 A/cm2
Anode and cathode charge transfer coefficient0.5, 0.5
Anode and cathode exchange current density6.815/0.0000572 A/cm2
Porosity0.6
Pore diameter50 μm
Interface contact resistance coefficient1.4 × 10−2
Disclaimer/Publisher’s Note: The statements, opinions and data contained in all publications are solely those of the individual author(s) and contributor(s) and not of MDPI and/or the editor(s). MDPI and/or the editor(s) disclaim responsibility for any injury to people or property resulting from any ideas, methods, instructions or products referred to in the content.

