Abstract
Accurate estimation of path loss is essential for evaluating the impact of the propagation medium, determining transmission power requirements, and optimizing cell layouts for effective 5G millimetre wave coverage. At 28 GHz, rain attenuation is a critical factor, with its impact varying significantly based on environmental and regional characteristics. This study quantifies the degradation of 5G millimetre wave link budgets due to rainfall in South Africa and assesses the maximum coverage ranges for urban micro and urban macro deployments under varying rain intensities. The analysis focuses on Pretoria, a city characterized by diverse urban landscapes and seasonal thunderstorms. Urban micro cells are deployed on streetlights and building facades in dense zones such as Hatfield and Sunnyside to deliver high-capacity coverage. In contrast, urban macro cells target broader coverage from elevated structures, such as those in the Pretoria CBD. Using the Close-In path loss model for both line-of-sight and non-line-of-sight conditions, this study examines the relationships between link budget parameters, maximum path loss, and 5G millimetre wave link distances under rain-affected and clear-sky scenarios. The results highlight the significant influence of rainfall, particularly in non-line-of-sight conditions, and provide insights for designing efficient 5G networks tailored to South Africa’s unique climate.
1. Introduction
Introducing millimetre wave (mmWave) frequencies into South Africa’s 5G wireless networks presents an opportunity to meet the increasing demand for faster data speeds, greater bandwidth, and minimal latency [1,2]. mmWave bands, particularly at 28 GHz, promise exceptional speed and capacity and are therefore critical to future-proofing the 5G wireless network. The 28 GHz band supports dense urban deployments with higher data rates. However, using these high frequencies presents challenges, particularly rain attenuation, which can significantly degrade signal quality [3,4,5].
In 5G mmWave networks, incorporating actual rain attenuation into the link budget is essential for accurate path loss estimation, especially for urban micro (UMi) and urban macro (UMa) cell links. Path loss directly affects the maximum distance between the user equipment (UE) and the base station (BS), as it determines the strength of the received signal relative to the sensitivity of the receiver. Smaller UMi cells, covering shorter distances of 10–500 m, are highly sensitive to variations in path loss, while larger UMa cells, covering distances of up to a few kilometres, require a more robust link to handle the interference and attenuation. Rain attenuation, which is significant at mmWave frequencies, intensifies path loss, limiting signal range and potentially reducing cell coverage.
To ensure acceptable quality of service in 5G mobile networks, it is important to maintain a received power level above the minimum threshold. This threshold is typically defined by the minimum signal-to-noise ratio (SNR) [6,7]. To achieve sufficient SNR at the receiver, link budgeting is used to account for all power gains and losses during signal transmission [8]. A key component of the link budget is path loss, which measures the reduction in signal strength due to factors such as physical obstructions, weather conditions, and geographical features. Rain attenuation has a significant impact on the link budget in 5G mmWave wireless communications, especially because the wavelengths of mmWave frequencies are comparable to the size of raindrops, which can cause significant signal degradation through absorption and scattering [9,10,11,12]. By integrating realistic rainfall data, the link budget enables a more reliable assessment of channel status and ensures that the signal strength (RxSL) exceeds the receiver sensitivity (RxS). This coordination between path loss, rain attenuation, and receiver sensitivity enables optimized cell design and supports effective 5G deployment across diverse environments.
Rain attenuation affects the design and performance of short-range and fixed wireless links by increasing path loss and requiring adjustments to parameters such as transmit power, antenna gain, and site placement. When planning a network, it is essential to account for these losses within the link budget to ensure reliable service, especially in areas with heavy or frequent rainfall.
Models such as the ITU-R P.838 are often used to predict attenuation caused by rain and incorporate these estimates into the link budget to ensure that performance remains within acceptable limits despite adverse weather conditions. In regions with light rain, a small fade margin is typically sufficient to overcome challenges posed by rain in 5G mmWave networks. However, South African cities experience frequent thunderstorms [13] during summer, leading to significant rain attenuation even over short distances, such as those between UE and the BS in urban micro cell scenarios. Fixed power margins are often impractical due to limited power availability, the highly variable nature of rainfall in the region, and safety concerns. Consequently, adaptive fade mitigation techniques, such as dynamic power control, hierarchical modulation, data rate reduction, and diversity methods, are more effective in addressing these variations. Because signal attenuation caused by rain is very dynamic and location-specific, real-time attenuation prediction is critical to optimize mitigation strategies that balance coverage and capacity and ensure the feasibility and efficiency of mmWave based 5G networks.
This study estimates rain-induced attenuation in South African cities using available rain data. Rain rates with a 60 min integration time are converted to their one-minute equivalents, and attenuation values at 28 GHz are calculated. The analysis focuses on 5G links in urban micro (UMi) and urban macro (UMa) deployments in Pretoria. The assessment of 5G coverage involves calculating the maximum allowable path loss on the radio interface through a link budget analysis. This process evaluates path loss for downlink transmissions in both UMi and UMa scenarios while identifying potential network design challenges [14], such as limited coverage.
To plan 5G mmWave deployments in Pretoria, the urban environment is categorized into UMi and UMa scenarios to meet different coverage and capacity requirements. In UMi scenarios, small cells are strategically positioned at heights of 4 to 10 m, typically on streetlights or building facades, to provide high-capacity, low-latency connectivity in densely populated areas such as Pretoria CBD and Sunnyside. These locations are characterized by heavy pedestrian and vehicular traffic, requiring the use of mmWave technology and beamforming to mitigate signal attenuation and blockages caused by buildings.
Conversely, UMa cells are deployed at greater heights, such as on rooftops or dedicated towers ranging from 25 to 50 m in height, to provide wider coverage in areas such as Hatfield or suburban areas. These cells ensure reliable connectivity over larger areas and complement the targeted, high-density coverage provided by UMi deployments. By integrating UMi and UMa scenarios, the network design achieves an optimized spectrum efficiency, overcomes line-of-sight challenges, and supports a wide range of applications from enhanced mobile broadband to IoT use cases.
A key contribution of this study is its region-specific analysis of rain-induced attenuation and path loss using the Moupfouma model, tailored for subtropical climates. Unlike previous research which relied on generalized models or simulations from non-African urban settings, this work offers an evaluation adapted to Pretoria’s distinct urban morphology and rainfall characteristics. The results provide practical design thresholds and coverage limitations to inform 5G mmWave deployment in the local context.
The paper is organized as follows: Section 2 discusses related work and provides context on rain attenuation and its impact on the propagation of 5G mmWave wireless networks. Section 3 introduces the Moupfouma rain attenuation model and explains its application in the study. Path loss is analysed in Section 4, followed by a discussion of the link budget in Section 5. Results and analysis are presented in Section 6, highlighting key findings. Finally, Section 7 concludes the paper and summarizes findings and implications for 5G network planning.
2. Related Work
The influence of atmospheric conditions on 5G cellular communications in urban micro cell environments has been the focus of several studies. For example, ref. [15] investigates the significant impact of path loss, particularly at higher frequencies, on signal reception and overall network performance. The study identifies meteorological factors such as temperature, humidity, and rain as major causes of increased path loss, leading to increased signal attenuation and reduced network reliability. Particular emphasis is placed on the importance of frequency selection, with 7.125 GHz identified as a relatively stable option. However, challenges persist regarding the cumulative effects of atmospheric conditions and the limitations of millimetre waves for long-distance applications. Similarly, ref. [16] evaluates the performance of a 5G millimetre wave (mmWave) system in Banda Aceh city by simulating the path loss under line-of-sight propagation (LOS) and non-line-of-sight propagation (NLOS) models. The results show that path loss plays a critical role in determining 5G network performance, with increased signal attenuation and reduced coverage and reliability observed, particularly in NLOS scenarios. These findings highlight the need for careful urban deployment planning to mitigate such challenges. In [17], a modified path loss model is proposed to account for the differences between clear and rainy air conditions based on outdoor microcellular measurements at 26 and 32 GHz. The study introduces a dynamic rain cell model for multi-user systems to analyse the overall impact of rain attenuation. The results indicate that the parameters of the floating intercept (FI) model shift significantly compared to the Close-In (CI) model under different rainfall intensities. In addition, larger rain cell radii lead to higher path loss exponents, negatively affecting system capacity, particularly in higher frequency bands. The study also highlights the influence of rain cell speed on path loss and system performance. Further, ref. [18] investigates the impact of rainfall on the propagation of 5G mmWave channels in urban environments and on highways. The study examines attenuation, path loss, and link margin at different frequencies. The results indicate that as path difference and rain rate increase, path loss increases while link margin decreases, with the effect being more pronounced at higher frequencies. To address these challenges, a particle swarm optimization approach is employed, achieving 94% accuracy and demonstrating improved signal propagation and overall system performance.
Although several studies have investigated rain attenuation and path loss at mmWave frequencies, these studies were carried out in non-Africa settings [15,16,17,18] and used generic global models. In contrast, this work emphasizes the subtropical African environment by incorporating locally calibrated attenuation values. Additionally, models like FI and ABG may offer better predictive performance; however, their highly empirical formulations limit their usefulness for engineering applications. This study aims to bridge that gap by employing the CI model and regionally relevant rain models to achieve a balance between predictive accuracy and the physical interpretability of the system design.
Beyond the reviewed works [15,16,17], several studies such as [8,19,20] have proposed empirical or stochastic models for rain attenuation and path loss. However, these models often lack calibration for subtropical or tropical climates like South Africa. The limitations of these models, in terms of temporal scaling, frequency applicability, and geographic specificity, are summarized in Table 1.

Table 1.
Related studies, indicating the models, assumptions, and limitations.
3. Rain Attenuation
This section analyses the impact of rain attenuation on path loss and 5G mmWave signal propagation in selected South African cities, with a focus on outdoor LOS and NLOS paths. The estimated rain attenuation for Pretoria is used to calculate path loss and determine the link budget for UMi and UMa links.
The Moupfouma model [21] is used to predict rainfall attenuation and provides realistic values tailored to the diverse climate zones of South Africa. The country experiences variable weather conditions and includes dry regions and areas with frequent rainfall. Rain rates are influenced by seasonal changes, such as the summer thunderstorm rainfall in the eastern and northern regions and the winter rainfall in the Western Cape. These climatic variations impact the intensity and frequency of rainfall, making accurate modelling essential for effective 5G network planning in urban and rural scenarios. The Moupfouma model [21] improves the prediction of rainfall attenuation in tropical regions by recalibrating the coefficients to reflect local rainfall intensity and variability. This approach enhances forecast accuracy by incorporating tropical-specific features such as higher rainfall rates and droplet sizes.
For this study, the Moupfouma model was selected over more commonly benchmarked models such as ITU-R P.838 or the Crane model due to its superior performance in tropical and subtropical environments like South Africa. The Moupfouma model specifically recalibrates the attenuation coefficients based on localized rain rate characteristics and drop size distributions [21], which are crucial for accurate attenuation modelling in regions with intense convective storms. In contrast to ITU-R P.838, which uses global averages, the Moupfouma model is better suited for localized prediction and has been validated in various African and equatorial contexts [3,22,23,24]. Table 2 presents the performance of empirical rain attenuation models in tropical and equatorial climates.
Table 2.
Related studies, indicating the performance of empirical rain attenuation models in tropical climates.
Rain rate data originally recorded with a 60 min integration time were converted to 1 min equivalent values using the ITU-R P.837-7 method [26]. This approach utilizes empirically derived regression formulas to relate rain intensities across different integration intervals. Specifically, the ITU-R P.837 recommendation for converting long-term rain rates (R60) to short-term rates (R1) was applied as in Equation (1):
The attenuation values for different provinces are then calculated using the method described in [19]. The Moupfouma path attenuation A0.01 model is mathematically represented as shown in Equation (2).
represents the specific rain attenuation (dB/km) at percentage of time . is the rain rate at the corresponding percentage of time . is the effective path length over which the rain propagation is considered uniform.
is the reduction factor coefficient and the actual path length in km. can be expressed as in (4):
where m is a coefficient that depends on the path length and the carrier frequency in GHz.
The coefficient can be obtained as in the following Equation:
Figure 1 shows the rainfall statistics for selected cities in South Africa. Pretoria recorded the highest rainfall rate at 0.01% exceedance with 168.5 mm/h, while Bloemfontein recorded the lowest rainfall rate of 42.58 mm/h. Polokwane and Cape Town have R0.01 values of 49.9 mm/h and 81.13 mm/h, respectively. All the cities experience thunderstorms, which are characterised by rainfall rates above 40 mm/h.
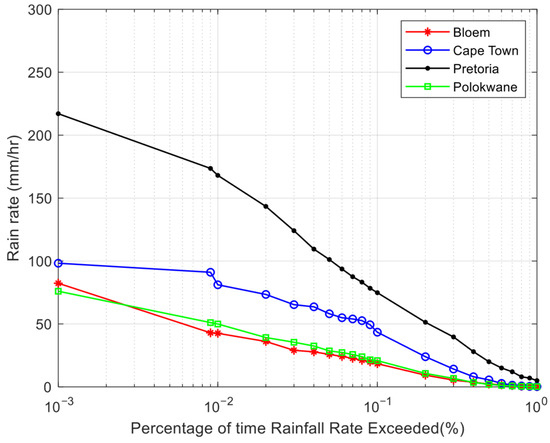
Figure 1.
Cumulative distribution of rainfall rate at 1 min for five cities (derived from ITU-R P.837-7 converted data and SANRAL/SAWS measurements).
Figure 2 shows the attenuation (dB/km) at different rain intensities. Drizzle at 0.25 mm/h causes minimal attenuation, remaining below 1 dB at all frequencies. Widespread rain at 5 mm/h results in attenuation of less than 10 dB. In contrast, showers with a rain rate of 25 mm/h and thunderstorms with a rain rate of 100 mm/h have significant impacts across all frequencies. The attenuation caused by thunderstorms exceeds 10 dB, highlighting the serious impact of heavy rainfall on signal propagation, especially in high frequency bands.
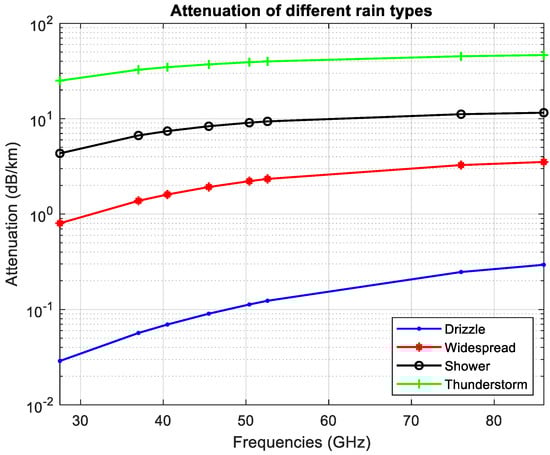
Figure 2.
Rain attenuation at 28 GHz for various rain types, calculated using Moupfouma model Equations (2)–(6).
In conclusion, the rain attenuation model selected and the rain rate conversion method provide a context-specific prediction of mmWave signal degradation for South African cities. This provides a critical foundation for accurate path loss and link budget analysis tailored to subtropical climates, supporting optimal 5G planning in the region.
4. Path Loss
This paper examines the effect of rainfall on path loss in UMa and UMi line-of-sight and non-line-of-sight scenarios. Given the high population density and significant data needs in urban areas, the focus is on these environments. UMi cells, designed for high traffic in compact areas such as city streets, typically cover ranges of 100 to a few hundred meters, ensuring low-latency connections. In contrast, UMa cells serve larger areas, with a span of several hundred meters to a few kilometres, effectively supporting higher mobility and mitigating interference from urban obstacles.
Line-of-sight (LOS) and non-line-of-sight (NLOS) conditions in this study are defined according to standardized 3GPP spatial channel models [8], rather than ray-tracing or site-specific empirical datasets. LOS is assumed when there is direct visibility between the transmitter and receiver, which is typical for UMi (urban micro) deployment along open streets. NLOS conditions are modelled probabilistically based on urban obstruction densities and building layout assumptions, as outlined in 3GPP TR 38.901. Although ray-tracing methods could potentially yield higher accuracy, they were not employed here due to the lack of detailed 3D urban datasets for Pretoria.
The path losses (PLs) are estimated using the Close-In (CI) path loss model, with a reference distance of 1 m [27], as shown in Equation (7):
where , is the Gaussian random variable with a mean of zero and a standard deviation δ (in dB). The free space path loss (FSPL) is given by (8):
where λ is the wavelength (in m).
The Close-In (CI) model is a simple path loss model that uses a single parameter, the path loss exponent (PLE), that conforms to physical principles. The CI model provides a conservative estimate of non-line-of-sight path loss over long distances and applies free-space path loss at a reference distance of 1 m to improve stability and accuracy [27]. In contrast, the Alpha–Beta–Gamma (ABG) model requires three parameters, provides slightly better accuracy, lacks a direct physical basis, and predicts lower path loss near the transmitter but higher loss at greater distances [28]. The CI model offers significant simplicity and achieves reasonable accuracy across various environments and frequency bands. Its minimal parameter requirement and reliance on a physically based approach make it a practical choice for various communication scenarios. For UMa and UMi scenarios, the standard deviations σ of the Gaussian variables are 4.6, 10, 2.9, and 8.1 dB for UMa LOS, UMa NLOS, UMi LOS, and UMi NLOS, respectively.
5. Link Budget
The link budget estimates the maximum allowable path loss for 5G UMi and UMa scenarios in Pretoria, considering an average rain rate of 48 mm/h, a maximum of 168.5 mm/h, and the parameters listed in Table 1 and Table 2. The link budget evaluates the system performance while taking into account all gains and losses at the transmitter, receiver, and propagation medium. Additionally, realistic rain attenuation values provide a more accurate approximation of total path loss under different environmental conditions.
The rain rates of 48 mm/h and 168.5 mm/h were selected based on converted one-minute rainfall data from the Pretoria region, following ITU-R P.837-7 methodology. The 168.5 mm/h represents the R0.01 (rain rate exceeded for 0.01% of the time) recorded in Pretoria, which corresponds to peak thunderstorm conditions. The 48 mm/h value is representative of the average R0.01 probability across South Africa’s summer months.
Currently, most 5G networks use the N28 and N78 frequency bands in SA with maximum channel bandwidths of 10 and 50 for each band, respectively. This study presents the results obtained with the N257 CA configuration with a 200 MHz carrier bandwidth.
In the link budget calculation process, input parameters are categorized into two types: variable parameters and scenario-specific parameters. Variable parameters include factors such as transmit power, number of transmit antennas, antenna gain, body loss, and SINR. Scenario-specific parameters include elements such as the standard deviation of shadow fading, penetration loss, effective height of base station and mobile station antennas, among others. These parameters are compiled into a structured table, which serves as the basis for computing the downlink link budget for a 28 GHz frequency band. The calculations are carried out for single-antenna setups in urban micro (UMi) and urban macro (UMa) scenarios. The cell radius ranges from 10 to 500 m for UMi and from 50 to 2000 m for UMa, reflecting the differing coverage requirements of these environments. The BS and UE 5G RAN parameters used for the simulation are summarized in Table 3 and Table 4, respectively.
Table 3.
BS interface features of 5G RAN.
Table 4.
UE 5G features.
5.1. Channel Status
The feasibility of the UMi and UMa 5G links are assessed based on the signal strength and system requirements using the link budget. This process calculates the received signal level (RxSL) and compares it to the receiver sensitivity (RxS), the minimum acceptable signal strength. The channel status “Pass” is assigned if RxSL outperforms RxS, indicating a robust link; otherwise, it is marked as “Failed”. Critical factors affecting this evaluation include transmission power, path loss, and antenna gains, which collectively impact communications reliability and performance as shown in Equations (9) to (12):
Tx Power is the transmitted power level of the signal, while Gains (dB) is the combined gains in the system, including antenna gain and any amplifier gains. The total signal loss, including path loss, shadowing, penetration loss, cable loss, the estimated rain attenuation, and any other attenuation factors, is represented by Losses (dB).
where
The current study assumes a single-input single-output (SISO) configuration without incorporating enhancements such as beamforming, massive multiple-output multiple-input (MIMO), or polarization diversity, which are central to mmWave deployments. These features significantly improve signal-to-noise ratio (SNR) and counteract path loss and rain-induced fading through spatial diversity and gain. In future simulations, we plan to integrate beamforming gain patterns and evaluate the impact of 8 × 8 MIMO arrays on coverage, capacity, and rain attenuation tolerance. Such enhancements could shift NLOS failure thresholds and are vital for a complete system-level analysis of mmWave deployment feasibility.
5.2. Parameter Sensitivity Analysis
A sensitivity analysis was performed to quantify the impact of variations in body loss, antenna gain, and slow fading margin on link budget performance. Parameter offsets of ±3 dB were applied to the antenna gain and body loss. A 3 dB variation in antenna gain alters the maximum reliable link distance by up to 40 m in UMi LOS configurations and by more than 100 m in UMa NLOS scenarios. A 3 dB increase in body loss resulted in a reduction in link margin under high rainfall conditions. These results highlight the necessity of integrating hardware tolerances and environmental variability into mmWave 5G network design.
6. Results and Discussion
6.1. Path Loss Analysis
The total path loss is shown in Figure 3. The graph shows the increasing trend of path loss with increasing distance due to signal attenuation over longer transmission paths. When the sky is clear, the path loss gradually increases. However, rain significantly increases the path loss, as shown by the path loss during rain with rainfall intensities of 42.58 mm/h and 168.5 mm/h. For shorter distances, the percentage increase in path loss due to rain is relatively small and is often less than 1%. For example, with a clear-sky path loss of 115 dB, the increase under rain is 0.33% for 50 m at a rain rate of 42.58 mm/h, showing negligible degradation at shorter distances or under light rain intensities. As the distance increases, the percentage increase in path loss becomes more noticeable. With a clear-sky path loss of 136.83 dB, the percentage increase under rain reaches 2.85% and 10.22% at 42.8 mm/h and 168.5 mm/h, respectively. At greater distances, especially in heavy rainfall conditions, the percentage increase becomes significant. For example, with a clear-sky path loss of 150.07 dB, the increase under rain conditions reaches 10.67% at 42.8 mm/h and escalates to 33.5% at 168.5 mm/h.
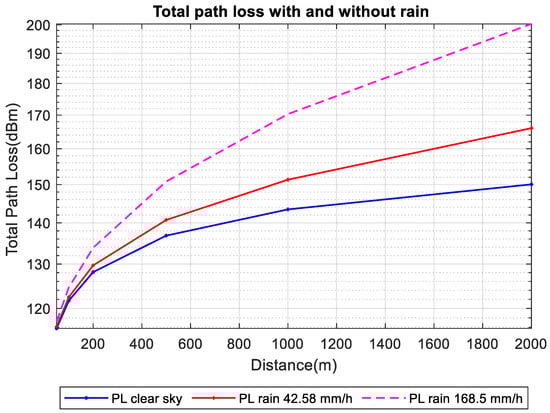
Figure 3.
Impact of rain on path loss (in dB) as a function of distance (in meters) under varying rain rates.
6.2. Link Budget Analysis
Figure 4 illustrates the differences between LOS and NLOS links and highlights the significant impact of rain on link budgets. LOS links provide better performance than NLOS links due to lower signal interference. However, for both types, there is a decrease in link budget with increasing distance. Higher rainfall intensities (42.58 mm/h to 168.5 mm/h) increase this deterioration, especially in NLOS links. The receiver sensitivity of −70.21 dB defines the minimum signal power required for the receiver to effectively detect and process the signal. This sensitivity depends on factors such as thermal noise, bandwidth, and the required signal-to-noise ratio. Performance below this threshold results in errors. For UMi LOS links, the link budget remains above the receiver sensitivity threshold at distances of up to 200 m, even at rain intensities of 42.58 mm/h and 168.5 mm/h. In contrast, UMi NLOS links start with a lower link budget and further degrade as rain intensity increases. At a rain rate of 42.58 mm/h, the UMi NLOS link reaches the minimum signal power threshold at 200 m. At 168.5 mm/h, this threshold is reached at approximately 170 m. For UMa links, both LOS and NLOS configurations have negative link budgets at short distances and at both rain rates, which pose significant challenges for reliable communication. At 42.58 mm/h, the UMa LOS link budget falls below the receiver sensitivity threshold at 1300 m, while at 168.5 mm/h, this occurs at 650 m. In NLOS settings, the UMa link budget falls below the threshold at approximately 190 m for 42.58 mm/h and at 200 m for 168.5 mm/h. At 2000 m, the link budget for both UMa LOS and NLOS configurations is approximately 40 dB lower than the link budget at 42.58 mm/h.
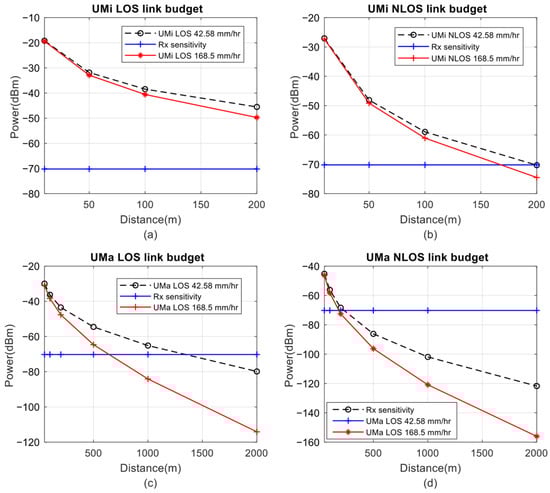
Figure 4.
Impact of rain on UMa and UMi link budgets (in dB) for LOS and NLOS conditions, with signal distance (m) and receiver sensitivity threshold (–70.21 dB). (a) UMi LOS scenario; (b) UMi NLOS scenario; (c) UMa LOS scenario; (d) UMa NLOS scenario.
The quantitative reduction in reliable distance under heavy rainfall requires strategic adaptation in network design. For example, in UMi NLOS scenarios, the cell radius should not exceed 160 m during peak storm conditions to prevent excessive signal degradation. Similarly, UMa LOS cells must be restricted to under 600 m to maintain acceptable link margins. These constraints highlight the need for network densification, increased power allocation, or adaptive beamforming techniques, particularly during the high-rainfall summer months in Pretoria, as critical considerations for effective 5G deployment.
6.3. LOS and NLOS Impact
Figure 5 and Figure 6 compare the link budgets of UMa and UMi environments with receiver sensitivity under the influence of rain-induced attenuation at a rain rate of 162.08 mm/h.
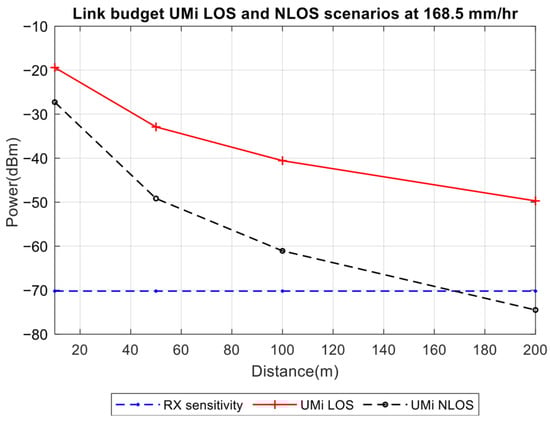
Figure 5.
Link Budget of UMi at 168.5 mm/h.
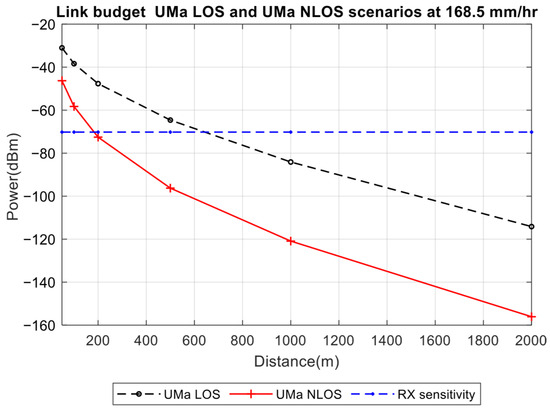
Figure 6.
Link Budget of UMa at 168.5 mm/h.
Figure 5 shows the link budgets for LOS and NLOS scenarios in a UMi environment along with the receiver sensitivity threshold. The link budget decreases linearly with distance in both scenarios due to the loss of the free-space path. However, in the NLOS scenario, the performance decreases faster than in the LOS case, which is probably due to additional losses due to diffraction, reflection, and shadowing. At a link distance of 200 m and a rain rate of 168.5 mm/h, the UMi LOS link remains above the receiver’s sensitivity threshold, ensuring a strong and reliable connection. Even under these conditions, which result in a rain attenuation of 5.7 dB, the LOS connection remains functional. In contrast, the UMi NLOS link budget drops below the receiver sensitivity threshold after 160 m, marking the maximum range for reliable communications in this configuration at the same rain rate. Figure 6 shows the link budget as a function of distance for UMa LOS and NLOS conditions. The received power in the NLOS scenario drops significantly faster than in the LOS scenario due to higher free-space path loss and additional attenuation factors.
At a rain rate of 168.5 mm/h, the NLOS link budget falls below the receiver sensitivity threshold at approximately 200 m, while the LOS link remains functional up to approximately 600 m. These distances represent the maximum reliable communication ranges for UMa NLOS and LOS links under these conditions. Beyond these distances, received power drops below −70 dBm, resulting in link failure if no countermeasures are taken.
As shown in Table 5, at a rain rate of 42.58 mm/h, UMi LOS links achieved the longest reliable range of approximately 200 m with a link margin of about 10 dB, closely followed by UMi NLOS links with the same range but a smaller margin of 0 dB. UMa LOS links maintained reliable communication up to around 1300 m with a margin of about 3 dB, while UMa NLOS links were limited to about 190 m with virtually no link margin. These results highlight the higher resilience of LOS configurations, particularly in urban macro environments.
Table 5.
Maximum link distances and margins under high (168.5 mm/h) and low (42.58 mm/h) rain intensity.
This study adopts a simulation-based approach due to the current lack of publicly available data on the deployment of mmWave 5G in South African urban environments. To enhance the robustness and practical relevance of the proposed models, future work will incorporate empirical validation. Planned activities include collecting real-world signal strength and rain attenuation measurements through collaborative field tests with local network operators in Pretoria, using drive testing, passive monitoring, and data from commercial 5G testbeds and weather stations. In addition, model performance will be validated against internationally recognized baselines, including ITU-R P.838 predictions and publicly available datasets from large-scale propagation measurement campaigns such as NYU WIRELESS and the METIS project.
7. Conclusions
This study highlights the significant impact of rain attenuation on path loss and link budgets for potential 5G mmWave deployments in Pretoria, South Africa, at 28 GHz. Path loss increases with distance and rainfall intensity, with negligible effects at short ranges but significant degradation over longer distances, particularly under heavy rainfall. Link budget analysis shows that LOS links consistently outperform NLOS links, maintaining functionality at greater distances. In UMi scenarios, LOS links remain operational up to 200 m under heavy rain, while NLOS links fail beyond 160 m. In UMa scenarios, LOS links support communication up to 600 m, while NLOS links are limited to approximately 200 m under similar conditions. At distances of 2000 m, the link budget for both UMi and UMa scenarios deteriorates sharply, with path loss increases of up to 33.5% in heavy rainfall. These findings emphasize the importance of rain attenuation in planning 5G mmWave networks. UMi deployments can achieve reliable connectivity with careful placement of small cells, while UMa deployments require advanced techniques, such as beamforming, advanced error correction, and network densification, to address significant rain-induced losses.
Author Contributions
Conceptualization, S.B.M.; investigation, S.B.M.; methodology, S.B.M. and P.A.O.; software, S.B.M.; supervision, P.A.O.; validation, S.B.M.; writing—original draft preparation, S.B.M. All authors have read and agreed to the published version of the manuscript.
Funding
The research was supported by Tshwane University of Technology.
Data Availability Statement
The authors declare that all the data are provided in the article text.
Conflicts of Interest
The authors declare no conflicts of interest.
Abbreviations
The following abbreviations are used in this manuscript:
| 5G | Fifth generation (mobile network technology) |
| mmWave | Millimetre wave |
| GHz | Gigahertz |
| LOS | Line-of-sight |
| NLOS | Non-line-of-sight |
| UE | User equipment |
| BS | Base station |
| UMi | Urban micro |
| UMa | Urban macro |
| RxSL | Received signal level |
| RxS | Receiver sensitivity |
| SNR | Signal-to-noise ratio |
| ITU-R | International Telecommunication Union—Radiocommunication Sector |
| CI | Close-In |
| FI | Floating intercept |
| A0.01 | Attenuation exceeded for 0.01% of the time |
| dB | Decibel |
| SISO | Single-input single-output |
| MIMO | Multiple-input multiple-output |
References
- Cox, C. An Introduction to 5G: The New Radio, 5G Network and Beyond; John Wiley & Sons: West Sussex, UK, 2020; pp. 1–89. [Google Scholar]
- Lin, X.; Lee, N. Introduction to 5G and beyond. In 5G and Beyond: Fundamentals and Standards; Springer: Cham, Switzerland, 2021; pp. 1–25. [Google Scholar]
- Ojo, J.; Ajewole, M.; Sarkar, S. Rain rate and rain attenuation prediction for satellite communication in Ku and Ka bands over Nigeria. Prog. Electromagn. Res. B 2008, 5, 207–223. [Google Scholar] [CrossRef]
- Isabona, J.; Imoize, A.L.; Rawat, P.; Jamal, S.S.; Pant, B.; Ojo, S.; Hinga, S.K. Realistic prognostic modeling of specific attenuation due to rain at microwave frequency for tropical climate region. Wirel. Commun. Mob. Comput 2022, 2022, 8209256. [Google Scholar] [CrossRef]
- Shi, J.S.; Siat, L.J.; Hong, Y.L. Atmospheric impairments and mitigation techniques for high-frequency earth-space communication system in heavy rain region: A brief review. Int. J. Integr. Eng. 2019, 11, 159–168. [Google Scholar]
- Ananya, S.T.; Islam, S.; Mahmud, A.R.; Podder, P.K.; Uddin, J. Atmospheric propagation impairment effects for wireless communications. Int. J. Wirel. Mob. Netw 2020, 12, 45–61. [Google Scholar] [CrossRef]
- Goldsmith, A.J.; Varaiya, P.P. Capacity of fading channels with channel side information. IEEE Trans. Inf. Theory 1997, 43, 1986–1992. [Google Scholar] [CrossRef]
- 3GPP. 3rd Generation Partnership Project Technical Specification Group Radio Access Network Study on Channel Model for Frequencies from 0.5 to 100 GHz (Release 18). In TR38.9012024. p. 98. Available online: https://www.freecalypso.org/pub/pub/GSM/3GPP/archive/36_series/36.300/36300-b70.pdf (accessed on 25 May 2022).
- Li, X.; Xie, L.; Zheng, X. The comparison between the Mie theory and the Rayleigh approximation to calculate the EM scattering by partially charged sand. J. Quant. Spectrosc. Radiat. Transf. 2012, 113, 251–258. [Google Scholar] [CrossRef]
- Wriedt, T. Mie theory: A review. In The Mie Theory: Basics and Applications; Springer Series in Optical Sciences; Springer: Berlin/Heidelberg, Germany, 2012; Volume 169, pp. 53–71. [Google Scholar]
- Bohren, C.F.; Huffman, D.R. Absorption and Scattering of Light by Small Particles; John Wiley & Sons: Hoboken, NJ, USA, 2008. [Google Scholar]
- Recommendation, I. Prediction Methods Required for the Design of Terrestrial Free-Space Optical Links; International telecommunication Union: Geneva, Switzerland, 2007; p. 1814. [Google Scholar]
- Afullo, T.J.O. Raindrop size distribution modeling for radio link design along the eastern coast of South Africa. Prog. Electromagn. Res. B 2011, 34, 345–366. [Google Scholar] [CrossRef]
- Rappaport, T.S.; MacCartney, G.R.; Sun, S.; Yan, H.; Deng, S. Overview of millimeter wave communications for fifth-generation (5G) wireless networks—With a focus on propagation models. IEEE Trans. Antennas Propag. 2017, 65, 6213–6230. [Google Scholar] [CrossRef]
- Ratul, R.H.; Zaman, S.M.; Chowdhury, H.A.; Sagor, M.Z.H.; Kawser, M.T.; Nishat, M.M. Atmospheric influence on the path loss at high frequencies for deployment of 5g cellular communication networks. In Proceedings of the 2023 14th International Conference on Computing Communication and Networking Technologies (ICCCNT), Delhi, India, 6–8 July 2023. [Google Scholar]
- Yunida, Y.; Maulana, A.; Nasaruddin, N. Performance Analysis of Pathloss Model for 5G mm Wave Communication System at 24 GHz, 30 GHz, and 32 GHz. In Proceedings of the 2023 2nd International Conference on Computer System, Information Technology, and Electrical Engineering (COSITE), Banda Aceh, Indonesia, 2–3 August 2023. [Google Scholar]
- Zhao, X.; Wang, Q.; Geng, S.; Zhang, Y.; Zhang, J.; Li, J. Path loss modification and multi-user capacity analysis by dynamic rain models for 5G radio communications in millimetre waves. IET Commun. 2019, 13, 1488–1496. [Google Scholar] [CrossRef]
- Chuan, L.L.; Roslee, M.B.; Sudhamani, C.; Mousa, I.M.S.; Waseem, A.; Osman, A.F.; Zaharah, A.F.; Ullah, Y. Impact of Rainfall on 5G Millimeter Wave Channels. Prog. Electromagn. Res. C 2024, 148, 97–107. [Google Scholar] [CrossRef]
- Rec, I. itu-r p. 838–3. Specific Attenuation Model for Rain for Use in Prediction Methods. International Telecommunication Union-ITU, fevereiro 2005: P. 838-3. Available online: https://www.itu.int/dms_pubrec/itu-r/rec/p/r-rec-p.838-3-200503-i!!pdf-e.pdf (accessed on 25 May 2022).
- Crane, R. Prediction of attenuation by rain. IEEE Trans. Commun. 1980, 28, 1717–1733. [Google Scholar] [CrossRef]
- Moupfouma, F. Electromagnetic waves attenuation due to rain: A prediction model for terrestrial or LOS SHF and EHF radio communication links. J. Infrared Millim. Terahertz Waves 2009, 30, 622–632. [Google Scholar] [CrossRef]
- Yusuf, A.A.; Falade, A.; Olufeagba, B.; Mohammed, O.; Rahman, T.A. Statistical evaluation of measured rain attenuation in tropical climate and comparison with prediction models. J. Microw. Optoelectron. Electromagn. Appl. 2016, 15, 123–134. [Google Scholar] [CrossRef]
- Ulaganathen, K.; Rahman, T.B.A.; Abdulrahman, A.Y.; Abd Rahim, S.K.B. Comparative studies of the rain attenuation predictions for tropical regions. Prog. Electromagn. Res. M 2011, 18, 17–30. [Google Scholar] [CrossRef]
- Ojo, J.; Adedayo, K.; Uchegbu, A. Evaluation of Simulated Rain-Based Attenuation Techniques at kv Frequency Bands for Satellite Services Under Different Modulation Techniques over Southwestern Nigeria. 2021. Available online: https://academicjournals.org/journal/IJPS/article-full-text-pdf/81DB02265819 (accessed on 25 May 2022).
- Dias, W.D.; Carleti, M.; Moreira, S.S.L.; Mendes, L.L. Evaluation of rain attenuation model s in satellite links under tropical and equatorial climates. IEEE Lat. Am. Trans. 2018, 16, 358–367. [Google Scholar] [CrossRef]
- ITU. P.837: Characteristics of Precipitation for Propagation Modelling. Available online: https://www.itu.int/rec/R-REC-P.837/ (accessed on 25 May 2022).
- Rappaport, T.S.; MacCartney, G.R.; Samimi, M.K.; Sun, S. Wideband millimeter-wave propagation measurements and channel models for future wireless communication system design. IEEE Trans. Commun. 2015, 63, 3029–3056. [Google Scholar] [CrossRef]
- Sun, S.; Rappaport, T.S.; Rangan, S.; Thomas, T.A.; Ghosh, A.; Kovacs, I.Z.; Rodriguez, I.; Koymen, O.; Partyka, A.; Jarvelainen, J. Propagation path loss models for 5G urban micro-and macro-cellular scenarios. In Proceedings of the 2016 IEEE 83rd Vehicular Technology Conference (VTC Spring), Nanjing, China, 15–18 May 2016. [Google Scholar]
Disclaimer/Publisher’s Note: The statements, opinions and data contained in all publications are solely those of the individual author(s) and contributor(s) and not of MDPI and/or the editor(s). MDPI and/or the editor(s) disclaim responsibility for any injury to people or property resulting from any ideas, methods, instructions or products referred to in the content. |
© 2025 by the authors. Licensee MDPI, Basel, Switzerland. This article is an open access article distributed under the terms and conditions of the Creative Commons Attribution (CC BY) license (https://creativecommons.org/licenses/by/4.0/).