Abstract
Integrated Sensing and Communication (ISAC) systems have emerged as a key component for Sixth Generation (6G) networks, enhancing resource efficiency and enabling diverse applications. Currently, ISAC systems have been recognized as a leading trend for future standardization, i.e., International Mobile Telecommunications (IMT)-2030. As in the previous IMT-2020 standardization, the emphasis has been on developing a methodology for assessing network conditions, with one of the crucial approaches incorporating system-level simulations. However, within this framework, there has been a notable absence of proposed abstractions for the physical layer of ISAC systems, which are valuable for system-level simulators. The physical abstraction process helps reduce computational simulation costs, enabling efficient and rapid evaluation of system conditions. Therefore, this paper aims to fill this gap by outlining the key aspects and metrics recommended for a physical layer abstraction in sensing applications within ISAC frameworks. Applying physical abstraction in the context of target localization and detection algorithms may enable an initial understanding and evaluation of ISAC system performance. These algorithms are proposed as an example of simulating the sensing functionalities to be abstracted, which are based on a stochastic geometric channel model. Orthogonal Frequency Division Multiplexing (OFDM) symbols play a crucial role in target position estimation. The findings show that doubling OFDM symbols improves the detection probability by 3 dB in terms of Signal to Noise Ratio (SNR). Finally, the proposed Physical Layer Abstraction (PLA) method produces performance metrics as figures and lookup tables tailored for system-level simulators.
1. Introduction
The transition from Fifth Generation (5G) to next generation communication systems (NGCS) marks the evolution towards a fully connected, intelligent society. This evolution is distinguished by the integration of artificial intelligence (AI) and sensing technologies into Sixth Generation (6G) networks [,], aiming to address the growing demands for higher speeds, lower latency, and greater reliability in mobile communications. A key innovation in this context is the development of Integrated Sensing and Communication (ISAC) systems. By merging sensing and communication functionalities within a single framework, ISAC systems promise to efficiently share spectrum and hardware resources. ISAC leverages millimeterWave (mmW) and Super High Frequency (SHF) bands, which offer wide bandwidths and enhanced spatial resolution, enabling precise sensing and high-speed communication []. This integration paves the way for diverse and novel applications anticipated in 6G networks.
In recent years, within the ISAC framework, recent technical advances in ISAC include signal processing methods [], ISAC channel modeling [,,], channel estimation techniques built on Machine Learning (ML)-based compressed sensing [], or even novel protocols that involve Quantium-ISAC []. In addition, the International Telecommunications Union (ITU) has declared it as one of the main trends in International Mobile Telecommunications (IMT)-2030 []. Given all the attention, the research community has primarily focused on advancements, often overlooking the need for a standardized framework to evaluate ISAC. In this context, [] proposes a methodology to evaluate ISAC, highlighting the main factors that must be considered in channel modeling, i.e., channel correlation between communication and sensing and spatial consistency. Even though the mentioned contribution describes one of the main elements of the physical layer, the authors do not mention any computational reduction solution for the simulation process. As we progress toward emulating a more comprehensive system, we anticipate increased complexity and higher computational costs, just like in predecessor technologies of Fourth Generation (4G) or 5G.
Evaluation through simulations has been segmented into link-level and system-level simulations in the literature and previous standardization []. According to the ITU, the link level evaluates aspects of the physical layer, and the system level assesses overall network conditions. In the context of system-level simulations, the physical layer abstraction has been instrumental in simplifying the detailed and exhaustive process of physical aspects like modulation or channel effects. Therefore, this abstraction process has been introduced to reduce the computational cost of system-level simulations in IMT-2020, enabling comprehensive evaluations of system performance and optimization strategies [,].
Given this background, it is reasonable to expect a similar trajectory for ISAC, as it remains a wireless technology. The abstraction of the physical layer should now be included in the ISAC framework. Moreover, ISAC is not only a technology that encompasses communication capabilities, but also sensing ones. Therefore, considering this concept, evaluating sensing services must be included in the evaluation process.
In sensing services, positioning and detection are highlighted in the literature [] and in the Third Generation Partnership Project (3GPP) Technical Specification (TS) 22.137 [] as the most prominent ISAC use cases. These services can serve as a starting point and be integrated into Physical Layer Abstraction (PLA). Nevertheless, the aforementioned intentions have not been found in the literature. PLA might have been neglected within the ISAC framework. New efforts and novel types of simulations are essential to provide future system simulators with abstractions that facilitate the analysis of ISAC systems.
Since there is still a lack of contributions addressing the abstraction of the physical layer in the ISAC framework, this paper aims to fill this gap with the following contributions:
- A background on PLA, emphasizing the rationale behind the approach and revitalizing key elements from the existing literature.
- A description of the proposed PLA method’s essential elements, focusing on those utilized in previous technologies, including channel generation and Signal to Noise Ratio (SNR).
- Two sensing services are considered, target location and detection, whose algorithms are formulated as examples of the PLA method.
- An evaluation of the sensing algorithms’ performance, offering quantitative insights.
- The mentioned evaluation is used to abstract the performance metrics of the algorithms.
As a result of this abstraction process, a set of lookup tables is generated, which can be incorporated into system-level simulations. The search tables are submitted to a repository available in [].
Notation: Matrices are denoted by bold uppercase letters, vectors are defined by bold lowercase letters, and the standard font represents scalars. The transpose conjugate is represented as .
2. ISAC Physical Layer Abstraction
Wireless network simulations have been divided into link-level and system-level simulations. On the one hand, link-level simulation refers to obtaining the performance of individual links. However, since the network can grow with many devices, it can increase the complexity of emulating other interferences or environmental features. Here, system-level simulations are dedicated to evaluating the entire system’s efficiency. Due to these characteristics, simulation costs can be very high in terms of time and computational costs.
Instead of modeling all of the complex and detailed physical layer operations, its abstraction can simplify the process during system-level simulations. The PLA method replaces simulations at the link level and provides a computationally efficient way to test the desired network. Typically, the information from PLA is delivered in lookup tables containing the pre-computed process and indexing operations stored inside an array.
Lookup tables have been widely used for PLA methods like Exponential Effective SNR Mapping (EESM), Effective SNR Mapping (ESM) [,,,], or Mutual Information (MI)-ESM []. These methods have appeared in the predecessor technologies of 4G and 5G. We can rescue from these methods the essential elements considered to perform the link abstraction process: a channel model and an established SNR. These elements form the foundation of our abstraction method. Figure 1 illustrates a flowchart of the proposed approach. In the channel generation component, we have incorporated the creation of communication and sensing channels for the ISAC system. In addition, we have developed a prior knowledge channel, a sensing channel without the presence of the target. Details of this channel generation process will be elaborated on in the following sections.
Figure 1.
General scheme of the proposed ISAC physical layer abstraction for sensing services.
Following the flowchart, we determine the communication SNR, the primary input for generating the sensing algorithms. Distance, positioning, and detection algorithms show the abstraction’s applicability, although other techniques or sensing services can be used. Then, this process generates lookup tables of the following Key Performance Indicators (KPIs) [] to obtain the estimated distance, position, and detection information:
- Position accuracy or error: This refers to the closeness of the measured position of the target or user to its true position value. In other words, the mean positioning error in the horizontal plane or 2D reference plane can also be considered the error on the vertical axis (i.e., the altitude). This KPI ensures that the data and results are trustworthy and can be used confidently.
- False alarm probability: This describes the conditional probability of falsely detecting the presence of a target object or environment when the target object or environment is not present.
- Detection probability: Conversely, the detection probability is the conditional probability of correctly detecting the presence of a target when the target is indeed present.
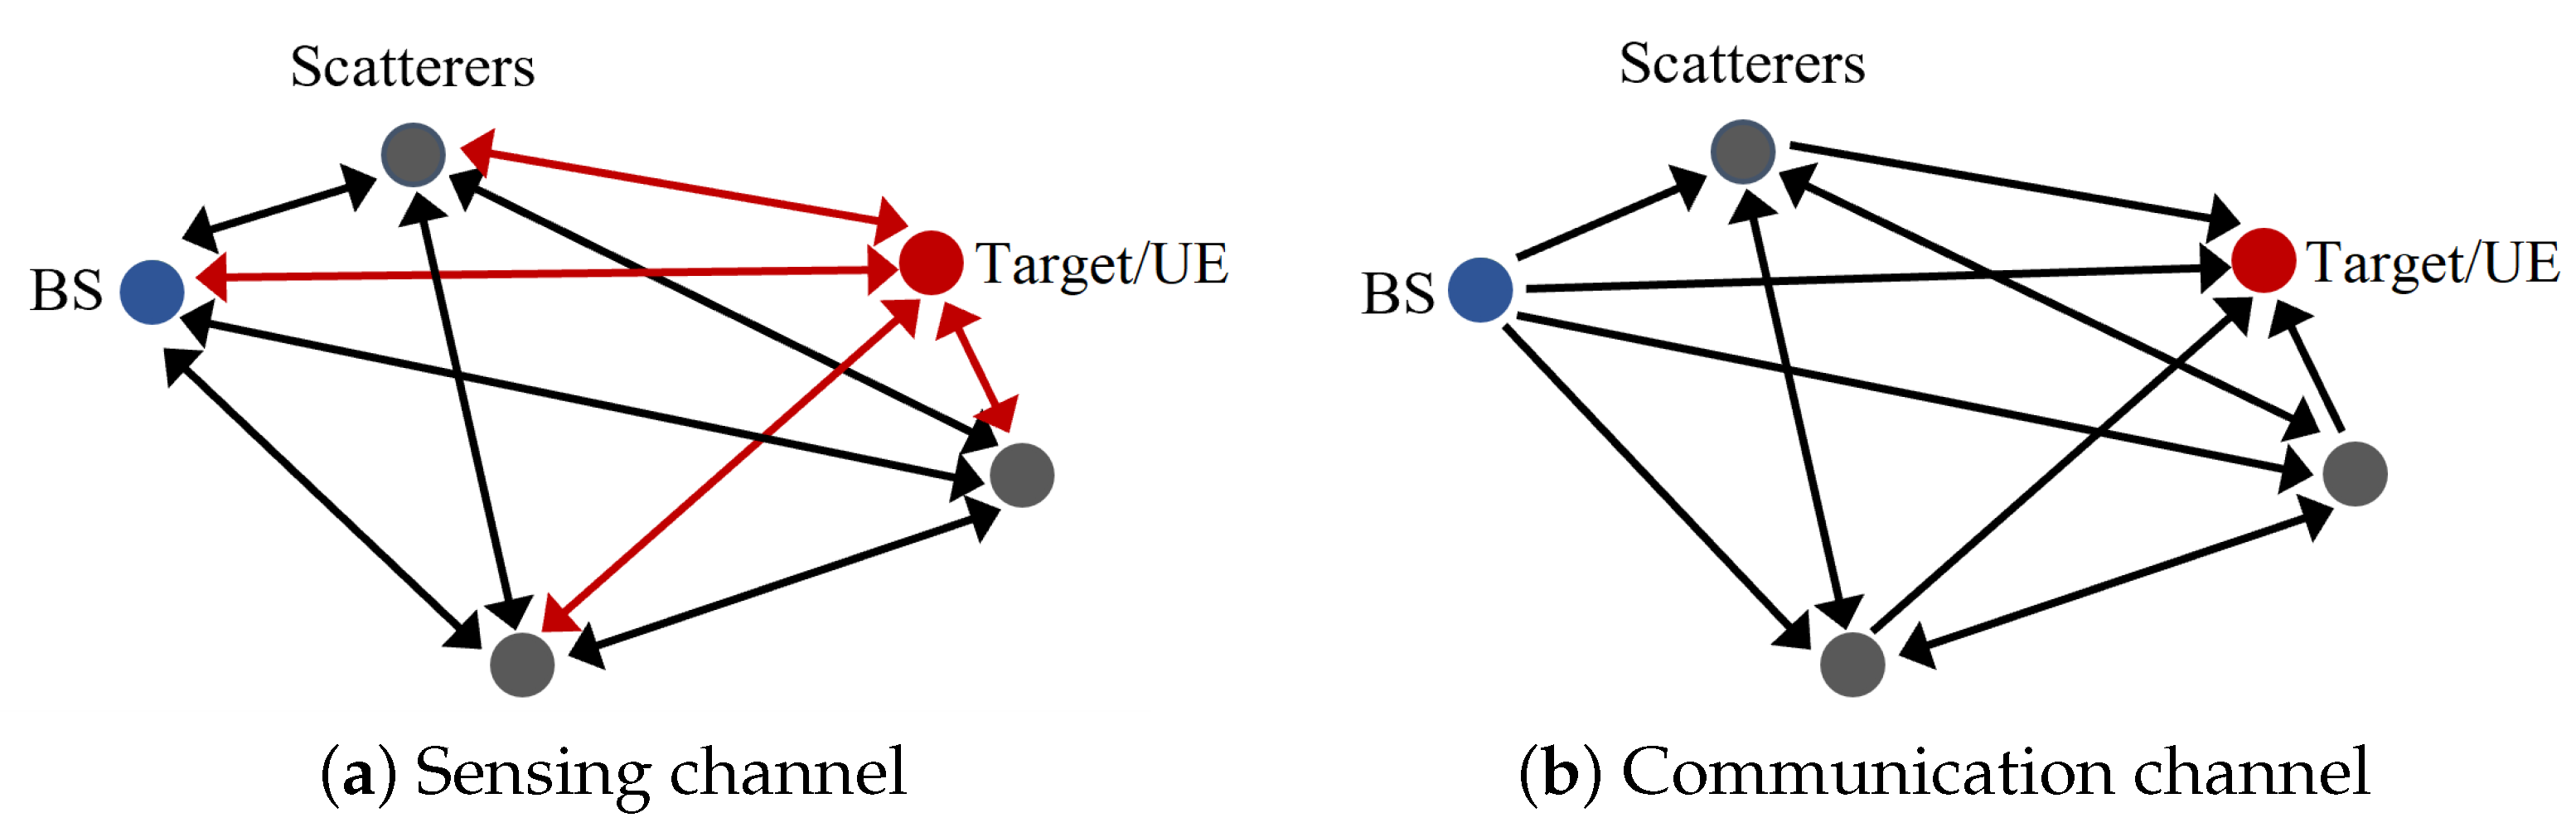
3. Main Elements of Abstraction: Channel and SNR Generation
The channel generation leverages the Stochastic Cluttered Environment (SCE) model from [], where scatterers are distributed randomly throughout the scenario and multiple signal hops are considered when generating the desired channels. Once the scatterers are located, the model facilitates the computation of channel matrices between various points within the system. For example, it models a Base Station (BS) functioning simultaneously as a transmitter and receiver, facilitating monostatic sensing applications. Additionally, it allows for the previous BS to serve as the transmitter and a distinct point to act as the receiver, thereby obtaining the communication channel between the two points.
In this paper, we consider a monostatic Orthogonal Frequency Division Multiplexing (OFDM) ISAC system, which is composed of a BS, a target, and a set of scatterers generated as in []. Figure 2 shows a representation of this system for the two possible channels: (a) the sensing channel and (b) the communication channel. The Multiple Path Components (MPCs) of both channels are represented as arrows. Round-trip red arrows represent target-involved MPCs; black arrows depict other MPCs. The black round-trip and one-way arrows in Figure 2b enclose the inherent MPCs for the communication-only channel.
Figure 2.
System model for (a) the monostatic sensing channel from the BS, and (b) the BS–target communication channel if the target acts as a receiver. Arrows represent direct links. The red arrows in the sensing channel represent the links involving the target.
We assume that the BS uses L transmitted OFDM symbols over K sub-carriers to sense the same scenario as the one represented in Figure 2a. Let M be the number of antennas at the BS. The received sensing signal at the BS after sensing the target and scatterers, for the l-th OFDM symbol and the k-th subcarrier, is
where is the sensing channel matrix, is the transmitted symbol vector, and is the noise vector.
To abstract the performance of the sensing applications, we need to use some measure of the channel quality that serves as a reliable indicator of this performance. In conventional communication systems, such measures are typically the SNR of the received signal. As depicted in Figure 2a, where the received signal of interest in (1) results from the sensing system, it is affected by all MPCs, even those not involved with the target (black arrows). Therefore, considering an SNR of the received sensing signal requires that the signal term account for the effect of all those MPCs. The primary challenge with this type of SNR is that certain MPCs devoid of interactions with the target may substantially contribute to the total signal power. For instance, scatterers near the BS can reflect a significant portion of the transmitted power. Consequently, the power of the sensing signal in (1) is not a good indicator of the performance of sensing applications.
Alternative measures of channel quality can be explored to overcome this problem. For example, by assuming that the target behaves like a conventional User Equipment (UE) in a communication system, it becomes feasible to focus on the communication channel between the BS and UE (target). In this scenario, the system model depicting this channel is illustrated in Figure 2b. In the context of the communication channel, all MPCs terminate at the target, thereby ensuring interaction with the target for all components. Assuming that the target behaving as a UE has a single antenna, the received signal at this UE is
where is the communication channel matrix, and is the noise vector for the l-th OFDM symbol and the k-th sub-carrier.
The received signal in (2) is considered to compute the SNR for the PLA method. Since all the MPCs associated with the received communication signal interact with the target, the resulting SNR serves as a reliable indicator for sensing applications. Assuming that the elements of are independent and identically distributed (i.i.d.) from a zero-mean and unit-variance normal distribution (i.e., the transmitted signal has a covariance matrix equal to the identity), the power of the signal in can be obtained as . Moreover, assuming that the noise is i.i.d. from a zero-mean normal distribution with variance , the noise power in is directly . Therefore, the communications SNR denoted for all the K sub-carriers of an OFDM symbol can be calculated as
4. Sensing Algorithms Generation: Target Detection and Localization
This section presents two algorithms that will be used to illustrate the simulation framework: one for target localization and another for target detection. As mentioned in the previous section, the received sensing signal in (1) includes all MPCs, even those that do not involve the target. In this case, it is essential to differentiate the part of the received sensing signal that contains relevant information about the target from the rest of the received signal. However, this is not an easy task. One way to address this problem is to perform background subtraction, as in []. To allow for this, the sensing BS needs to acquire previous sensing knowledge of the scenario without the target, i.e., to estimate the sensing channel corresponding to MPCs of only scatterers that are not the target of interest. This sensing channel comprises only the black arrows in Figure 2a and can be denoted as for the k-th sub-carrier. This channel can be obtained through environment reconstruction and channel estimation techniques, as proposed in [,]. Then, the effective sensing channel matrix can be defined as
where contains only those MPC involving the target, i.e., only the red arrows in Figure 2a. The following section presents a method to estimate .
4.1. Effective Sensing Channel Estimation
Although we assume that is known, note that is unknown to the BS, thus precluding the direct computation of (3). The BS can only obtain knowledge about from the received signal . However, as evident from (1), we must first eliminate the transmitted signal’s influence. To achieve this, we exploit the fact that the covariance matrix of the transmitted signal is the identity. In particular, we obtain
which, from (1), is
Now, we operate in (6) to obtain
The term is an estimator of the covariance matrix of the transmitted signal, which is, as mentioned before, the identity. Therefore, can be treated as an estimator of .
4.2. Distance and Angular Direction Estimation Algorithm
In this section, a localization algorithm based on the estimation of the sensing channel is presented. To extract the embedded information of , we can first acquire the taps of the channel using an Inverse Discrete Fourier Transform (IDFT), which allows us to identify the temporal sample where the target is located. This can be expressed as
where represents the impulse response of the channel at the n-th temporal sample. Given the expression in (7), we can evaluate the channel response when the BS emits power towards a specific Angle of Departure (AoD). This analytical process involves the utilization of steering vectors, , which denotes the antenna array’s configuration, where is the AoD. Then, the estimated energy of in a certain and at a certain temporal sample n is
The maximum of the energy is where the target is supposed to be, so the final step of this procedure is to estimate the values of and n by maximizing the energy as
The estimated sample is used to estimate the distance as
where c is the speed of light and is the sampling frequency. The next subsection will use the estimated angle .
A summary of the above steps is provided in Algorithm 1 to benefit the reader’s understanding.
| Algorithm 1 Distance and angle estimation algorithm |
| Input: , , , L Output: , ,
end for
|
4.3. Position Estimation Algorithm
After obtaining the estimated angle and distance of the target from Algorithm 1, we can estimate the position by applying basic geometry. Specifically, if the height of the target (i.e., ) and the coordinates of the BS, , are assumed to be known, the estimated UE coordinates can be calculated by solving for and from the following equations:
Thus, the estimated coordinates can be given as
4.4. Target Detection Algorithm
A target or user is detected when the energy of the effective channel at any given temporal sample n exceeds a pre-established threshold, denoted by . A Boolean variable “withTarget” is set to true in the algorithm when a target is detected and is false otherwise.
The determination of the threshold is of paramount importance and requires meticulous calibration. In this work, the threshold has been chosen as , where represents the mean energy of over time and corresponds to a selected constant factor. This formulation dynamically adjusts the threshold to match the scenario’s noise power. For the sake of clarity, a summary of the above steps is provided in Algorithm 2.
| Algorithm 2 Target detection algorithm |
| Input: , Output: withTarget
|
5. Evaluation and Abstraction
The proposed algorithms are evaluated in a stochastic scenario based on [], aligned with 3GPP Indoor Hotspot (InH) specifications []. This procedure involves an exhaustive series of simulations in which input parameters are detailed in Table 1. We used the carrier frequency recommended by 3GPP TR 38.901 in calibration process. Since our scenario is InH, a carrier frequency of 30 GHz was selected to obtain valuable information about the potential of the mmW band in ISAC system.
Table 1.
Simulation assumptions considered to evaluate KPIs and develop the lookup tables.
The BS location remains constant across all simulations to streamline the simulation process. In a 120 × 50 m hall, the UE is positioned at pre-determined distances 32 and 64 m from the BS. These distances represent the typical link lengths within this spatial configuration but in a random direction, ensuring a Line of Sight (LoS) condition.
A unique set of input parameters characterizes each simulation seed. This includes variations in the number of OFDM symbols (L) used for channel estimation, different SNR levels, and two possible distances between the BS and the UE. Outputs, such as distance and position target estimations, are given for these variations.
For the results analysis, we aim to define the distribution of the estimation errors; for this objective, we have conducted a post-processing methodology that will be described below.
5.1. Distance and Positioning Abstraction
Distance and positioning algorithms are evaluated using KPIs, including mean distance error () and mean positioning error (), as described in Section 2. These metrics can be obtained as
where J is the total number of simulation seeds, refers to the true distance from the BS to the target in the j-th seed, and and denote the true position coordinates of the UE.
Figure 3a,b illustrate the Cumulative Distribution Functions (CDFs) for and under varying OFDM symbols at 0 dB SNR, with the target positioned at 64 m. The scale shift is applied at a distance error equal to 5 m to zoom in and better visualize the values of the CDFs corresponding to errors around 0 m. Fitting these CDFs to known distributions is challenging because their extensive tails extend toward the maximum estimation error corresponding to the last OFDM symbol. This implies a non-negligible probability of the employed algorithms pinpointing the target in the last OFDM symbol.
Figure 3.
CDFs of the distance errors (a) and position errors (b) for OFDM symbols and SNR dB. Here, the target is positioned at m.
Two different estimation conditions are valid for the abstraction proposal in the CDFs. On the left-hand side, we can find the results obtained under target-dominated conditions, where the distance and position errors are observed to be low. On the right, it reveals that for extremely large estimation errors (exceeding 10 m), their behavior exhibits a linear trend, aligning with the characteristics of a uniform distribution. Thus, the CDFs are a mix of two different distributions, one of which is the uniform distribution. Under noise-dominated conditions, distance and position estimates become uniformly distributed, indicating equal probability across all possible target locations.
Considering all mapping levels of SNR (ranging from dB to 20 dB) and the full range of OFDM symbol values, the distribution curves exhibit minimal variation in distance and position error cases under target-dominated conditions. This description is illustrated in Figure 4a,b, where legends are omitted since multiple curves represent results across all possible values. This observation indicates that errors consistently follow the same distribution regardless of these two parameters.
Figure 4.
Approximated CDFs of the distance and positioning errors under target-dominated conditions for OFDM symbols applied for all SNR levels defined in Table 1. Here, the target is positioned at m.
Results of the probability of estimation under target-dominated conditions versus SNR and the number of OFDM symbols are calculated and provided as lookup tables, which are available in [].
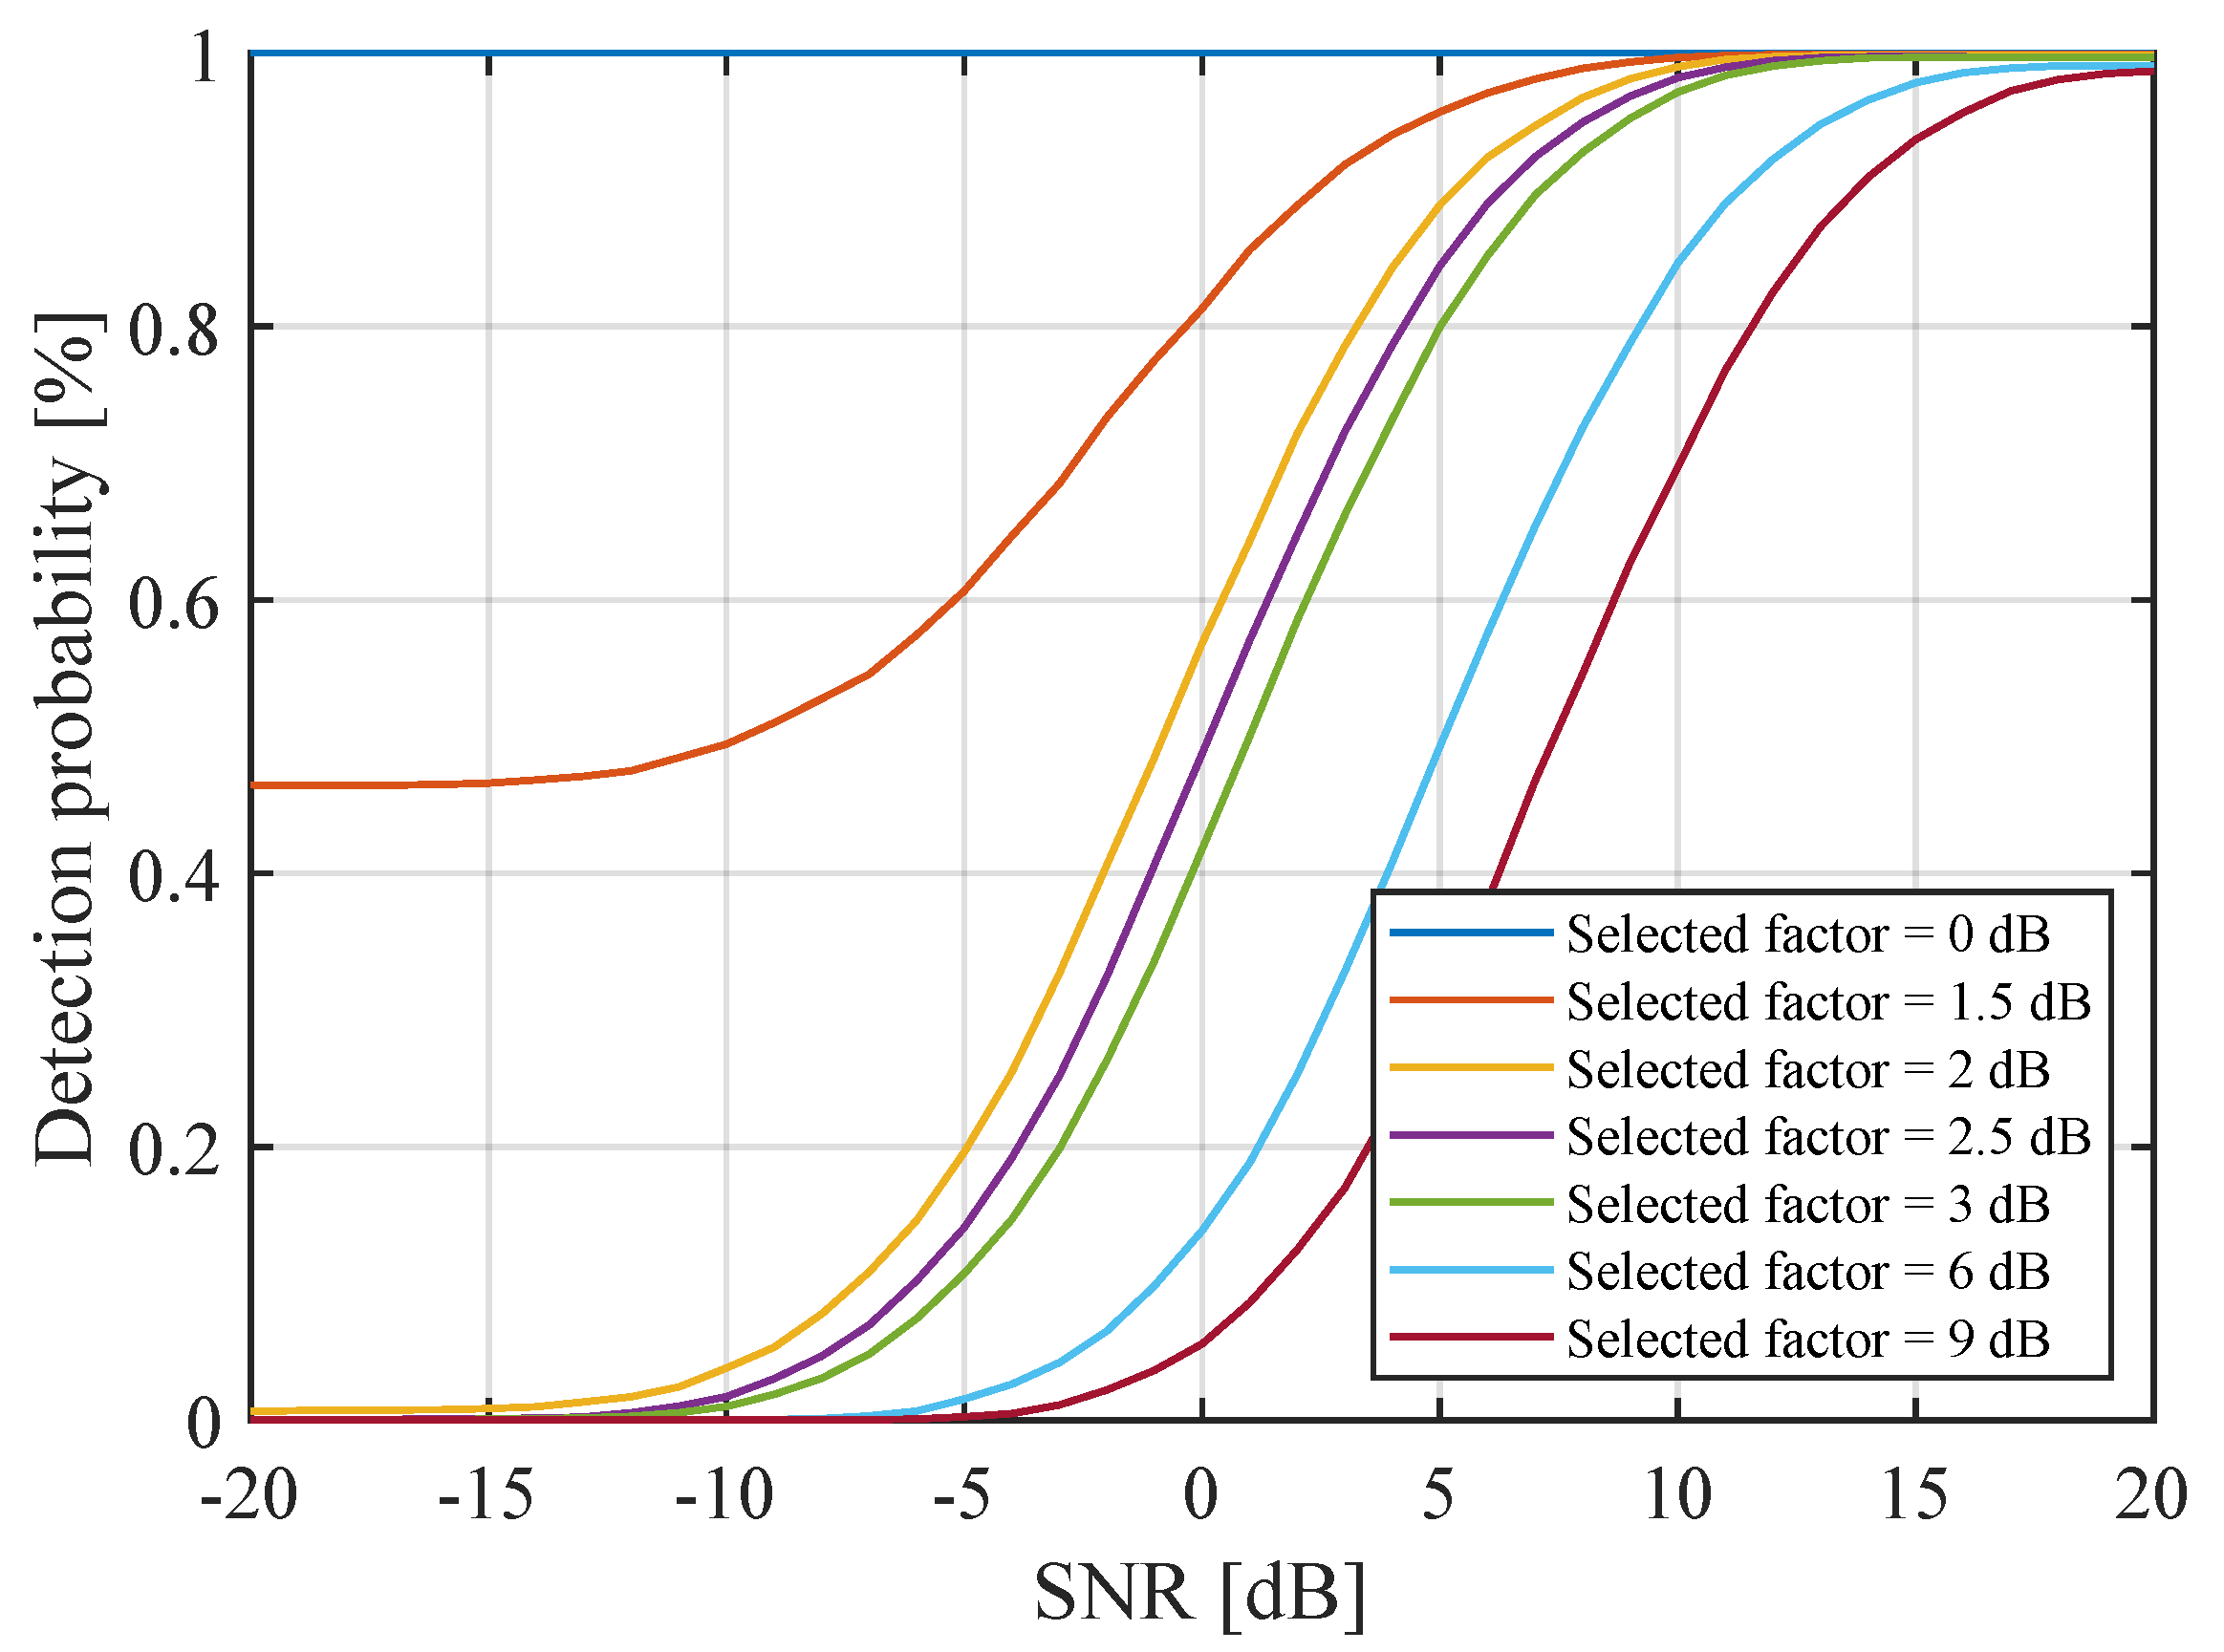
5.2. Target Detection Abstraction
Target detection abstraction is evaluated using false alarm probability and the detection probability , as detailed in Section 2.
A set of thresholds has been defined by selecting threshold values between 0 dB and 3 dB. The Boolean variable “withTarget” is stored to analyze and later for each simulation seed. Figure 5 shows the curves of the false alarm probability versus the selected threshold factor for two examples corresponding to extreme cases. First, the case where the SNR is dB and the algorithm uses only 2 OFDM symbols and, second, the case where the SNR is 20 dB, and the algorithm uses OFDM symbols. These curves show a notable decay in the false alarm probability as the threshold factor increases.
Figure 5.
False alarm vs. threshold factor, with the target at m.
To examine the effect of on the target detection probability, Figure 6 depicts this probability against various selected factors ranging from 0 to 9 dB. A correlation between the false alarm and target detection probabilities can be identified. For example, when dB, the probability of detection and false alarm reach 100%, meaning that the algorithm continuously detects targets even when the target is not present in the scenario. Nevertheless, If the threshold exceeds 3 dB, as shown by the light blue ( dB) and red lines ( dB), we are over-dimensioning the detection. In other words, we are being too strict, which likely increases the likelihood of incorrect detections.
Figure 6.
Detection probability vs. SNR for 8 OFDM symbols and different values of the selected factor, with the target positioned at m.
Conversely, we observe that with dB, the false alarm probability is close to 0%, according to Figure 5. This behavior yields a sufficiently reasonable detection probability concerning the SNR. In the case of over-dimensioning , the detection capability of the algorithm decreases since the curve is shifted towards increasing SNR values.
For the abstraction of the target detection algorithm, has been fixed at 3 dB, ensuring a null probability of false alarm. Figure 7 shows a clear relationship between the detection probability and the number of OFDM symbols for a given SNR. Doubling the number of OFDM symbols effectively achieves 3 dB improvement in SNR. Lookup tables illustrating the detection probability across various SNR values and OFDM symbol counts for these thresholds are available in [].
Figure 7.
Detection probability vs. SNR for different OFDM symbols.
6. Conclusions
This study addresses a critical gap in the abstraction of the physical layer for sensing applications within ISAC systems. By leveraging existing channel models and developing algorithms for target detection and localization services, we demonstrate the feasibility of abstracting performance metrics essential for future system-level simulations.
The findings highlight two distinct conditions for estimation: target-dominated, characterized by low errors, and noise-dominated, where high noise levels result in a uniform distribution of errors across all possible outcomes. We focused on the target-dominated condition to simplify the PLA process, which offers the most actionable insights for enhancing system accuracy and reliability. Furthermore, doubling the number of OFDM symbols was observed to achieve a 3 dB improvement in SNR, providing a straightforward method to enhance estimation and detection performance. Results are provided in lookup tables, publicly available in [], enabling comprehensive evaluations of sensing services within the ISAC framework.
Future work should expand this abstraction to encompass complex environments, such as Non Line of Sight (NLoS) scenarios, to enhance the robustness of ISAC systems and widen their applicability. Additionally, outdoor scenarios should be investigated to evaluate sensing services over extended distances. Furthermore, future studies should integrate additional sensing services beyond target detection and localization to create a more versatile and comprehensive abstraction framework.
Author Contributions
Conceptualization, A.R., S.I., D.C. and S.R.; methodology, A.R., S.I., D.C. and S.R.; software, A.R., S.I. and M.F.; validation, A.R., S.I., M.F., D.C., S.R. and J.F.M.; formal analysis, D.C., S.R. and J.F.M.; investigation, A.R., S.I. and M.F.; resources, A.R., S.I., M.F., D.C., S.R. and J.F.M.; data curation, S.I. and D.C.; writing—original draft preparation, A.R., S.I., M.F., D.C. and S.R.; writing—review and editing, A.R., D.C., S.R. and J.F.M.; visualization, J.F.M.; supervision, J.F.M.; project administration, J.F.M.; funding acquisition, J.F.M. All authors have read and agreed to the published version of the manuscript.
Funding
This research received no external funding.
Data Availability Statement
The research data has been provided in [].
Conflicts of Interest
The authors declare no conflicts of interest.
References
- Pin Tan, D.K.; He, J.; Li, Y.; Bayesteh, A.; Chen, Y.; Zhu, P.; Tong, W. Integrated Sensing and Communication in 6G: Motivations, Use Cases, Requirements, Challenges and Future Directions. In Proceedings of the 2021 1st IEEE International Online Symposium on Joint Communications and Sensing, Dresden, Germany, 23–24 February 2021; pp. 1–6. [Google Scholar] [CrossRef]
- Jiang, W.; Han, B.; Habibi, M.A.; Schotten, H.D. The road towards 6G: A comprehensive survey. IEEE Open J. Commun. Soc. 2021, 2, 334–366. [Google Scholar] [CrossRef]
- Ali, A.; Gonzalez-Prelcic, N.; Heath, R.W.; Ghosh, A. Leveraging Sensing at the Infrastructure for mmWave Communication. IEEE Commun. Mag. 2020, 58, 84–89. [Google Scholar] [CrossRef]
- Wei, Z.; Qu, H.; Jiang, W.; Han, K.; Wu, H.; Feng, Z. Iterative Signal Processing for Integrated Sensing and Communication Systems. IEEE Trans. Green Commun. Netw. 2023, 7, 401–412. [Google Scholar] [CrossRef]
- Rahman, M.L.; Zhang, J.A.; Huang, X.; Guo, Y.J.; Lu, Z. Joint communication and radar sensing in 5G mobile network by compressive sensing. IET Commun. 2020, 14, 3977–3988. [Google Scholar] [CrossRef]
- Zhang, Z.; He, R.; Ai, B.; Yang, M.; Li, C.; Mi, H.; Zhang, Z. A General Channel Model for Integrated Sensing and Communication Scenarios. IEEE Commun. Mag. 2023, 61, 68–74. [Google Scholar] [CrossRef]
- Calabuig, D.; Mrozowski, A.; Prado-Alvarez, D.; Monserrat, J.F.; Zhang, Y.; Yang, W.; Chen, Y.; Chen, Y. Stochastic Cluttered Environments for the Channel Modeling of ISAC Systems. In Proceedings of the 2023 IEEE Globecom Workshops (GC Wkshps), Lumpur, Malaysia, 4–8 December 2023; pp. 1195–1200. [Google Scholar] [CrossRef]
- Wang, H.; Hussain, F.; Wang, X.; Li, X.; Zhao, N.; Dev, K. Machine learning-enabled MIMO-FBMC communication channel parameter estimation in IIoT: A distributed CS approach. Digit. Commun. Netw. 2022, 9, 306–312. [Google Scholar] [CrossRef]
- Liu, Y.C.; Cheng, Y.B.; Pan, X.B.; Sun, Z.Z.; Pan, D.; Long, G.L. Quantum integrated sensing and communication via entanglement. Phys. Rev. Appl. 2024, 22, 034051. [Google Scholar] [CrossRef]
- ITU-R. Report ITU-R M.2516-0: Future Technology Trends of Terrestrial International Mobile Telecommunications Systems Towards 2030 and Beyond; Technical Report; ITU-R: Geneva, Switzerland, 2022. [Google Scholar]
- Ramos, A.; Mrozowski, A.; Prado-Alvarez, D.; Monserrat, J.F.; Zhang, Y.; Yu, Z.; Chen, Y. Evaluation Methodology for 6G Sensing-Assisted Communication System Performance. IEEE Access 2024, 12, 7841–7852. [Google Scholar] [CrossRef]
- ITU-R. Report ITU-R M.2412-0: Guidelines for Evaluation of Radio Interface Technologies for IMT-2020; Technical Report; ITU: Geneva, Switzerland, 2017. [Google Scholar]
- Chenand, L.; Chen, W.; Wang, B.; Zhang, X.; Chen, H.; Yang, D. System-level simulation methodology and platform for mobile cellular systems. IEEE Commun. Mag. 2011, 49, 148–155. [Google Scholar] [CrossRef]
- Lagen, S.; Wanuga, K.; Elkotby, H.; Goyal, S.; Patriciello, N.; Giupponi, L. New Radio Physical Layer Abstraction for System-Level Simulations of 5G Networks. In Proceedings of the ICC 2020—2020 IEEE International Conference on Communications (ICC), Dublin, Ireland, 7–11 June 2020; pp. 1–7. [Google Scholar] [CrossRef]
- 3GPP. TS 22.137 (V1.0.0): Service Requirements for Integrated Sensing and Communication; Stage 1 (Release 19); Technical Report; 3GPP: Nice, France, 2023. [Google Scholar]
- Ramos, A.; Inca, S.; Ferrer, M.; Calabuig, D.; Roger, S.; Monserrat, J.F. Lookup Tables: “Physical Layer Abstraction of Detection and Localization Algorithms in ISAC Systems”. Repository Link. 2024. Available online: https://rb.gy/e9my7u (accessed on 1 October 2024).
- Olmos Bonafé, J.J.; Ruiz Boqué, S.; García Lozano, M.; Martín Sacristán, D. Link abstraction models based on mutual information for LTE downlink. In Proceedings of the 11th MCM of COST 2100, Athens, Greece, 31 May–1 June 2010. [Google Scholar]
- Hanzaz, Z.; Schotten, H.D. Performance evaluation of Link to system interface for Long Term Evolution system. In Proceedings of the 2011 7th International Wireless Communications and Mobile Computing Conference, Istanbul, Turkey, 4–8 July 2011; pp. 2168–2173. [Google Scholar] [CrossRef]
- Mezzavilla, M.; Miozzo, M.; Rossi, M.; Baldo, N.; Zorzi, M. A lightweight and accurate link abstraction model for the simulation of LTE networks in ns-3. In Proceedings of the 15th ACM International Conference on Modeling, Analysis and Simulation of Wireless and Mobile Systems, New York, NY, USA, 21–22 October 2012; MSWiM’12. pp. 55–60. [Google Scholar] [CrossRef]
- Brueninghaus, K.; Astely, D.; Salzer, T.; Visuri, S.; Alexiou, A.; Karger, S.; Seraji, G.A. Link performance models for system level simulations of broadband radio access systems. In Proceedings of the 2005 IEEE 16th International Symposium on Personal, Indoor and Mobile Radio Communications, Berlin, Germany, 11–14 September 2005; Volume 4, pp. 2306–2311. [Google Scholar] [CrossRef]
- Ramos, A.; Keskin, M.F.; Wymeersch, H.; Inca, S.; Monserrat, J.F. Enhancing Sensing-Assisted Communications in Cluttered Indoor Environments Through Background Subtraction. In Proceedings of the 2024 IEEE Wireless Communications and Networking Conference (WCNC), Dubai, United Arab Emirates, 21–24 April 2024; pp. 1–6. [Google Scholar] [CrossRef]
- Huawei. 6G Integrated Sensing and Communication—Sensing-Assisted Environment Reconstruction and Channel Reconstruction; Technical Report 5; Communications of HUAWEI RESEARCH: Shenzhen, China, 2023. [Google Scholar]
- Huawei. Environment Reconstruction Based on Hybrid Aperture Sensing: Technologies and Applications; Technical Report 5; Communications of HUAWEI RESEARCH: Shenzhen, China, 2023. [Google Scholar]
- 3GPP. TR 38.901: Study on Channel Model for Frequencies from 0.5 to 100 GHz (Release 17); Technical Report; 3GPP: Nice, France, 2022. [Google Scholar]
Disclaimer/Publisher’s Note: The statements, opinions and data contained in all publications are solely those of the individual author(s) and contributor(s) and not of MDPI and/or the editor(s). MDPI and/or the editor(s) disclaim responsibility for any injury to people or property resulting from any ideas, methods, instructions or products referred to in the content. |
© 2025 by the authors. Licensee MDPI, Basel, Switzerland. This article is an open access article distributed under the terms and conditions of the Creative Commons Attribution (CC BY) license (https://creativecommons.org/licenses/by/4.0/).