Article

Torrefaction and Densification of Wood Sawdust for Bioenergy Applications

1
Department of Chemical and Biological Engineering, University of Saskatchewan, Saskatoon, SK S7N 5A9, Canada
2
National Hydrology Research Cente, Global Institute for Water Security, University of Saskatchewan, Saskatoon, SK S7N 3H5, Canada
3
Department of Mechanical Engineering, University of Saskatchewan, Saskatoon, SK S7N 5A9, Canada
4
Saskatoon Research and Development Centre, Agriculture and Agri-Food Canada, Saskatoon, SK S7N 0X2, Canada
5
Department of Arts and Sciences, School of Business, Saskatchewan Polytechnic, Saskatoon, SK S7K 3R5, Canada
*
Author to whom correspondence should be addressed.
Fuels 2022, 3(1), 152-175; https://doi.org/10.3390/fuels3010010
Submission received: 28 December 2021 / Revised: 1 February 2022 / Accepted: 12 February 2022 / Published: 7 March 2022
(This article belongs to the Special Issue Feature Papers in Fuels)

Abstract

:
In this study, wood sawdust as waste residue from wood processing mills was pretreated using torrefaction to improve fuel properties and densified to facilitate transportation. Sawdust was torrefied in a fixed bed reactor using inside temperatures (IT) of 230, 260 and 290 °C for 15, 30 and 45 min, residence time. Due to the low calorific value of the treatments, the outside temperature (OT) of the fixed bed reactor was used instead for a fixed duration of 45 min, which resulted in an increase in energy value by 40% for the most severe conditions. The mechanical strength of the pellets was enhanced by adding 20% binder (steam-treated spruce sawdust) to biochar, which improved the pellet tensile strength by 50%. Liquid by-products from the torrefaction process contained furfural and acetic acid, which can be separated for commercial uses. Thermochemical analysis showed better fuel properties of OT torrefied samples such as high fixed carbon (52%), low volatiles (41%) and lower oxygen contents (27%) compared to IT torrefied samples (18, 77 and 43%, respectively). Low moisture uptake of torrefied pellets compared to raw pellets, along with other attributes such as renewability, make them competent substitutes to fossil-based energy carriers such as coal.

1. Introduction

Due to a rising worldwide demand to gradually phase out fossil fuels and become carbon neutral by 2050 [1], renewable energy sources such as biomass are becoming increasingly important [2]. Provincial governments in Canada have introduced laws requiring coal-fired power plants to shut down to curb greenhouse gas emissions [3]. The Ontario government, for instance, was the first in North America to phase out coal-fired electricity generation plants [4]. Atikokan Generating Station, with a capacity of 205 MW, is currently the top bioenergy plant in North America, and utilizes only biomass as feedstock [3].
Biomass is a renewable, consistent, highly accessible (especially in Canada) and desirable fuel source [5] that has growth potential and can be utilized at a moderate thermo-ecologic cost [6,7]. Woody biomass is seen to be carbon neutral, as the carbon released in the course of combustion was captured throughout its growth [6,8]. Biomass usage for energy generation has expanded in many countries with the target of reducing global warming, improving employment and ensuring a reliable energy supply [9].
Nevertheless, the frequent use of biomass is primarily based on the economic production of biobased fuels and energy carriers compared to conventional fossil fuels. Biomass derived from forest residues are complicated fuels, as most thermal conversion processes tolerate very strict fuel quality, which is difficult to meet with biomass sources. A range of small particle sizes is needed to co-fire in gasifiers and coal-fired power plants. Woody biomass is fibrous and tenacious, which makes grinding difficult and costly. One of the obstacles to the large-scale application of biomass is the poor grindability of biomass feedstock. Additionally, other properties (e.g., high moisture content, bulkiness, and low energy value) of raw biomass are not desirable in terms of storage, handling, decomposition, and energy density [10].
Pelletization increases the bulk density of wood wastes from 40–200 kg/m3 to 600–1400 kg/m3 [11], which has been commonly implemented in wood pellet mills [12]. Wood pellets as an effective type of biomass for storage and transportation contain high energy density, which is 4 to 10 times that of wood wastes [13]. As a sustainable energy source, wood pellets emit an equivalent or a smaller amount of greenhouse gases in comparison to coal and other fossil fuels [13]. The potential production of wood pellets in Canada is estimated at 20–30 Mt per year, which can result in CO2 emissions decrease by 20–70 Mt annually [13]. The large portion of wood pellets utilized in North America is currently used only for home heating and cooking purposes. Considering the present high fuel prices, wood pellets have the potential of replacing natural gas and heating oil for district heating and power production [13].
When huge volumes of wood pellets are kept in silos or containers for long periods, some incidents such as self-ignition burning and accidental fire may occur [14]. Torrefaction of the wood may offer solutions to address the biological and thermal decomposition of wood pellets during storage. Torrefaction is the thermal treatment of biomass in an inert atmosphere and at relatively low temperatures (between 200 and 300 °C). Although mechanical structures are weakened via torrefaction, roughly 90% of the chemical energy is still retained [15]. The ultimate focus of torrefaction in biofuel processing is to maximize the energy density of wood residues while reducing their water absorbency [12]. Along with producing high-quality biofuels, torrefaction can be implemented in pyrolysis treatment as well [16,17,18]. Torrefaction produces liquid and gaseous by-products in addition to solid biochars [19].
Torrefied wood pellets have over 30% higher calorific value, 40% more bulk density, and over 80% more bulk energy density than typical wood pellets, which will substantially reduce the costs of long-range transportation. Canada is already a large producer and supplier of wood pellets to the world, and due to its huge forest resources and strategic position, it can become the world’s top wood pellet producer in the near future. As a result, torrefaction may be ideal for Canadian wood pellets to be shipped to overseas markets [13]. Due to their hydrophobicity and high energy value, torrefied bio-pellets are considered to be perfect for thermal power stations replacing coal [13]. Koukios reported in his work that energy values are more than 20 GJ/m3 for torrefied softwood, olive kernels and straw [20]. According to Bergman et al. [21], torrefied wood pellets contain a low heating value (LHV) of 20.4–22.7 GJ/t, bulk densities of 750–850 kg/m3 and bulk energy densities of 14.9–18.4 GJ/m3. Another work by Wang et al. [4] showed that the grinding energy for torrefied pellets is half of that required for grinding non-treated pellets.
Torrefaction improves biomass grindability, calorific value and hydrophobicity; however, it makes densifying torrefied material into pellets more challenging. Subsequently, pellets have a lower mass density and low durability [21]. Based on the results of Li et al. [22], following torrefaction and densification of wood sawdust, the severity of torrefaction treatment increased the hardness and decreased the moisture uptake of pellets. As a solution, Peng et al. [12] showed that torrefied pellet characteristics can be enhanced by raising die temperature and adding moisture to torrefied wood sawdust, although densifying torrefied samples into pellets still requires more energy.
Other issues of torrefied sawdust with reactive small particles are the dust handling hazards like fire and explosion [23]. Hence, densification using additives such as lignin, starch, moisture, and glycerin have been introduced to bind the particles together along with improving torrefied pellet properties. Wu looked into using lignosulphonate and starch as binders for pelletizing torrefied sawdust made from southern pine at 300 °C [24]. In another work by Malory, starch was used as an additive for enhancing features of torrefied bio-pellets [25]. The commonly used binders including lignin and starch can improve particle adhesion forces; however, they are costly, and starch is a food ingredient [15]. This research explored the optimal thermal conditions for torrefaction of wood sawdust in an inert atmosphere while intending to improve the calorific value and physical and mechanical properties of torrefied sawdust for producing solid biofuel pellets. Furthermore, the thermochemical properties of torrefied woody biomass for energy generation pathways have been evaluated. In this study, steam-treated spruce sawdust as a cheap and non-food-based binder was introduced to the densification step after torrefaction of wood sawdust in a batch torrefaction unit (BTU).

2. Materials and Methods

The pretreatment and processing of wood sawdust were performed as per Figure 1 and details are explained in subsequent sections. As the wood sawdust had very fine and dry particles (mostly less than 1 mm), it did not need to be ground or dried. Hence, much energy was saved through the preprocessing of wood sawdust.

2.1. Feedstock Preparation

A batch of mixed sawdust was collected from the sawmill yard of the NorSask Forest Products LP (Meadow Lake, SK, USA) and was subjected to the torrefaction process. The moisture content of sawdust was around 8% and after screening with appropriate sieves for removing irregular particles, they were ready for the pretreatment step. The particle size analysis was carried out according to EN 15149-2 standard for solid biofuels [26,27,28]. The measurement procedure of bulk and particle densities was described in Adapa et al.’s previous study [29]. The bulk densities of raw and torrefied samples were calculated considering the mass and volume of a standard cylindrical steel container with half-litre volume (SWA951, Superior Scale Co. Ltd., Winnipeg, MB, Canada). For determining the bulk density of known mass samples, they were filled in the gas multi pycnometer (QuantaChrome, Boynton Beach, FL, USA) and the volume of the sample was estimated.

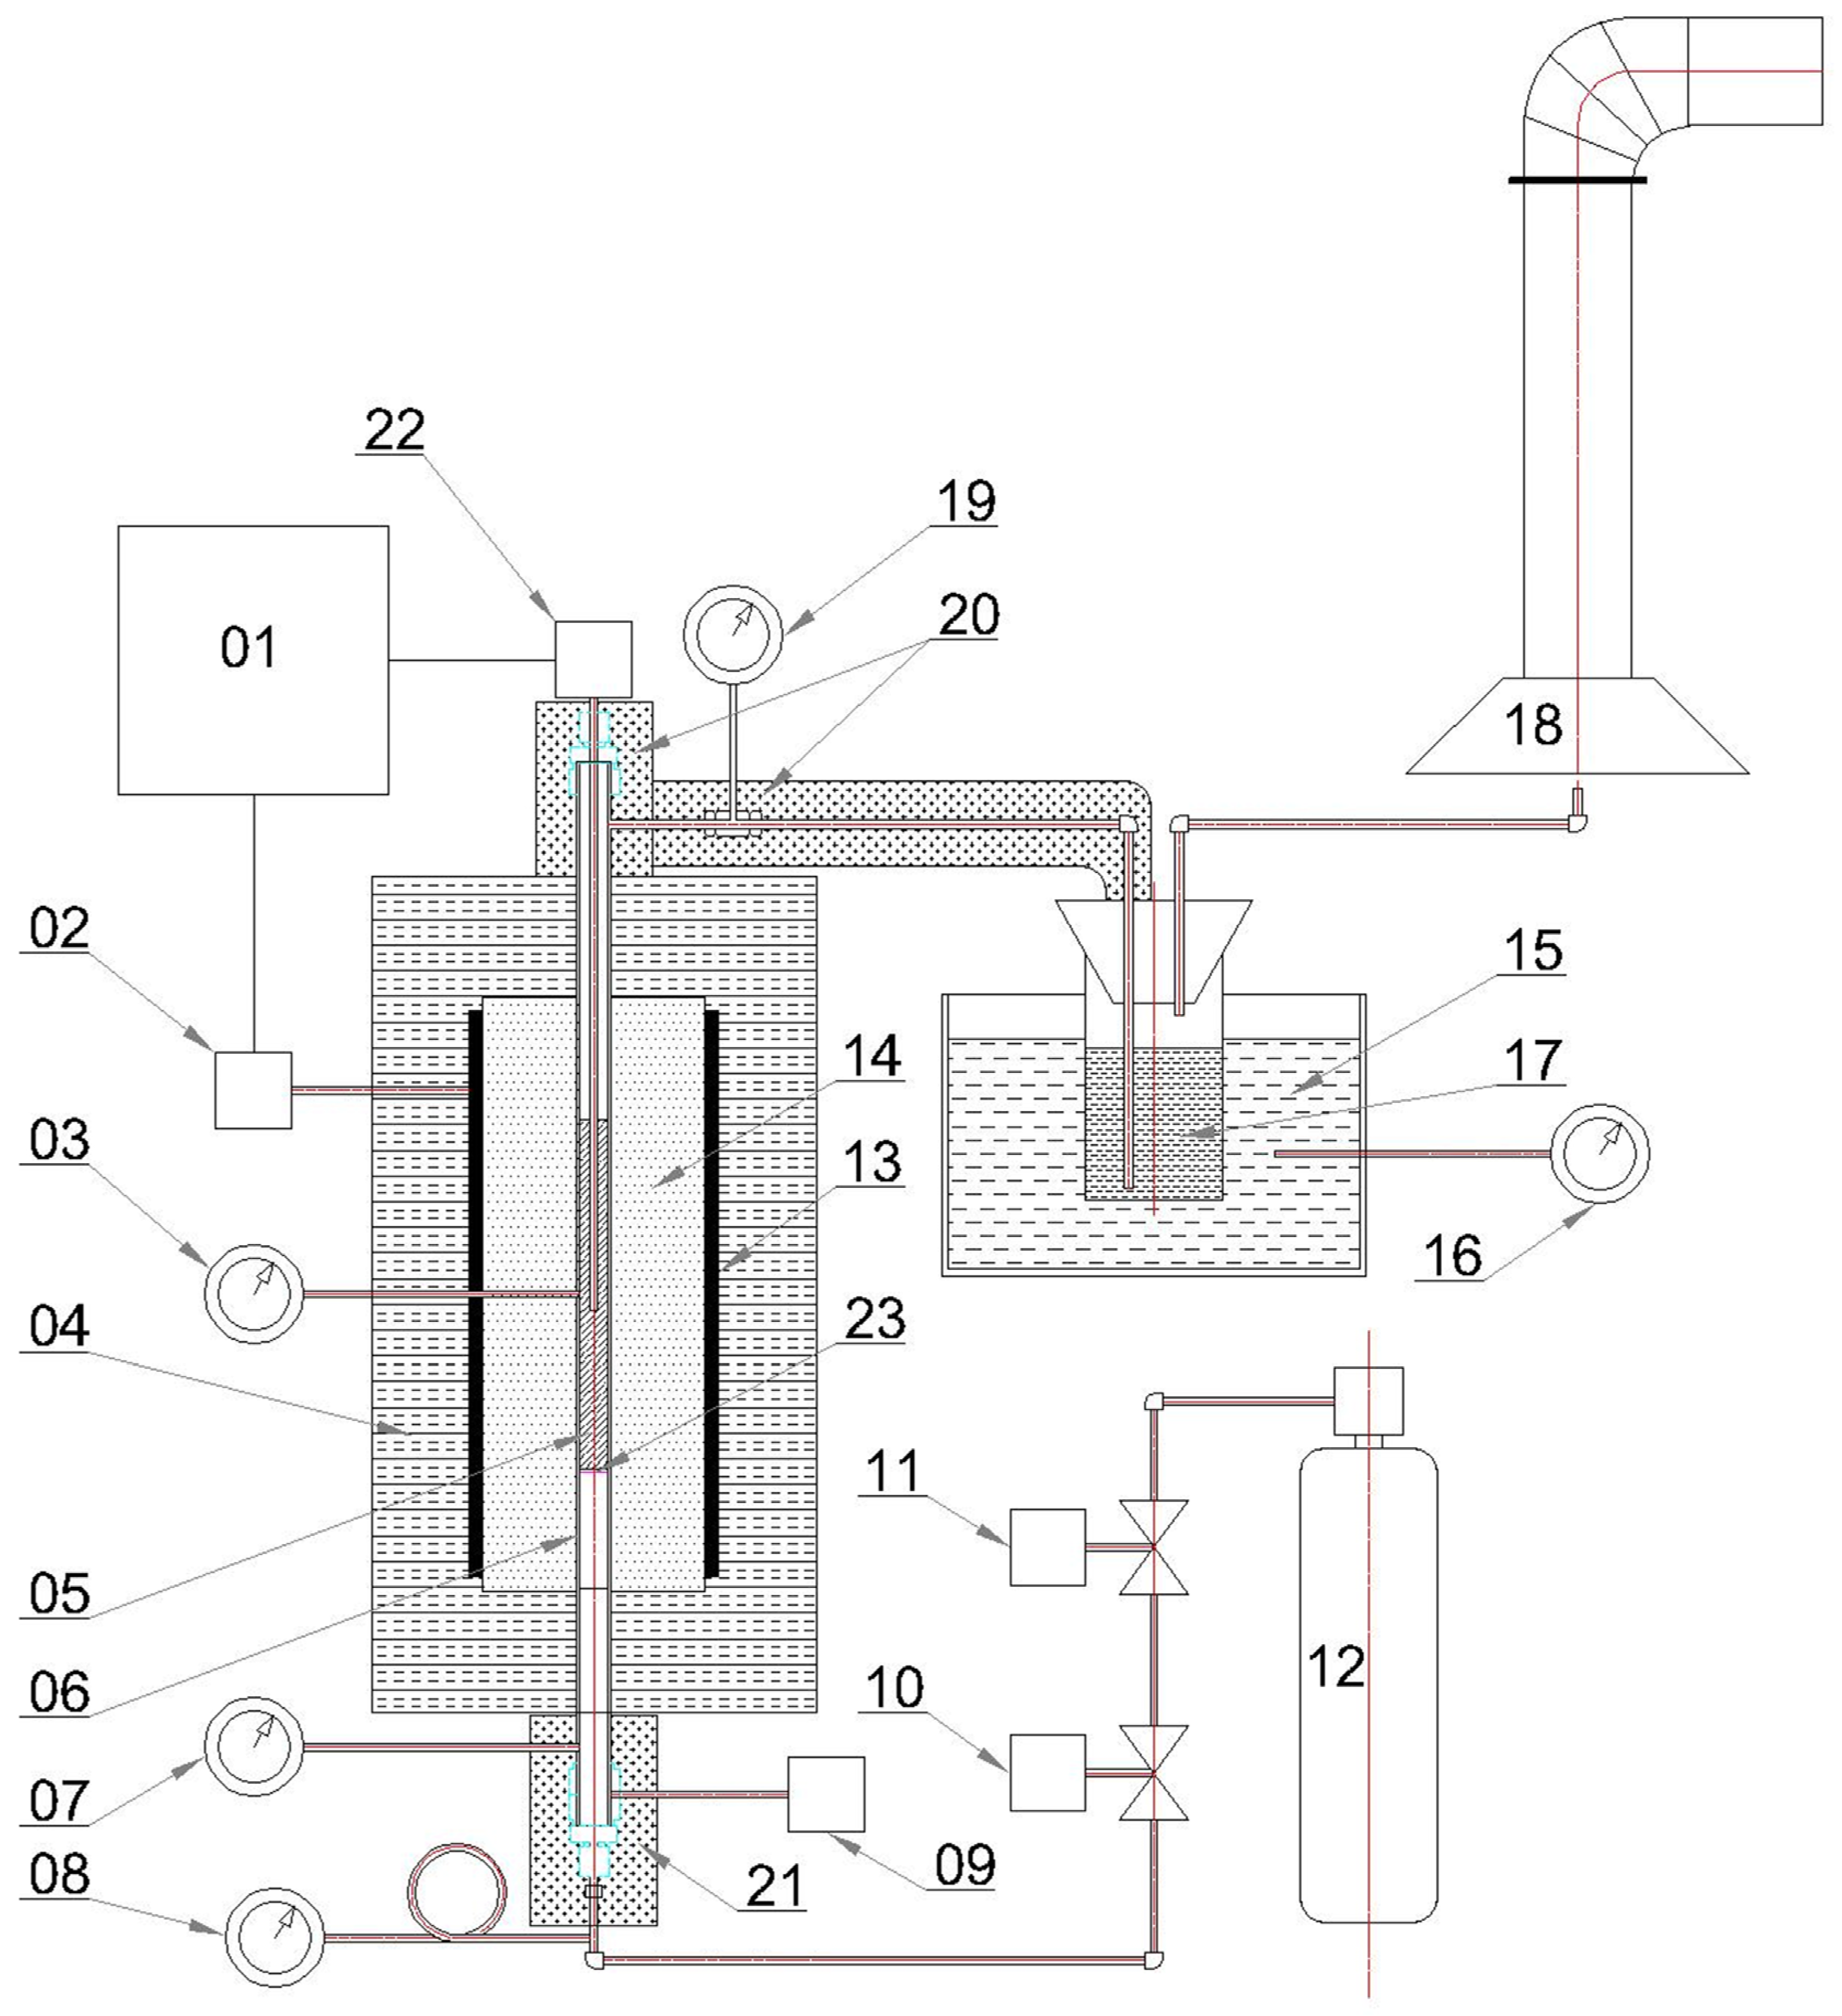
2.2. Torrefaction Process

The setup for the batch torrefaction of biomass in a (22 mm diameter) reactor that is suitable for fine particle feedstocks like sawdust is shown in Figure 2. This unit can hold up to 100 mL (10–11 g) of wood sawdust for each batch. It was heated by a 1 kW tube furnace and several heating tapes, operating up to 325 °C. Temperature was measured by a thermocouple in the centre of the biomass within the reactor. Nitrogen was fed from the bottom and flow was controlled by a mass flow controller, which could be set up to 500 mL/min; however, for consistent nitrogen flow to the chamber, it was fixed at 21 mL/min. The energy consumption was measured by a Kill A Watt® device, which could monitor the power usage during the process. This unit was preheated to the desired temperature and then the biomass was loaded from the top (while the unit was hot) and subsequently restarted. For recovery of the condensed liquor from the torrefaction process, the exhaust gas was passed through 60 mL glass jars suspended in a saline/ice bath. The exhaust gas from the reactor flowed through two stages of these condensers. To recover the solid product after the experiment, the apparatus was completely disassembled and then the reactor turned upside down and the material unloaded. For the second experiment, the OT indicating furnace temperature was used for comparing torrefied samples at two sets of recorded temperature and their variance during residence time.
For evaluating the degree of torrefaction, a severity factor which is a function of torrefaction temperature and residence time was estimated [31]. Equation (1) describes the severity factor for torrefaction treatment.
R 0 = log   exp [ T 100 14.75 ] dt
where R0 specifies the severity of the treatment, T is the torrefaction temperature (°C), and t is the residence time (min).

2.3. Densification

For biomass densification, water is regarded as a natural binder and lubricant [23]. Before pelletization, biochar was kept in sealed plastic bags and conditioned with a predetermined amount of water to reach an equilibrium moisture content of 10% during 72 hrs cold storage (4 °C) in the fridge. Then it was mixed with or without binders such as steam-treated sawdust at various proportions (10 and 20%). An Instron universal machine (Model 3366R4848 Instron Corp., Norwood, MA, USA) was used for single pelleting from torrefied and non-torrefied materials. Based on the results of Li and Liu [32], and Liu et al. [33], the optimum compression pressure for densifying sawdust was between 100–138 MPa, hence in this study, the compaction pressure was set at 110 MPa. The glass transition temperature (Tg) of lignin for wet conditioned biomass (8–10% moisture content) is in the range of 60–100 °C [34]. In the current study, the die temperature was fixed at 95 °C for simulating commercial pelleting conditions. One important factor for producing a durable pellet is the holding time of materials inside the die that should be taken to account [23]. After compressing the materials using the preset pressure (110 MPa), they were retained for 1 min to prevent the spring-back effect of wood particles [35,36], then the pellets were ejected and cooled for quality measurements. Hence, pellet properties such as pellet density, dimensional stability and tensile strength were determined according to the pertinent standards [35]. Biochar properties like bulk density, ash content, and energy value were included as attributes to find optimized conditions of torrefied material.

2.3.1. Pellet Density and Dimensional Stability

The unit pellet density was calculated from the mass and volume of single pellets. The diameter and length of an individual pellet were measured using a digital calliper to calculate its volume. More than six single pellets were selected for pellet density measurement, and average values were presented [21]. The relaxed density of pellets after 14 days from their formation was compared with immediate density and then using the pellets volumes, dimensional stability was determined according to Equation (2):
Dimensional   Stability = Vol 14     Vol 0 Vol 0 × 100 %  
where Vol0 is the volume of pellets immediately after pelleting (mm3) and Vol14 is the volume of pellets after 14 days (mm3).

2.3.2. Tensile Strength

In order to determine the tensile strength of one pellet, it was cut to a thickness of 2–2.5 mm. Then a compression force that moves against the sides of pellets was applied to make them break into two halves. This was the ideal tensile fracture for pellets according to Fell and Newton [37,38], and other fracture modes which were not cracked symmetrically in parallel to loading force were ignored [35]. For every test, data from force displacement charts were collected for estimating the applied stress and strain in pellets [39]. According to Gilvari and co-workers [39], the stress–strain behaviours of pellets could be influenced by different origins, pretreatment and densification processes [39]. The breaking force was saved for calculating the tensile strength of the pellet. Overall, ten replicates were performed for estimating tensile strength, which was calculated based on Equation (3):
σ x = 2 F π dl
where F is the breaking load (N), d is the diameter (m) of specimens, and l is the thickness (m) of the specimens [21].

2.4. Statistical Analysis

A quadradic surface model was used to predict the data for seven different responses using two factors of time and temperature change during the torrefaction experiment. The chosen design was central composite design (CCD) for optimizing the experiment runs. The code levels of CCD for the torrefaction experiment are presented in Table 1.
The quadratic equation [Equation (4)] was suggested to fit the resultant data, which calculated the impact of independent variables on the total responses. The response variables (y) as given in Equation (4), included bulk density (kg/m3), particle density (kg/m3), ash content (%), HHV (MJ/kg), pellets density (kg/m3), tensile strength (MPa) and dimensional stability (%).
y n = β 0 + i = 1 2 β i X i + i = 1 2 β ii X i 2 + i = 1 2   j = i + 1 2 β ij X i X j + ε   ( n = 1 ,   2 ,   3 ,   4 ,   5 ,   6 ,   7 )

2.5. Sample Analysis and the Mass and Energy Yields

The particle size analysis of treated and raw sawdust along with normal distribution indices (Skewness, Shapiro–Wilk, and Kurtosis) were carried out according to pertinent standards mentioned here [26,40]. The neutral detergent fibre (NDF) and acid detergent fibre (ADF) and lignin amount of torrefied and non-torrefied samples were determined according to the fibre analysis methods (ANKOM methods 5, 6 and 8) in a previous Valdez et al. study [41]. The cellulose amount was determined by subtraction of lignin from ADF. Hemicellulose content was estimated from the difference between ADF and NDF [36]. The thermal analysis of the raw and torrefied samples was conducted by using Q500 equipment (TA instruments, New Castle, DE 19720, USA). Around 15 mg of each sample was heated at 10 °C/min from the ambient temperature to 600 °C and the change in weight was recorded to produce the thermal gravimetric analysis (TGA) curve. Proximate analysis of samples (volatile matter, and ash content) was carried out by the following methods presented in ASTM D3175-20 and ASTM D3174-12 respectively [42,43,44]. The fixed carbon was estimated by their difference. The amounts of carbon, nitrogen, hydrogen and sulphur in the torrefied and non-torrefied samples were determined using a Vario EL cube CHNS elemental analyser (Elementar Americas, Inc., Ronkonkoma, NY, USA), while the oxygen content was assessed by the difference between total mass and mass of N, S, C, H and ash [45]. The heating values of torrefied and non-torrefied pellets were evaluated using a bomb calorimeter (Parr Instrument Company, Moline, IL, USA) according to ASTM D5865-19 [46]. The mass and energy yields of torrefied samples were calculated according to Equations (5) and (6):
Mass   Yield   ( % ) = Mass   of   product Mass   of   raw   biomass × 100  
Energy   Yield   ( % ) = Mass   Yield HHV   of   product HHV   of   raw   biomass

2.6. Liquor Analysis and GC/MS

The pH of each torrefied liquor was measured using a pH meter and reported in the results. For a detailed analysis of thermal degradation and by-products of torrefied or pyrolysis samples, gas chromatography-mass spectrophotometer (GC-MS) has been utilized in recent studies [19,47,48,49,50]. The condensed liquor products were assessed using a GC-MS system equipped with a TRACETM 1310 gas chromatograph and a TSQ Duo Triple Quadrupole mass spectrometer (Thermo ScientificTM, Waltham, MA, USA). The samples were diluted five times with acetone and filtered with a 0.2-micron PTFE membrane to reach a 0.2 μL volume for injection. GC column was a Thermo Scientific TG-SQC 15.0 m × 0.25 mm I.D. × 0.25 μm film capillary column. The oven temperature was regulated as follows: (1) 40 °C for 15 min; (2) from 40 to 70 °C at a heating rate of 2 °C min−1; and (3) the capillary column was kept at 70 °C for 15 min; (4) from 70 to 100 °C at a heating rate of 2 °C min−1; and (5) the capillary column was kept at 100 °C for 15 min; (6) from 100 to 200 °C at a heating rate of 5 °C min−1; and (7) the capillary column was kept at 200 °C for about 5 min. The inlet temperature was 300 °C and the total GC run took 100 min. Helium at a flow rate of 1.2 mL min−1 was utilized as the carrier gas. For this study, the existence of volatile components was confirmed if it showed a higher matching rate (hit 1 out of 3) according to the MS database. Data were acquired using the timed-SRM mode, processed and reported using Thermo ScientificTM ChromelonTM 7 Chromatography Data System software, version 7.2.2.6890.

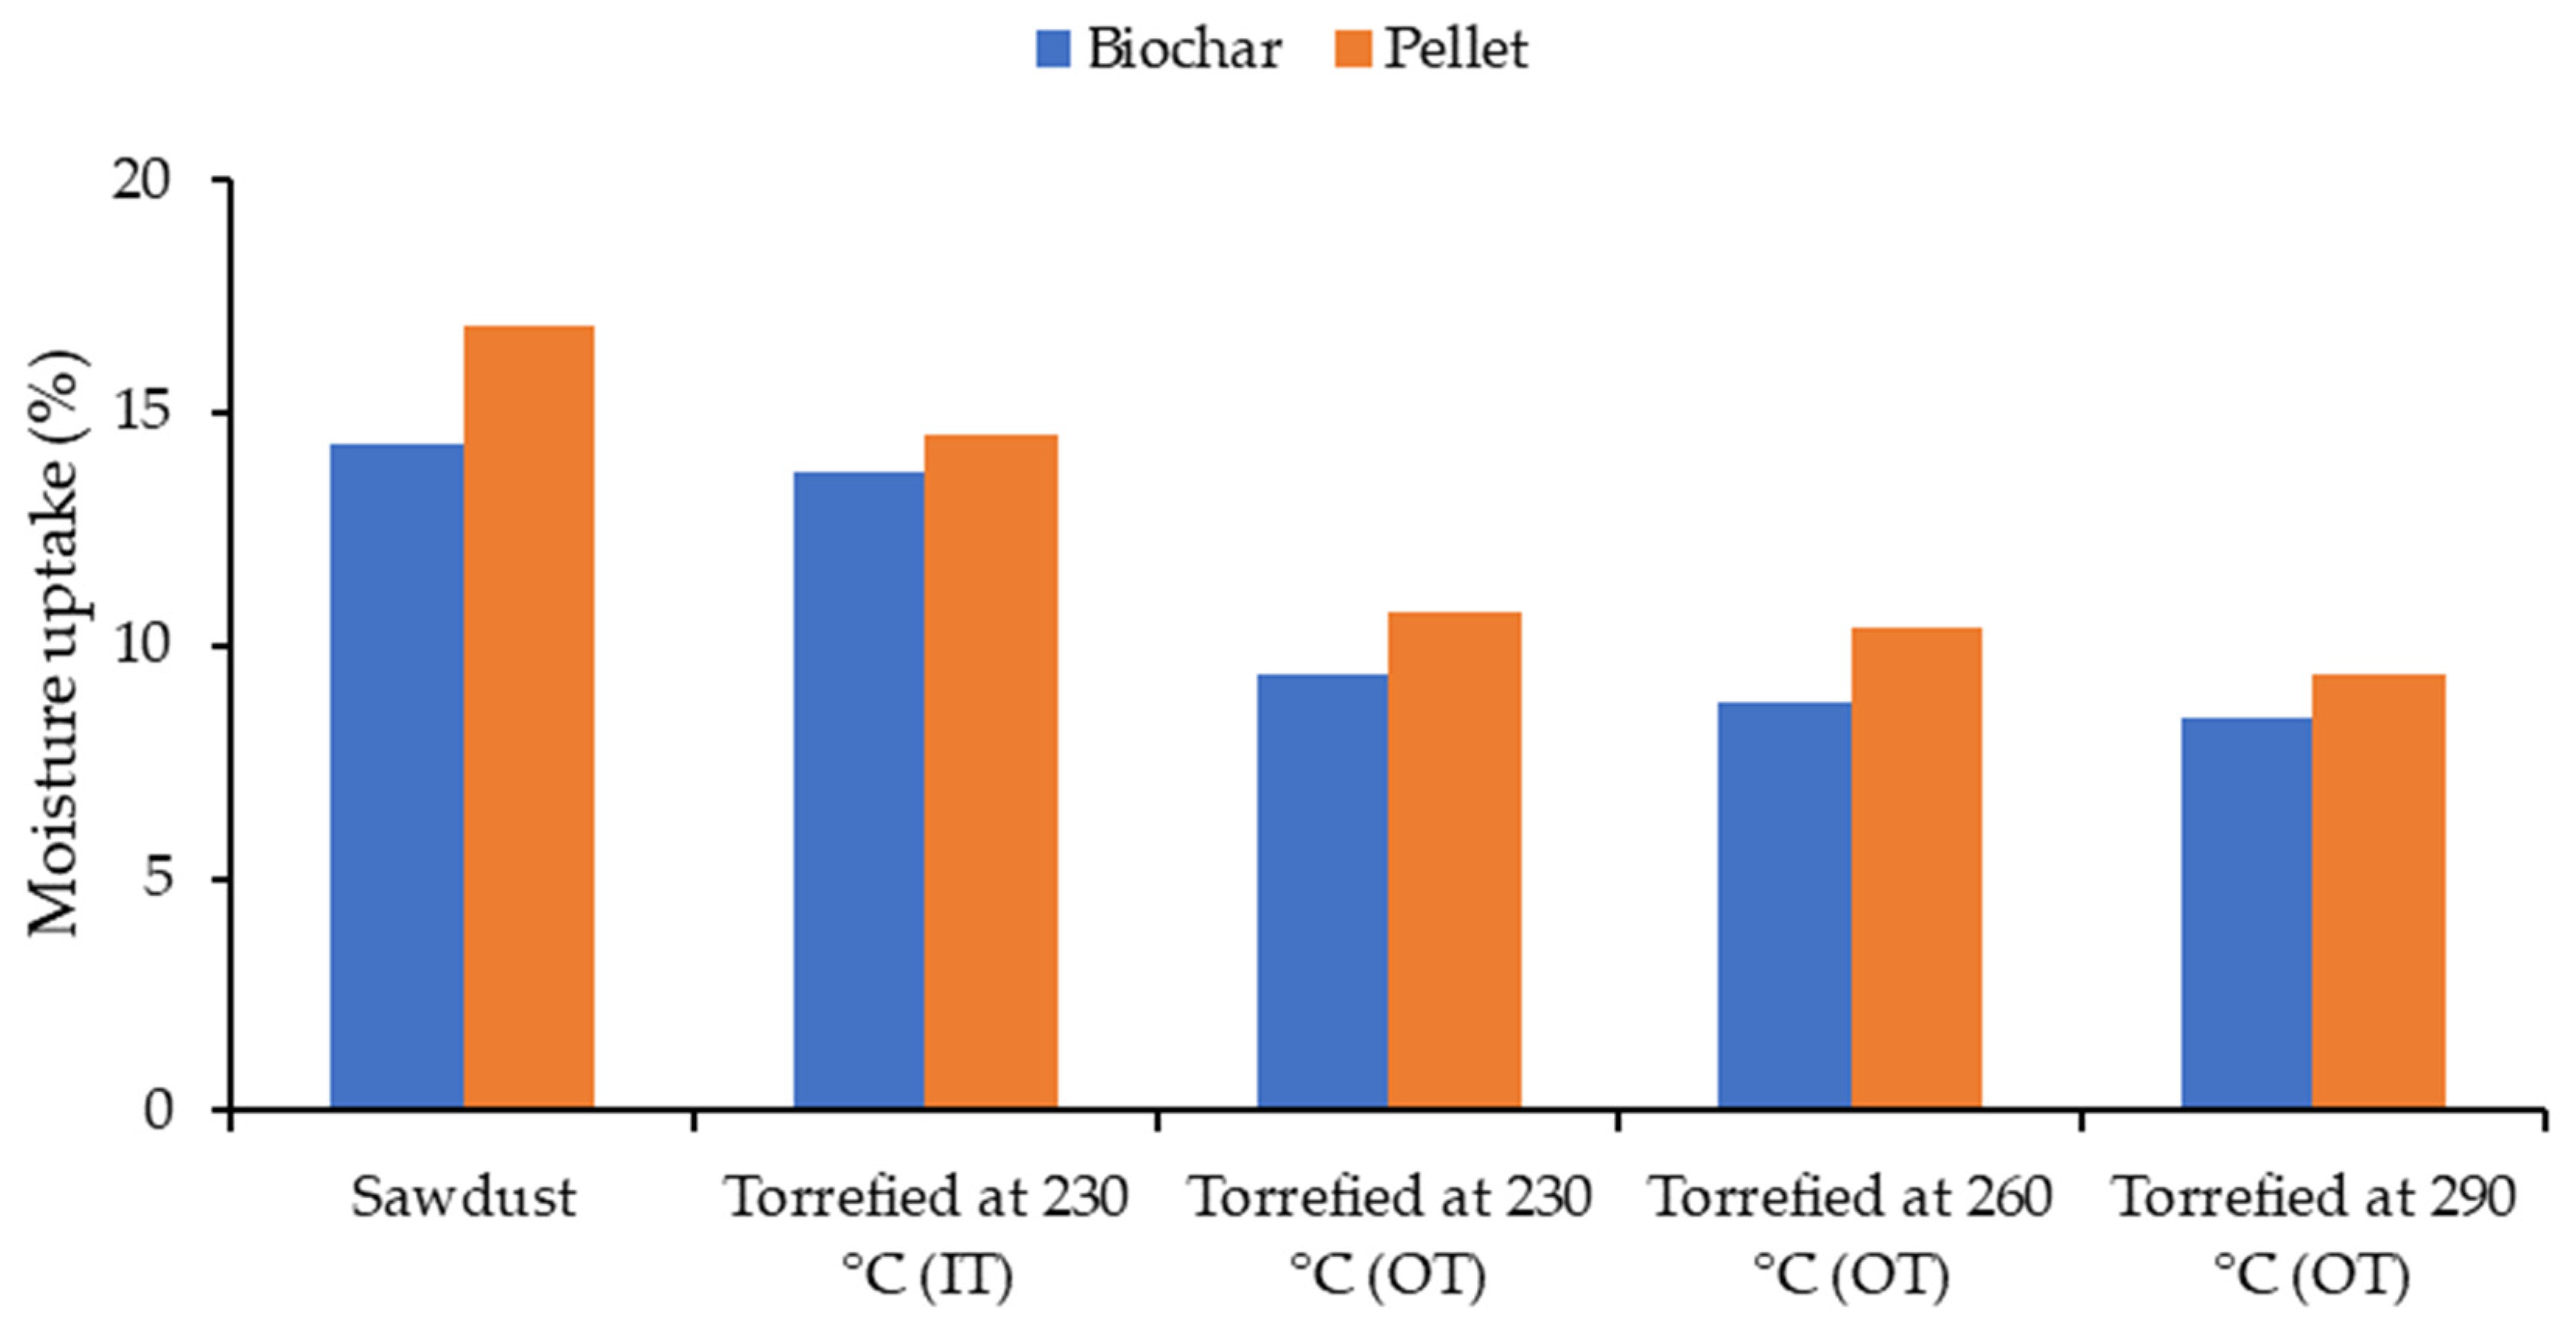
2.7. Moisture Uptake

Around one gram of each sample (biochar or pellet) was subjected to a humidity of 90% at a temperature of 30 °C for more than 72 h. The humidity chamber (Espec SH-641 benchtop chamber, ESPEC Corp., Osaka, Japan) was used for the moisture adsorption test. After weight measurements, they were dried in an oven at 104 °C for 24 h. Finally, the weight difference between humidified and oven-dried samples was presented as the percentage of dried material.

3. Results and Discussion

3.1. Design Parameters

In their study, Peng et al. [12,51] indicated that torrefied sawdust with 70–80 wt.% biochar yield was successfully densified into pellets by preconditioning the samples to 10% moisture and heating the die to a temperature of 170–230 °C, in the absence of any binders [15]. However, in this study, the die temperature was fixed as low as 95 °C analogous to industrial pelleting settings- while adding 10% moisture helped to densify torrefied samples into pellets.
According to Table 2, sawdust torrefied at three ranges of temperature and residence times has different properties compared to untreated sawdust. For example, compared to raw sawdust, the bulk density of the torrefied sample largely increased for moderate treatment at 260 °C and 30 min [117.38 (raw) vs. 159.06 kg/m3 (torrefied)]. The particle density of torrefied samples decreased slightly with no visible pattern related to the severity of treatment; although according to Wang et al. [52], this quality can be improved after torrefaction of sawdust (in the range of 1525 to 1637 kg/m3). Pellet density after increasing temperature and residence time, decreased from 1044.6 to 955.96 kg/m3 for the most severe torrefaction experiment at 290 °C for 45 min. Mass loss during torrefaction of sawdust caused lower pellet densities of torrefied material [53]. Based on the results of Stelte et al. [54], the pellet densities of torrefied wood at temperatures of 250–270 °C were reported to be in the range of 700–830 kg/m3; however denser pellets (950–1000 kg/m3) from torrefied samples at similar conditions (torrefaction temperature of 250–290 °C) were produced by Wang et al. [52]. Tensile strength of torrefied pellets showed a similar pattern, and their strength were reduced to almost a quarter of non-treated pellets (e.g., 0.08 MPa compared to 0.31 MPa) after applying the highest severity factor rate (R0: 7.25) to the mixture of sawdust. However, other properties of torrefied products such as increased higher heating values were favourable results for this batch torrefaction treatment. The improved calorific value is comparable to the results of different experiments on various biomass feedstock [55,56,57,58]. Also, an increased amount of ash from 0.22 to 0.31% was observed for torrefied samples at 290 °C and 30 min compared to raw material.

3.2. Optimization

The predicted models of seven different responses and R2 along with optimized values for optimal torrefaction treatment are listed in Table S8. Analysis of variance (ANOVA) tests for bulk density and dimensional stability were not significant for applied treatment conditions (see supplementary Tables S1 and S5 respectively); hence they were excluded from the optimization process. Other responses such as HHV, tensile strength, pellet and particle density, along with ash content were predicted through the response surface model and ranked from (5 to 1) to generate the optimized conditions (230 °C and 45 min).
It was observed that the best treatment (at conditions of 230 °C and 45 min) based on the optimization model has low desirability of around 48% (Figure S1). The underlying nature of wood fibres was altered after the torrefaction experiment and some of their attributes such as mechanical strength did not appear to be favourable for the final product.
The torrefied product had relatively low fuel qualities compared to other commodities on the market such as coal; therefore, further steps were taken to improve sample qualities such as pellet strength and higher heating value. For instance, steam-treated spruce sawdust at different ratios (10 and 20%) was tested as a binder to enhance the mechanical strength of torrefied pellets. To observe the calorific value change, the samples were torrefied at similar conditions to IT but the outside tube temperature was used as an alternative for monitoring the process.

3.3. Relationship between Two Sets of Recorded Temperature

The torrefaction experiment was conducted through two different sets of recorded temperature including inside and outside (furnace) temperature of the reactor. Using the outside thermocouple for the torrefaction experiment has been employed to see if HHV and mass loss of torrefied samples would change during similar conditions. There were three different levels of sawdust torrefaction process using outside temperatures including 230, 260 and 290 °C for a fixed duration of 45 min (see Figures S10–S12). The graphs show that these outside temperatures correspond to higher inside temperatures (278, 312 and 330 °C) with roughly 40–50 °C differences (see Figure S2). This difference can be originated from several factors such as input nitrogen temperature, vertical and radial temperature gradient, heat loss before the condensation zone, low thermal conductivity, as well as the low heat capacity of woody biomass and their endothermic reactions [12,59].

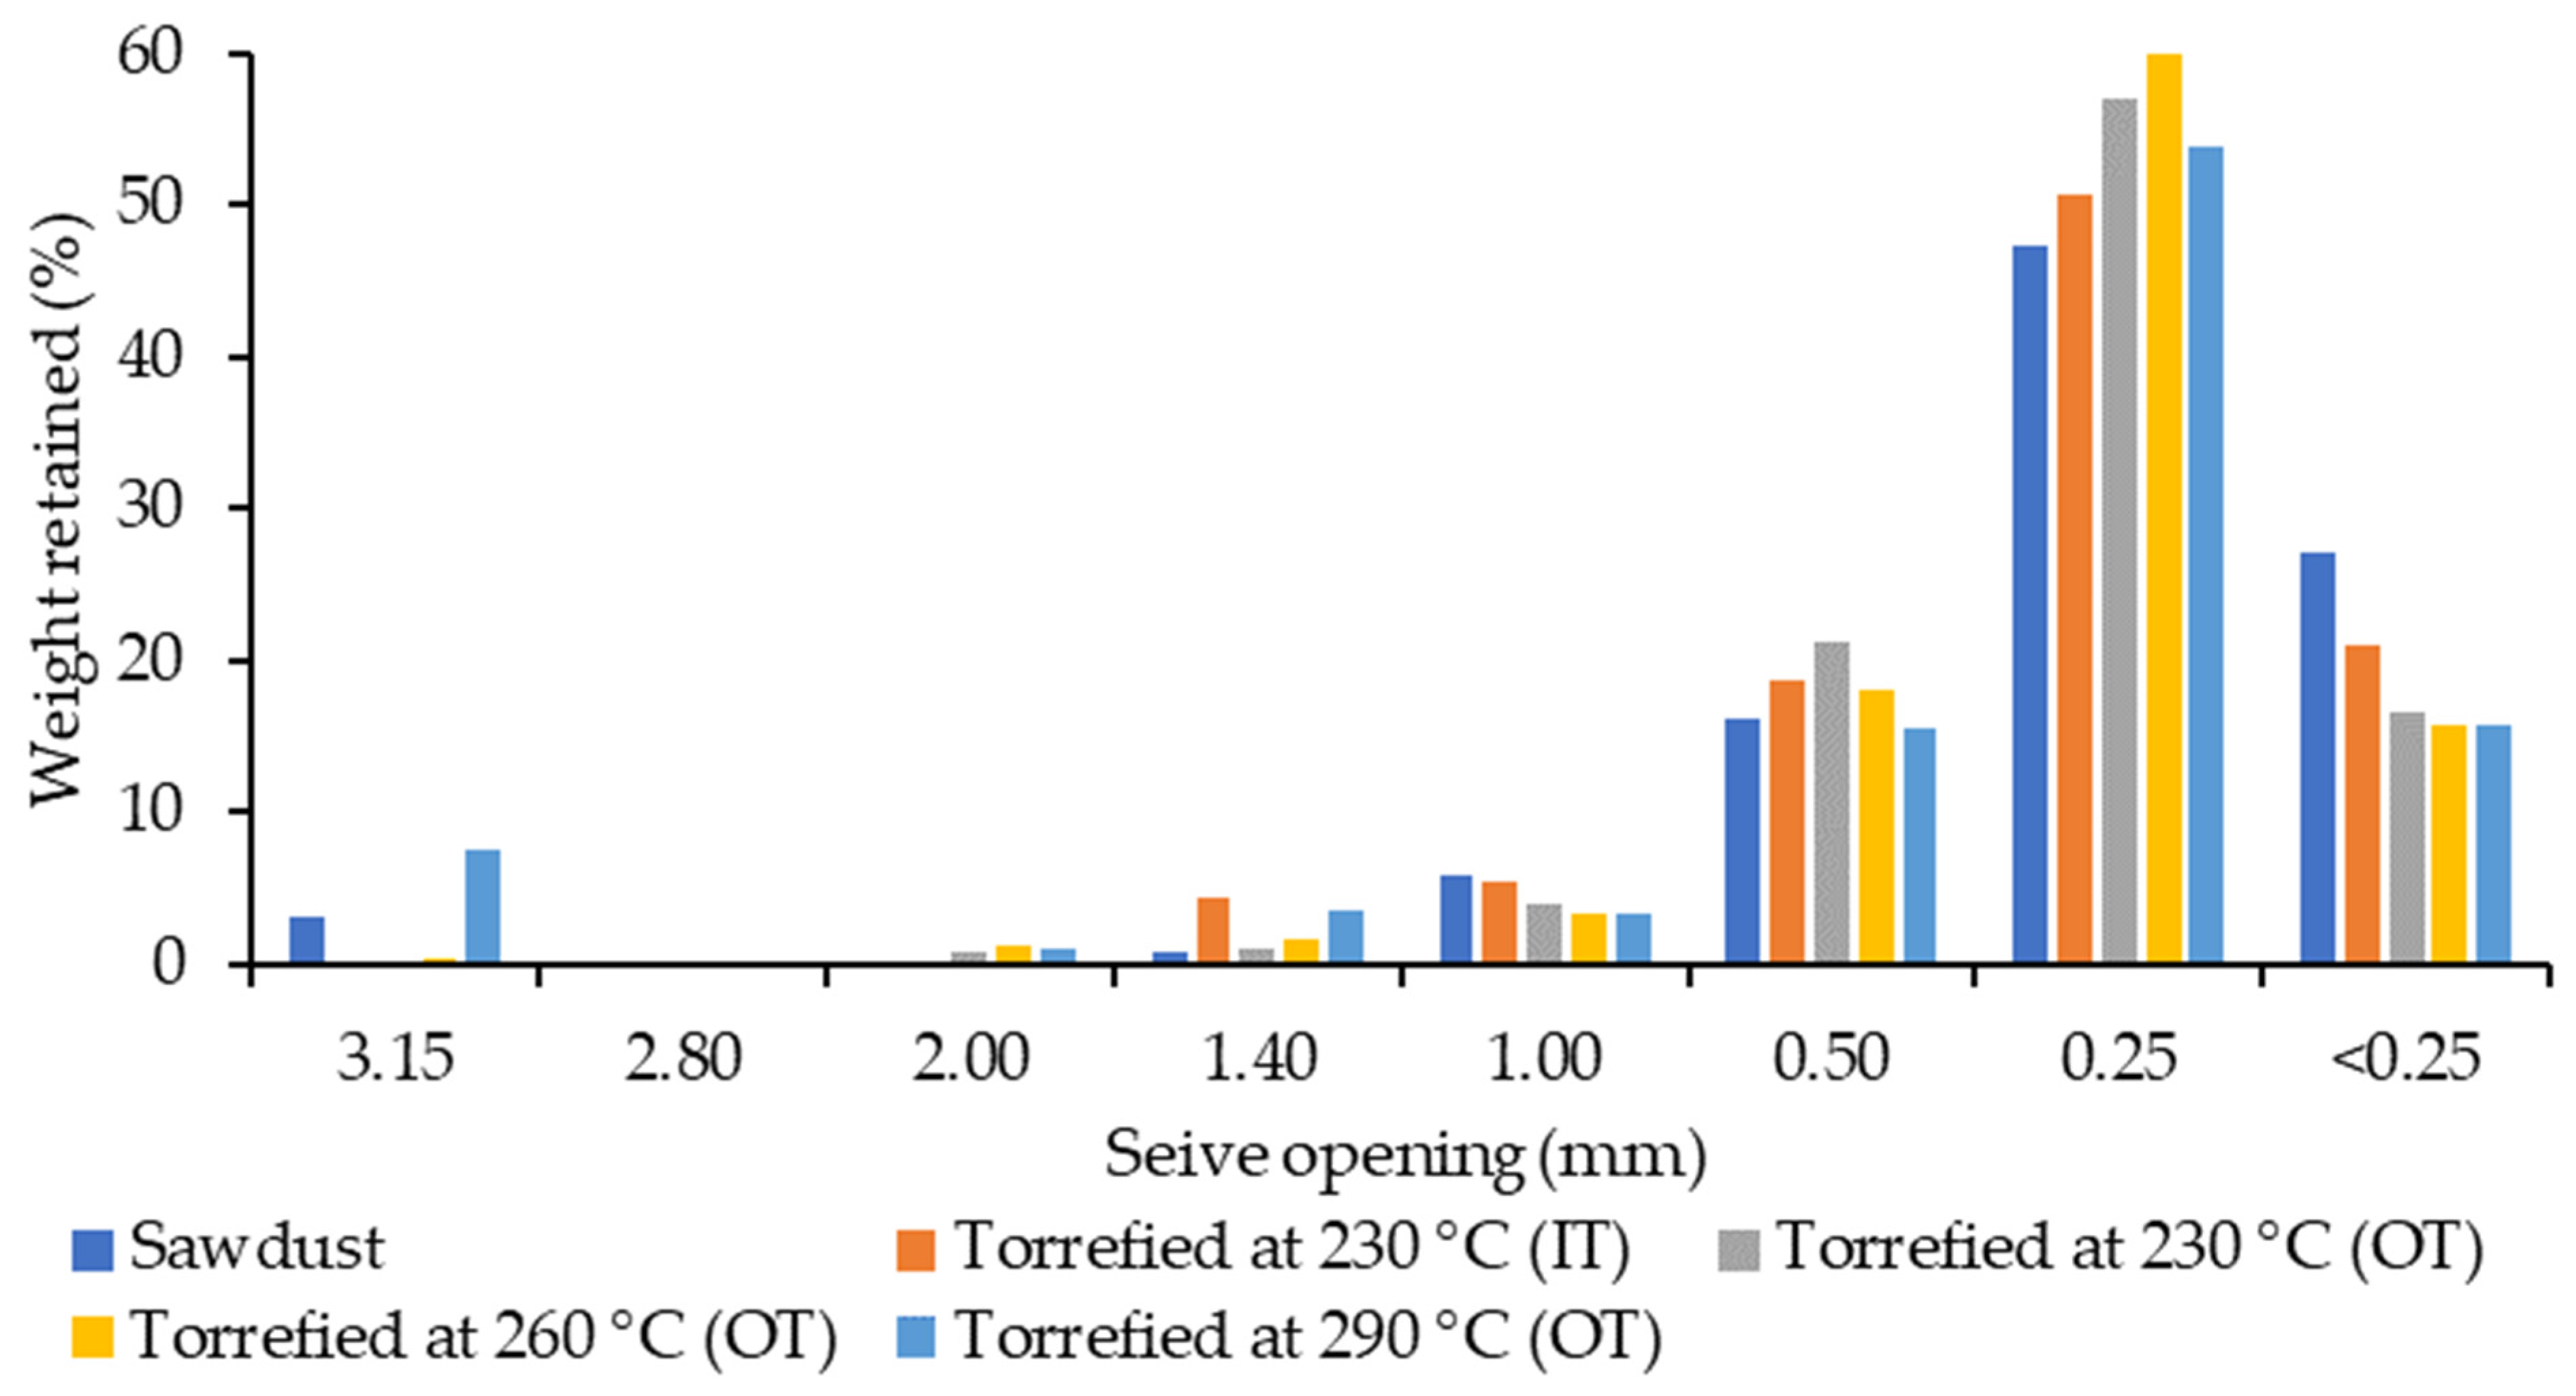
3.4. Particle Size Analysis

The shape and size of particles define how much surface area is available for interlocking particles in a pellet. This also has a direct impact on the mechanical strength of pellets such as durability [60,61]. Particle shape and size influence the energy consumption during pelletization [23,62].
Following torrefaction, fibre diameters had not changed much, and the average was around 0.3 mm (Table 3). A trivial increase in dgw (0.38 mm) after the ultimate treatment may be attributed to the agglomeration of particles at the highest temperature (290 °C). This was also evident in Figure 3, showing a small percentage of coarse particles on the left side of the chart and major fine particles on the right side for torrefied and raw sawdust.
According to Ghiasisis [23], a possible theory for the increased durability of pellets made from small particles is that these fine particles (sizes less than 0.25 mm) produce greater wall friction and resistance to the flow of material, resulting in better compaction and quite durable pellets [23]. Hence, the fine raw/torrefied sawdust utilized in this study with an average diameter of 0.33 mm, may have the potential to provide strong pellets. The normality indicators shown in Table S9 confirmed that none of the samples were distributed normally according to various sieve sizes. As the severity factor increased, these indices deteriorated such as high skewness and Kurtosis for extremely torrefied samples.

3.5. Chemical Composition

After torrefaction, substantial changes occur to the chemical components of fibres. This can be observed from the analytical reports in Table 4. Hemicellulose is almost depleted following torrefaction at 290 °C (OT) and this seemingly added to lignin values (insoluble fraction), which can be a result of accumulation between carbohydrates and phenolic compounds of torrefied sawdust. This was confirmed by a study from Wang et al. [21], indicating that the actual level of carbon-rich lignin in torrefied samples improved when the organic component (for example, hemicellulose) in lignocellulosic biomass decomposed [21]. Yue et al. [47] revealed that after torrefaction of sorghums at 275 °C, the accumulation of degraded cellulose and lignin was the main fraction (60–80%), with roughly 99% being acid insoluble [47]. As much as torrefied samples are subjected to harsh conditions (using either inside or outside temperature), cellulose will decompose more and deposit in solid form of biochar; for instance, its amount dropped greatly from 49% at 230 °C to 12% at 290 °C for torrefied samples. The analytical report of torrefied sorghum specified that over 44% of cellulose and 90% of hemicellulose in sweet sorghum bagasse were degraded at 250 °C, while this figure is around 25% of cellulose and 70% of hemicellulose for energy sorghum [47]. During severe torrefaction treatments, alteration of carbohydrates and phenols overestimated the lignin value (39–73%), which may be a result of condensation reactions of carbohydrate monomers with lignin decomposition products [63]. The non-structural solubles of wood sawdust were decreased after torrefaction (from 9 to 6%), except for torrefied samples at 260 °C, which increased slightly to 11%.

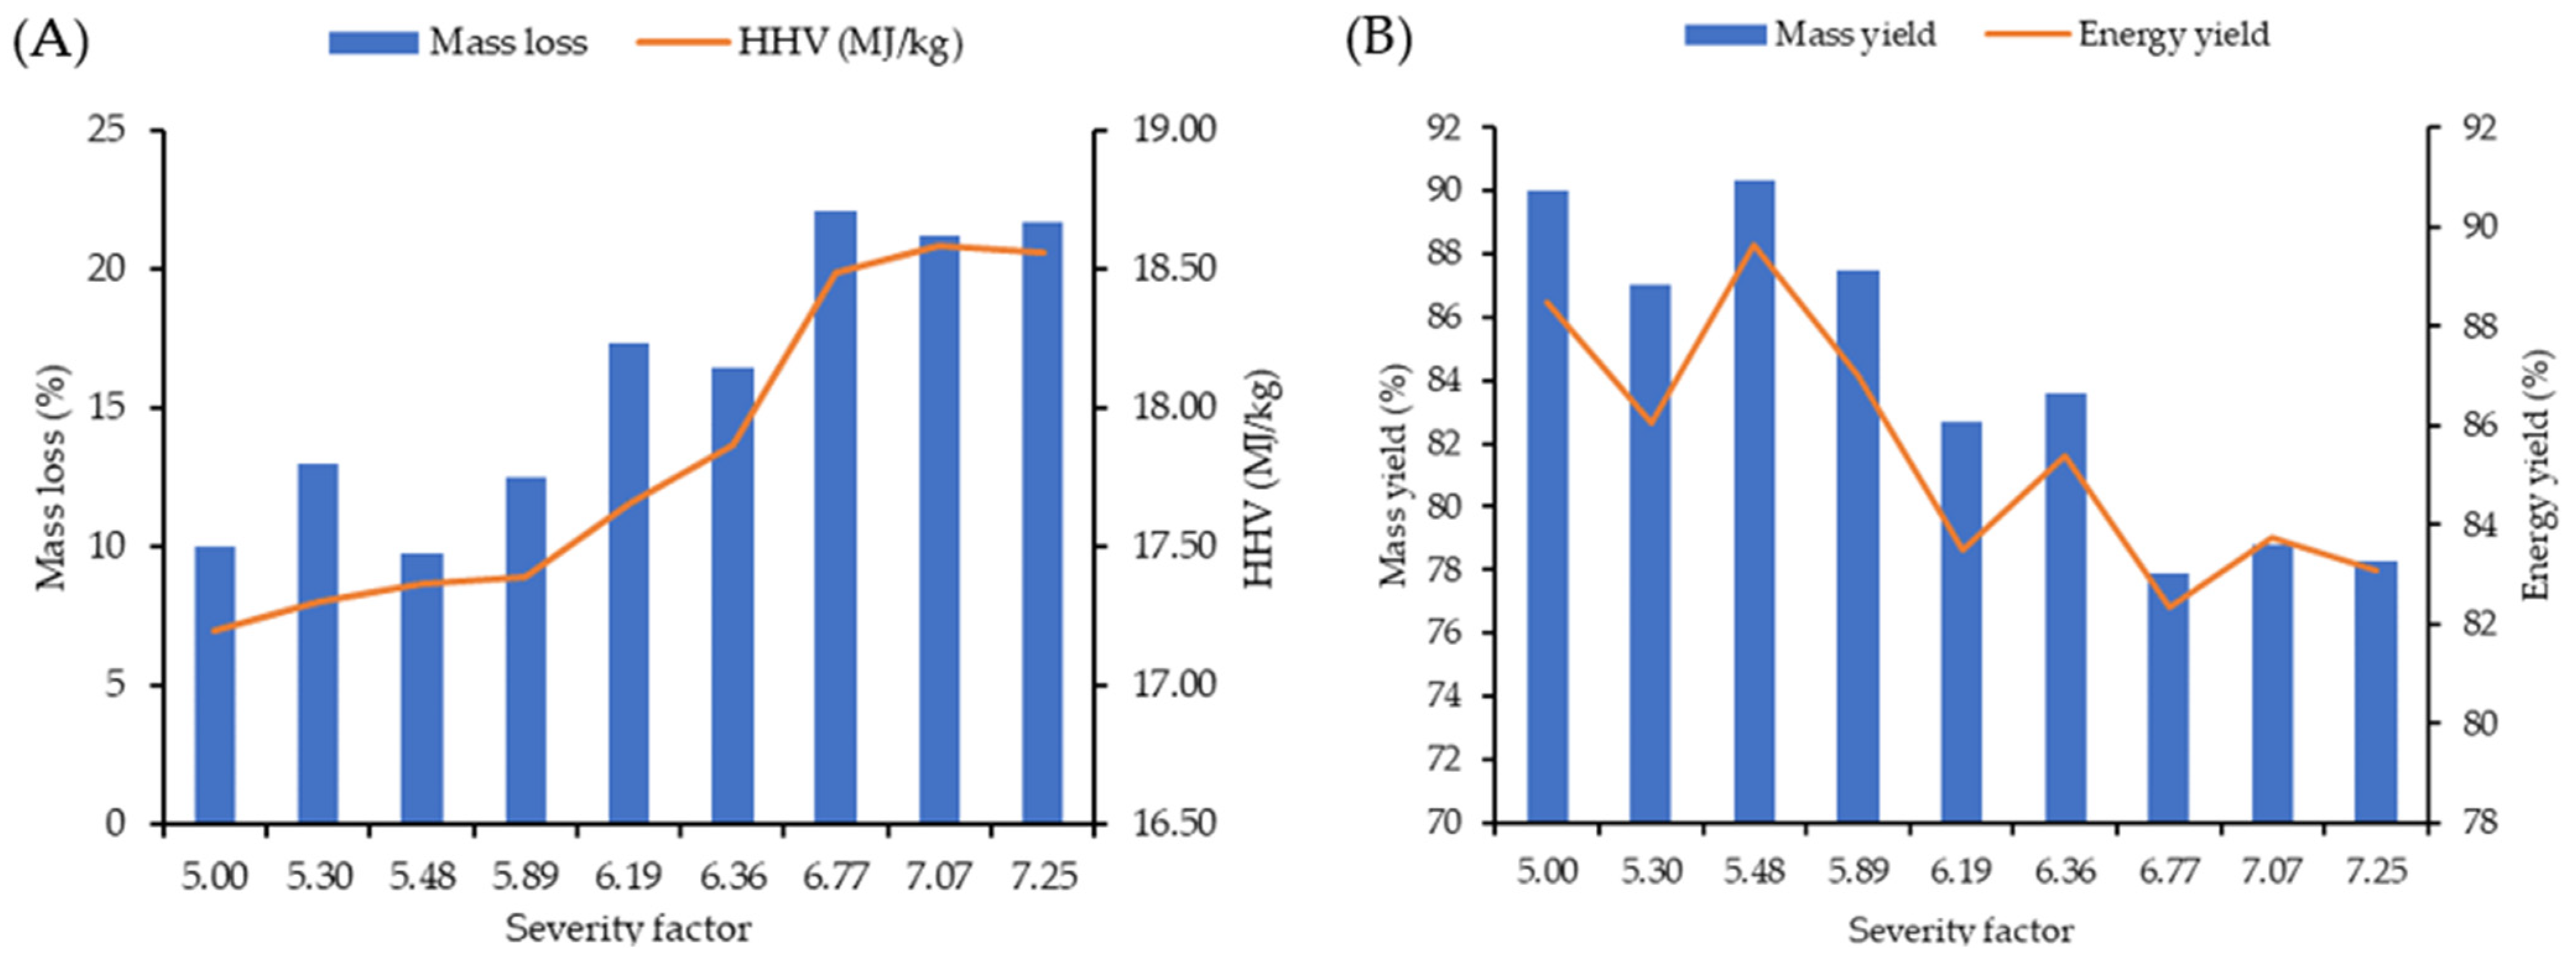
3.6. Mass and Energy Yield

There was a visible pattern between severity factor increase, HHV and mass loss of torrefied samples. As severity (R0) boosted from 5 to 7.25, the mass loss and calorific values of torrefied samples increased by 117% and 6%, respectively (Figure 4A). This is the case for torrefied samples considering OT; however, their solid yield loss is at least 2.5 times more than torrefied samples using IT at an equivalent severity factor (Table S10). The energy value gain after intensive torrefaction using OT is promising for torrefied compared to non-torrefied sawdust (24.27 and 17.49 MJ/kg respectively). However, in order to justify the torrefaction experiment, the energy yield needs to be taken into account (Figure 4B). During torrefaction (IT) at a severity factor of 5.48 to 7.25, the energy yield dropped from 88% to 83% which is a trivial difference. Using the outside temperature for comparison purposes showed huge variation between torrefied samples at 230 and 290 °C (around 19% reduction in energy yield).
Yue et al. [47] examined different biomass (sweet sorghum bagasse and energy sorghum) subjected to torrefaction temperatures of 250, 275 and 300 °C for a fixed time (30 min) and discovered a solid yield of 51–70% for energy sorghum and 43–65% for sweet sorghum bagasse [47]. Notably, their energy value after torrefaction was improved by 1.4 and 1.6 times. Another study on torrefaction of various wood sawdust (spruce, larch, oak, and beech) showed a maximum mass loss (33 to 34%) at a temperature of 300 °C and residence time of 10 min, although the mass loss for larch was around 18% at those conditions [53]. Phanphanich and Mani [64] determined that when pinewood chips were torrefied from 250–300 °C, their calorific value improved by 37.5% while the energy yield of these samples was between 71 to 90% [64].
Many studies reported the densification results for biochar samples prepared at typical torrefaction conditions (250–300 °C with 70–80 wt.% biochar yield) [12,15,22,51,52,65,66]. According to the study by Peng et al. [12] on the torrefaction of softwood residues, the optimum mass loss for providing high-quality torrefied wood pellets was around 30% while the temperature range of 270 to 280 °C for about 55 min was applied to biomass [12]. Hence in this study for torrefying wood sawdust in the BTU, the combination of a torrefaction temperature of 230 °C (using an outside thermometer) and a residence time of 45 min was preferred over other treatments as the mass loss was around 25%.

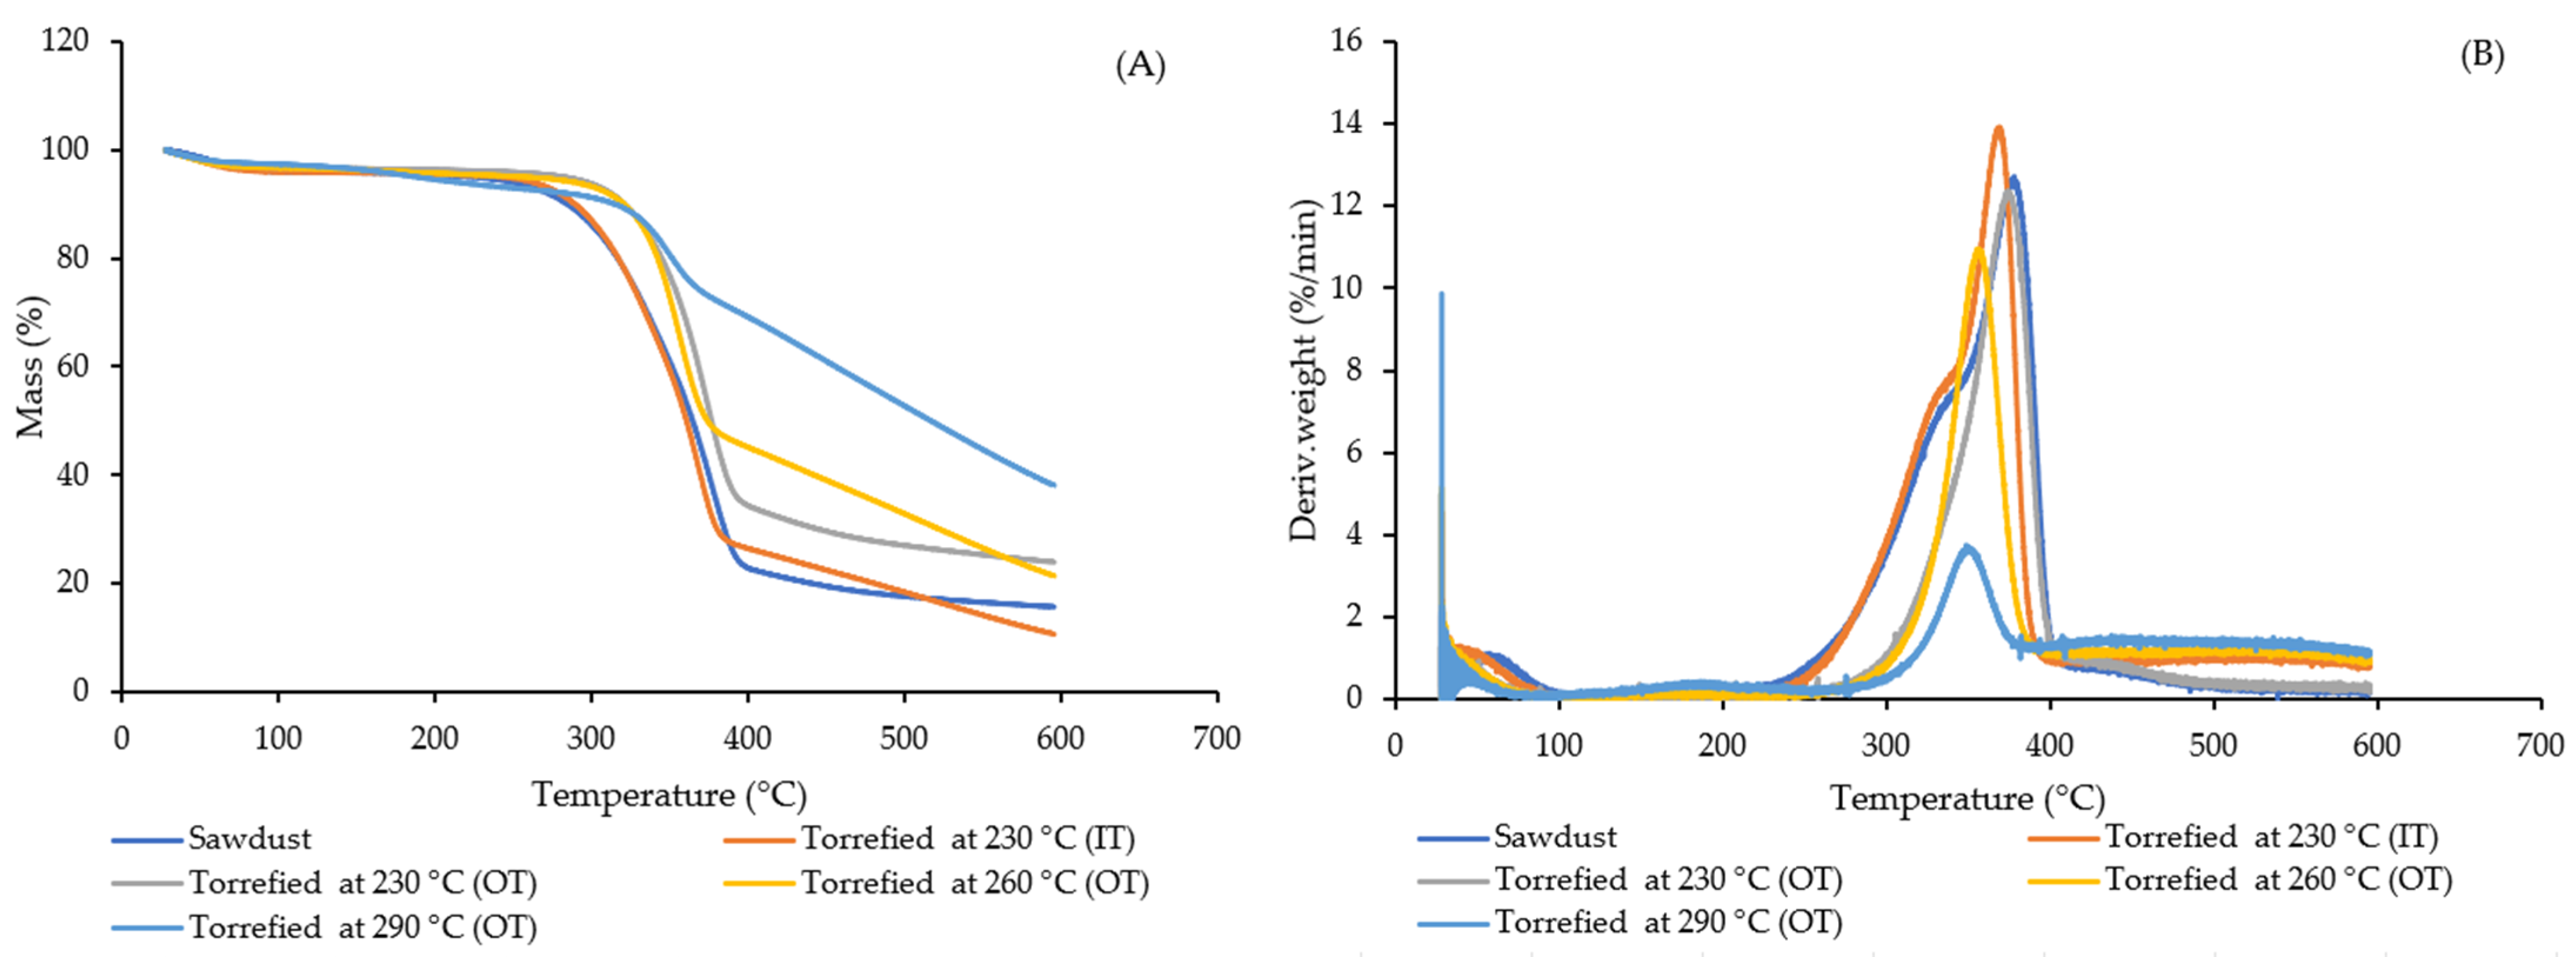
3.7. Thermochemical Analysis of Torrefied and Raw Sawdust

Samples with OT treatment had more HHV (roughly 15, 19 and 40% corresponding to 230, 260 and 290 °C (OT), respectively) compared to the optimized torrefied sample (at 230 °C) using the inside thermometer (see Table S11). According to Lunguleasa et al. [53], after torrefaction of various wood sawdust (beach, larch, spruce, and oak), their energy values improved constantly, reaching 21.30, 20.71, 20.58 and 20.94 MJ/kg, which correspond to 20.7, 11.8, 14.1 and 16.4% increases, respectively [53].
Results of thermogravimetric analysis (TGA) are shown in Figure 5. Most of the mass reduction in raw and torrefied samples was between 300–400 °C, except for extremely torrefied sawdust (at 290 °C), which revealed a milder slope on the TG curve (Figure 5A). This was confirmed by the differential thermogravimetric (DTG) graph in Figure 5B as well, where roughly 40% of this sample was removed between 400–600 °C, while other samples showed a maximum decomposition rate at lower temperatures. The broad range of lignin decomposition (between 250–500 °C) for torrefied samples at 290 °C agreed with previous studies [45,67,68]. There was a left shoulder observed at around 300 °C for raw sawdust and less severe torrefied sample (230 °C, IT), which may be related to degradation of hemicelluloses [69,70]. This finding was in agreement with the results of Table 4 in that only these two samples contained high amounts of hemicellulose.
After proximate analysis of biochar samples, the volatiles decreased from 77% for optimized treatment to 41% for the most extreme torrefied samples and conversely, fixed carbon improved from 18 to 52% in that respect (Figure 6A). A similar pattern has been observed by other researchers [2,71,72,73,74,75,76,77] of increased carbon content after the torrefaction of several types of biomass. Although for ash content, no trend was apparent during torrefaction, the effectivity of the batch torrefaction unit for producing high-quality fuel from sawdust was verified by these data. Furthermore, carbon content increased by 17% and oxygen dropped by 16%, which validates the above statement (Table S11). It is noteworthy that after the harsh treatment conditions using OT, the level of sulphur and nitrogen in torrefied sawdust was still low compared to other solid biofuels. The elemental analysis of sweet sorghum bagasse and energy sorghum showed a reduction in oxygen content (18.83 and 10.95%, respectively) during torrefaction at 300 °C. In addition, their O/C and H/C ratios declined from 1.61 and 1.54 to 0.99 and 0.87, respectively [47], In this study, in contrast to H/C ratio which had a mild drop (from 0.13 to 0.08), O/C ratio had decreased sharply (from 0.9 to 0.42) following increased torrefaction severity levels (Figure 6B).

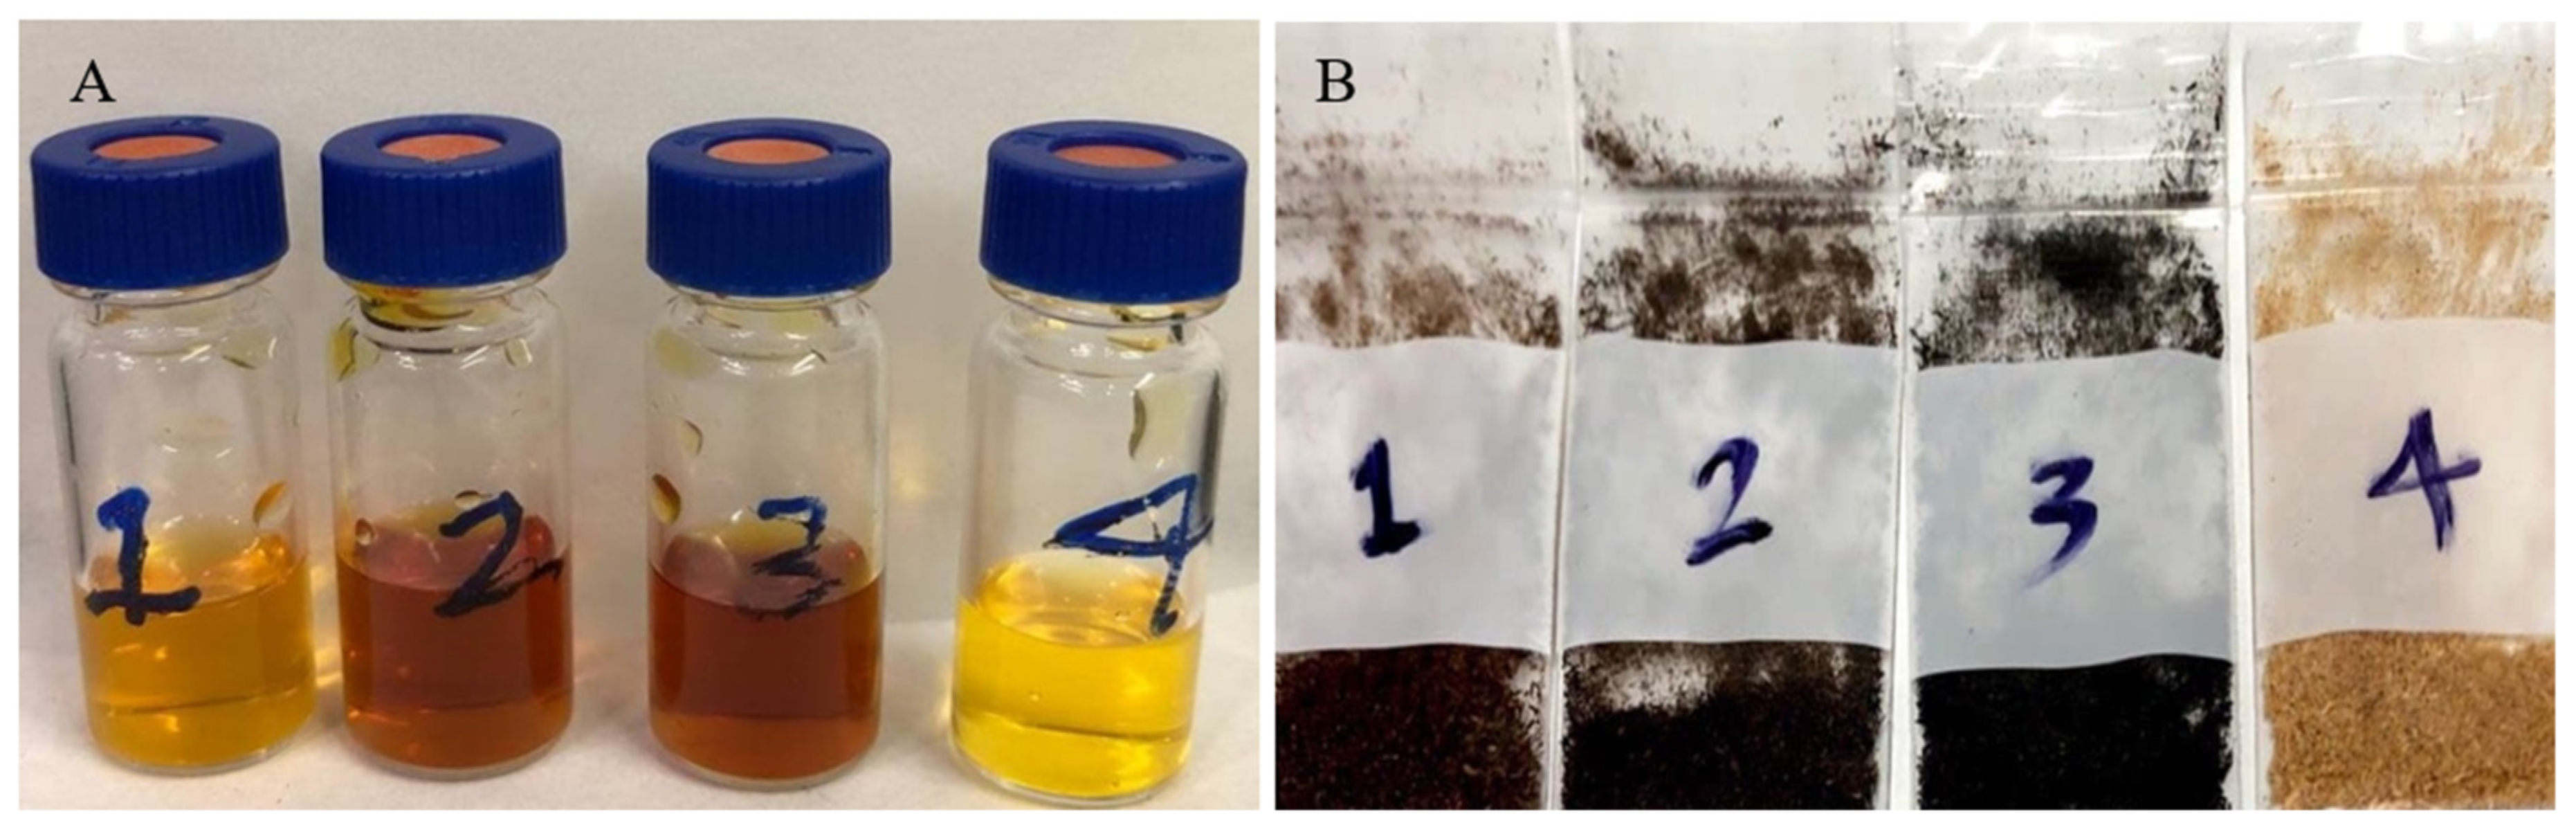
3.8. Torrefaction Liquid Composition

After each run, the biochar along with torrefaction liquid (Figure 7) was collected and sealed for further analysis. The GC/MS analysis was carried out to determine the main components of torrefied liquid by-products. As shown in Figure 7B, a change of colour from yellow to dark brown took place which corresponded to torrefaction levels from low to extreme. The colour change during torrefaction of wood residues has been reported in the literature [22,78,79] and it was a result of the lignin conversion from heating woody biomass [21,79]. According to the results of Yue and co-workers, even at high torrefaction temperatures most lignin and cellulose in biomass were more resistant and gradually degraded [47]. Eventually, they were decomposed and accumulated into acid-insoluble compounds. The current study revealed that the pH of torrefaction liquids was extremely acidic (1.85, 1.75, 1.76 and 2.35 corresponding to numbers 1–4, respectively in Figure 7A).
As shown in Table 5, the total yield of torrefied solid, liquid and gas outputs are listed for both optimized treatments and extra runs using the outside thermometer. Along with enhanced torrefaction temperature, the condensed liquid and non-condensed gases from wood sawdust were increased. The yield of liquid by-products has been increased from 7 to 27% after extreme torrefaction conditions. This amount of torrefaction liquid can be beneficial for side stream added-value products in addition to biochar production. Hence, the GC/MS analysis of the liquids is necessary to determine valuable components for commercial uses. According to Yue et al. [47], torrefaction liquids that originated from volatile compounds in holocellulose and partial breakdown of lignin, following separation into oil and aqueous phases, could be refined into high-value chemicals or fuels [47].

3.9. GC/MS Analysis

Analysis of torrefaction liquids from torrefied material by GC mass spectroscopy revealed that furfural amounts decreased as much as the severity of treatment increased (from 41 to 2% Table 6). Furfural is one of the most valuable by-products among chemicals recovered which originate from the hemicellulose of wood. After torrefaction of sorghum bagasse, furfural as the major component was acquired from holocellulose destruction. Following degradation of hemicellulose, furfural as the final product can be made through depolymerization, reconstruction and dehydration of xylan [80]. During extreme thermal treatment, possible reactions are either oxidation of furfural to formic acid or condensation with lignin degradation products [63,81]. Carbonyl sulphide was detected as the second main product in the optimized treatment (22%), while there was none in other torrefied samples. On the other hand, acetic acid was found only in 230 and 260 °C torrefied samples (OT) with 17 and 8% area respectively. Similarly, Yue co-workers’ [47] experiment on torrefaction of herbaceous sorghum revealed that at a temperature below 250 °C most acetic acids were produced from hemicellulose deconstruction [47]. However, results reported by Prins et al. [82] showed that acetic acid could be produced from willow wood at a high temperature of 300 °C [82]. There were a wide variety of other compounds such as 2-tridecanone; digitoxin; cyclohexanone; 2- hexene; phenol, 2-methoxy-4-methyl-; 2-cyclopentene-1-one, 2-hydroxy-3-methyl- etc. which were identified by GC/MS in torrefied liquid products. Boerjan et al. observed that because of lignin degradation, phenol with methoxy substitutes could be formed, whereas other simple phenol types (e.g., phenol and its methyl-/ethyl- byproducts) were generated from the hemicellulose breakdown [83].

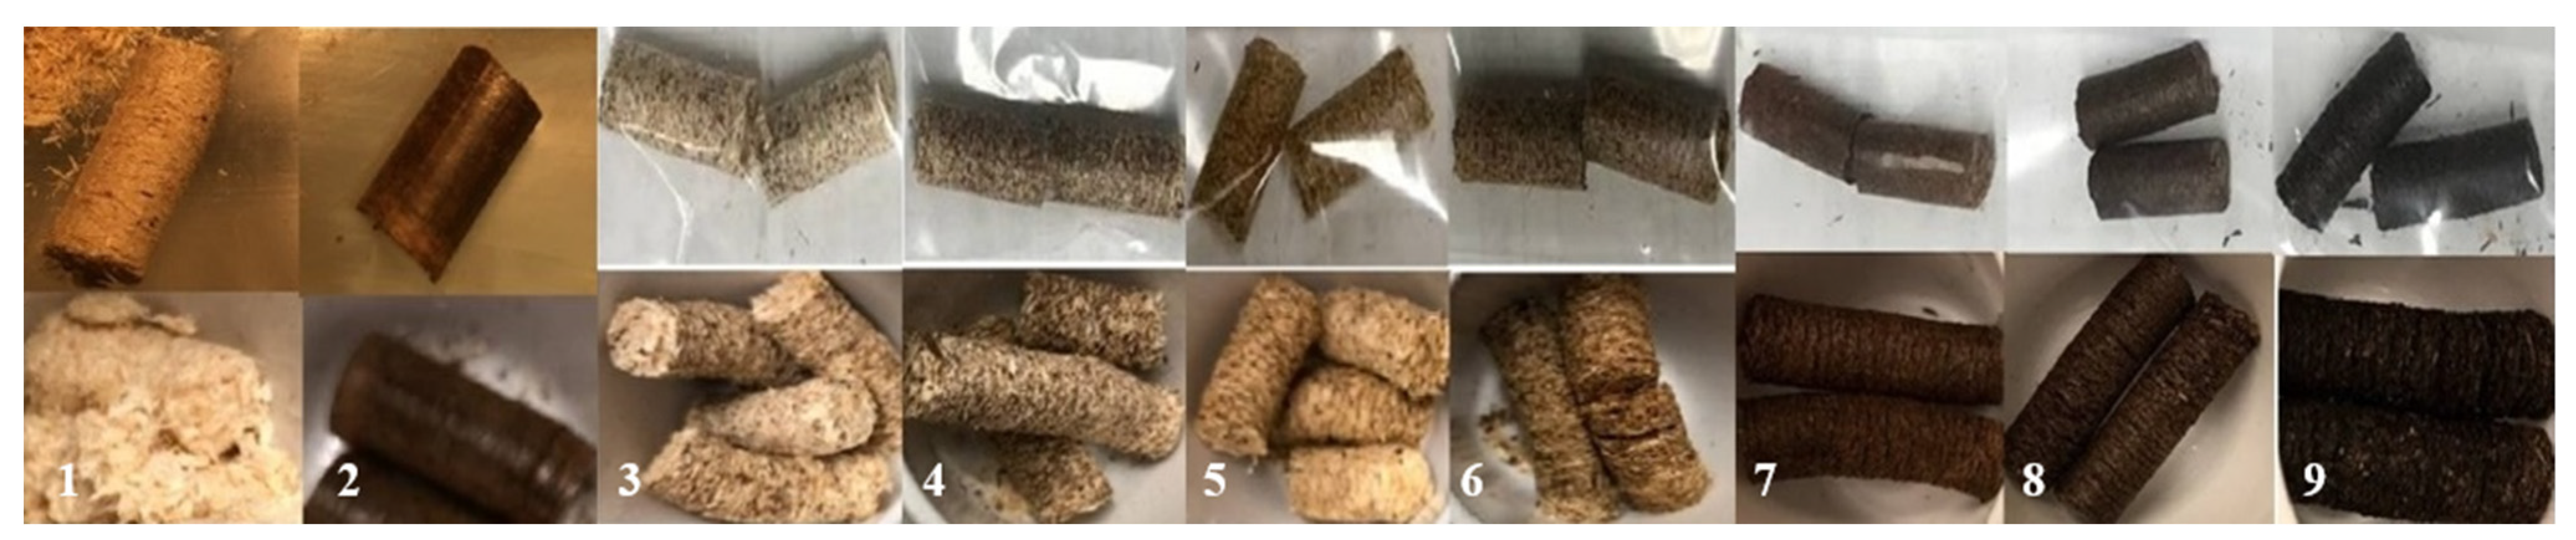
3.10. Pellet Properties

According to Peng et al. [12], under similar pelletization settings, biochar samples were harder to compress than non-treated material [12]. Furthermore, Peng et al. [15] reported that the pellet density of torrefied, or non-torrefied materials compressed at a die temperature of higher than 220 °C, was considerably more than pellets formed at lower die temperatures [15]. While in this study a typical die temperature of 95 °C was used, steam-treated spruce sawdust functioned as an effective binder to produce strong pellets from raw and torrefied sawdust (Table 7). With only 10% steam-treated binder, pellet density and tensile strength of control wood pellets were improved by 5 and 84%, respectively. The addition of 20% steam-treated sawdust to control pellets showed 138% increase in tensile strength and roughly 6.7% increase in pellet density. The results of this research revealed that the tensile strength of torrefied pellets with 10 and 20% steam-treated (ST) binder enhanced drastically (around 30% and 340%) compared to the torrefied pellets without binder. Similarly, based on the finding of Peng et al. [15], in comparison to starch and lignin, raw sawdust from pine (at the ratio of 10–30%) proved to be a functional and inexpensive binder for pelletization of (high-yield) torrefied samples [15]. Although the moisture uptake and pellet density were not favourable for 10% ST pellets, the addition of 20% binder to pellets showed a 2–3% improvement in pellet density and a small decrease in moisture absorption compared to torrefied pellets without binder.
Following severe torrefaction levels, although the lignin content of OT samples increased, their mechanical strength was relatively weak compared to optimized IT sample which might be due to lignin structural modification [23]; however, after adding binder (steam-treated sawdust) to the OT materials, they revealed exceptional enhancement in pellet strength. The unit density of 20% ST torrefied pellets improved by 10 and 15% (using OT at 230 and 260 °C, respectively) while for torrefied samples at 290 °C (OT), pellets without binder could not be formed. According to Lunguleasa et al. [53], torrefied wood pellet densities from non-treated and torrefied wood were in the range of 1010–1040 kg/m3 and 990–1010 kg/m3 respectively [53]. Surprisingly, the tensile strength of 20% ST torrefied pellets using OT at 230 and 260 °C was much higher (1. 08, 0.98 MPa) compared to 20% ST torrefied pellets using IT at 230 °C (0.72 MPa). Wang et al. [21] discovered that pellets made from forest residues have less tensile strength than wood pellets (1.58 compared to 2.52 MPa). They indicated decomposition of structural biopolymers like cellulose and hemicellulose during torrefaction can reduce the tensile strength of torrefied pellets [21].
Likewise, the moisture uptake of pellets decreased for OT torrefied samples. Therefore, these pellets are less prone to biological degradation and deformity after moisture absorption from a humid environment (see Figure 8). Reduction in moisture uptake of torrefied pellets in comparison to control pellets has been confirmed by several studies [21,78,84,85,86]. Based on a report from Peng et al. [51], following the moisture adsorption tests, torrefied pellets held substantially less moisture than raw softwood pellets (10 and 19% respectively). The study showed that pellets became more hydrophobic after torrefaction treatment [51].
Figure 9 shows a linear relationship between moisture absorption and severity of the torrefaction experiments. As sawdust was subjected to a higher torrefaction temperature, the amount of moisture that it could retain decreased from 14 to 8% for resultant biochars. A justification is that the hydroxyl groups have been steadily removed from biomass [64,87]. The torrefied pellets could take slightly more moisture than their originating biochars (around 1–2%). This might be due to the addition of 20% binder (steam-treated) which could increase the functional groups of the feedstock and consequently, more hydrogen bonds could be created with water. These results match with the results of Peng et al. [15] showing that torrefied pellets after the moisture absorption tests contained 12% moisture, which was lower than the control but higher than pellets without binder [15].

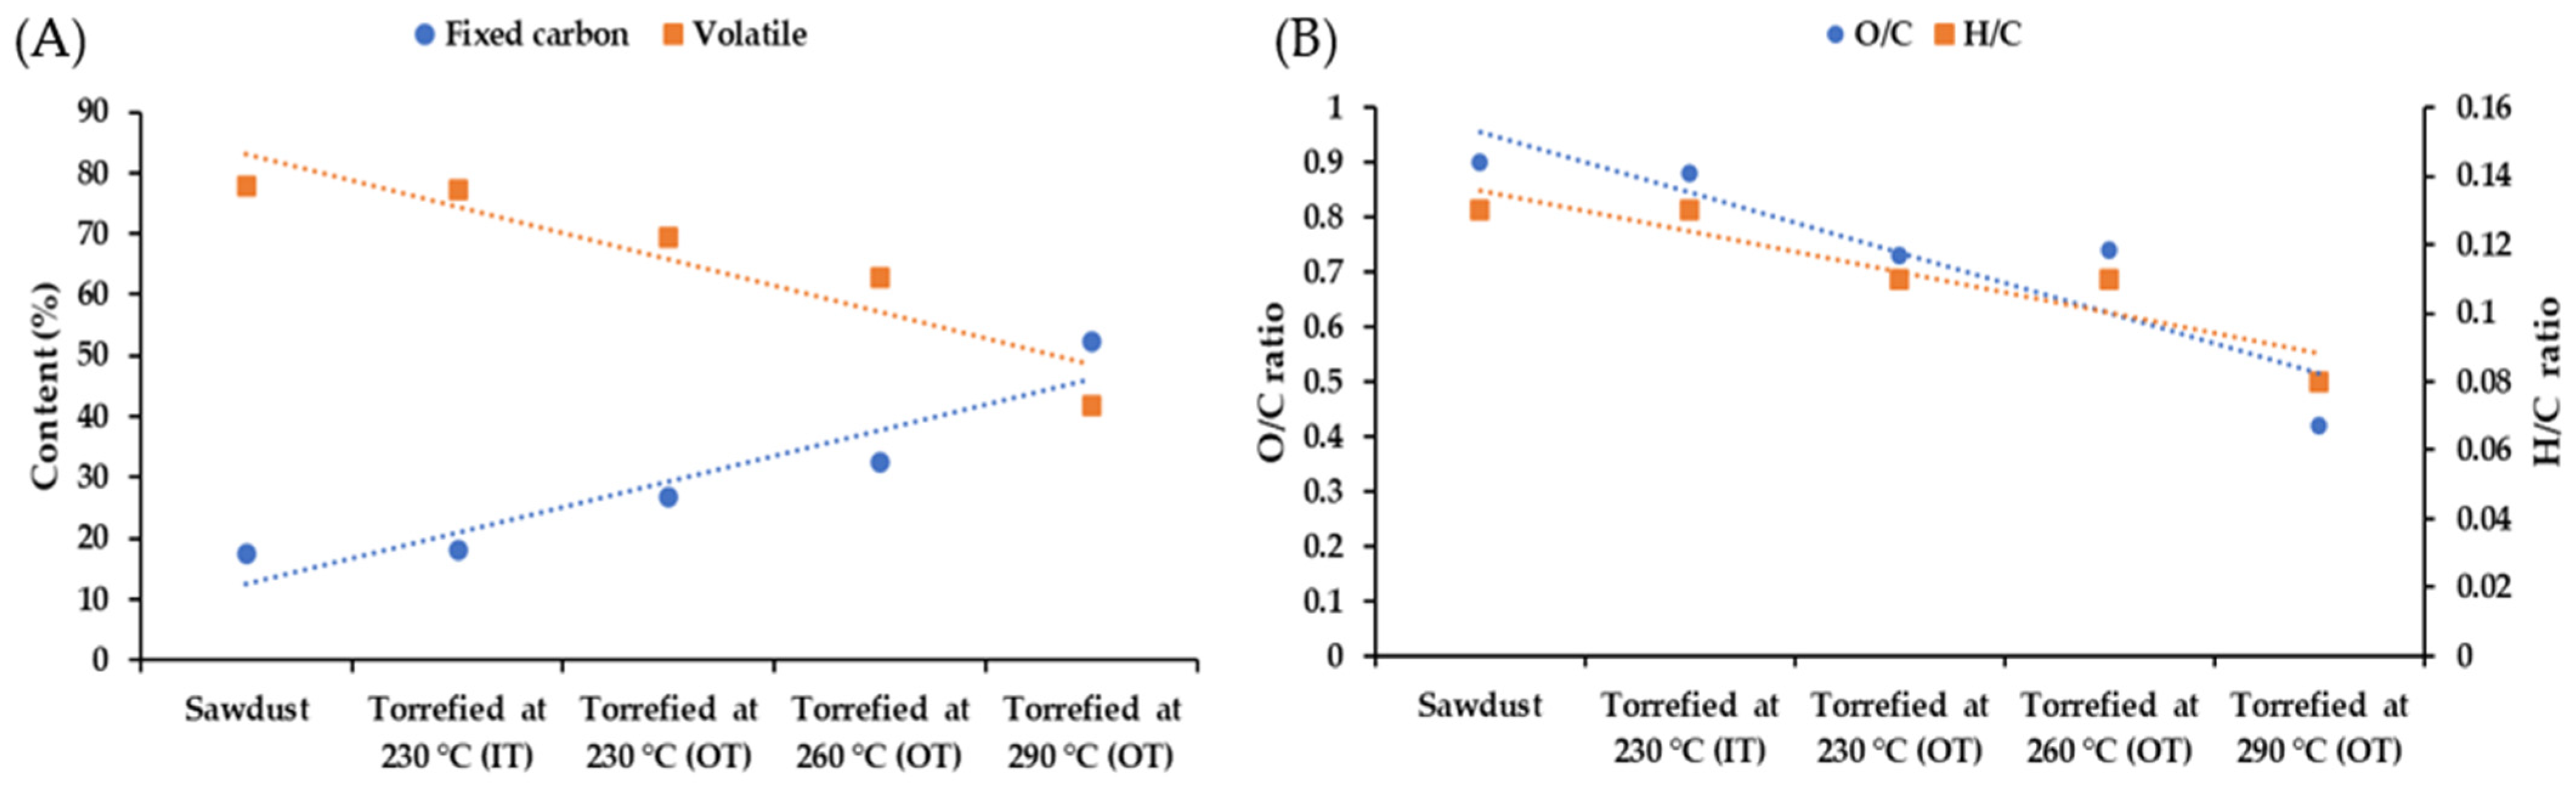
3.11. Thermochemical Analysis of Torrefied and Non-Torrefied Pellets

The energy value of control pellets containing steam-treated sawdust as the binder was slightly higher compared to no-binder pellets. However, torrefied samples (OT) have less calorific value after mixing with 20% steam-treated binder. For example, HHV of torrefied (OT) pellets with the binder were 19.3, 20.2 and 22.7 MJ/kg compared to 20, 20.7 and 24.3 MJ/kg for original torrefied sawdust samples (Table 8 and Table S11, respectively). Similarly, Peng et al. [15] reported less calorific value of torrefied pellets made with sawdust as binder compared to torrefied wood pellets without binder [15]. They concluded that steam-treated binder could lower the energy value and the efficiency of fuel (such as less fixed carbon and high volatiles) eventually after densification. The analysis proved the same assumption as the difference between carbon and oxygen contents of ST-torrefied pellets and originated torrefied samples were around 3–6% (Table 8 and Table S10). The results of a study by Ghiasi et al. [84] revealed an improved higher heating value of torrefied Douglas fir at 260 °C compared to the non-torrefied sample (22 and 18.7 MJ/kg, respectively) [84]. Similar results were reported for HHV increases (from 19.9 to 22.7 MJ/kg) of torrefied spruce at 270 °C [21]. According to the results of this study and previous research, torrefaction through degradation of hemicellulose could lower the volatile matter in sawdust, Douglas fir and pine pellets [21,51,84,88].

4. Conclusions

Through torrefaction, some unfavourable features of biomass (e.g., high moisture content and low energy density) as a potential energy source can be improved. In this study, a mixture of wood sawdust was subjected to three different temperatures (IT) of 230, 260 and 290 °C for time durations of 15, 30 and 45 min. The properties of torrefied samples using IT needed to be improved for producing top-quality pellets. Hence as an alternative approach, using the outside temperature of the fixed bed reactor was suggested for the second series of experiments. The higher heating value of torrefied samples using OT was considerably larger than IT samples in comparable conditions, for example, the differences were 15, 16 and 30% corresponding to torrefaction at 230, 260 and 290 °C for 45 min. The results of using steam-treated sawdust as a binder were successful as the pellet density of the preferred torrefied sample (OT) was substantially higher compared to the pellets with no binder (1054.79 and 955.31 kg/m3, respectively). Overall, the preferred treatment based on the mechanical, thermochemical and energy value analysis was the torrefied sample at 230 °C for 45 min using outside temperature in BTU. The quality of the preferred torrefied sample from wood sawdust showed that such residues provide a suitable feedstock for torrefaction and densification; these conversion methods can channel large amounts of underused wood wastes into valuable products and energy-carriers such as biofuel pellets and liquid by-products (e.g., furfural and acetic acid, etc.). As a result of this research study, biofuel pellets with high energy content were produced that can be exploited as the main feedstock for combined heat and power plants. Also, the effectiveness of steam-treated sawdust as an additive to torrefied material before pelletization was successfully verified through the experiments of this study.

Supplementary Materials

The following are available online at https://www.mdpi.com/article/10.3390/fuels3010010/s1, Figure S1: The desirability of collective responses for torrefaction treatment factors., Figure S2: Relationship between inside and outside temperature of the batch torrefaction unit during torrefaction process., Figure S3-S9: Response surface chart for bulk, particle, pellet densities, tensile strength, dimensional stability, ash content and HHV of torrefied sawdust respectively as affected by temperature and residence time of torrefaction treatment., Figure S10–S12: Temperature profile recorded from external and internal thermometers in BTU during sawdust torrefaction (230, 260 and 290°C respectively for 45 min)., Table S1–S7: ANOVA for response surface quadratic model of bulk, particle, pellet densities, tensile strength, dimensional stability, ash content and HHV respectively as affected by temperature and residence time of torrefaction treatment., Table S8: Optimal treatment conditions and equations for optimized response variables and values., Table S9: Normal distribution indicators of fibres., Table S10: Mass and energy yield of torrefied sawdust compared to raw sawdust., Table S11: Thermochemical properties of raw and torrefied sawdust.

Author Contributions

Conceptualization, L.G.T. and P.K.A.; methodology, P.A. and L.G.T.; software, P.A.; validation, P.A. and L.G.T.; formal analysis, P.A.; investigation, P.A. and L.G.T.; resources, L.G.T.; data curation, P.A. and L.G.T.; writing—original draft preparation, P.A.; writing—review and editing, L.G.T., P.K.A., D.C., E.M. and B.E.; visualization, P.A.; supervision, L.G.T. and E.M.; project administration, L.G.T. and D.C.; funding acquisition, L.G.T., D.C. and E.M. All authors have read and agreed to the published version of the manuscript.

Funding

This research was funded by the Biofuel Network (BFN) (ASC-16) and Natural Sciences and Engineering Research Council of Canada (NSERC) (RGPIN-2017-05287) for providing funding to this research.

Institutional Review Board Statement

Not applicable.

Informed Consent Statement

Not applicable.

Data Availability Statement

The data presented in this study are available in Supplementary Materials.

Acknowledgments

We appreciate the assistance of Robert Follett, Mistik Management Ltd and Al Balisky, MLTC Industrial Investments LP, also William Campbell, Cuong N. Dao and Richard Evitts for their support throughout the experiment. We thank Tim J. Dumonceaux of Saskatoon Research Centre, Agriculture and Agri-Food Canada for comments on the manuscript.

Conflicts of Interest

The authors declare no conflict of interest.

Abbreviations

ITInside temperature
OTOutside temperature
BTUBatch torrefaction unit
CCDCentral composite design
HHVHigher heating value
NDFNeutral detergent fibre
ADFAcid detergent fibre
GC/MSGas chromatography-mass spectrophotometer
ANOVAAnalysis of variance
STSteam treated
TGAThermogravimetric analysis
DTGDifferential thermogravimetric

References

  1. Carbon Neutrality by 2050: The World’s Most Urgent Mission|United Nations Secretary-General. Available online: https://www.un.org/sg/en/content/sg/articles/2020-12-11/carbon-neutrality-2050-the-world’s-most-urgent-mission (accessed on 17 December 2021).
  2. Luo, H.; Niedzwiecki, L.; Arora, A.; Mościcki, K.; Pawlak-Kruczek, H.; Krochmalny, K.; Baranowski, M.; Tiwari, M.; Sharma, A.; Sharma, T.; et al. Influence of Torrefaction and Pelletizing of Sawdust on the Design Parameters of a Fixed Bed Gasifier. Energies 2020, 13, 3018. [Google Scholar] [CrossRef]
  3. Yun, H.; Clift, R.; Bi, X. Environmental and Economic Assessment of Torrefied Wood Pellets from British Columbia. Energy Convers. Manag. 2020, 208, 112513. [Google Scholar] [CrossRef]
  4. Government of Ontario Archived—The End of Coal. Available online: https://www.ontario.ca/page/end-coal (accessed on 12 December 2021).
  5. Masnadi, M.S.; Grace, J.R.; Bi, X.T.; Lim, C.J.; Ellis, N. From Fossil Fuels towards Renewables: Inhibitory and Catalytic Effects on Carbon Thermochemical Conversion during Co-Gasification of Biomass with Fossil Fuels. Appl. Energy 2015, 140, 196–209. [Google Scholar] [CrossRef]
  6. Amirante, R.; De Palma, P.; Distaso, E.; Pantaleo, A.M.; Tamburrano, P. Thermodynamic Analysis of a Small Scale Combined Cycle for Energy Generation from Carbon Neutral Biomass. Energy Procedia 2017, 129, 891–898. [Google Scholar] [CrossRef]
  7. Schipfer, F.; Kranzl, L. Techno-Economic Evaluation of Biomass-to-End-Use Chains Based on Densified Bioenergy Carriers (DBECs). Appl. Energy 2019, 239. [Google Scholar] [CrossRef]
  8. Riva, L.; Nielsen, H.K.; Skreiberg, Ø.; Wang, L.; Bartocci, P.; Barbanera, M.; Bidini, G.; Fantozzi, F. Analysis of Optimal Temperature, Pressure and Binder Quantity for the Production of Biocarbon Pellet to Be Used as a Substitute for Coke. Appl. Energy 2019, 256, 113933. [Google Scholar] [CrossRef]
  9. Junginger, M.; Goh, C.S.; Faaij, A. History Status & Outlook on Securing Sustainable Bioenergy Supply, Demand and Markets. In International Bioenergy Trade; Springer: Cham, Switzerland, 2014. [Google Scholar]
  10. Verhoeff, F.; Pels, J.R.; Boersma, A.R.; Zwart, R.W.R.; Kiel, J.H. ECN Torrefaction Technology Heading for Demonstration. In Proceedings of the 19th European Biomass Conference and Exhibition (EU BC&E), Berlin, Germany, 6–9 June 2011. [Google Scholar]
  11. Tumuluru, J.S.; Wright, C.T.; Hess, J.R.; Kenney, K.L. A Review of Biomass Densification Systems to Develop Uniform Feedstock Commodities for Bioenergy Application. Biofuels Bioprod. Biorefining 2011, 5, 683–707. [Google Scholar] [CrossRef]
  12. Peng, J.H.; Bi, X.T.; Sokhansanj, S.; Lim, C.J. Torrefaction and Densification of Different Species of Softwood Residues. Fuel 2013, 111, 411–421. [Google Scholar] [CrossRef]
  13. Peng, J.H.; Bi, H.T.; Sokhansanj, S.; Lim, J.C.; Melin, S. An Economical and Market Analysis of Canadian Wood Pellets. Int. J. Green Energy 2010, 7, 128–142. [Google Scholar] [CrossRef]
  14. Larsson, S.H.; Lestander, T.A.; Crompton, D.; Melin, S.; Sokhansanj, S. Temperature Patterns in Large Scale Wood Pellet Silo Storage. Appl. Energy 2012, 92, 322–327. [Google Scholar] [CrossRef]
  15. Peng, J.; Bi, X.T.; Lim, C.J.; Peng, H.; Kim, C.S.; Jia, D.; Zuo, H. Sawdust as an Effective Binder for Making Torrefied Pellets. Appl. Energy 2015, 157, 491–498. [Google Scholar] [CrossRef]
  16. Chen, W.H.; Wang, C.W.; Kumar, G.; Rousset, P.; Hsieh, T.H. Effect of Torrefaction Pretreatment on the Pyrolysis of Rubber Wood Sawdust Analyzed by Py-GC/MS. Bioresour. Technol. 2018, 259, 469–473. [Google Scholar] [CrossRef] [PubMed]
  17. Zhang, S.; Su, Y.; Xu, D.; Zhu, S.; Zhang, H.; Liu, X. Effects of Torrefaction and Organic-Acid Leaching Pretreatment on the Pyrolysis Behavior of Rice Husk. Energy 2018, 149, 804–813. [Google Scholar] [CrossRef]
  18. Ong, H.C.; Chen, W.H.; Singh, Y.; Gan, Y.Y.; Chen, C.Y.; Show, P.L. A State-of-the-Art Review on Thermochemical Conversion of Biomass for Biofuel Production: A TG-FTIR Approach. Energy Convers. Manag. 2020, 209, 112634. [Google Scholar] [CrossRef]
  19. Chih, Y.K.; Chen, W.H.; Ong, H.C.; Show, P.L. Product Characteristics of Torrefied Wood Sawdust in Normal and Vacuum Environments. Energies 2019, 1, 3844. [Google Scholar] [CrossRef] [Green Version]
  20. Koukios, E.G. Progress in Thermochemical, Solid-State Refining of Biofuels—From Research to Commercialization. In Advances in Thermochemical Biomass Conversion; Springer: Cham, Switzerland, 1993. [Google Scholar]
  21. Wang, L.; Riva, L.; Skreiberg, Ø.; Khalil, R.; Bartocci, P.; Yang, Q.; Yang, H.; Wang, X.; Chen, D.; Rudolfsson, M.; et al. Effect of Torrefaction on Properties of Pellets Produced from Woody Biomass. Energy Fuels 2020, 34, 15343–15354. [Google Scholar] [CrossRef]
  22. Li, H.; Liu, X.; Legros, R.; Bi, X.T.; Jim Lim, C.; Sokhansanj, S. Pelletization of Torrefied Sawdust and Properties of Torrefied Pellets. Appl. Energy 2012, 93, 680–685. [Google Scholar] [CrossRef]
  23. Ghiasisis, B. Steam-Assisted Pelletization and Torrefaction of Lignocellulosic Biomass. Master’s Thesis, University of British Columbia, Vancouver, BC, Canada, 2020. [Google Scholar] [CrossRef]
  24. Wu, Y. Systems Analysis of Integrated Southern Pine Torrefaction and Granulation Technology. Master’s Thesis, University of Georgia, Athens, GA, USA, 2013. [Google Scholar]
  25. Mallory, E. Pelleting Torrefied Material. In Biomass Pelletization and Torrefaction Workshop. 2013, pp. 18–20. Available online: https://biomass.ubc.ca/2013/12/11/biomass-pelletization-and-torrefaction-workshop-presentations-now-available/ (accessed on 12 December 2021).
  26. Standard 15149-2; Solid Biofuels. Methods for the Determination of Particle Size Distribution. Vibrating Screen Method Using Sieve Apertures of 3.15 mm and Below. BSI: London, UK, 2010.
  27. Adapa, P.; Tabil, L.; Schoenau, G. Compaction Characteristics of Barley, Canola, Oat and Wheat Straw. Biosyst. Eng. 2009, 104, 335–344. [Google Scholar] [CrossRef]
  28. Tabil, L.; Adapa, P.; Kashaninej, M. Biomass Feedstock Pre-Processing—Part 1: Pre-Treatment. In Biofuel′s Engineering Process Technology; Intech Open: London, UK, 2011. [Google Scholar] [CrossRef] [Green Version]
  29. Adapa, P.; Tabil, L.; Schoenau, G. Pelleting Characteristics of Selected Biomass with and without Steam Explosion Pretreatment. Int. J. Agric. Biol. Emg. 2010, 3, 62–79. [Google Scholar] [CrossRef]
  30. Campbell, W.; Coller, A.; Noble, S.; Evitts, R.; Woytiuk, K. Application of NIRS to the Direct Measurement of Carbonization in Torrefied Wheat Straw Chars. Waste Biomass Valorization 2020, 11, 2949–2959. [Google Scholar] [CrossRef]
  31. Overend, R.P.; Chornet, E.; Gascoigne, J.A.; Hartley, B.S.; Broda, P.M.A.; Senior, P.J. Fractionation of Lignocellulosics by Steam-Aqueous Pretreatments. Philos. Trans. R. Soc. Lond. Ser. A Math. Phys. Sci. 1987, 321, 523–536. [Google Scholar] [CrossRef]
  32. Li, Y.; Liu, H. High-Pressure Densification of Wood Residues to Form an Upgraded Fuel. Biomass Bioenergy 2000, 19, 177–186. [Google Scholar] [CrossRef]
  33. Liu, H.W.; Walter, H.K.; Vogt, G.M.; Vogt, H.S.; Holbein, B.E. Steam Pressure Disruption of Municipal Solid Waste Enhances Anaerobic Digestion Kinetics and Biogas Yield. Biotechnol. Bioeng. 2002, 77, 121–130. [Google Scholar] [CrossRef] [PubMed]
  34. Kaliyan, N.R.; Morey, V. Factors Affecting Strength and Durability of Densified Products. Biomass Bioenergy 2009, 33, 337–359. [Google Scholar] [CrossRef]
  35. Kashaninejad, M.; Tabil, L.G. Effect of Microwave-Chemical Pre-Treatment on Compression Characteristics of Biomass Grinds. Biosyst. Eng. 2011, 108, 36–45. [Google Scholar] [CrossRef]
  36. Mani, S.; Tabil, L.G.; Sokhansanj, S. Effects of Compressive Force, Particle Size and Moisture Content on Mechanical Properties of Biomass Pellets from Grasses. Biomass Bioenergy 2006, 30, 648–654. [Google Scholar] [CrossRef]
  37. Fell, J.T.; Newton, J.M. The Tensile Strength of Lactose Tablets. J. Pharm. Pharmacol. 1968, 20, 657–659. [Google Scholar] [CrossRef]
  38. Fell, J.T.; Newton, J.M. Determination of Tablet Strength by the Diametral-Compression Test. J. Pharm. Sci. 1970, 59, 688–691. [Google Scholar] [CrossRef]
  39. Gilvari, H.; de Jong, W.; Schott, D.L. Breakage Behavior of Biomass Pellets: An Experimental and Numerical Study. Comput. Part. Mech. 2021, 8, 1047–1060. [Google Scholar] [CrossRef]
  40. Adapa, P. Densification of Selected Agricultural Crop Residues as Feedstock for the Biofuel Industry. Ph.D. Thesis, University of Saskatchewan, Saskatoon, SK, Canada, 2011. [Google Scholar]
  41. Valdez, E.; Tabil, L.G.; Mupondwa, E.; Cree, D.; Moazed, H. Microwave Torrefaction of Oat Hull: Effect of Temperature and Residence Time. Energies 2021, 14, 4298. [Google Scholar] [CrossRef]
  42. Colpas, F.; Tarón, A.; Fong, W. Analisis Del Desarrollo Textural de Carbones Activados Preparados a Partir de Zuro de Maíz. Temas Agrar. 2015, 20, 103–112. [Google Scholar] [CrossRef] [Green Version]
  43. Park, J.; Lee, Y.; Ryu, C.; Park, Y.K. Slow Pyrolysis of Rice Straw: Analysis of Products Properties, Carbon and Energy Yields. Bioresour. Technol. 2014, 155, 63–70. [Google Scholar] [CrossRef] [PubMed]
  44. Standard Test Method for Volatile Matter in the Analysis Sample of Coal and Coke. Available online: https://www.astm.org/d3175-20.html (accessed on 6 December 2021).
  45. Gong, C.; Huang, J.; Feng, C.; Wang, G.; Tabil, L.; Wang, D. Effects and Mechanism of Ball Milling on Torrefaction of Pine Sawdust. Bioresour. Technol. 2016, 214, 242–247. [Google Scholar] [CrossRef] [PubMed]
  46. ASTM. Standard Test Method for Gross Calorific Value of Coal and Coke; ASTM International: West Conshohocken, PA, USA, 2019. [Google Scholar]
  47. Yue, Y.; Singh, H.; Singh, B.; Mani, S. Torrefaction of Sorghum Biomass to Improve Fuel Properties. Bioresour. Technol. 2017, 232, 372–379. [Google Scholar] [CrossRef] [PubMed] [Green Version]
  48. Zhang, L.; Li, K.; Zhu, X. Study on Two-Step Pyrolysis of Soybean Stalk by TG-FTIR and Py-GC/MS. J. Anal. Appl. Pyrolysis 2017, 127, 91–98. [Google Scholar] [CrossRef]
  49. Xin, X.; Pang, S.; de Miguel Mercader, F.; Torr, K.M. The Effect of Biomass Pretreatment on Catalytic Pyrolysis Products of Pine Wood by Py-GC/MS and Principal Component Analysis. J. Anal. Appl. Pyrolysis 2019, 138, 145–153. [Google Scholar] [CrossRef]
  50. González Martínez, M.; Dupont, C.; Thiéry, S.; Meyer, X.M.; Gourdon, C. Impact of Biomass Diversity on Torrefaction: Study of Solid Conversion and Volatile Species Formation through an Innovative TGA-GC/MS Apparatus. Biomass Bioenergy 2018, 119, 43–53. [Google Scholar] [CrossRef] [Green Version]
  51. Peng, J.H.; Bi, H.T.; Lim, C.J.; Sokhansanj, S. Study on Density, Hardness, and Moisture Uptake of Torrefied Wood Pellets. Energy Fuels 2013, 27, 967–974. [Google Scholar] [CrossRef]
  52. Wang, C.; Peng, J.; Li, H.; Bi, X.T.; Legros, R.; Lim, C.J.; Sokhansanj, S. Oxidative Torrefaction of Biomass Residues and Densification of Torrefied Sawdust to Pellets. Bioresour. Technol. 2013, 127, 318–325. [Google Scholar] [CrossRef]
  53. Lunguleasa, A.; Ayrilmis, N.; Spirchez, C.; Croitoru, C. Increasing the Calorific Properties of Sawdust Waste from Pellets by Torrefaction. BioResources 2019, 14, 7821–7839. [Google Scholar] [CrossRef]
  54. Stelte, W.; Clemons, C.; Holm, J.K.; Sanadi, A.R.; Ahrenfeldt, J.; Shang, L.; Henriksen, U.B. Pelletizing Properties of Torrefied Spruce. Biomass Bioenergy 2011, 35, 4690–4698. [Google Scholar] [CrossRef] [Green Version]
  55. Stępień, P.; Świechowski, K.; Hnat, M.; Kugler, S.; Stegenta-Dąbrowska, S.; Koziel, J.A.; Manczarski, P.; Białowiec, A. Waste to Carbon: Biocoal from Elephant Dung as New Cooking Fuel. Energies 2019, 12, 4344. [Google Scholar] [CrossRef] [Green Version]
  56. Syguła, E.; Koziel, J.A.; Białowiec, A. Proof-of-Concept of Spent Mushrooms Compost Torrefaction—Studying the Process Kinetics and the Influence of Temperature and Duration on the Calorific Value of the Produced Biocoal. Energies 2019, 12, 3060. [Google Scholar] [CrossRef] [Green Version]
  57. Poudel, J.; Karki, S.; Oh, S.C. Valorization of Waste Wood as a Solid Fuel by Torrefaction. Energies 2018, 11, 1641. [Google Scholar] [CrossRef] [Green Version]
  58. Wilk, M.; Magdziarz, A.; Kalemba, I. Characterisation of Renewable Fuels’ Torrefaction Process with Different Instrumental Techniques. Energy 2015, 87, 259–269. [Google Scholar] [CrossRef]
  59. Byron Bird, R.; Stewart, W.E.; Lightfoot, E.N. Transport Phenomena. Available online: https://books.google.ca/books?hl=en&lr=&id=L5FnNlIaGfcC&oi=fnd&pg=PR13&ots=LKddj3oNlG&sig=OAPO3pZdlZNxebN_yfVkPcnKMEE&redir_esc=y#v=onepage&q&f=false (accessed on 2 December 2021).
  60. Rudolfsson, M.; Stelte, W.; Lestander, T.A. Process Optimization of Combined Biomass Torrefaction and Pelletization for Fuel Pellet Production—A Parametric Study. Appl. Energy 2015, 140, 378–384. [Google Scholar] [CrossRef]
  61. Serrano, C.; Monedero, E.; Lapuerta, M.; Portero, H. Effect of Moisture Content, Particle Size and Pine Addition on Quality Parameters of Barley Straw Pellets. Fuel Process. Technol. 2011, 92, 699–706. [Google Scholar] [CrossRef]
  62. Huang, Y.; Finell, M.; Larsson, S.; Wang, X.; Zhang, J.; Wei, R.; Liu, L. Biofuel Pellets Made at Low Moisture Content—Influence of Water in the Binding Mechanism of Densified Biomass. Biomass Bioenergy 2017, 98, 8–14. [Google Scholar] [CrossRef]
  63. Larsson, S.; Palmqvist, E.; Hahn-Hägerdal, B.; Tengborg, C.; Stenberg, K.; Zacchi, G.; Nilvebrant, N.O. The Generation of Fermentation Inhibitors during Dilute Acid Hydrolysis of Softwood. Enzyme Microb. Technol. 1999, 24, 151–159. [Google Scholar] [CrossRef]
  64. Phanphanich, M.; Mani, S. Impact of Torrefaction on the Grindability and Fuel Characteristics of Forest Biomass. Bioresour. Technol. 2011, 102, 1246–1253. [Google Scholar] [CrossRef]
  65. Phanphanich, M. Pelleting Characteristics of Torrefied Forest Biomass. Master’s Thesis, University of Georgia, Athens, GA, USA, 2010. [Google Scholar]
  66. Verhoeff, F. TorTech: Torrefaction Technology for the Production of Solid Bioenergy Carriers from Biomass and Waste; ECN: Petten, The Netherlands, 2011. [Google Scholar]
  67. Chang, S.; Zhao, Z.; Zheng, A.; He, F.; Huang, Z.; Li, H. Characterization of Products from Torrefaction of Sprucewood and Bagasse in an Auger Reactor. Energy Fuels 2012, 26, 7009–7017. [Google Scholar] [CrossRef]
  68. Chen, W.H.; Kuo, P.C. A Study on Torrefaction of Various Biomass Materials and Its Impact on Lignocellulosic Structure Simulated by a Thermogravimetry. Energy 2010, 35, 2580–2586. [Google Scholar] [CrossRef]
  69. He, Q.; Ding, L.; Gong, Y.; Li, W.; Wei, J.; Yu, G. Effect of Torrefaction on Pinewood Pyrolysis Kinetics and Thermal Behavior Using Thermogravimetric Analysis. Bioresour. Technol. 2019, 280, 104–111. [Google Scholar] [CrossRef] [PubMed]
  70. Cao, L.; Yuan, X.; Jiang, L.; Li, C.; Xiao, Z.; Huang, Z.; Chen, X.; Zeng, G.; Li, H. Thermogravimetric Characteristics and Kinetics Analysis of Oil Cake and Torrefied Biomass Blends. Fuel 2016, 175, 129–136. [Google Scholar] [CrossRef]
  71. Sidiras, D.K.; Nazos, A.G.; Giakoumakis, G.E.; Politi, D.V. Simulating the Effect of Torrefaction on the Heating Value of Barley Straw. Energies 2020, 13, 736. [Google Scholar] [CrossRef] [Green Version]
  72. Li, J.; Brzdekiewicz, A.; Yang, W.; Blasiak, W. Co-Firing Based on Biomass Torrefaction in a Pulverized Coal Boiler with Aim of 100% Fuel Switching. Appl. Energy 2012, 99, 344–354. [Google Scholar] [CrossRef]
  73. Park, S.; Kim, S.J.; Oh, K.C.; Cho, L.H.; Kim, M.J.; Jeong, I.S.; Lee, C.G.; Kim, D.H. Characteristic Analysis of Torrefied Pellets: Determining Optimal Torrefaction Conditions for Agri-Byproduct. Energies 2020, 13, 423. [Google Scholar] [CrossRef] [Green Version]
  74. Świechowski, K.; Liszewski, M.; Bąbelewski, P.; Koziel, J.A.; Białowiec, A. Oxytree Pruned Biomass Torrefaction: Mathematical Models of the Influence of Temperature and Residence Time on Fuel Properties Improvement. Materials 2019, 12, 2228. [Google Scholar] [CrossRef] [Green Version]
  75. Bajcar, M.; Zaguła, G.; Saletnik, B.; Tarapatskyy, M.; Puchalski, C. Relationship between Torrefaction Parameters and Physicochemical Properties of Torrefied Products Obtained from Selected Plant Biomass. Energies 2018, 11, 2919. [Google Scholar] [CrossRef] [Green Version]
  76. Sh, L.; Lee, B.-H.; Lee, Y.-J.; Jeon, C.-H. Comparing the Physicochemical Properties of Upgraded Biomass Fuel by Torrefaction and the Ashless Technique. Appl. Sci. 2019, 9, 5519. [Google Scholar] [CrossRef] [Green Version]
  77. Dudek, M.; Świechowski, K.; Manczarski, P.; Koziel, J.A.; Białowiec, A. The Effect of Biochar Addition on the Biogas Production Kinetics from the Anaerobic Digestion of Brewers’ Spent Grain. Energies 2019, 12, 1518. [Google Scholar] [CrossRef] [Green Version]
  78. Rudolfsson, M.; Borén, E.; Pommer, L.; Nordin, A.; Lestander, T.A. Combined Effects of Torrefaction and Pelletization Parameters on the Quality of Pellets Produced from Torrefied Biomass. Appl. Energy 2017, 191, 414–424. [Google Scholar] [CrossRef]
  79. González-Peña, M.M.; Hale, M.D.C. Colour in Thermally Modified Wood of Beech, Norway Spruce and Scots Pine. Part 1: Colour Evolution and Colour Changes. Holzforschung 2009, 63, 385–393. [Google Scholar] [CrossRef]
  80. Patwardhan, P.R.; Brown, R.C.; Shanks, B.H. Product Distribution from the Fast Pyrolysis of Hemicellulose. ChemSusChem 2011, 4, 636–643. [Google Scholar] [CrossRef]
  81. Rasmussen, H.; Sørensen, H.R.; Meyer, A.S. Formation of Degradation Compounds from Lignocellulosic Biomass in the Biorefinery: Sugar Reaction Mechanisms. Carbohydr. Res. 2014, 385, 45–57. [Google Scholar] [CrossRef]
  82. Prins, M.J.; Ptasinski, K.J.; Janssen, F.J.J.G. More Efficient Biomass Gasification via Torrefaction. Energy 2006, 31, 3458–3470. [Google Scholar] [CrossRef]
  83. Boerjan, W.; Ralph, J.; Baucher, M. Lignin Biosynthesis. Annu. Rev. Plant Biol. 2003, 54, 519–546. [Google Scholar] [CrossRef]
  84. Ghiasi, B.; Kumar, L.; Furubayashi, T.; Lim, C.J.; Bi, X.; Kim, C.S.; Sokhansanj, S. Densified Biocoal from Woodchips: Is It Better to Do Torrefaction before or after Densification? Appl. Energy 2014, 134, 133–142. [Google Scholar] [CrossRef]
  85. Yue, H.; Worrell, E.; Crijns-Graus, W.; Zhang, S. The Potential of Industrial Electricity Savings to Reduce Air Pollution from Coal-Fired Power Generation in China. J. Clean. Prod. 2021, 301, 126978. [Google Scholar] [CrossRef]
  86. Zhang, Y.; Chen, F.; Chen, D.; Cen, K.; Zhang, J.; Cao, X. Upgrading of Biomass Pellets by Torrefaction and Its Influence on the Hydrophobicity, Mechanical Property, and Fuel Quality. Biomass Convers. Biorefinery 2020. [Google Scholar] [CrossRef]
  87. Pimchuai, A.; Dutta, A.; Basu, P. Torrefaction of Agriculture Residue to Enhance Combustible Properties. Energy Fuels 2010, 24, 4638–4645. [Google Scholar] [CrossRef]
  88. Ren, S.; Lei, H.; Wang, L.; Bu, Q.; Wei, Y.; Liang, J.; Liu, Y.; Julson, J.; Chen, S.; Wu, J.; et al. Microwave Torrefaction of Douglas Fir Sawdust Pellets. Energy Fuels 2012, 26, 5936–5943. [Google Scholar] [CrossRef]
Figure 1. Process flowchart for torrefaction and densification of wood sawdust.
Fuels 03 00010 g001
Figure 2. Schematic representation of the batch torrefaction unit (BTU), adapted from [30]. 1: Indicating temperature controller; 2: Temperature control element; 3, 7, 8, 16 and 19: Local temperature gauges; 4: Insulation; 5: Wood sample; 6: Tube reactor; 9: Time-base temperature controller; 10: Mass flow-rate controller; 11: Pressure regulator; 12: Nitrogen tank; 13: Conduction heaters; 14: Furnace heating zone; 15: Ice-NaCl bath; 17: Torrefaction liquor; 18: Fume hood; 20 and 21: Heating tape; 22: Thermocouple; 23: Porous metal distributor.
Fuels 03 00010 g002
Figure 3. Particle size distribution of different raw and torrefied materials using inside temperature (IT) or outside temperature (OT).
Fuels 03 00010 g003
Figure 4. Relationship between mass loss and higher heating value with severity factor (A); and mass and energy yield with severity factor (B) of torrefaction process using inside temperature.
Fuels 03 00010 g004
Figure 5. TGA results of raw and torrefied wood sawdust (A) indicate mass loss and (B) decomposition rate during thermal heating.
Fuels 03 00010 g005
Figure 6. Proximate analysis (A) and oxygen/carbon, hydrogen/carbon ratios of wood sawdust before and after torrefaction (B).
Fuels 03 00010 g006
Figure 7. Torrefaction liquids (A) from torrefied wood sawdust (B). Labels 1-3 are indicators for OT samples torrefied at 230, 260 and 290 °C, respectively and 4 is for optimized treatment at 230 °C.
Fuels 03 00010 g007
Figure 8. Illustrations of treated and non-treated pellets before (top) and after (bottom) moisture absorption test. From left to right: pellet made of raw sawdust (1), steam-treated (2), raw sawdust with 10% (3) and 20% ST (4), optimized torrefied sawdust with 10% (5) and 20% ST (6), torrefied sawdust at outside temperatures of 230 (7), 260 (8) and 290 °C (9) with 20% ST.
Fuels 03 00010 g008
Figure 9. Moisture uptake of torrefied sawdust and resultant pellets with 20% steam-treated binder; IT: inside temperature, OT: outside temperature.
Fuels 03 00010 g009
Table 1. Code levels utilized in the central composite design and real factor levels corresponding to coded factor levels for torrefaction pretreatment.
Independent VariableCodeReal Factor Level at
Coded Factor Levels
−1     0     1
Temperature (°C)X1 230    260    290
Residence time (min)X2 15     30     45
Table 2. Mean values of physical and mechanical properties of torrefied vs. non-treated sawdust and resultant pellets.
Biomass Pellet
RunTemperature (°C)Time
(min)
Bulk
Density
(kg/m3)
Particle
Density
(kg/m3)
Ash
Content
(%)
HHV 1 (Dry)
(MJ/kg)
Pellet
Density (kg/m3)
Tensile
Strength
(MPa)
Dimensional
Stability
(%)
0--117.3814100.2217.491044.60.312.62
123015154.141396.400.2717.201026.720.190.43
223030156.251371.500.2317.301048.410.231.05
323045161.9551356.100.2217.361039.770.211.81
426015146.0451390.100.2917.39983.690.141.24
526030 (1)159.061381.100.2817.66981.530.121.12
626030 (2)176.771370.300.2517.58992.550.160.30
726030 (3)170.311352.100.2817.491000.670.140.49
826030 (4)164.541400.100.2617.521002.450.162.47
926030 (5)165.2851375.200.2917.50989.360.170.53
1026045162.941408.300.2817.87991.950.151.18
1129015149.321341.700.3018.49976.820.132.18
1229030151.9351328.800.3118.59993.530.151.65
1329045153.0451338.600.2818.56955.960.081.49
1 Higher heating Value.
Table 3. Geometric mean diameter (dgw) and geometric standard deviation (Sgw) of non-treated and treated sawdust particles.
Sampledgw (mm)Sgw (mm)
Sawdust0.330.20
Torrefied at 230 °C (IT 1)0.330.17
Torrefied at 230 °C (OT 2)0.320.14
Torrefied at 260 °C (OT 2)0.320.15
Torrefied at 290 °C (OT 2)0.380.21
1 IT: inside temperature, 2 OT: outside temperature.
Table 4. Chemical composition of torrefied and raw sawdust.
ComponentsSawdustTorrefied
at 230 °C
(IT 1)
Torrefied
at 230 °C
(OT 2)
Torrefied
at 260 °C
(OT 2)
Torrefied
at 290 °C
(OT 2)
Ash (%)0.230.500.370.360.55
Lignin (%)25.1725.6639.1449.3973.95
Hemicellulose (%)14.4718.035.562.491.68
Cellulose (%)50.3949.4448.8842.0312.77
Solubles (%)9.746.426.0911.606.86
1 IT: inside temperature, 2 OT: outside temperature.
Table 5. The total yield of torrefied products in three phases.
OutputsTorrefied
at 230 °C (IT 1)
Torrefied
at 230 °C
(OT 2)
Torrefied
at 260 °C
(OT 2)
Torrefied
at 290 °C
(OT 2)
Solid (wet) (%)90.9772.4864.8347.55
Liquid (%)7.7313.7219.6927.98
Gas (%)1.3013.815.4824.47
1 IT: inside temperature, 2 OT: outside temperature.
Table 6. Main compounds of torrefaction liquid product from wood sawdust torrefaction.
ComponentsTorrefied at
230 °C (IT 1) (% Area)
Torrefied (OT 2) (% Area)
230 °C260 °C290 °C
Furfural41.7930.180.432
Carbonyl sulphide22.48
Aminoguanidine6.145.765.08
Phenol, 2-methoxy-3.847.453.697.21
2-Hexene3.036.860.9114.29
Hydroquinone2.432.36
1-Propanamine, 3-ethoxy-1.981.73
Vanillin1.842.36
1,2:5,6-Dianhydrogalactitol1.821.782.511.98
Phenol, 2-methoxy-4-methyl-1.534.510.4814.87
1-Penten-3-ol1.370.86
9-Octadecenoic acid (Z)-, methyl ester1.37
Gibberellic acid1.251.541.560.45
2-Butenal, 2-ethyl-0.86 0.811.78
Acetic acid 17.127.93
Cyclohexanone 3.286.997.35
Propanoic acid, anhydride 3.32
Undecanoic acid, hydroxy-, lactone 1.351.185.93
Oxirane, [[(2-ethylhexyl)oxy]methyl]- 0.160.331.88
2-Tridecanone 18.04
Digitoxin 17.542.94
Cyclohexanone, 2-nitro- 5.69
Butane, 1,1′-[oxybis(2,1-ethanediyloxy)]bis- 2.77
Propanoic acid, 2,2-dimethyl- 2.72
1-Propene, 3-ethoxy- 1.93
Benzaldehyde, 3-hydroxy-4-methoxy- 1.65
2,4-Dimethoxytoluene 0.922.34
2-Butenal, 2-ethyl- 0.81
2-Cyclopenten-1-one, 2-hydroxy-3-methyl- 0.6618.47
Propanal 2.1
Total91.7390.6283.8283.59
1 IT: inside temperature, 2 OT: outside temperature.
Table 7. Mean values of physical and mechanical properties of treated and non-treated pellets.
SampleBinder
(ST 1)
(%)
Moisture
Content (Dry)
(%)
Pellet
Density
(kg/m3)
Tensile Strength (MPa)Dimensional
Stability
(%)
Moisture
Absorption (%)
Sawdust08.701044.60.312.6216.85
108.211095.920.562.7514.99
208.001114.140.742.4114.65
Steam-treated
(Spruce sawdust)
NA 25.531262.512.802.649.93
Torrefied at 230 °C (IT 3)0101039.770.211.8113.72
109.211035.280.272.8414.54
207.471068.670.722.8313.65
Torrefied at 230 °C (OT 4)010955.31---
205.741054.791.081.5610.74
Torrefied at 260 °C (OT 4)010892.79---
205.281023.480.982.6310.36
Torrefied at 290 °C (OT 4)010NA 2NA 2NA 2NA 2
204.85871.730.604.689.40
1 ST: steam-treated sawdust at 220 °C for 9 min, 2 not applicable, 3 IT: inside temperature, 4 OT: outside temperature.
Table 8. Thermochemical features of torrefied and non-torrefied pellets.
Pellet SampleBinder
(ST 1)
HHV 4
(Dry)
(MJ/kg)
Proximate Analysis
(% wt., Dry)
Ultimate Analysis (% wt., Dry)
(%)Fixed
Carbon
VolatileAshN 5C 6H 7S 8O 9O/CH/C
Sawdust1017.4818.2074.940.090.0448.466.660.0144.840.930.14
2017.6418.4074.700.110.0248.576.630.0344.750.920.14
Torrefied
at 230 °C (IT 2)
1017.8317.2976.420.20.0749.056.500.1044.290.900.13
2018.0317.7476.080.20.0648.906.460.0944.490.910.13
Torrefied
at 230 °C (OT 3)
2019.2924.5869.240.500.0551.226.150.0342.550.830.12
Torrefied
at 260 °C (OT 3)
2020.1632.0461.950.400.0653.896.040.1739.850.740.11
Torrefied
at 290 °C (OT 3)
2022.7244.4549.470.510.0560.905.720.0533.280.550.09
1 ST: Steam-treated sawdust, 2 IT: inside temperature, 3 OT: outside temperature, 4 HHV: higher heating value, 5 N: nitrogen, 6 C: carbon, 7 H: hydrogen, 8 S: sulphur, 9 O: oxygen.
Publisher’s Note: MDPI stays neutral with regard to jurisdictional claims in published maps and institutional affiliations.

