Article

Numerical Investigation of Dual Fuel Combustion on a Compression Ignition Engine Fueled with Hydrogen/Natural Gas Blends

by
Francesco Scrignoli
,
Filippo Vecchio
,
Francesco Legrottaglie
,
Enrico Mattarelli
and
Carlo Alberto Rinaldini
*
Dipartimento di Ingegneria “Enzo Ferrari”, Università degli Studi di Modena e Reggio Emilia, Via Pietro Vivarelli 10, 41125 Modena, Italy
*
Author to whom correspondence should be addressed.
Fuels 2022, 3(1), 132-151; https://doi.org/10.3390/fuels3010009
Submission received: 21 December 2021 / Revised: 9 February 2022 / Accepted: 21 February 2022 / Published: 1 March 2022

Abstract

:
The present work aims to assess the influence of the composition of blends of hydrogen (H2) and Natural Gas (NG) on Dual Fuel (DF) combustion characteristics, including gaseous emissions. The 3D-CFD study is carried out by means of a customized version of the KIVA-3V code. An automotive 2.8 L, 4-cylinder turbocharged diesel engine was previously modified in order to operate in DF NG–diesel mode, and tested at the dynamometer bench. After validation against experimental results, the numerical model is applied to perform a set of combustion simulations at 3000 rpm–BMEP = 8 bar, in DF H2/NG-diesel mode. Different H2–NG blends are considered: as the H2 mole fraction varies from 0 vol% to 50 vol%, the fuel energy within the premixed charge is kept constant. The influence of the diesel Start Of Injection (SOI) is also investigated. Simulation results demonstrate that H2 enrichment accelerates the combustion process and promotes its completion, strongly decreasing UHC and CO emissions. Evidently, CO2 specific emissions are also reduced (up to about 20%, at 50 vol% of H2). The main drawbacks of the faster combustion include an increase of in-cylinder peak pressure and pressure rate rise, and of NOx emissions. However, the study demonstrates that the optimization of diesel SOI can eliminate all aforementioned shortcomings.

1. Introduction

Greenhouse gas (GHG) emissions caused by human activities are responsible, thus far, for an average global warming of about 1.0 °C, compared to the pre-industrial era. In particular, Figure 1 shows an average increase of the global temperature relative to the period 1961–1990 of approximately 0.7 °C [1]. Recently, scientists warned that global warming could rise even up to 4 °C by the end of the century if a carbon-neutral economy is not be achieved by 2050 [2]. As a result, the 2021 edition of the United Nations Annual Climate Change Conference (COP26) recommended a halving of emissions from all economic sectors over the next decade and reaching net zero carbon emissions by the middle of the century [3].
As far as the road transport sector is concerned, many different technologies can be considered for the abatement of GHG emissions at the tailpipe of Internal Combustion Engines (ICEs). Among them, the use of low-carbon fuels and carbon-neutral fuels (bio-fuels and e-fuels), present a very promising solution to strongly reduce carbon dioxide (CO2) emissions, while maintaining all practical advantages of conventional powertrains, in comparison to Battery Electric Vehicles (BEVs). Moreover, running ICEs on hydrogen (H2), blended with other fuels or alone (see references [4,5], respectively) yields a further advantage: since H2 does not contain carbon, its combustion does not produce carbon monoxide (CO), CO2, Unburnt Hydrocarbons (UHC) and soot. The only critical pollutants are the nitrogen oxides (NOx), which may be effectively controlled and reduced by means of a proper after-treatment device.
The fundamental role of H2 in the future mobility scenario, as well as in many other economic sectors, is highlighted, as an example, by the “EU Hydrogen Strategy” [6], included in the framework of the “European Green Deal” [7], and reaffirmed in the “NextGenerationEU” recovery plan [8]. The European Union clearly intends to promote environmentally-friendly technologies focused on the use of green hydrogen.
Therefore, in addition to fuel cells and BEVs, ICEs can continue to represent a fundamental technology for vehicle propulsion, provided that their main drawbacks (i.e., CO2 and pollutant emissions) are fully addressed or at least strongly mitigated. This purpose can be achieved by enhancing the efficiency of the combustion process and switching to the use of sustainable fuels. The most promising techniques thus far appear to be: Pre-Chamber (PC) combustion for Spark Ignition (SI) engines [9]; Dual Fuel (DF) combustion for Compression Ignition (CI) engines.
It is generally recognized by most researchers that DF combustion can provide ultra-low NOx and soot emissions, and, at the same time, excellent Brake Thermal Efficiency (BTE) [10]. Moreover, low carbon-print fuels can be employed successfully in this combustion mode. In particular, Natural Gas (NG) [11], ethanol [12], methanol [13] and Liquefied Petroleum Gas (LPG) [14] can be used as low reactivity fuels, while biodiesel [15] and Dimethyl Ether (DME) [16] are suitable as high reactivity fuels.
DF NG–diesel combustion is particularly attractive since the hydrogen-to-carbon ratio of methane (CH4) is the highest among hydrocarbons. The main drawback that affects this combustion technique is the high amount of UHC in the exhaust gas, especially at low loads. A viable strategy to address this issue is to add some H2 to the lean premixed NG–air mixture entering the cylinder: even a small amount strongly promotes the oxidation of CO and UHC during combustion [17,18].
As an example, Rahnama et al. [19] explored the effect of H2 addition to the intake air, varying the H2 mole fraction from 0% to 5%, on a Heavy Duty (HD) DF NG–diesel engine. The analyzed operating condition is: 1300 rpm-Indicated Mean Effective Pressure (IMEP) equal to 9 bar (0.9 MPa). The results show a reduction of UHC emissions of about 67% (from 3.4 g/kWh to 1.1 g/kWh) and of CO emissions of about 46% (from 1.5 g/kWh to 0.8 g/kWh). Moreover, the authors report a reduction of soot of about 55%. The benefit of H2 on soot emissions was confirmed by Zhou et al. [20], in similar conditions.
Liu et al. [21] observed that H2 bears a more noticeable effect on the early stage of the combustion process, when the higher combustion temperature associated with H2 promotes the ignition of the surrounding NG.
Thripathi et al. [22] carried out a numerical study on the influence of the diesel injection strategy, considering a dual fuel, medium bore (102 mm) engine, running on hydrogen at 1500 rpm. In the single injection case, they found that advancing the injection timing reduces the HC, CO and soot emissions and increases the NOx emission and rate of pressure rise. Regarding dual injection, in order to match the targets of enhanced performance and reduced emissions, 16° bTDC represented the optimum timing for pilot, 10% the optimum pilot mass, and 8° bTDC the optimum main injection timing. The maximum value of gross Indicated Mean Effective Pressure (gIMEP) was about 10 bar (1.0 MPa)
As can be deduced from the previous section, most of the published studies on DF combustion with hydrogen and/or NG are carried out on converted HD diesel engines running at 1300–1500 rpm. Conversely, the present paper is focused on a light-duty turbocharged compression ignition engine, running at a higher speed (3000 rpm) and comparable thermal load.
This type of engine may be of interest for a new generation of compact and efficient DF power units, whose application can vary from light commercial vehicles to industrial engines, delivering low–medium power rates. Standardization can reduce the cost of research and development, also permitting the transfer to advanced technologies already available for passenger cars (as an example, electronic injection systems, turbochargers, smart construction and manufacturing techniques…). Moreover, in comparison to conventional SI engines running on NG, biogas, ethanol, hydrogen, et cetera, this new generation of light DF engines would bear the potential of a higher brake thermal efficiency, maintaining comparable dimensions and weight.
In order to convert such a potential into real value, it is necessary to gain a deep understanding of the DF combustion process, as well as to assess the influence of H2–NG blend composition. On the one hand, it would be highly desirable to run the engine on H2 only (no CO2); on the other hand, the issues of availability, storage and cost of H2 in the short and medium term present a huge challenge for this proposition. Clearly, a trade-off must be identified, considering the evolving conditions. A practical proposition, at least for the foreseeable future, is to limit the volumetric share of H2 to 30%: this figure represents the threshold to avoid major modifications to existing systems for gas distribution and injection.
In this context, the main goal of the current study is to provide an insight on DF combustion with NG and H2, considering light-duty diesel engines running at a representative speed and load. The influence of diesel injection strategy is assessed, along with the influence of the low reactivity fuel composition.
The work described in the paper consists of a 3D-CFD analysis, carried out by means of a customized version of KIVA-3V. As reported in a previous paper [23], the original diesel engine was modified in order to operate in DF NG–diesel mode. Then, a comprehensive experimental campaign was undertaken, at different operating conditions. The experimental data provided the basis for the validation of the 3D-CFD cylinder model. After validation, the model was employed to perform a set of simulations at an operating condition corresponding to 3000 rpm–Brake Mean Effective Pressure (BMEP) = 8 bar in DF H2/NG–diesel mode. The influence of an H2 mole fraction spanning from 0% to 50% was investigated.

2. Materials and Methods

2.1. The Reference Engine

The engine used in the study is an automotive High-Speed Direct-Injection (HSDI) diesel unit, manufactured by FCA-VM Motori. It is a four cylinder in-line, with a total displacement of 2780 cc, four valves per cylinder. It is equipped with a high-pressure common-rail fuel-injection system, featuring six-holed injectors. The main characteristics of the engine are listed in Table 1.
As mentioned above, the engine was modified in order to operate in DF NG–diesel mode: in detail, four NG injectors were installed on the engine inlet pipe, just downstream of the intercooler and about 500 mm before the intake manifold. The relatively long distance between the injectors and the intake manifold favors the formation of a homogeneous NG–air mixture and its uniform distribution among the 4 cylinders. Moreover, the EGR valve was constantly held shut, therefore the influence of charge dilution with exhaust gas was not considered. Different DF operating points, varying both the engine load and the amount of diesel substitution with NG, were investigated. The results of the experimental campaign are reported in [23].
The current study is focused on the operating condition corresponding to 3000 rpm BMEP = 8 bar. Table 2 reports the main parameters for both DF NG–diesel mode and for normal diesel mode (referred to as ND).

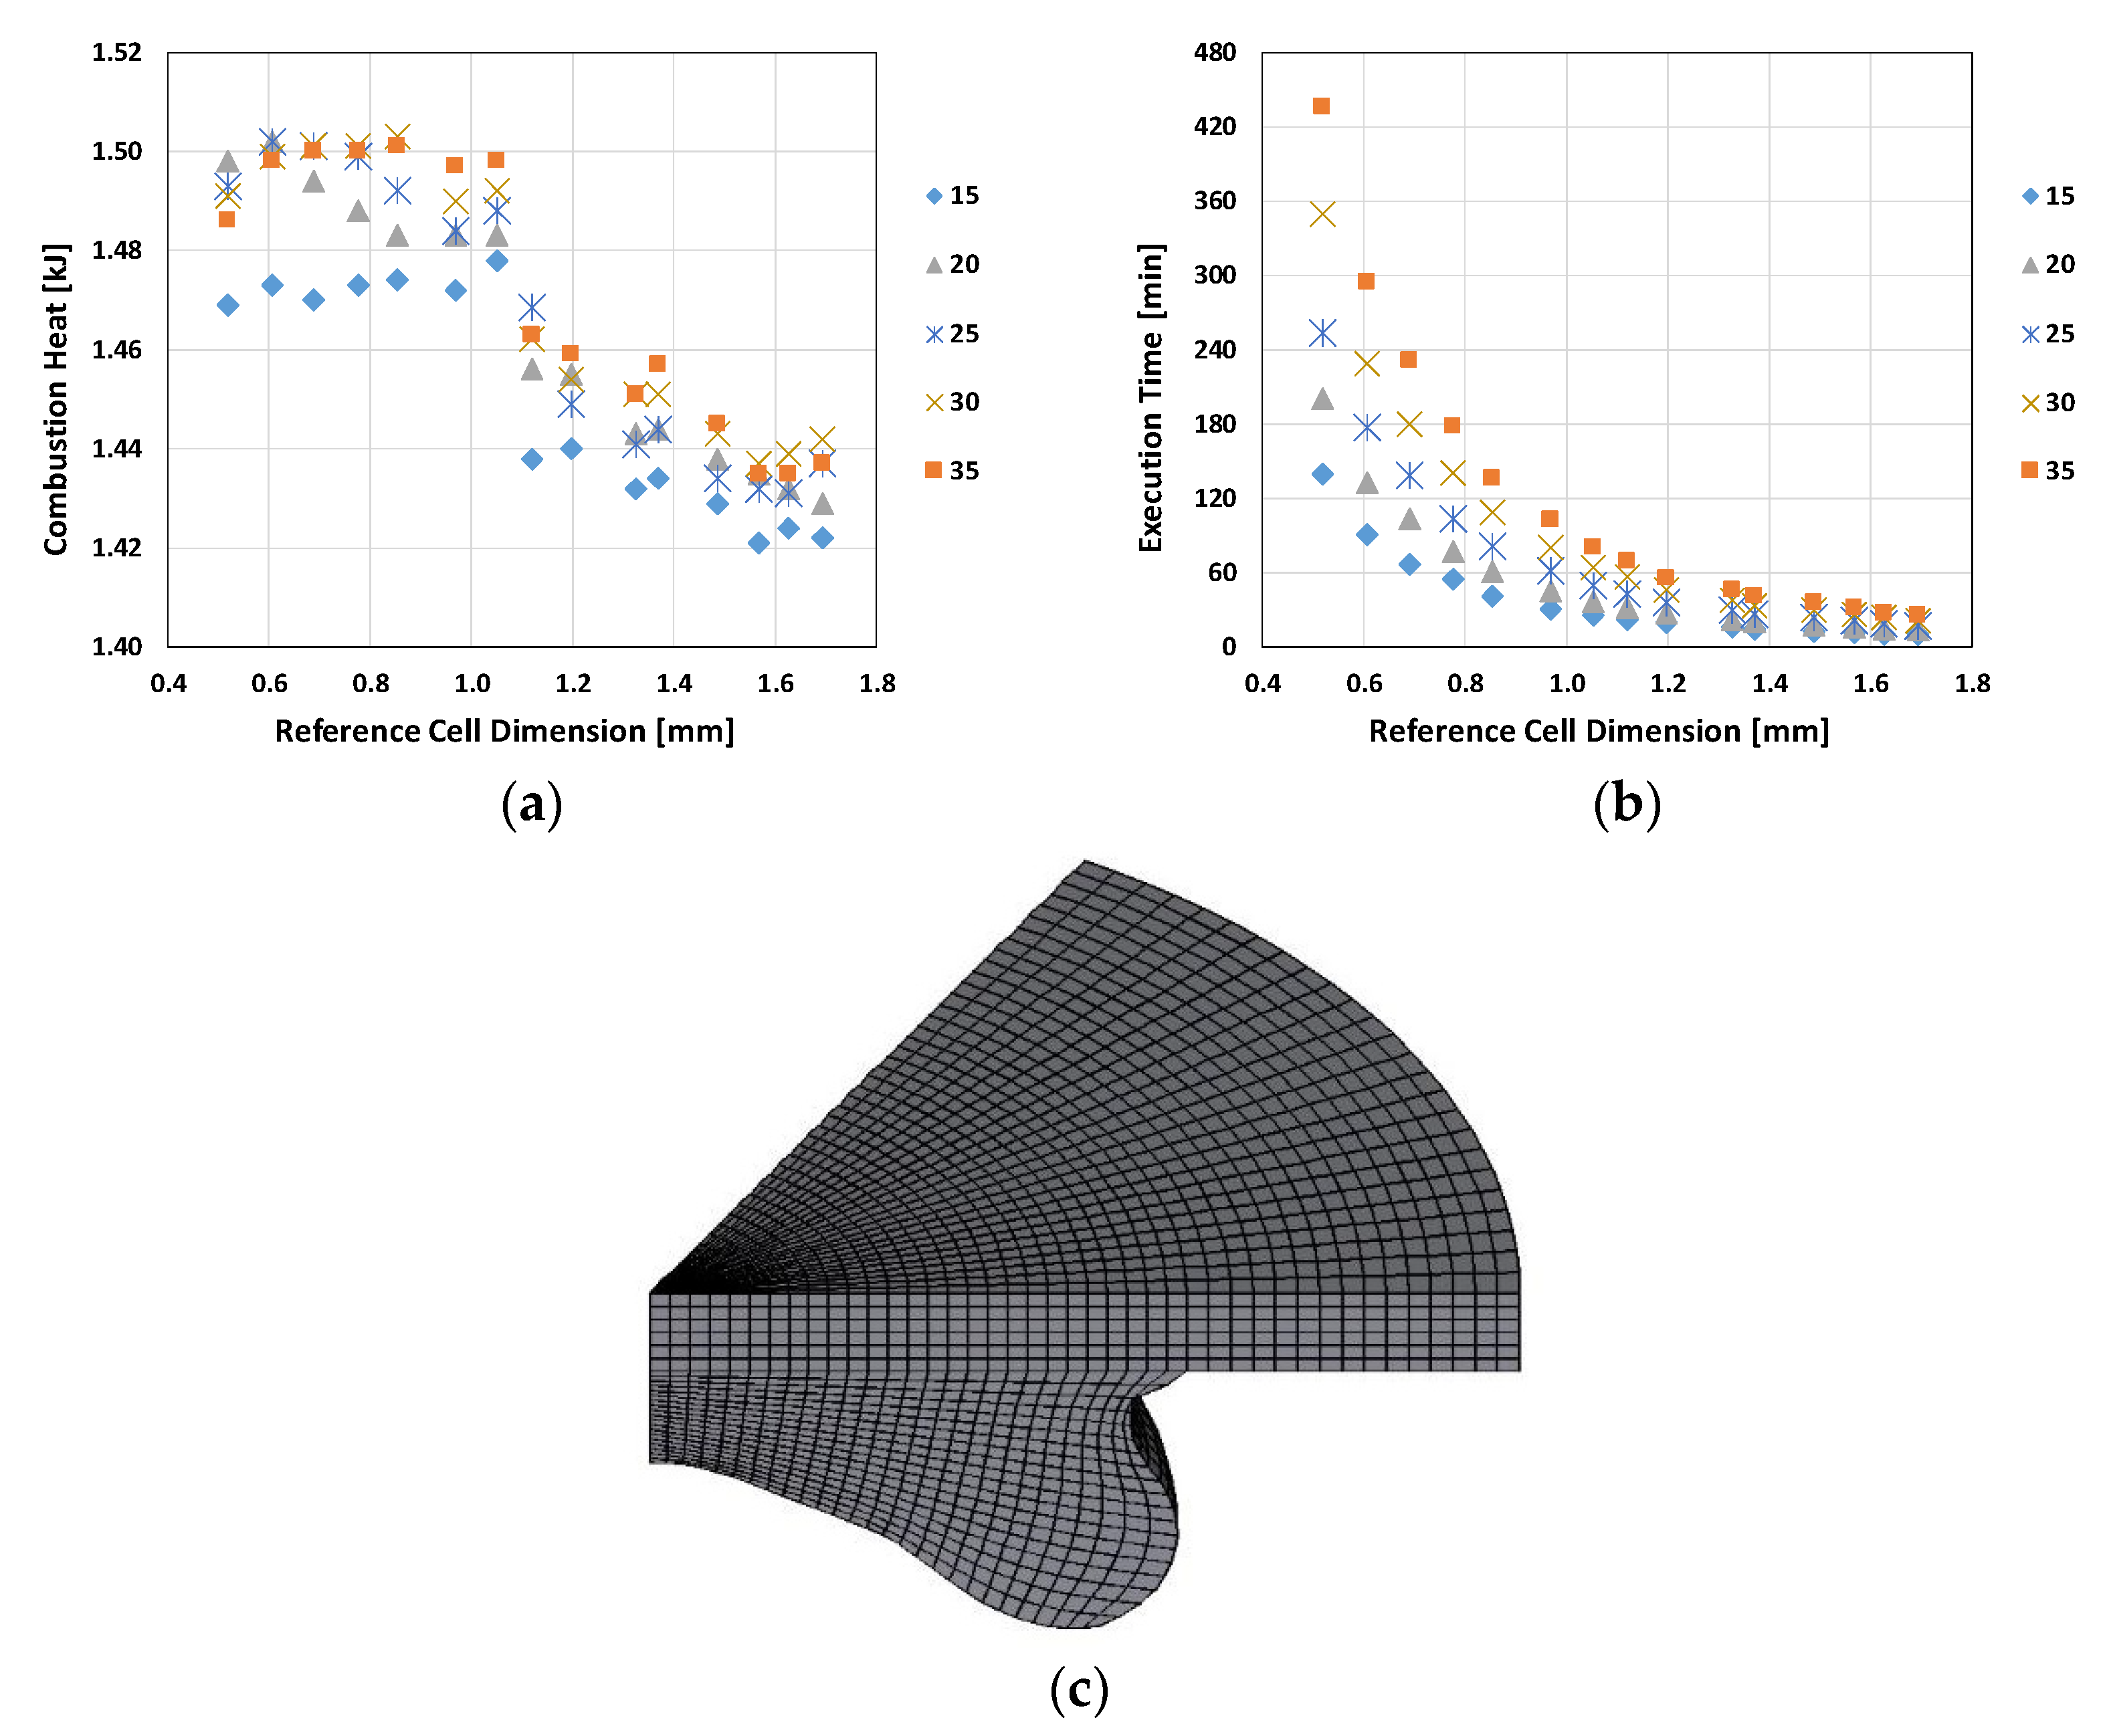
2.2. The 3D-CFD Model

For the combustion analysis, a customized version of the KIVA-3V code was used [24]. The code solves the conservation equations for evaporating fuel sprays, coupled with the 3-Dimensional Computational Fluid Dynamics (3D-CFD) equations of compressible, multi-component, reactive gases in an engine cylinder with arbitrarily-shaped piston geometry.
The DF combustion model implemented in the customized version of the code includes two different sub-models: the traditional Partially Stirred Reactor combustion mode (PaSR, fully described in [25]) and the Flame Propagation mode (fully described in [26]). The NG is modeled as a 3-component mixture of methane ( CH 4 ,   96 vol%), ethane ( C 2 H 6 ) and propane ( C 3 H 8 ), while the Diesel Oil Surrogate (DOS) model has been implemented in the code in order to represent the diesel fuel [27]. The DOS model is based on: a single component liquid fuel (equivalent chemical formula: H14H28) containing the same main properties of real diesel and a two component vapor model constituted of a blend of n-heptane (H7H16) and toluene (H7H8). The mechanism developed to simulate the DF combustion is comprised of 81 species and 421 reactions.
The fuel models and the combustion mechanism were preliminary validated through comparison with experimental data in terms of ignition delay times in shock tube experiments and flame propagation data for constituent components of natural gas. More details and the validation process data are fully described in [26,28].
The customized version of the KIVA code includes also the Kelvin–Helmholtz/Rayleigh–Taylor (KHRT) atomization model for the prediction of the diesel spray evolution during injection phase [29].
Finally, the same customized version of KIVA-3V code employed in the present study was already utilized by the authors to simulate different diesel and DF engines and the simulations results were consistently identified in good agreement with experiments, as reported in [27,28,30,31,32].
The computational grid was built with the K3PREP pre-processor, included in the KIVA-3V software [24]. Due to the almost perfect axial-symmetric geometry of the combustion chamber and of the injection nozzle, characterized by six holes, a 60° sector grid was considered and proper periodic boundary conditions were imposed.
In building the grid, particular attention was dedicated to assuring a good aspect ratio to the cells and to correctly reproduce the actual combustion chamber geometry. The squish region was adapted in order to precisely reproduce the engine compression ratio and a layer of six cells was imposed in the squish region at Top Dead Center (TDC).
In order to define the typical cell size, an analysis on different grids was carried out. Considering that the sector mesh is built rotating along the circumferential direction a 2D grid of the combustion chamber (see Figure 2c), the different grids were created varying both the reference cell dimension of the 2D mesh (from 0.5 to 1.7 mm) and the number of cells along the circumferential direction (from 15 to 35 cells, corresponding to an angular step between 1.7° and 4° per cell). According to K3PREP notation, in the following, the number of cells along the circumferential direction will be indicated as Ny. In total, 75 computation grids were built, with a number of cells at BDC varying from about 7.500 to about 188.000.
Figure 2a,b summarizes the main results of the analysis: the former shows the dependency of one of the most important outputs of the simulations (the total heat released) as a function of typical cell size dimension for different Ny values; the latter illustrates the computational time for the different computational grids. Observing Figure 2a, it is possible to identify 2 different zones: for cell sizes greater than 1.1 mm, the output is dependent on the cell size itself, while, for cell sizes lower that 1.1 mm the results tend toward a single value (excluding only the points with Ny = 15, values that evidently represent an excessively coarse circumferential discretization). In particular, considering only the grids with Ny between 25 and 35, the results with a cell size lower than 0.8 mm are almost superimposed. Moreover, considering the computational cost, which increases exponentially with decreases in cell size (Figure 2b), it is possible to identify a cell size of 0.78 and Ny equal to 25 as the best tradeoff between accuracy and computational cost. This conclusion also aligns with previous analyses carried out by authors on other combustion geometries.
The final computational grid, built with the criteria above explained, is reported in Figure 2c; it is comprised of about 80,000 cells at BDC and about 24,000 cells at TDC while the typical cell dimension of the 2D mesh varies between 0.5 and 1.0 mm (mean value 0.78 mm).
The combustion simulations are carried out at closed valves, starting at Intake Valve Closing (IVC, −130 CA °AFTDC) and stopping at Exhaust Valve Opening (EVO, 112 CA °AFTDC). Initial conditions, such as pressure, temperature, trapped mass, and charge composition, are directly obtained from the experimental data. The initial flow field is imposed as a rigid vortex around the cylinder axis; its intensity (Swirl Ratio equal to 1.8) was calculated by a previous 3D-CFD intake stroke simulation. When assessing the influence of a diesel injection strategy, the restart function is used in order to minimize the computational effort: the compression stroke from IVC to −40 CA °AFTDC is simulated only once, while all the other calculations, characterized by different injection laws, start from the last point.

2.3. Combustion Model Validation

The first phase of the work consisted of the calibration and validation of the numerical model for both the ND and the DF operations at 3000 rpm–BMEP = 8 bar. The calibration basically consisted of tuning the shape of the diesel injection law, and some other minor parameters that were not defined in the set of initial conditions provided by the previous CFD-1D simulation. Figure 3a–d shows a comparison between numerical and experimental results in terms of in-cylinder pressure and Apparent Heat Release Rate (AHRR). The numerical results agree fairly well with the experiments.
Another parameter considered for the validation of the model is the specific work transferred from gas to piston in the interval from −40 CA° to 114 CA° after TDC (EVO). This parameter, referred to as gross Indicated Mean Effective Pressure (IMEP*), is calculated by the following formula:
IMEP * = 40   CA °   AFTDC EVO pdV V d
Vd is the engine unit displacement, p and V are pressure and volume within the cylinder.
Table 3 presents a comparison between simulation and experiments in terms of IMEP* and peak in-cylinder pressure. The data further confirm the consistency of the numerical model, in both combustion modes.

2.4. H2-NG Blend Simulations

In the second phase of the study, the calibrated numerical model was employed to assess the influence of composition of an H2–NG blend (also called Hythane) on performance and emissions at 3000 rpm/BMEP = 8 bar. As the H2 volumetric fraction in the H2–NG blend varies, the global fuel energy contained in the premixed charge is kept constant.
It is important to notice that, in most experimental studies on Hythane, the maximum volumetric concentration of H2 is 30%. This limitation permits the replacement of Compressed Natural Gas (CNG) with Hythane with minimum modifications to the existing storage and injection systems. However, this numerical study was extended up to 50 vol% of H2, in order to provide a wider perspective.
The volumetric fractions of the various components used to represent the mixtures of Low Reactivity Fuels (LRF), are reviewed in Table 4.
Further parameters are provided in Table 5, in particular: the mass of each main fuel component; the actual Air–Fuel (A/F) ratio of the premixed charge, ( A / F ) premix ; the correspondent stoichiometric value ( ( A / F ) st ,   premix ) and the relative A/F ratio ( λ premix ); the total A/F ratio (considering the injected diesel fuel), ( A / F ) tot ; the correspondent values of stoichiometric A/F ( ( A / F ) st , tot ) and Lambda ( λ tot ), where:
λ = A F ( A F ) st
Observing Table 5, one can notice that Lambda is much higher than 1, for both the premixed charge (1.83) and for the one including the injected diesel fuel (1.45). This means that the engine always works in lean conditions. Moreover, λ premix and λ tot are very similar for the different blends. This is due to the concurrent increment of ( A / F ) and ( A / F ) st as the fraction of H2 increases in the H2–NG blend. The last two columns of Table 5 represent, respectively, the energy and the mass of H2 divided by the energy and mass associated to the H2–NG–diesel mixture. Since the Lower Heating Value (LHV) of H2 is more than twice that of NG, the mass fraction of H2 is less than half its energy fraction.

3. Results and Discussion

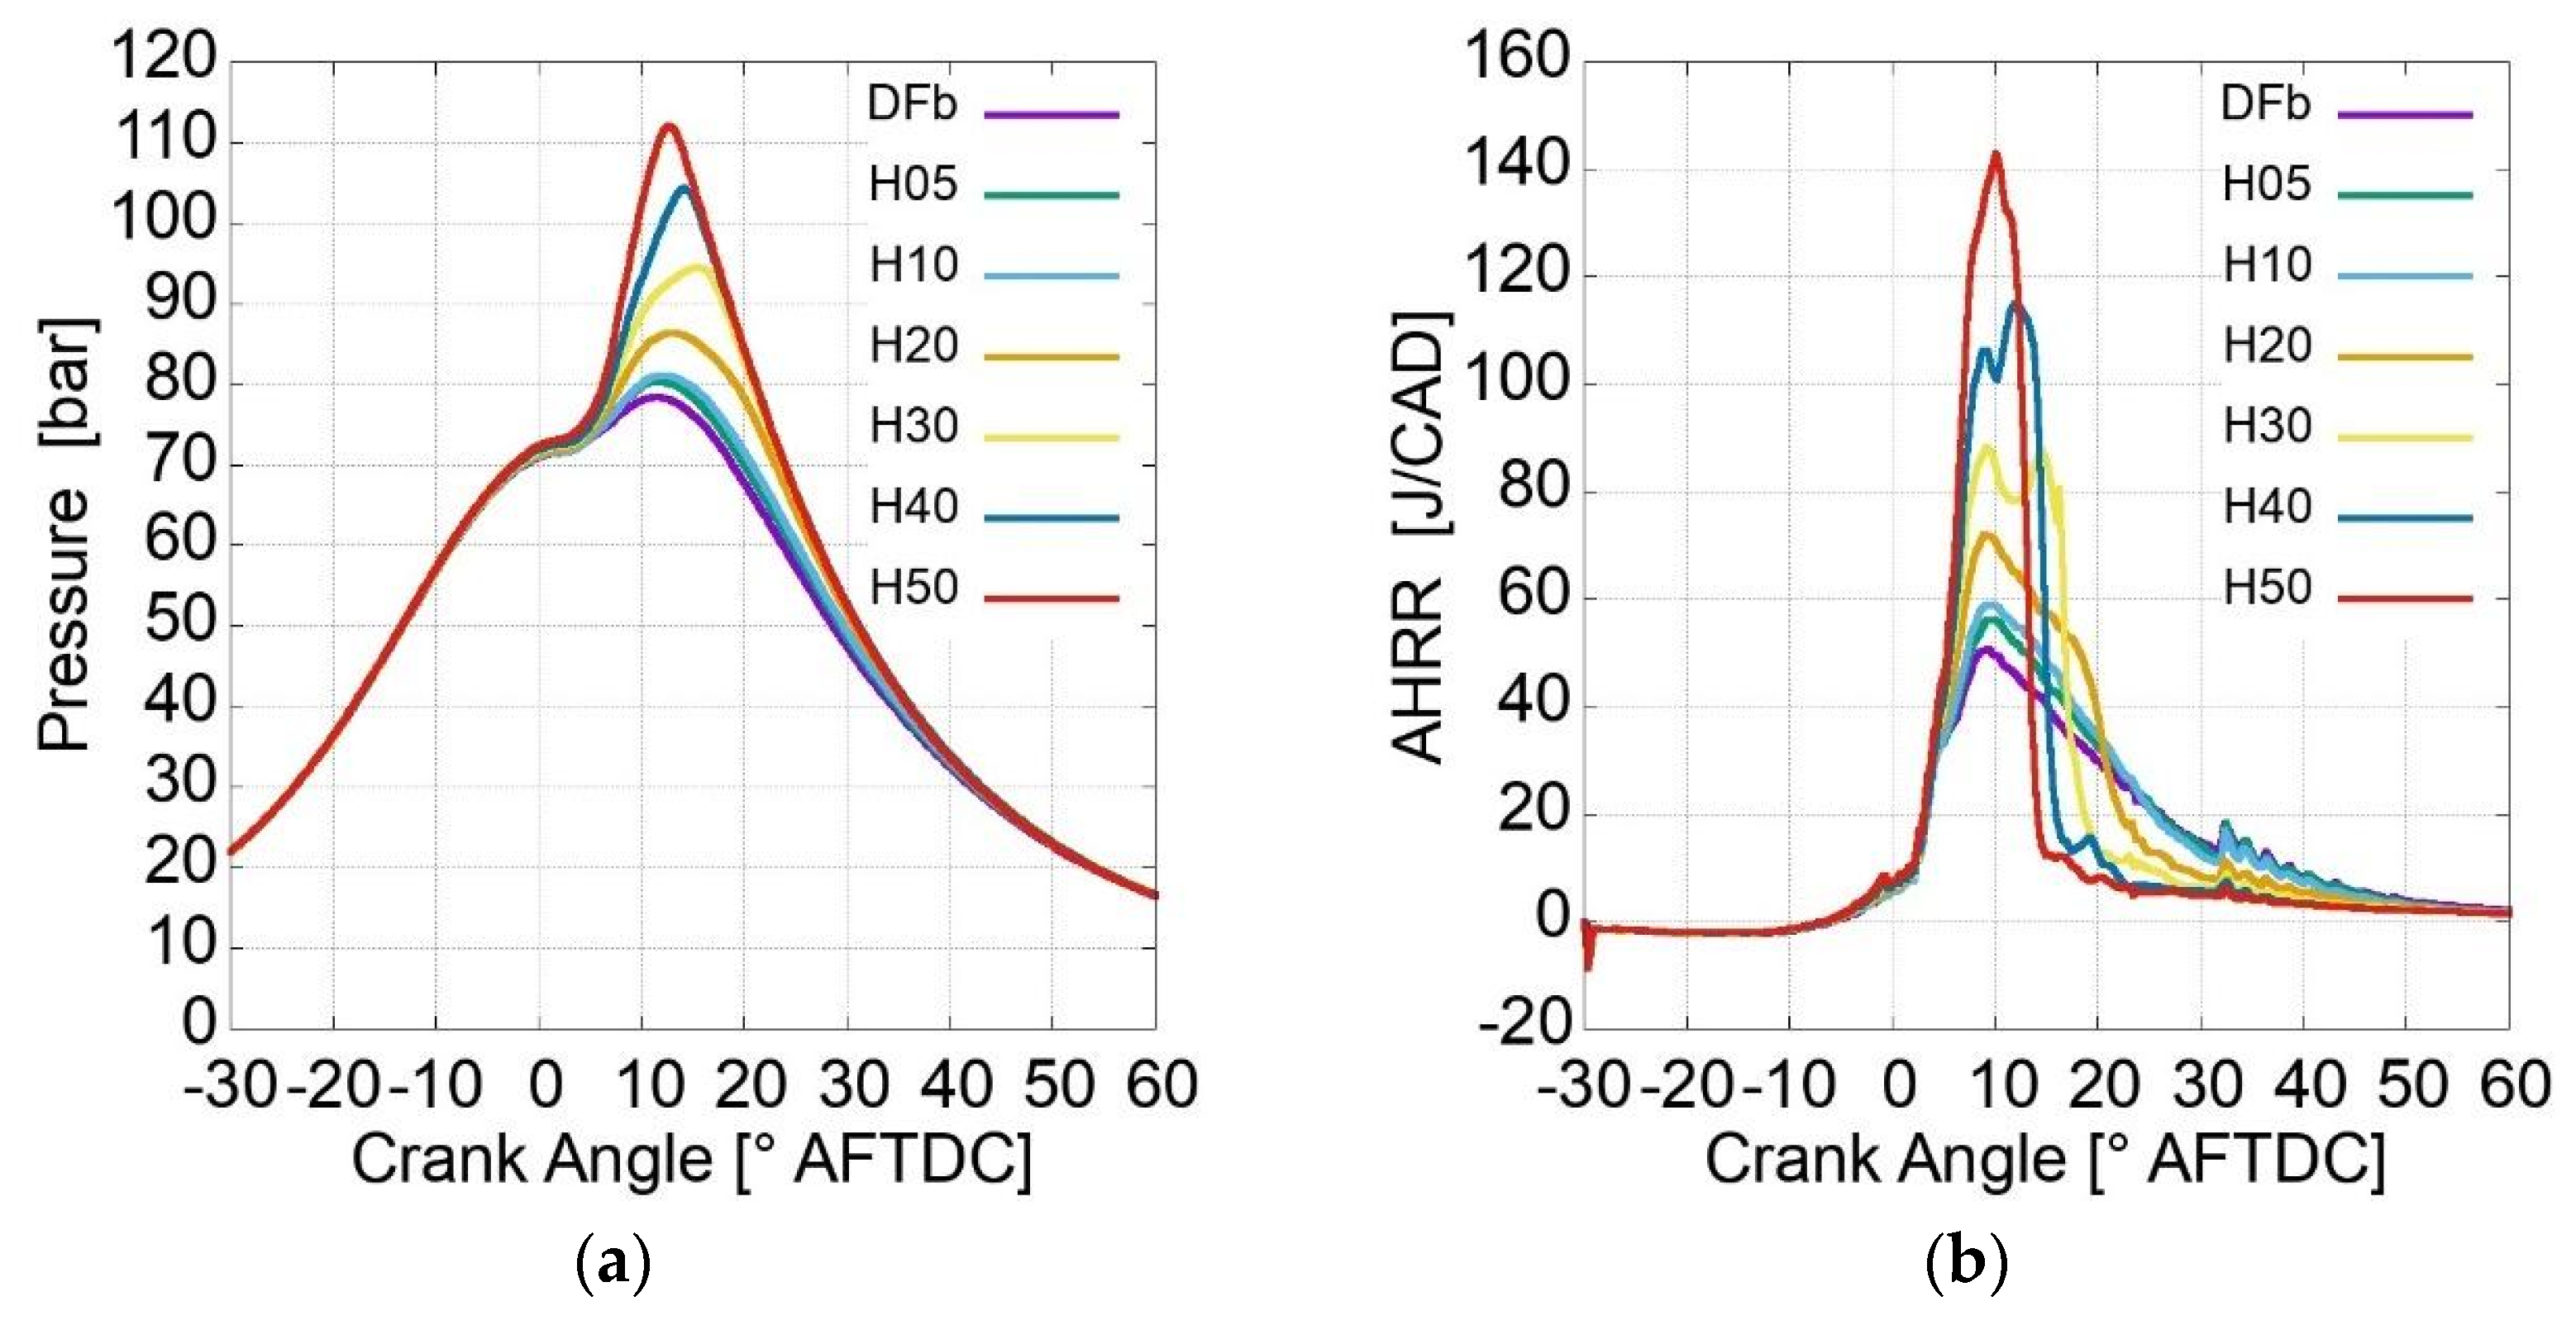
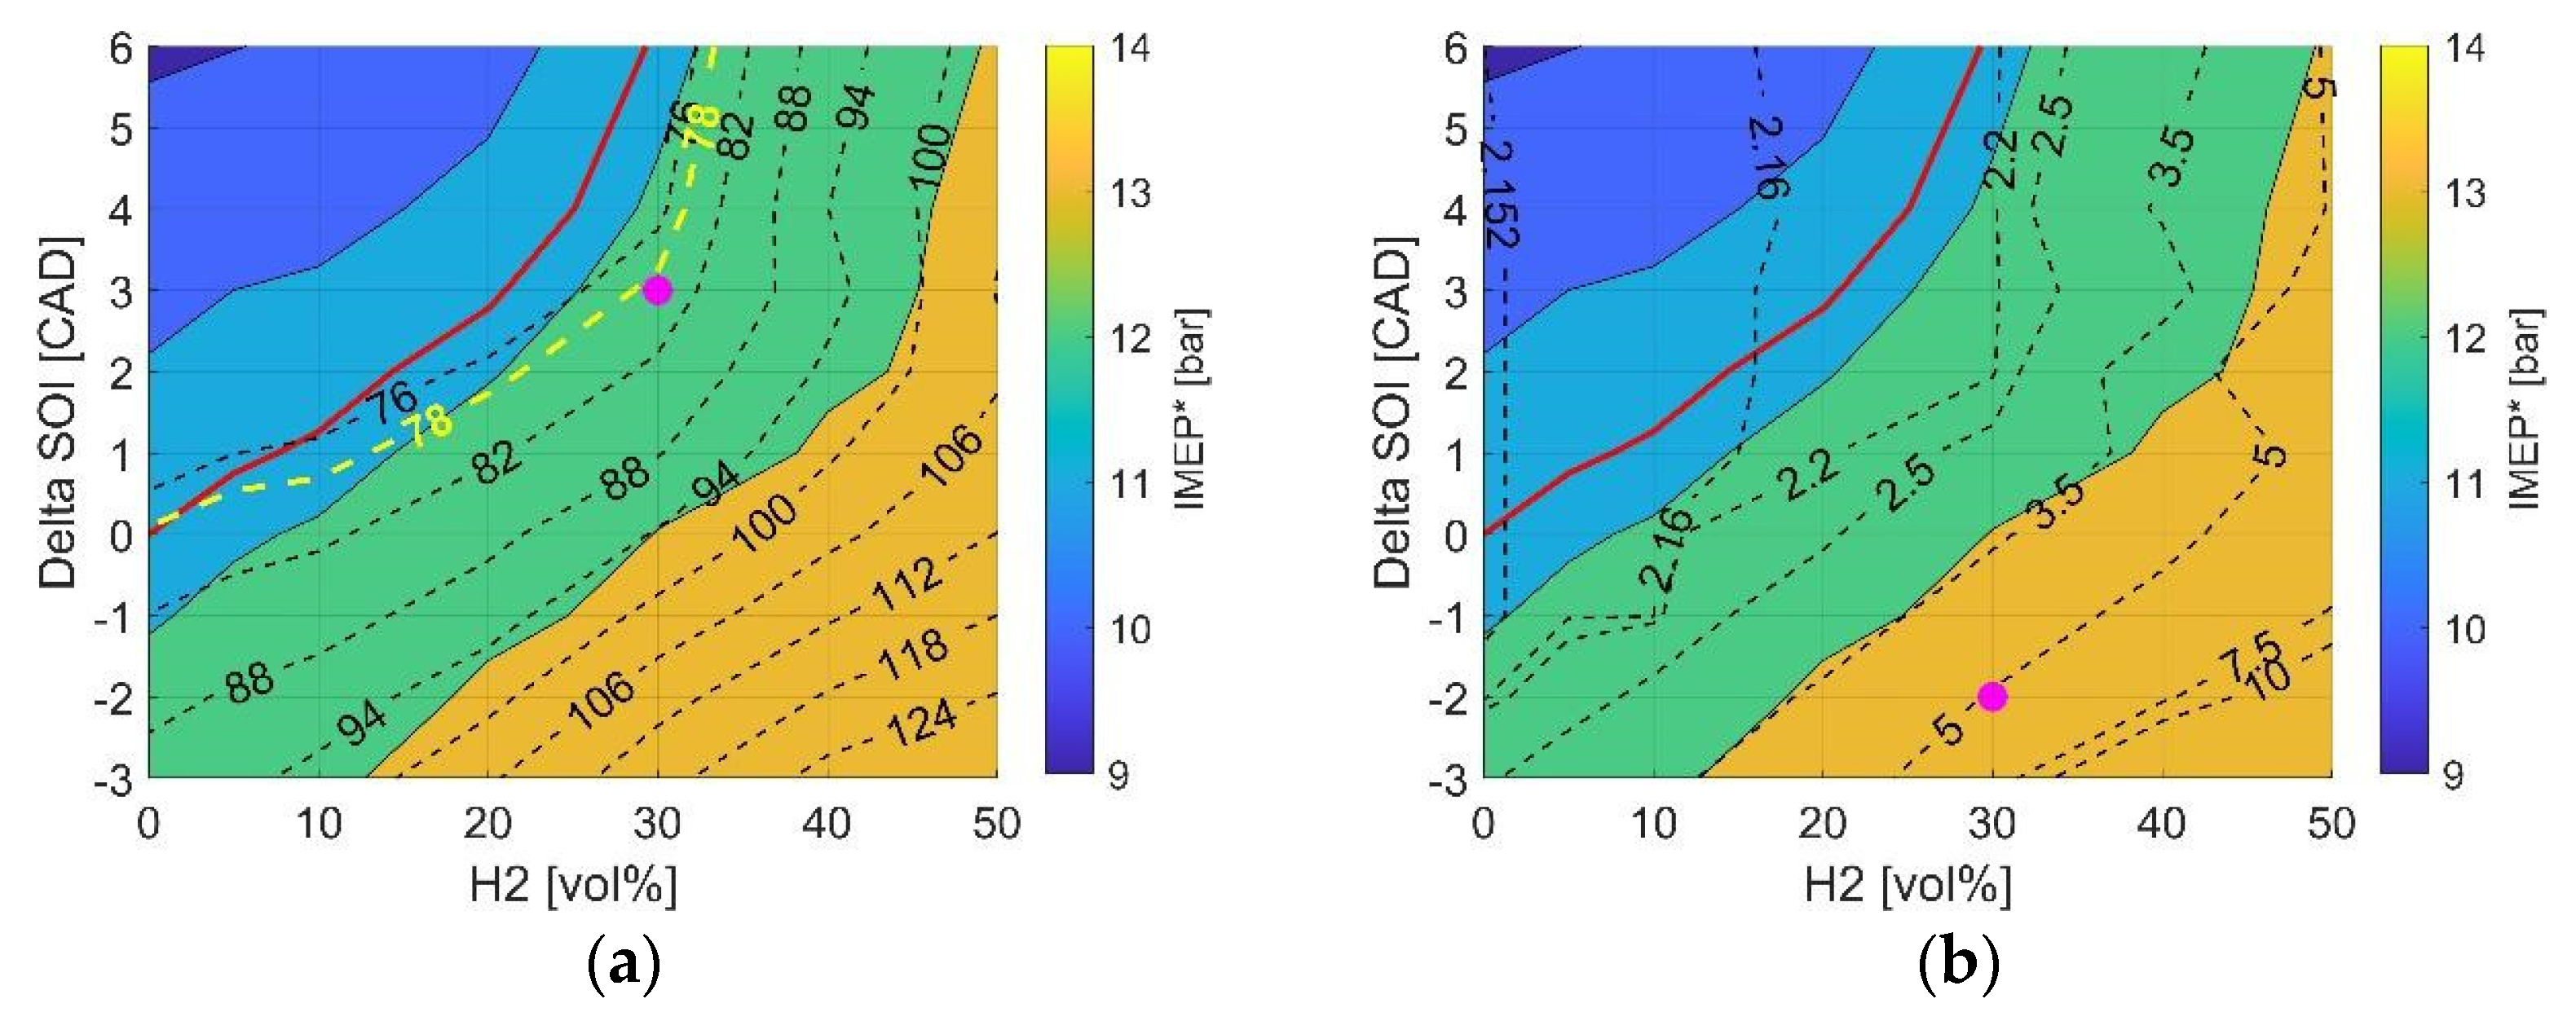
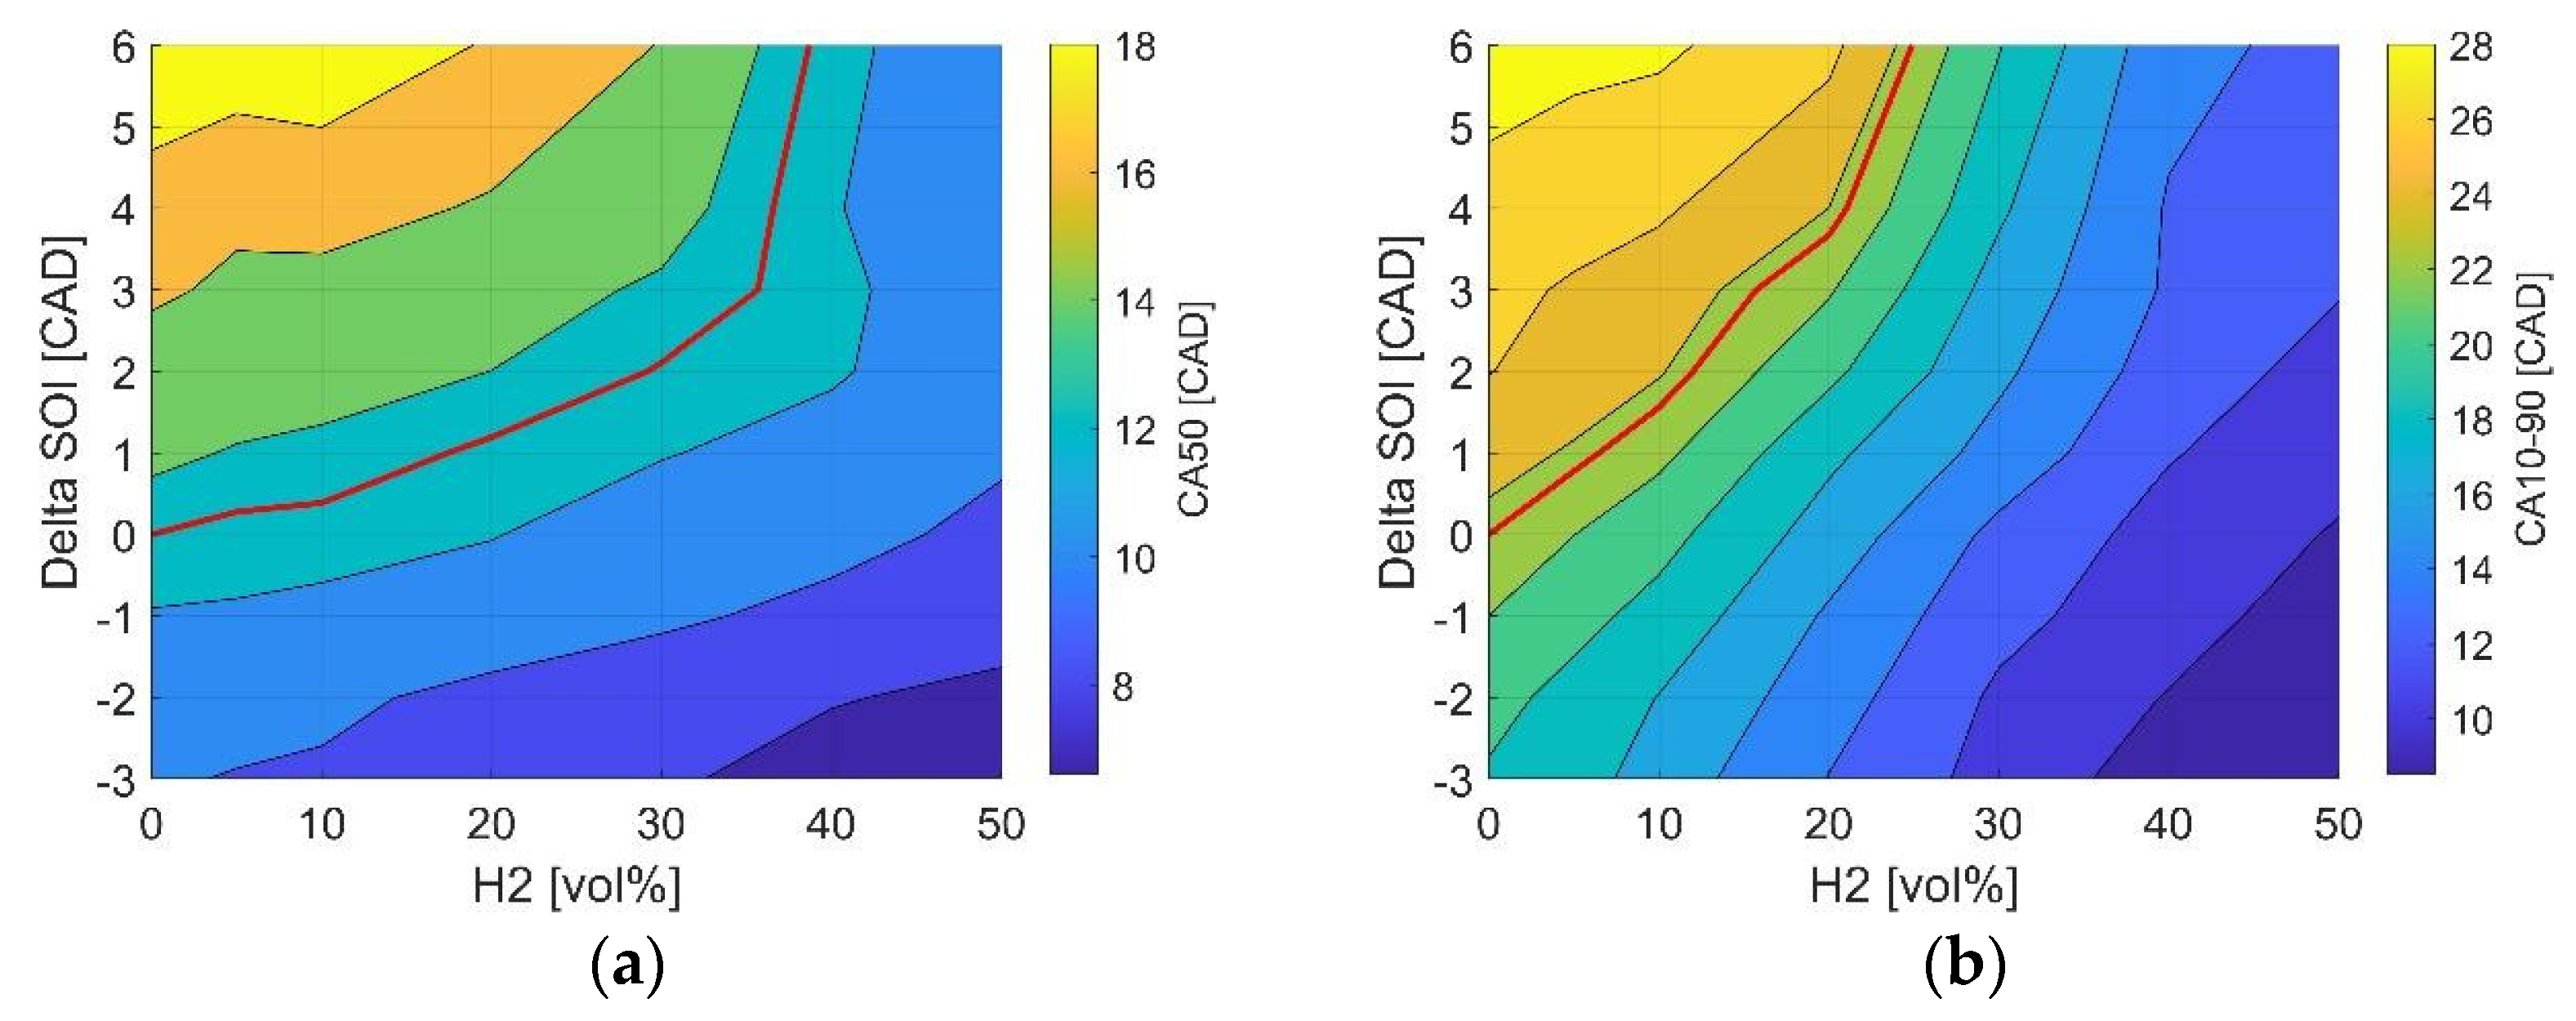
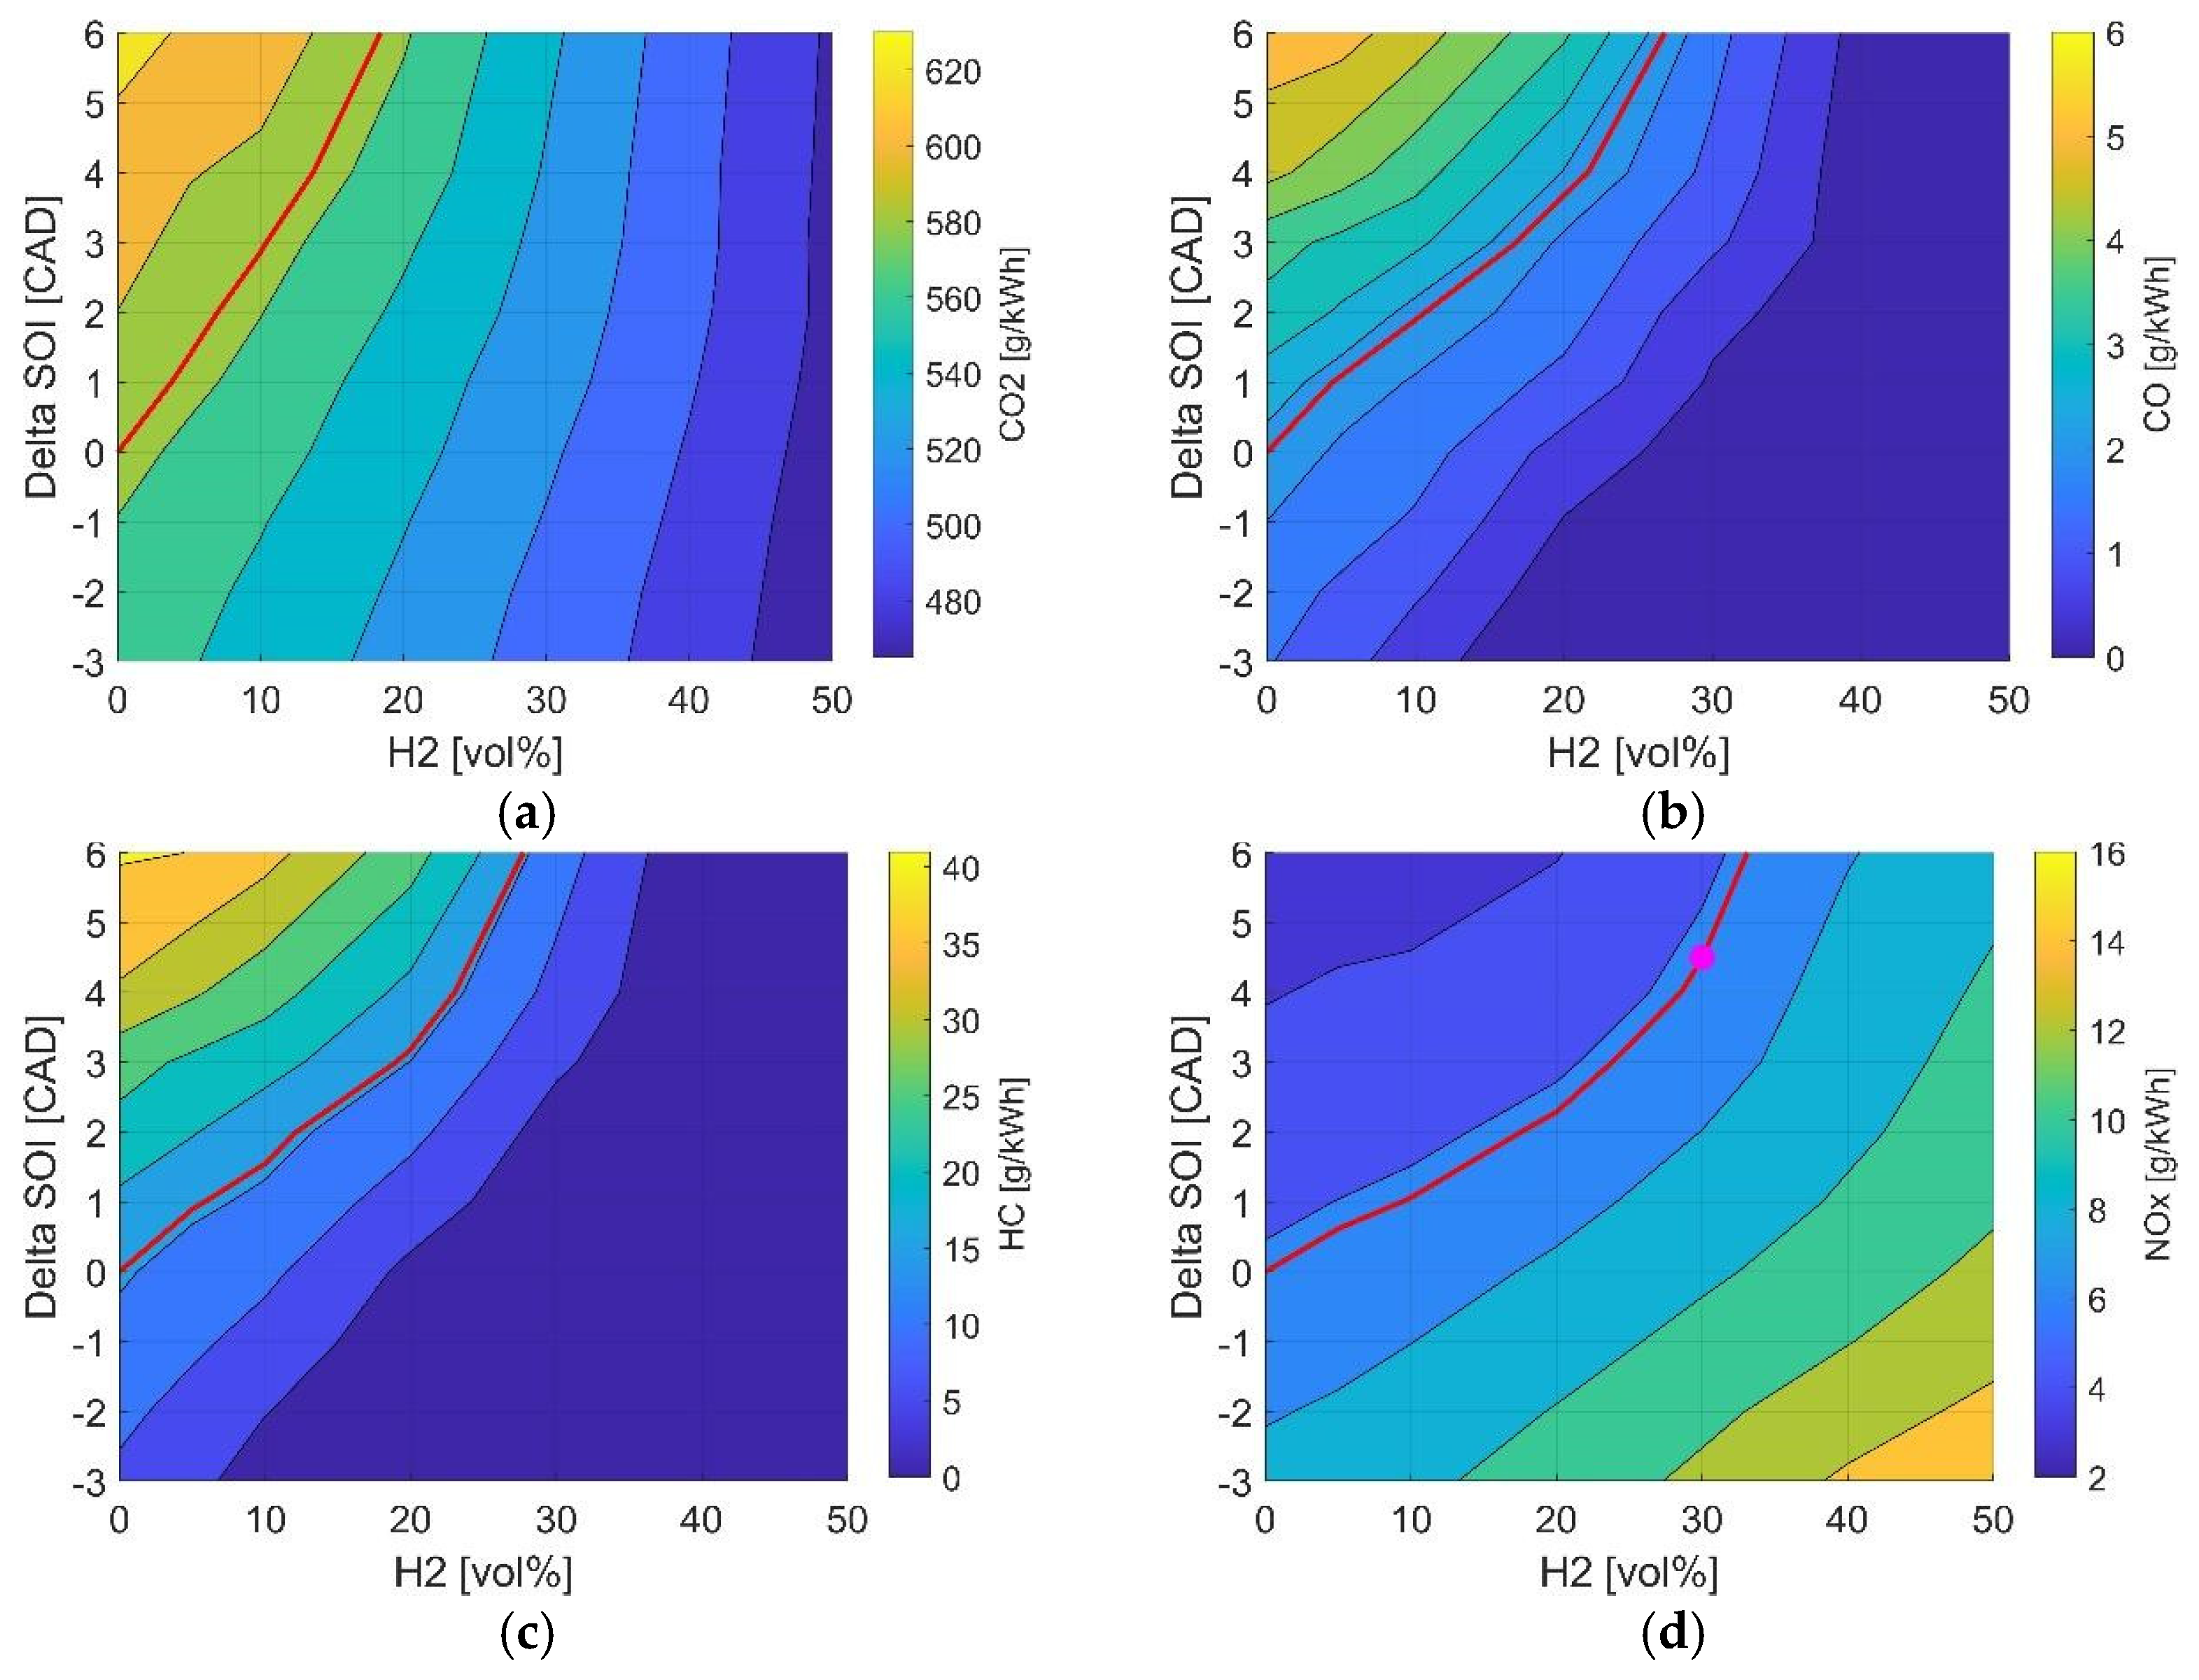
3.1. Influence of Hydrogen Content and Start of Injection

In this section, the results of the combustion simulations with different H2 volumetric fractions are presented and discussed.
Figure 4a,b shows the in-cylinder pressure and the AHRR as a function of the volume fraction of H2 in the H2–NG blend, ranging from 0% (baseline Dual Fuel (DFb) case) to 50%. As the amount of H2 increases, the peak in-cylinder pressure always increases: the increment is about 12 bar (+20.5%) for the case with 30 vol% of H2 (H30) and about 34 bar (+43%) for the case with 50 vol% of H2 (H50). The increment of Peak Pressure Rise Rate (PPRR) illustrates another direct effect of the H2 concentration growth: while PPRR for the DFb case is about 2.15 bar/CAD, this parameter rises at 3.40 bar/CAD for H30 and at 6.30 bar/CAD for H50 cas. Figure 4 also highlights the tight correlation between the peaks of AHRR and PPRR. As expected, the addition of H2 accelerates the combustion process, shrinking its duration, without varying the Start Of Combustion (SOC) angle.
In order to limit the effects of H2 enrichment on peak in-cylinder pressure and PPRR, a sweep of the diesel Start Of Injection (SOI) angle was investigated. In detail, keeping the DFb case as a reference, the diesel injection law was advanced up to 3 CAD and delayed up to 6 CAD, by steps of 1 CAD. For each value of SOI, all H2–NG blends were simulated, for a total of 70 cases (10 SOI and 7 blends). The simulation results provided the basis for building the contour maps shown in Figure 5, Figure 6, Figure 7 and Figure 8.
The colors of Figure 5a,b represent the IMEP* values as a function of H2 vol% and of diesel SOI. The solid red line indicates the value of IMEP* corresponding to the DFb case.
The dashed lines of Figure 5a, superimposed on the IMEP* contour map, indicate the values of peak in-cylinder pressure, as a function of H2 vol% and of diesel SOI; the yellow dashed line corresponds to the value of peak cylinder pressure of the DFb case.
Observing Figure 5a, it is possible to notice that IMEP* rises as H2 concentration and ignition advance increase. Keeping the same SOI of the DFb case, IMEP* raises from 11.7 bar to 13.0 bar (+11.3%) when passing from H0 to H30. A further increase of H2 vol% to H50 causes IMEP* to reach up to 13.2 bar (+12.7%). On the other hand, the peak in-cylinder pressure and PPRR also increase, as previously discussed. A good trade-off is possible: moving along the red solid line (same IMEP* of DFb), H2 can be increased up to 30% maintaining a slight benefit in terms of peak in-cylinder pressure; in a similar way, moving along the yellow dashed line (same peak cylinder pressure of DFb), H2 can be increased up to 30% along with a slight increase of IMEP*.
Based on the previous considerations, the region between the red solid line and the yellow dashed line is identified as a “sweet spot”, where the engine operates at higher efficiency and at lower mechanical stress, in comparison to the DFb case.
Analyzing Figure 5b, with the PPRR curves (black dashed lines) plotted on the contour map, the curve corresponding to the DFb case is not shown as its value (2.15 bar/CAD) lies outside the domain of the graph. However, assuming a PPRR limit of 5 bar/CAD, most of the combinations H2 vol%–Delta SOI remain acceptable. It can be noticed that, accepting a peak cylinder pressure up to 110 bar, the limit of 5 bar/° can be reached with H30, at a much higher IMEP* (thus thermal efficiency) than DFb.
Observing Figure 6a,b, where the trends of the combustion parameters CA50 and CA10-90 are plotted as a function of H2 vol%–Delta SOI, it is noted that combustion accelerates as the H2 mole fraction rises: at the SOI angle corresponding to DFb, both parameters decrease as H2 concentration increases. CA50 also strongly depends on diesel SOI: the earlier the start of combustion, primed by diesel injection, the smaller the CA50. Moreover, CA10-90 decreases as the SOI advances, since the higher combustion temperature favors the flame propagation (see Figure 6b).
Figure 7a,b displays BTE and combustion efficiency ( η comb ), as a function of H2 vol% and Delta-SOI. The presence of H2 improves BTE. This is due to the combination of a faster combustion, associated with a higher efficiency of the thermodynamic cycle, and to a more complete combustion (higher η comb ). The last aspect is clearly visible in Figure 7b.
Figure 8a–d shows the specific gaseous emissions, calculated as the ratio between the emissions mass flow rate and the engine brake power ( P ). P is evaluated as follows:
P = IMEP *   V d n 2 η i *
where V d is the total displacement in, n is the engine speed and η i * is a correction parameter, calculated according to the following formula:
η i * = BMEP exp IMEP exp * = 68.4 %
η i * depends on the friction and pumping losses of the engine; it can be considered independent of the cases, for the reasons listed below:
  • friction losses mainly depend on engine speed, that does not change, and on in-cylinder peak pressures, that are quite similar;
  • pumping losses are related to the mass flow rate delivered by the engine, that is kept almost constant throughout the cases.
CO2 specific emissions are expected to decrease as the H2 mole fraction increases. The reasons include BTE improvement and the reduction of the carbon content in the H2–NG blend. This outcome is clearly visible in Figure 8a.
The completeness of combustion helps to also reduce CO and UHC (see Figure 8b,c). The result is coherent with Figure 7b, where η comb improves by increasing the H2 content.
Unfortunately, Figure 8d shows that the combustion process accelerates, as the H2 mole fraction increases: as a result, larger NOx emissions are discovered, due to the higher in-cylinder peak temperatures.
Moreover, SOI plays a fundamental role in pollutant emissions: an early start favors the combustion completion, reducing CO and UHC emissions, while increasing NOx, due to the higher temperatures.

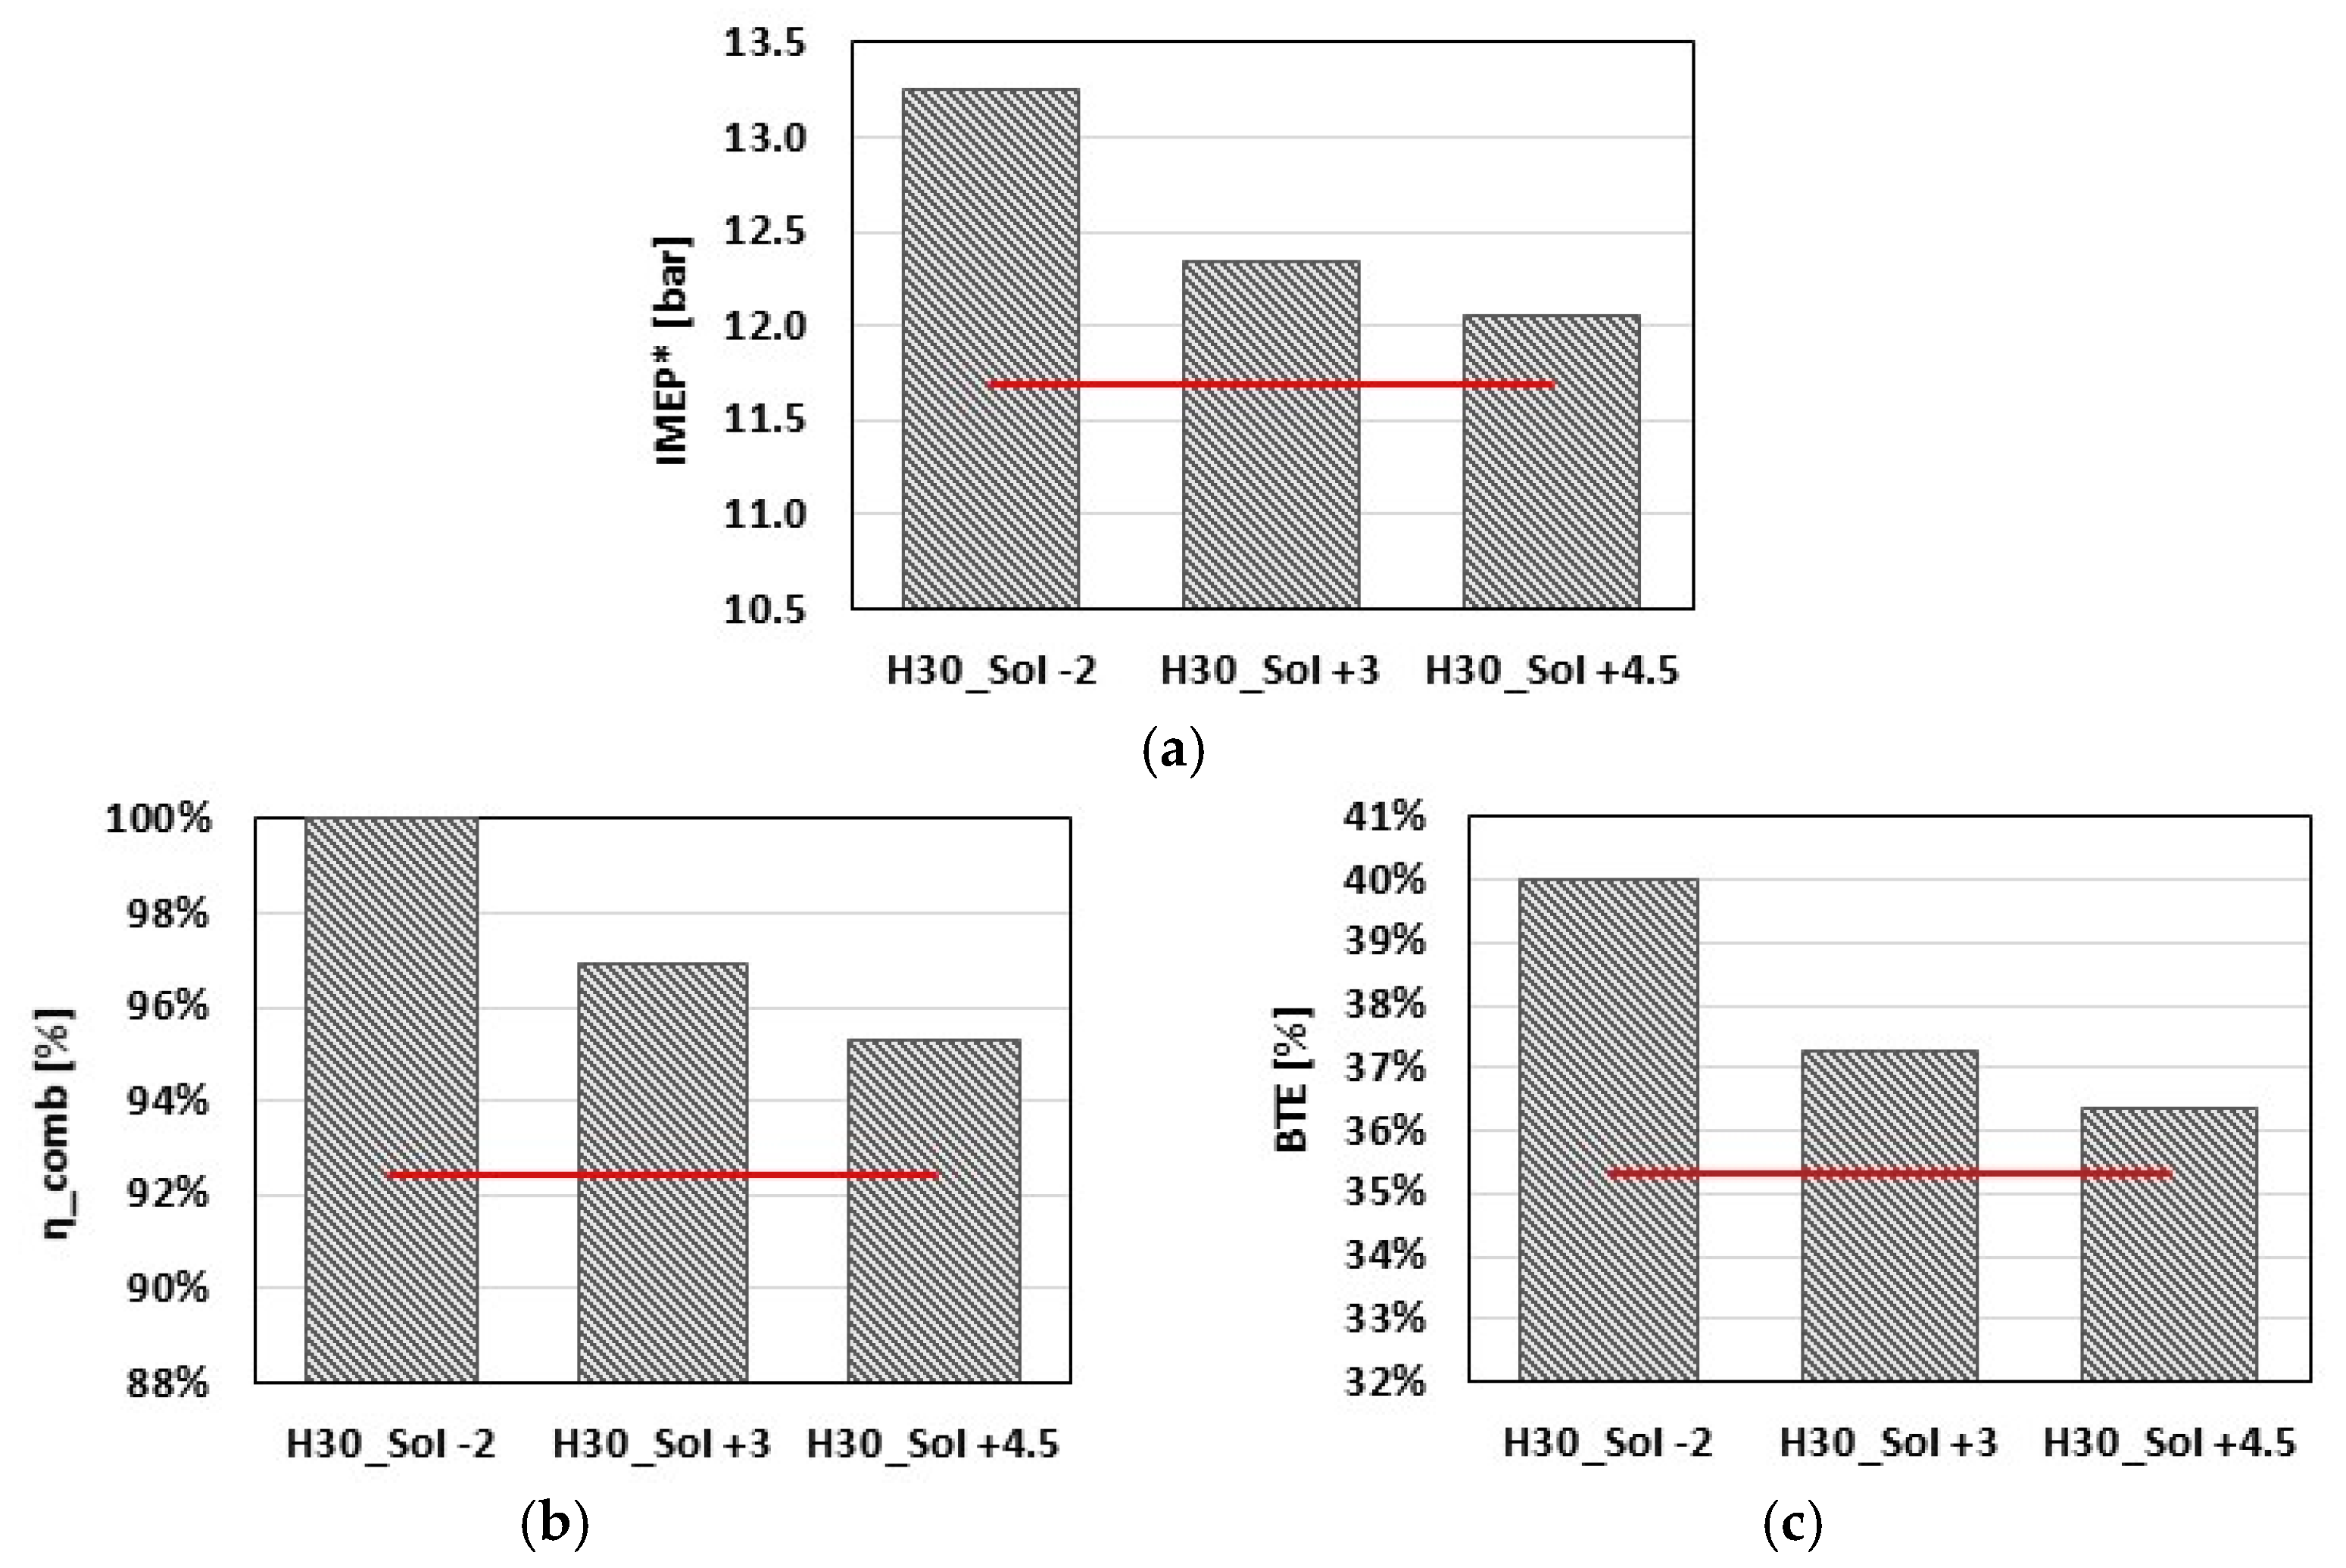
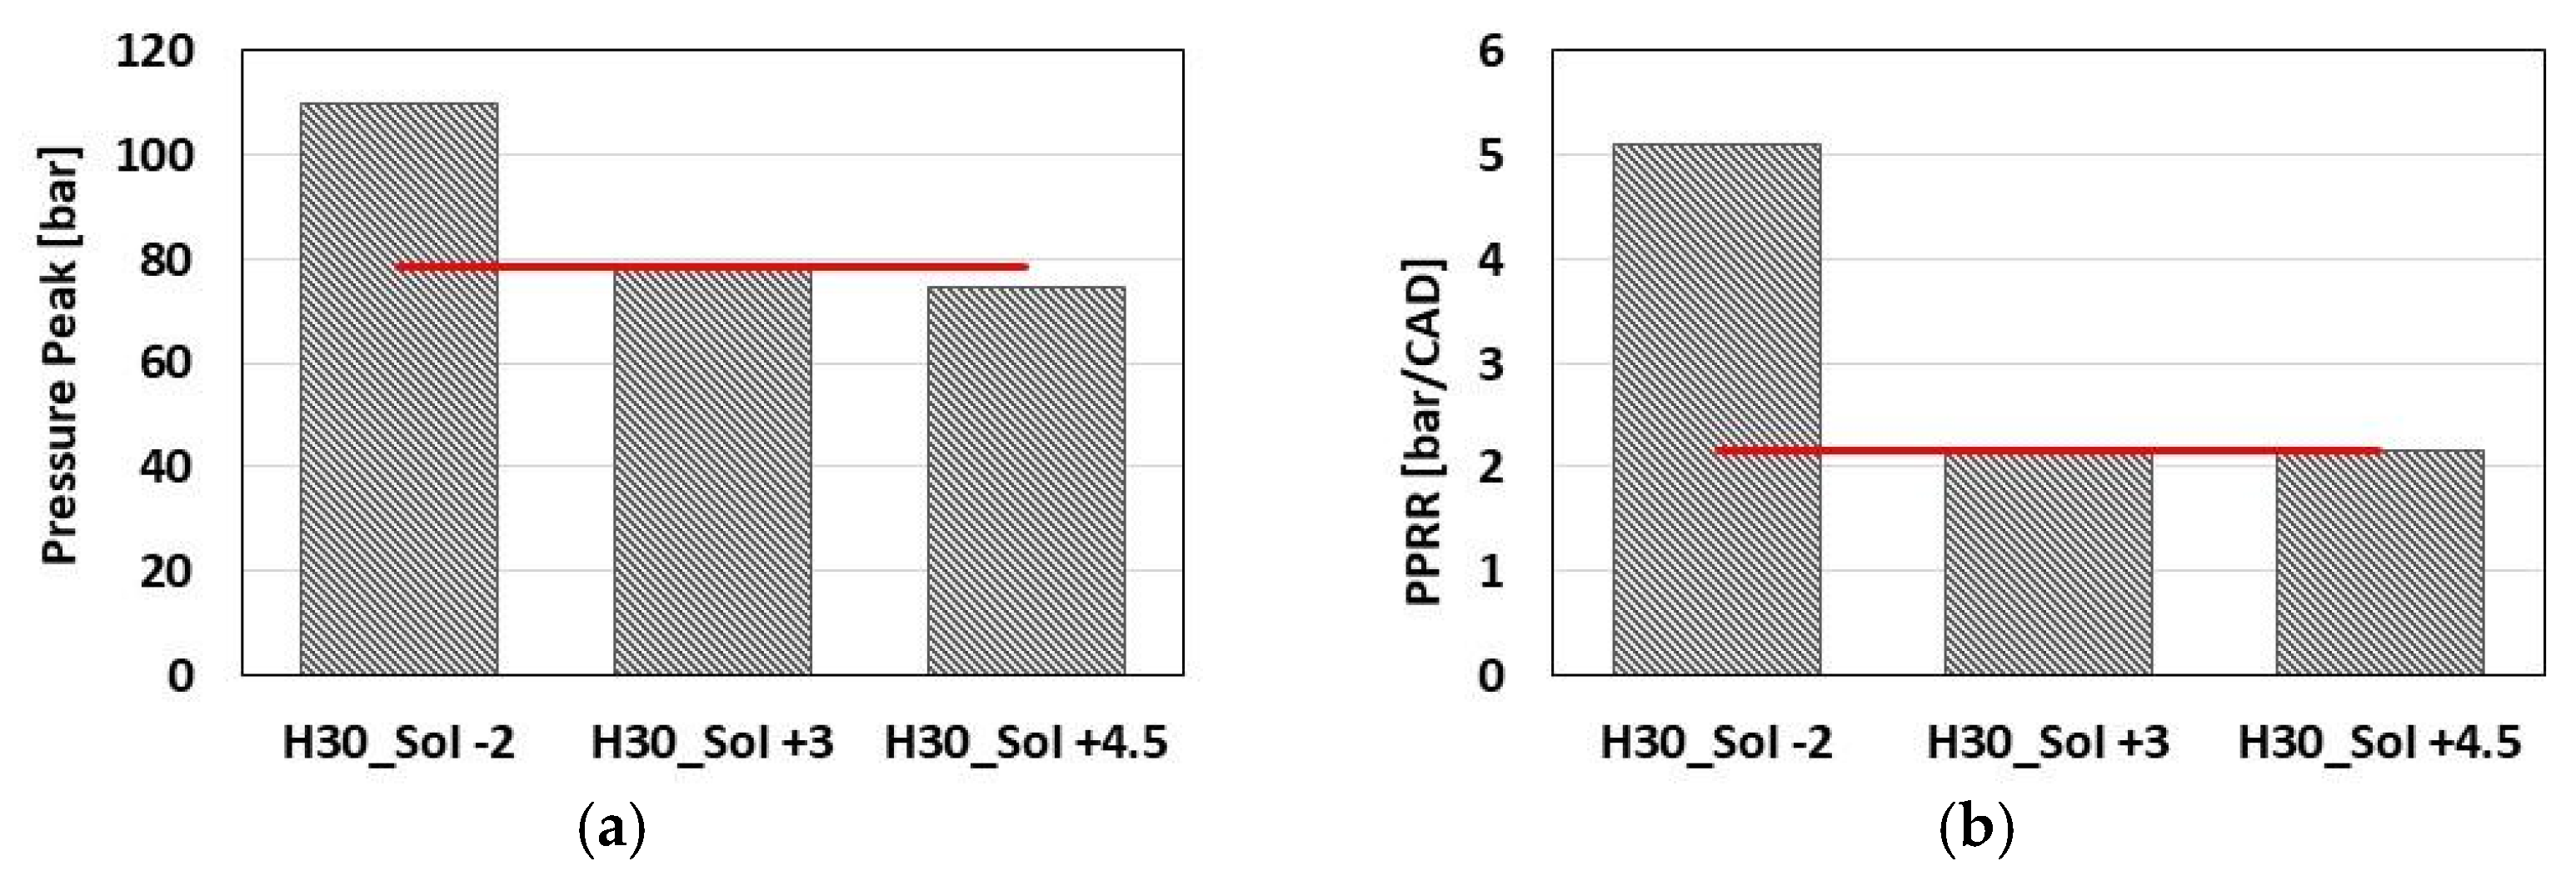
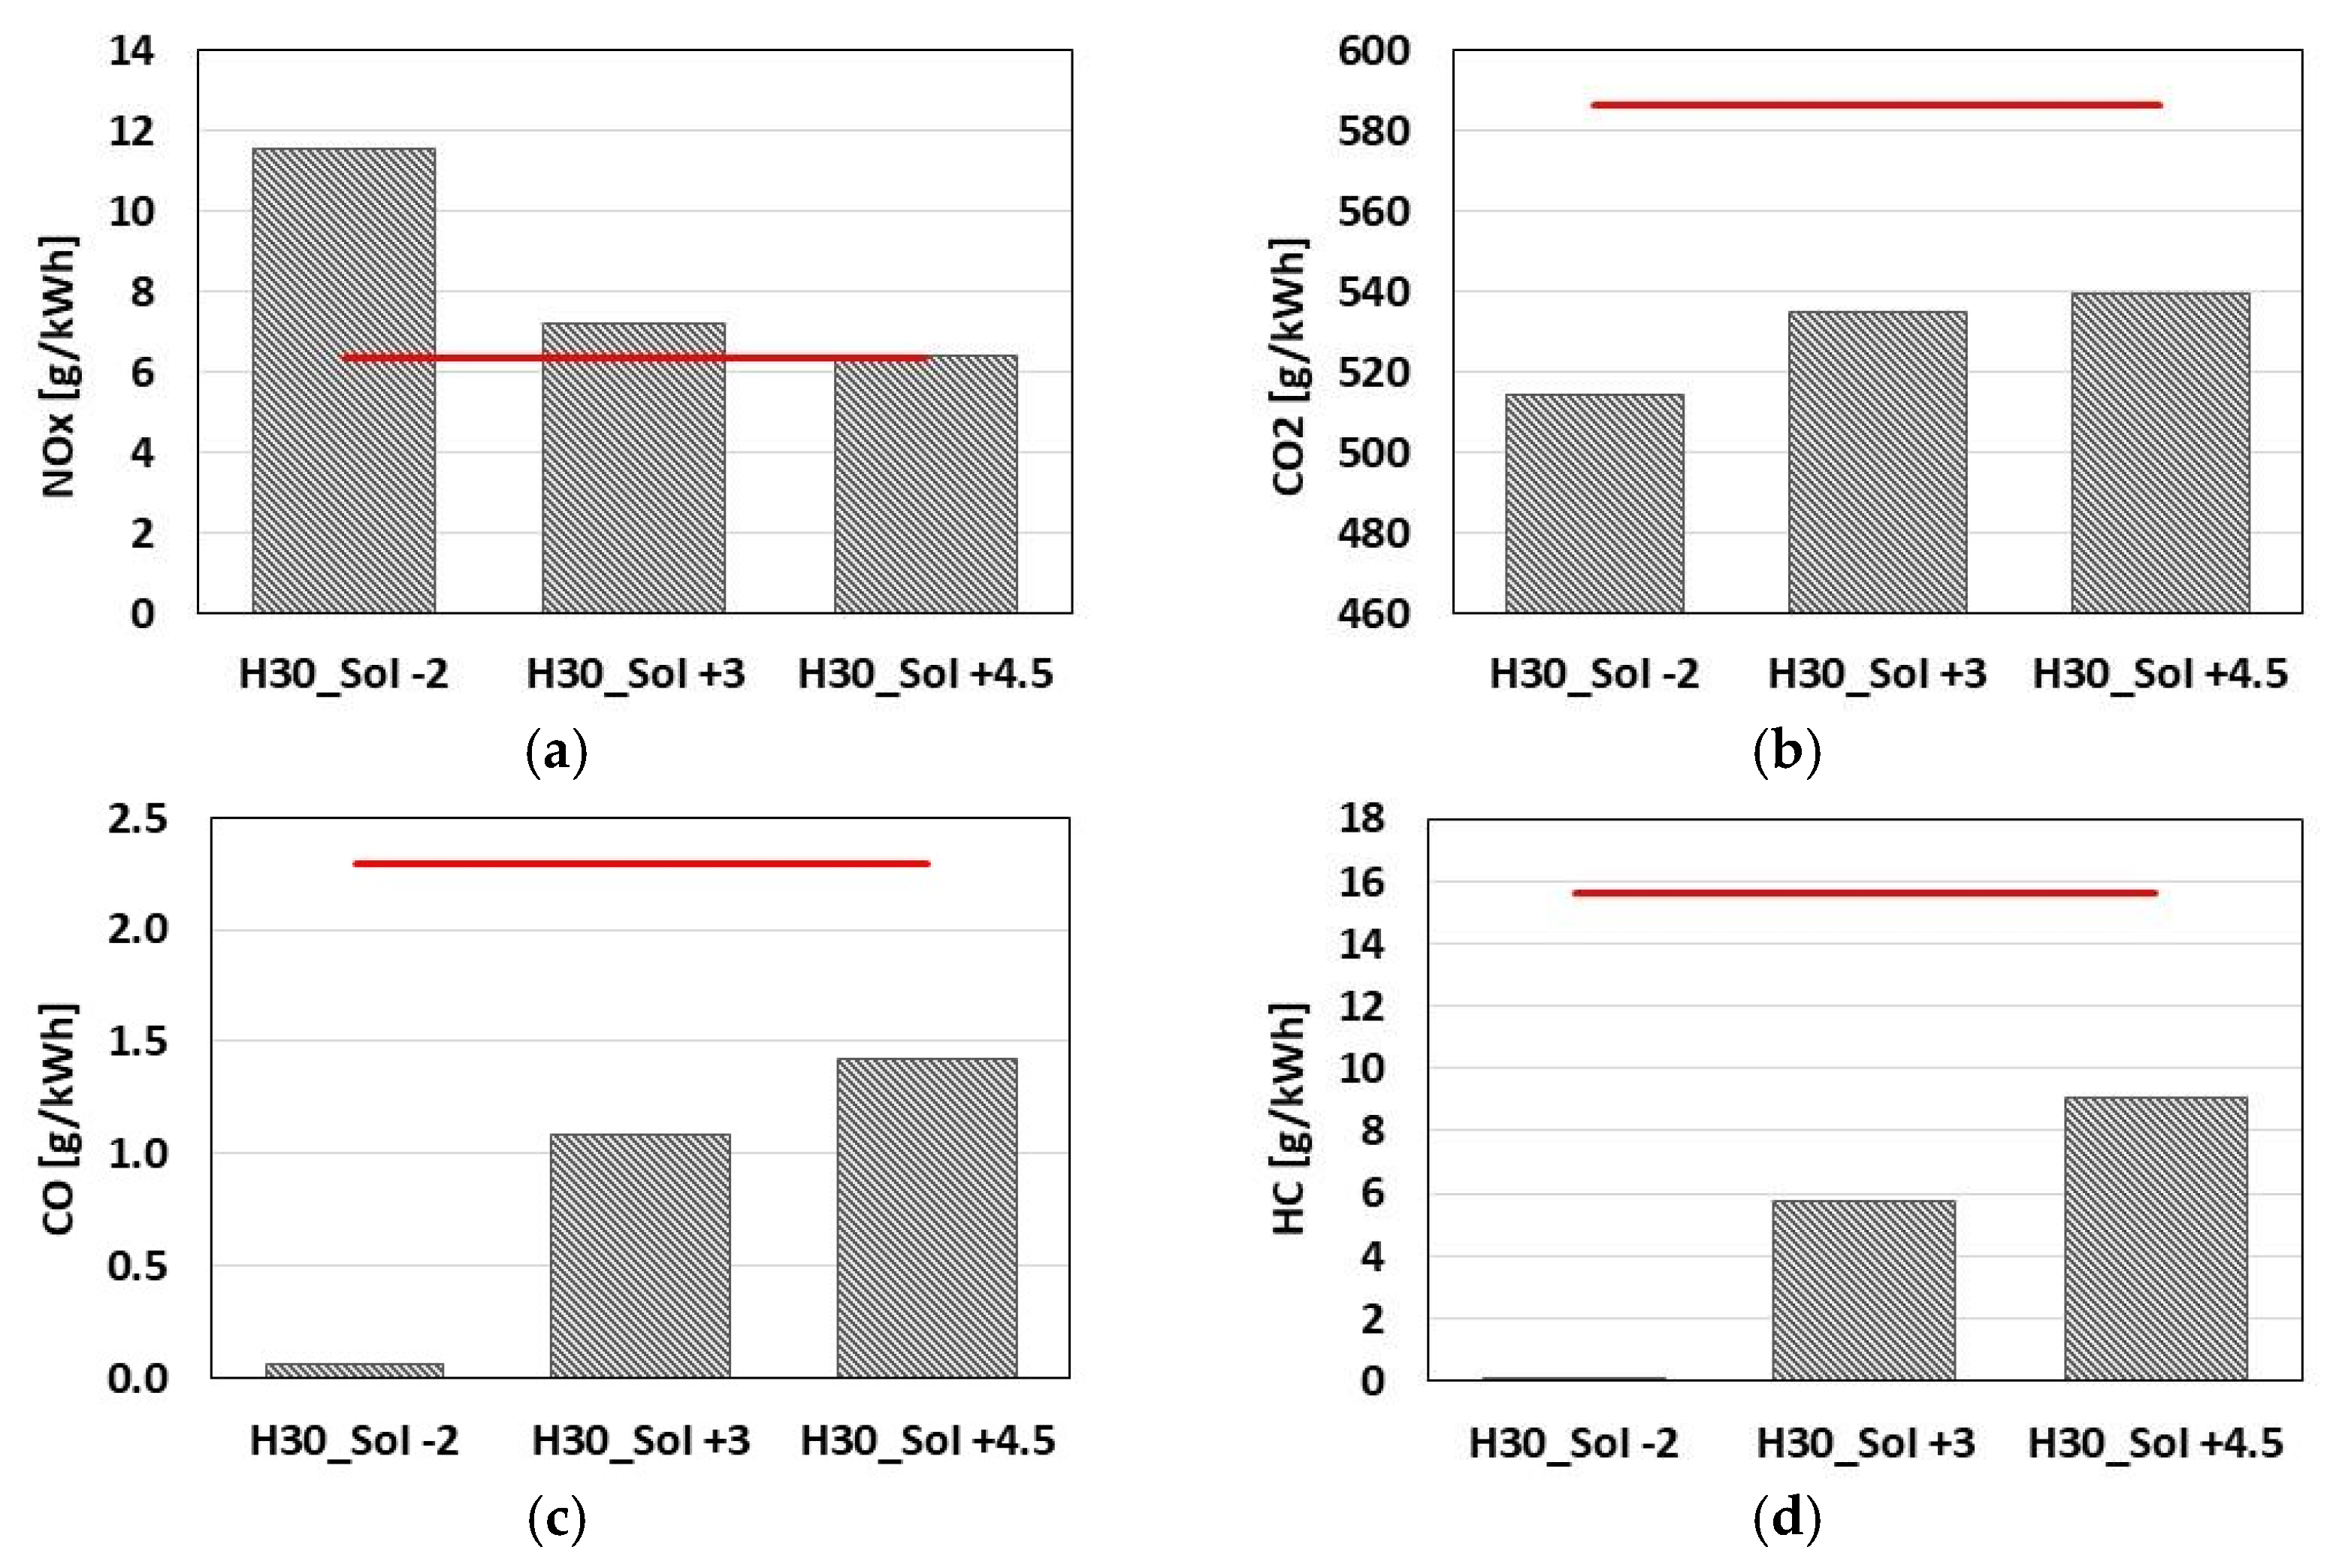
3.2. Engine Performace and Emissions of Selected Operating Points

The contour maps of Figure 5, Figure 6, Figure 7 and Figure 8 help to identify the most promising combinations of H2 mole fractions and diesel SOI. In particular, three operating conditions, all considering the maximum acceptable level of H2 in Hythane blends (30 vol%), were defined and compared to the DFb case.
The first operating condition was defined on the basis of Figure 5a: considering the “safety region” included between the red solid line and the yellow dashed line, a Delta_SOI of 3 CAD (delayed injection) is detected. This strategy permits the operation with a value of IMEP* higher than in the reference case, while complying with the limit of in-cylinder peak pressure of the reference case. As previously mentioned, since all combinations contain the same fuel energy as an input, an increase in terms of IMEP* describes an improvement of BTE. Such an operating point is referred to as “H30_SOI +3”.
The second operating point is defined with consideration that PPRR is strongly linked to engine noise and vibrations [33]. In this study, the upper limit for PPRR is 5 bar/CAD, according to the literature. Therefore, the second operating point is detected at the intersection between the PPRR = 5 bar/CAD curve and the coordinate of 30 vol% H2. This corresponds to a further diesel injection advancement of 2 CAD and is highlighted by a red point in Figure 5b. The above-mentioned operating condition was referred to as “H30_SOI −2”.
Finally, NOx emissions are considered: the third operating point, characterized by a 30 vol% H2 and Delta_SOI equal to 4.5 CAD (delayed injection), red point in Figure 8d, leads to the same NOx specific emissions of the DFb case. The last point is referred to as H30_SOI +4.5.
The three operating points are compared in Figure 9, Figure 10, Figure 11 and Figure 12. The DFb case is also reported and represented by a horizontal red line.
Figure 9a–c displays IMEP*, ηcomb and BTE, respectively. As it can be seen, all the selected DF H2–NG/diesel cases exhibit better performances with respect to the DFb case. Moreover, as the diesel injection advances, both ηcomb and BTE improve and, as a consequence, the work output increases. Therefore, “H30_SOI −2” leads to a higher increment of IMEP* (11.7%), ηcomb (8.1%) and BTE (13.3%).
As expected, CA50 approaches closer to TDC as diesel injection advances (see Figure 10a). Furthermore, the combustion duration expressed by CA10-90 (Figure 10b), is always shorter than that of the DFb case, and decreases as the diesel injection advance increases. Therefore, the maximum variation from the DFb case in terms of CA10-90 corresponds to “H30_SOI −2” case (about −47%).
While the “H30_SOI +3” and “H30_SOI +4.5” cases contain the same, or even lower, peak in-cylinder pressure and PPRR compared to the DFb case, “H30_SOI −2” shows higher in-cylinder peak pressure and PPRR (see Figure 11a,b). In detail, comparing the DFb case to the “H30_SOI −2” case, the in-cylinder peak pressure passes from 80 bar to about 110 bar, while PPRR increases by about 150% (from 2.2 bar/CAD to 5.1 bar/CAD).
Since the combustion process of the “H30_SOI −2” case is more advanced and faster, it is also characterized by higher NOx emissions with respect to the DFb case (+84%). Conversely, H30_SOI +3 and H30_SOI +4.5 show NOx emissions close to those of the DFb case.
Finally, all the selected DF H2–NG /diesel cases present lower CO, UHC and CO2 emissions, with respect to the DFb case. Due to the ηcomb and BTE trends, the maximum benefit is obtained advancing the diesel injection law of 2 CAD (H30_SOI −2). In this condition, CO and UHC tend toward zero (ηcomb is 100%), while CO2 emissions are reduced by about 12%, compared to the DFb case.

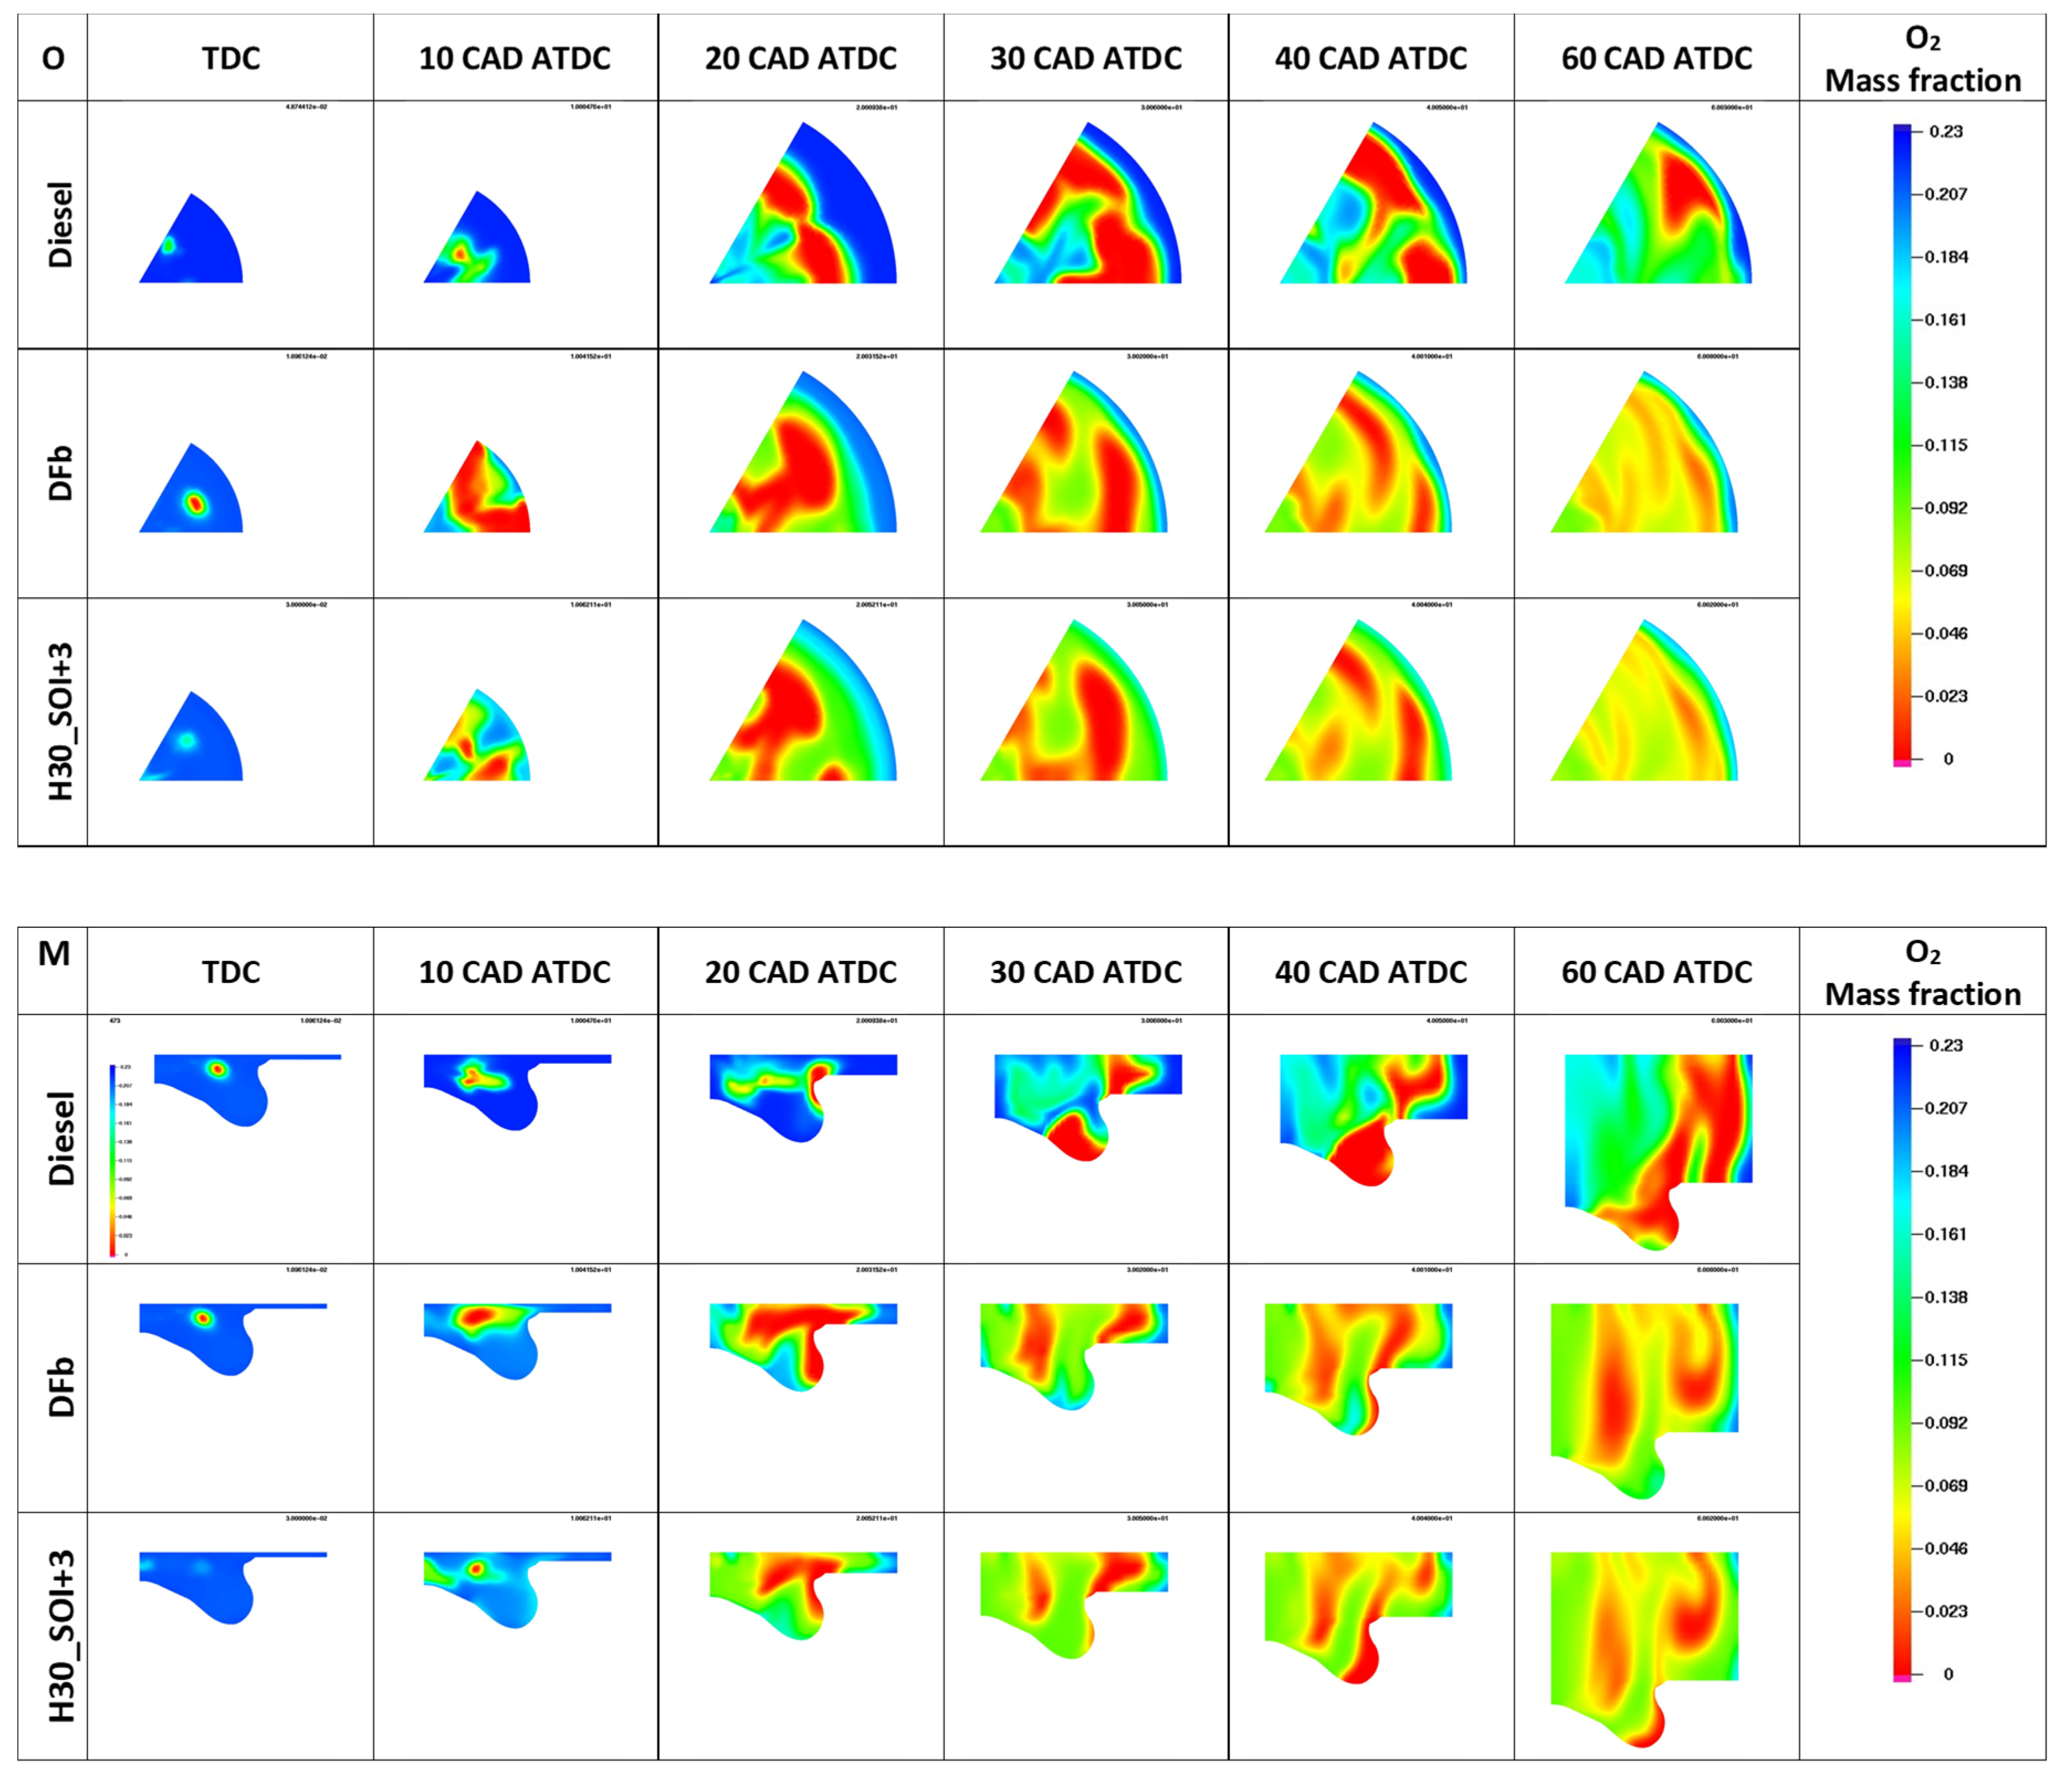
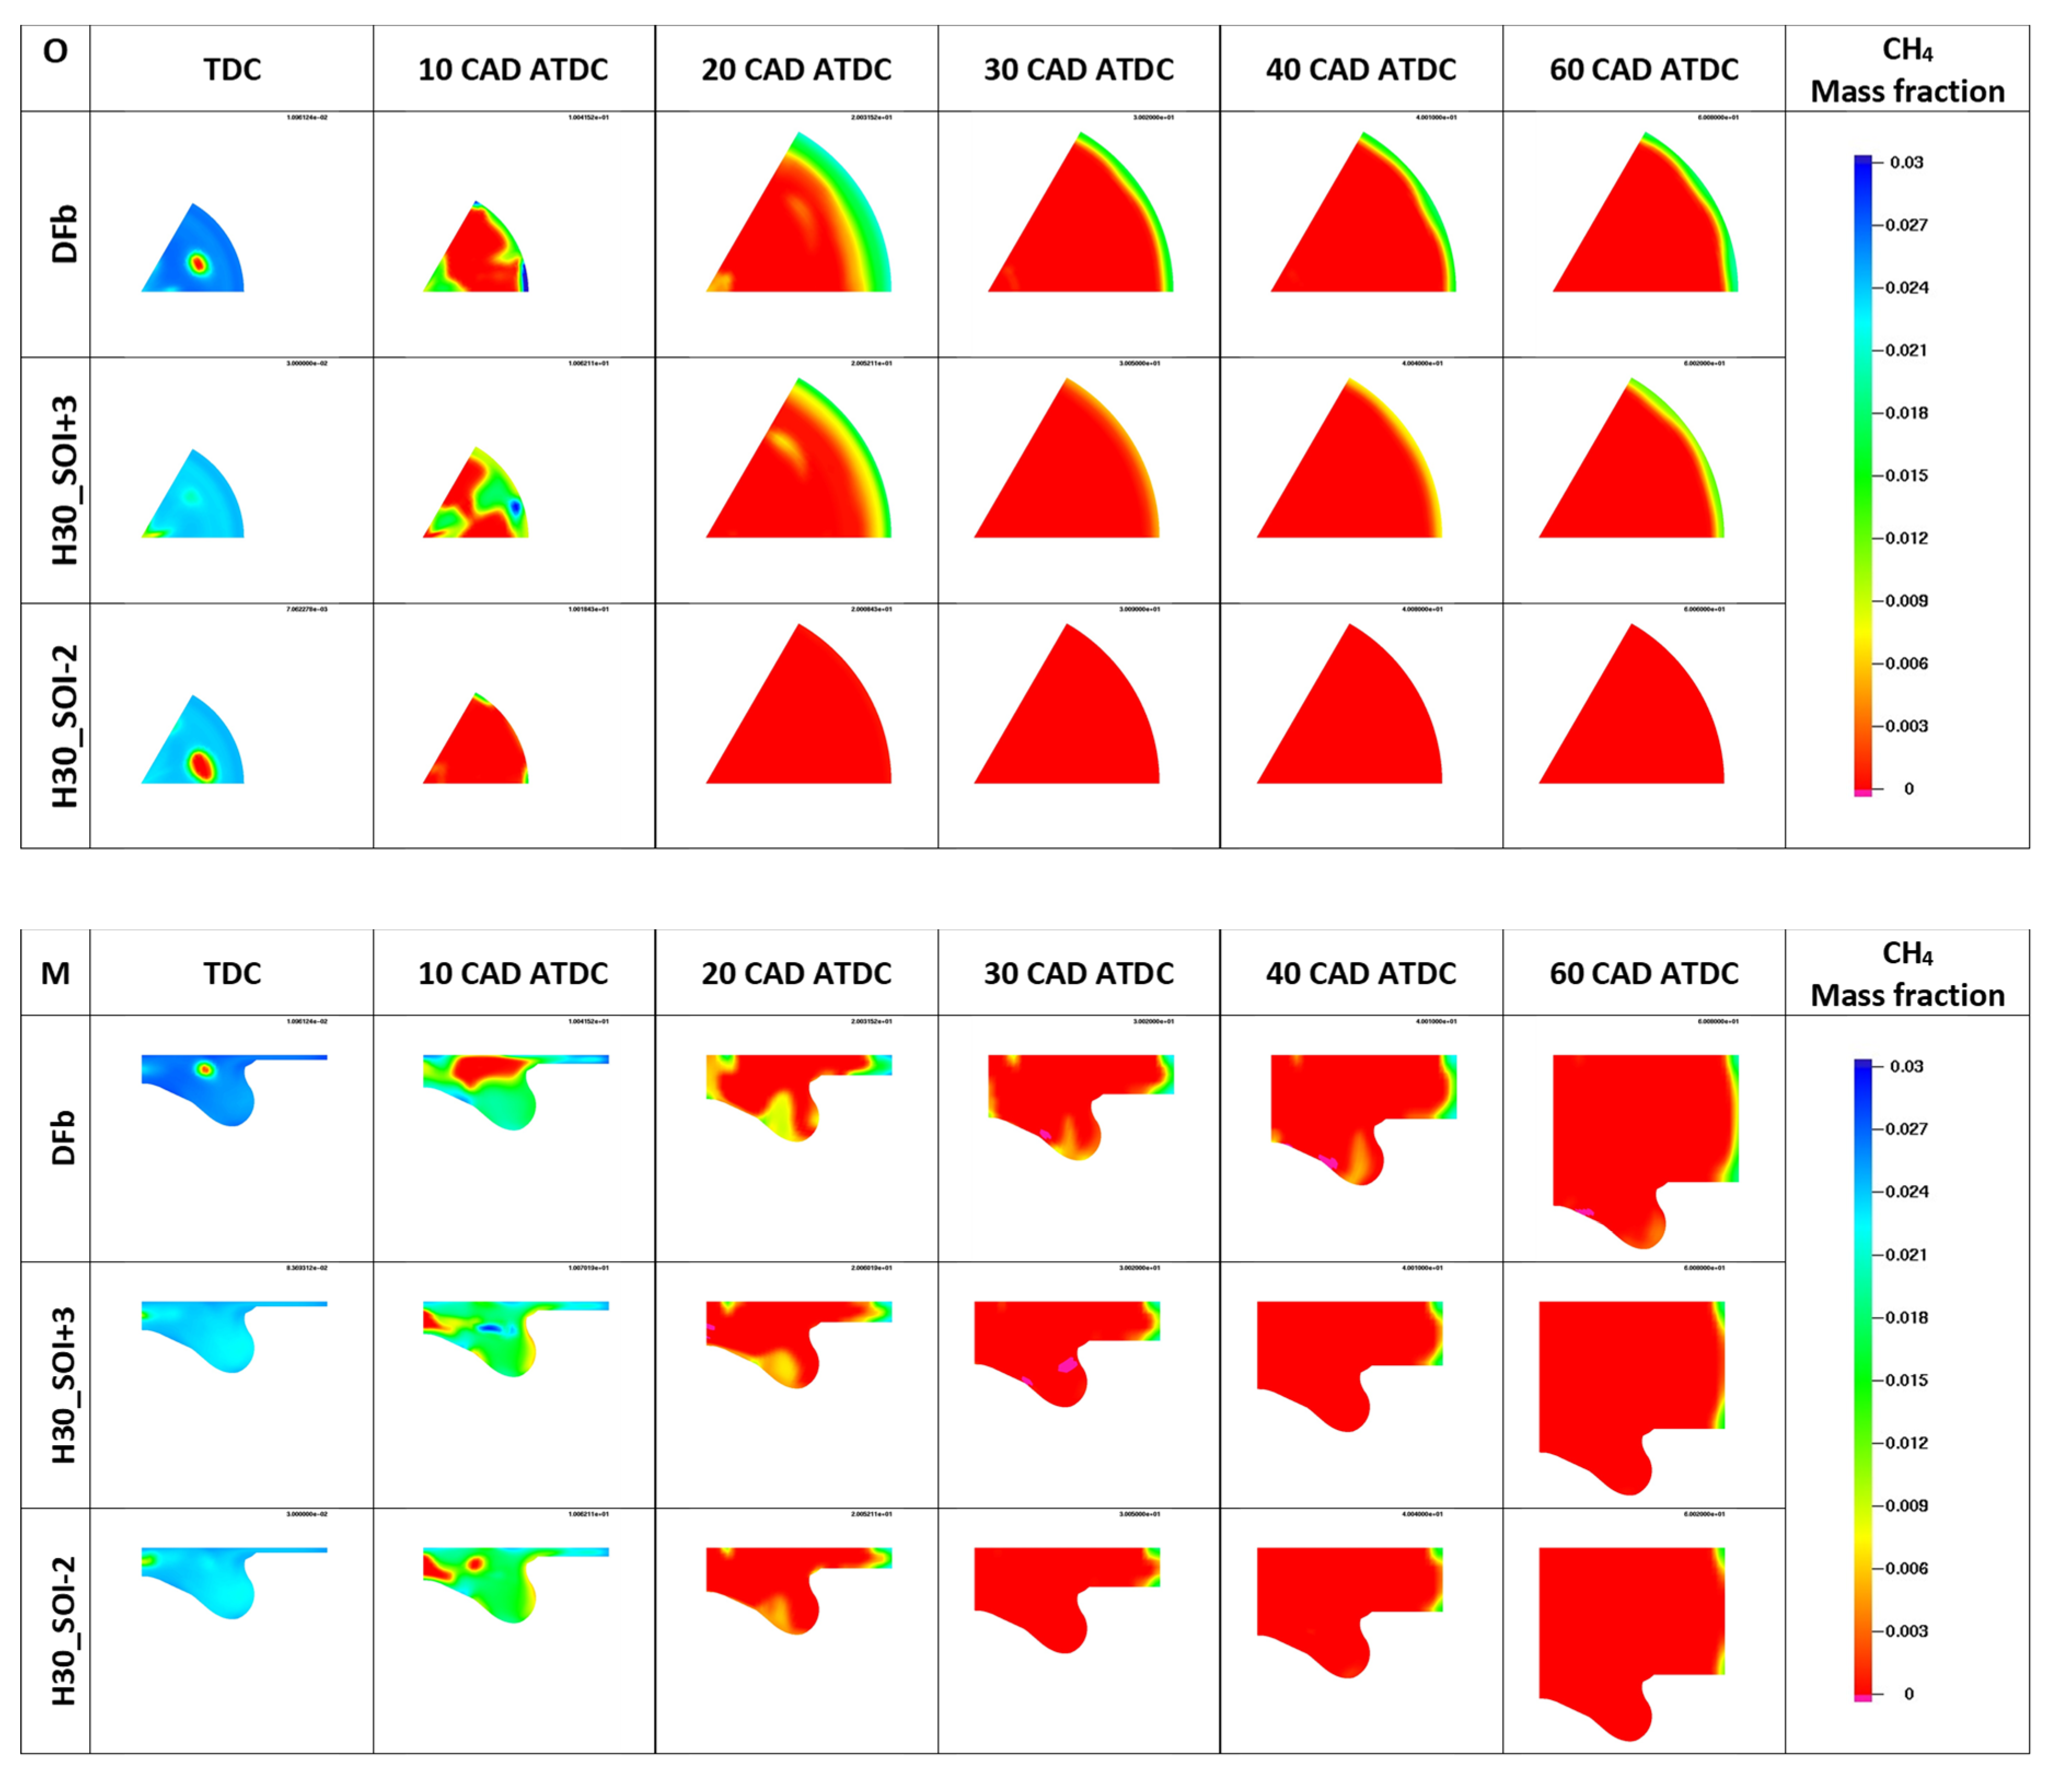
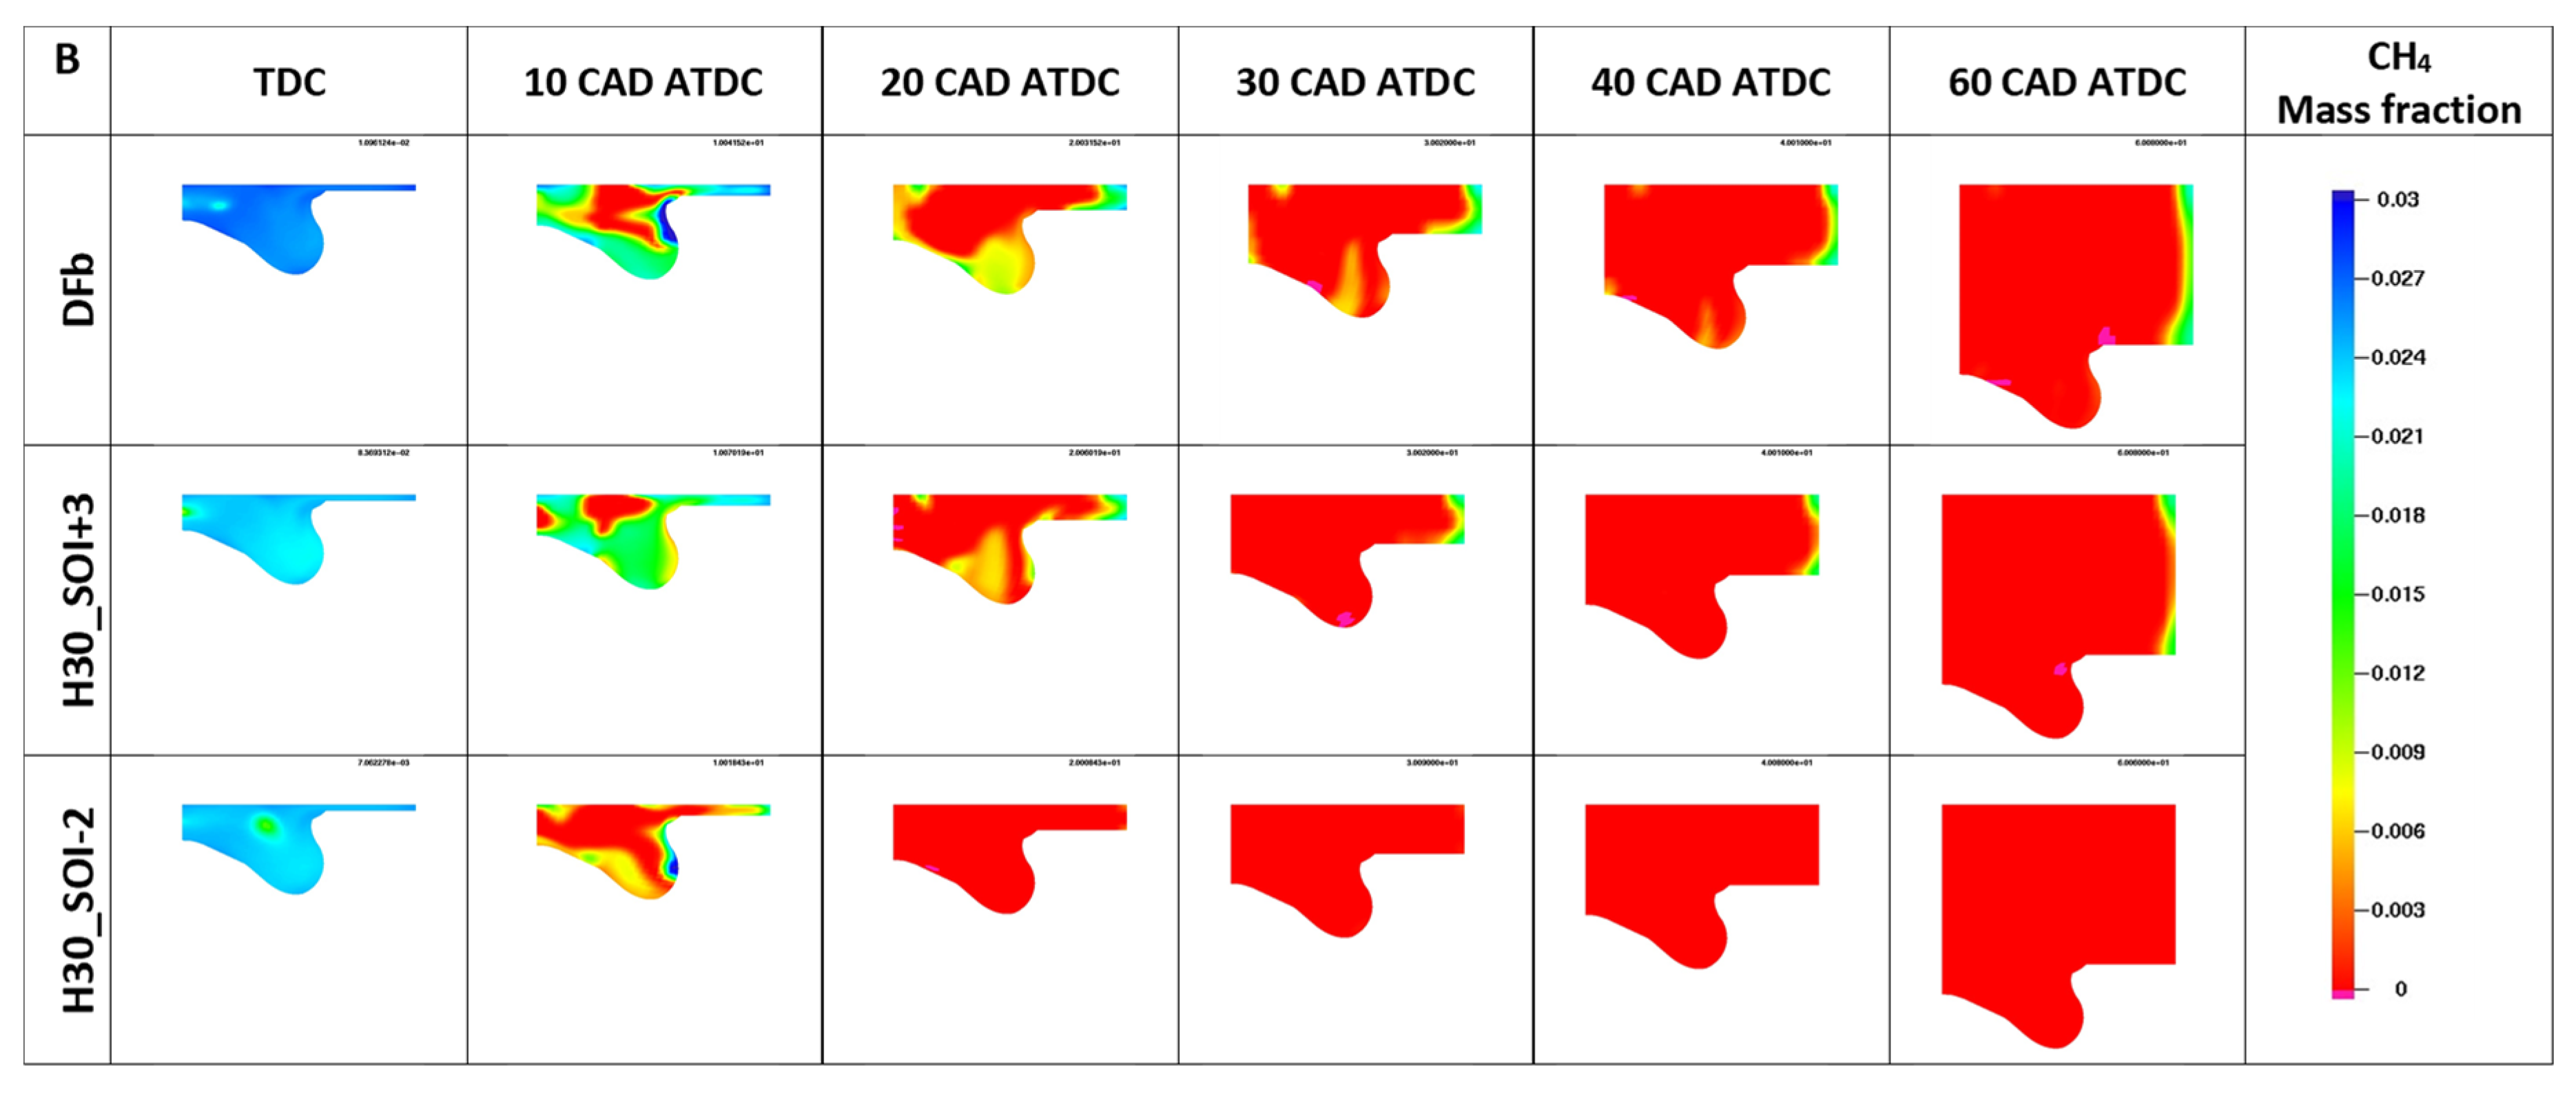
3.3. Combustion Anlysis of Selected Operating Points

In order to gain a deeper insight into the influence of hydrogen addition and diesel SOI on DF combustion, the visualizations of O2 mass fraction and CH4 mass fraction in three cut planes, at various crank angles, are reported in the Appendix A and discussed in this section.
In detail, Figure A1 reports the contour maps of O2 mass fraction for “Diesel”, “DFb” and “H30_SOI +3” cases in the following cut planes:
  • “O”: cut plane normal to the cylinder axis;
  • “M”: cut plane coincident with the symmetry plane of the sector mesh;
  • “B”: cut plane coincident with the periodic boundary of the sector mesh.
As can be observed, the main difference among the diesel case and the DF cases (“DFb” and “H30_SOI +3 cases”) is a higher and faster consumption of O2, due to the presence of the low reactivity fuel (NG or H2–NG blend, respectively) in the premixed charge. In particular, DF cases are able to exploit to a higher degree the O2 present in the core and in the periphery of the combustion chamber compared to the diesel case.
Moreover, comparing “DFb” and “H30_SOI +3” cases, it appears the latter case is clearly characterized by a faster combustion process compared to the former, owing to the addition of hydrogen in the premixed charge. In fact, even if the SOI of the “H30_SOI +3” case is delayed by 3 CAD with respect to the “DFb” case, the consumption of O2 in the “H30_SOI +3” case at 20 CAD ATDC is already higher compared to “DFb” case.
Figure A2 illustrates the contour maps of CH4 mass fractions for “DFb”, “H30_SOI +3” and “H30_SOI −2” cases in the same cut planes depicted in Figure A1.
Observing Figure A2, the following considerations can be drawn. The oxidation of CH4 in the diesel case occurs slower with respect to the DF cases. Furthermore, a higher fraction of CH4, located in the periphery of the combustion chamber, does not form part of the combustion process in the diesel case.
Finally, the higher the SOI advance, the faster (and more complete) the combustion process, as demonstrated by the comparison of “H30_SOI +3” and “H30_SOI −2” cases.

4. Conclusions

This paper explores the potential of H2 addition in enhancing the combustion of a DF NG–diesel light duty engine. Distinct from other DF engines, based on Heavy Duty diesel units, this design is of particular interest, since it can be employed for a wider range of applications, from industry and agriculture to light commercial vehicles. In comparison to conventional SI engines running on NG, biogas, NG–H2 blends, et cetera, it bears the potential for higher brake thermal efficiency.
A 3D-CFD model of the combustion system was constructed, calibrated and finally validated by comparison with experiments, then operated to investigate the effects of a partial substitution of NG with H2.
Simulations were carried out for different concentrations of H2 in the H2–NG blend (up to 50 %vol), and by keeping the total amount of fuel energy provided by the premixed charge constant; the influence of the diesel injection strategy was also assessed (varying SOI).
Simulation results demonstrate H2 enrichment accelerates the combustion process, improving its efficiency. As a consequence, BTE can increase by up to 12.6% for 50 %vol of H2 and the same SOI of the baseline case, while specific UHC and CO emissions are dramatically reduced. Moreover, under the same operating conditions, CO2 specific emissions are reduced by 19.7%, owing to the improvement of BTE and lower content of carbon in the premixed charge. The main drawbacks of hydrogen enrichment are: the increase of in-cylinder peak pressure, PPRR and NOx emissions.
However, a proper calibration of SOI permits the elimination of these shortcomings, maintaining an advantage, in comparison to standard DF NG–diesel combustion. As an example, considering a 30 %vol of H2 and reducing the injection advance by 4.5 CAD, in-cylinder peak pressure, PPRR and NOx emissions remain unchanged, while BTE, UHC, CO, and CO2 show improvement.

Author Contributions

Conceptualization, C.A.R., E.M., F.L., F.V., F.S.; methodology, C.A.R., E.M., F.L., F.V., F.S.; software, C.A.R., E.M., F.L., F.V., F.S.; validation, C.A.R., E.M., F.L., F.V., F.S.; formal analysis, C.A.R., E.M., F.L., F.V., F.S.; investigation, C.A.R., E.M., F.L., F.V., F.S.; resources, C.A.R., E.M., F.L., F.V., F.S.; data curation, C.A.R., E.M., F.L., F.V., F.S.; writing—original draft preparation, C.A.R., E.M., F.L., F.V., F.S.; writing—review and editing, C.A.R., E.M., F.L., F.V., F.S.; visualization, C.A.R., E.M., F.L., F.V., F.S.; supervision, C.A.R., E.M., F.L., F.V., F.S.; project administration, C.A.R., E.M., F.L., F.V., F.S. All authors have read and agreed to the published version of the manuscript.

Funding

This research received no external funding.

Data Availability Statement

The data presented in this study are available on request from the corresponding author.

Conflicts of Interest

The authors declare no conflict of interest.

Acronyms and Abbreviations

(A/F)premixA-to-Fuel ratio of the premixed charge
(A/F)st,premixstoichiometric A-to-Fuel ratio of the premixed charge
(A/F)st,totglobal stoichiometric A-to-Fuel ratio
(A/F)totglobal A-to-Fuel ratio
3D3-Dimensional
AFTDCAfter Firing Top Dead left
AHRRApparent Heat Release Rate
BDCBottom Dead left
BEVBattery Electric Vehicle
BMEPexpexperimental Brake Mean Effective Pressure
BMEPBrake Mean Effective Pressure
BTEBrake Thermal Efficiency
C2H6ethane
C3H8propane
CA10-90Crank Angle interval between 10% and 90% of mass fraction burnt
CA50Crank Angle at 50% of mass fraction burnt
CADCrank Angle Degree
CFDComputational Fluid Dynamics
CH4methane
CICompression Ignition
CNGCompressed Natural Gas
COcarbon monoxide
CO2carbon dioxide
DFDual Fuel
DFbbaseline Dual Fuel
DMEDimethyl Ether
EGRExhaust Gas Recirculation
EVCExhaust Valve Closing
EVOExhaust Valve Opening
FMEPFriction Mean Effective Pressure
GHGGreenhouse Gas
H2hydrogen
HDHeavy-Duty
HSDIHigh-Speed Direct-injection
ICEInternal Combustion Engine
IMEP exp * experimental gross Indicated Mean Effective Pressure
IMEPIndicated Mean Effective Pressure
IMEP*gross Indicated Mean Effective Pressure
IVCIntake Valve Closing
IVOIntake Valve Opening
KH-RTKelvin–Helmholtz/Rayleigh–Taylor
LPGLiquefied Petroleum Gas
LRFLow Reactivity Fuel
nengine revolution speed
NDNormal Diesel
NGNatural Gas
NOxnitrogen oxides
NyNumber of cells along the circumferential direction
Pengine brake Power
PaSRPartially Stirred Reactor
PCPre-Chamber
PMEPPumping Mean Effective Pressure
PPRRPeak Pressure Rise Rate
PRRPressure Rise Rate
RNGRenormalization Group
SISpark Ignition
SOCStart Of Combustion
SOIStart Of Injection
TDCTop Dead Center
TFCTurbulent Flame Closure
UHCUnburnt Hydrocarbons
Vdtotal displacement
VGTVariable Geometry Turbine
λpremixlambda of the premixed charge
λtotglobal lambda
ηcombcombustion efficiency
η i * gross indicated efficiency

Appendix A

Figure A1. Comparison between “Diesel”, “DFb” and “H30_SOI +3” cases in terms of O2 mass fraction visualized in different cut planes (“O”: cut plane normal to the cylinder axis; “M”: cut plane coincident with the symmetry plane of the sector mesh; “B”: cut plane coincident with a cyclic boundary of the sector mesh), at different crank angles.
Fuels 03 00009 g0a1aFuels 03 00009 g0a1b
Figure A2. Comparison between “DFb”, “H30_SOI +3” and “H30_SOI -2” cases in terms of CH4 mass fraction visualized in different cut planes (“O”: cut plane normal to the cylinder axis; “M”: cut plane coincident with the symmetry plane of the sector mesh; “B”: cut plane coincident with a cyclic boundary of the sector mesh), at different crank angles.
Fuels 03 00009 g0a2aFuels 03 00009 g0a2b

References

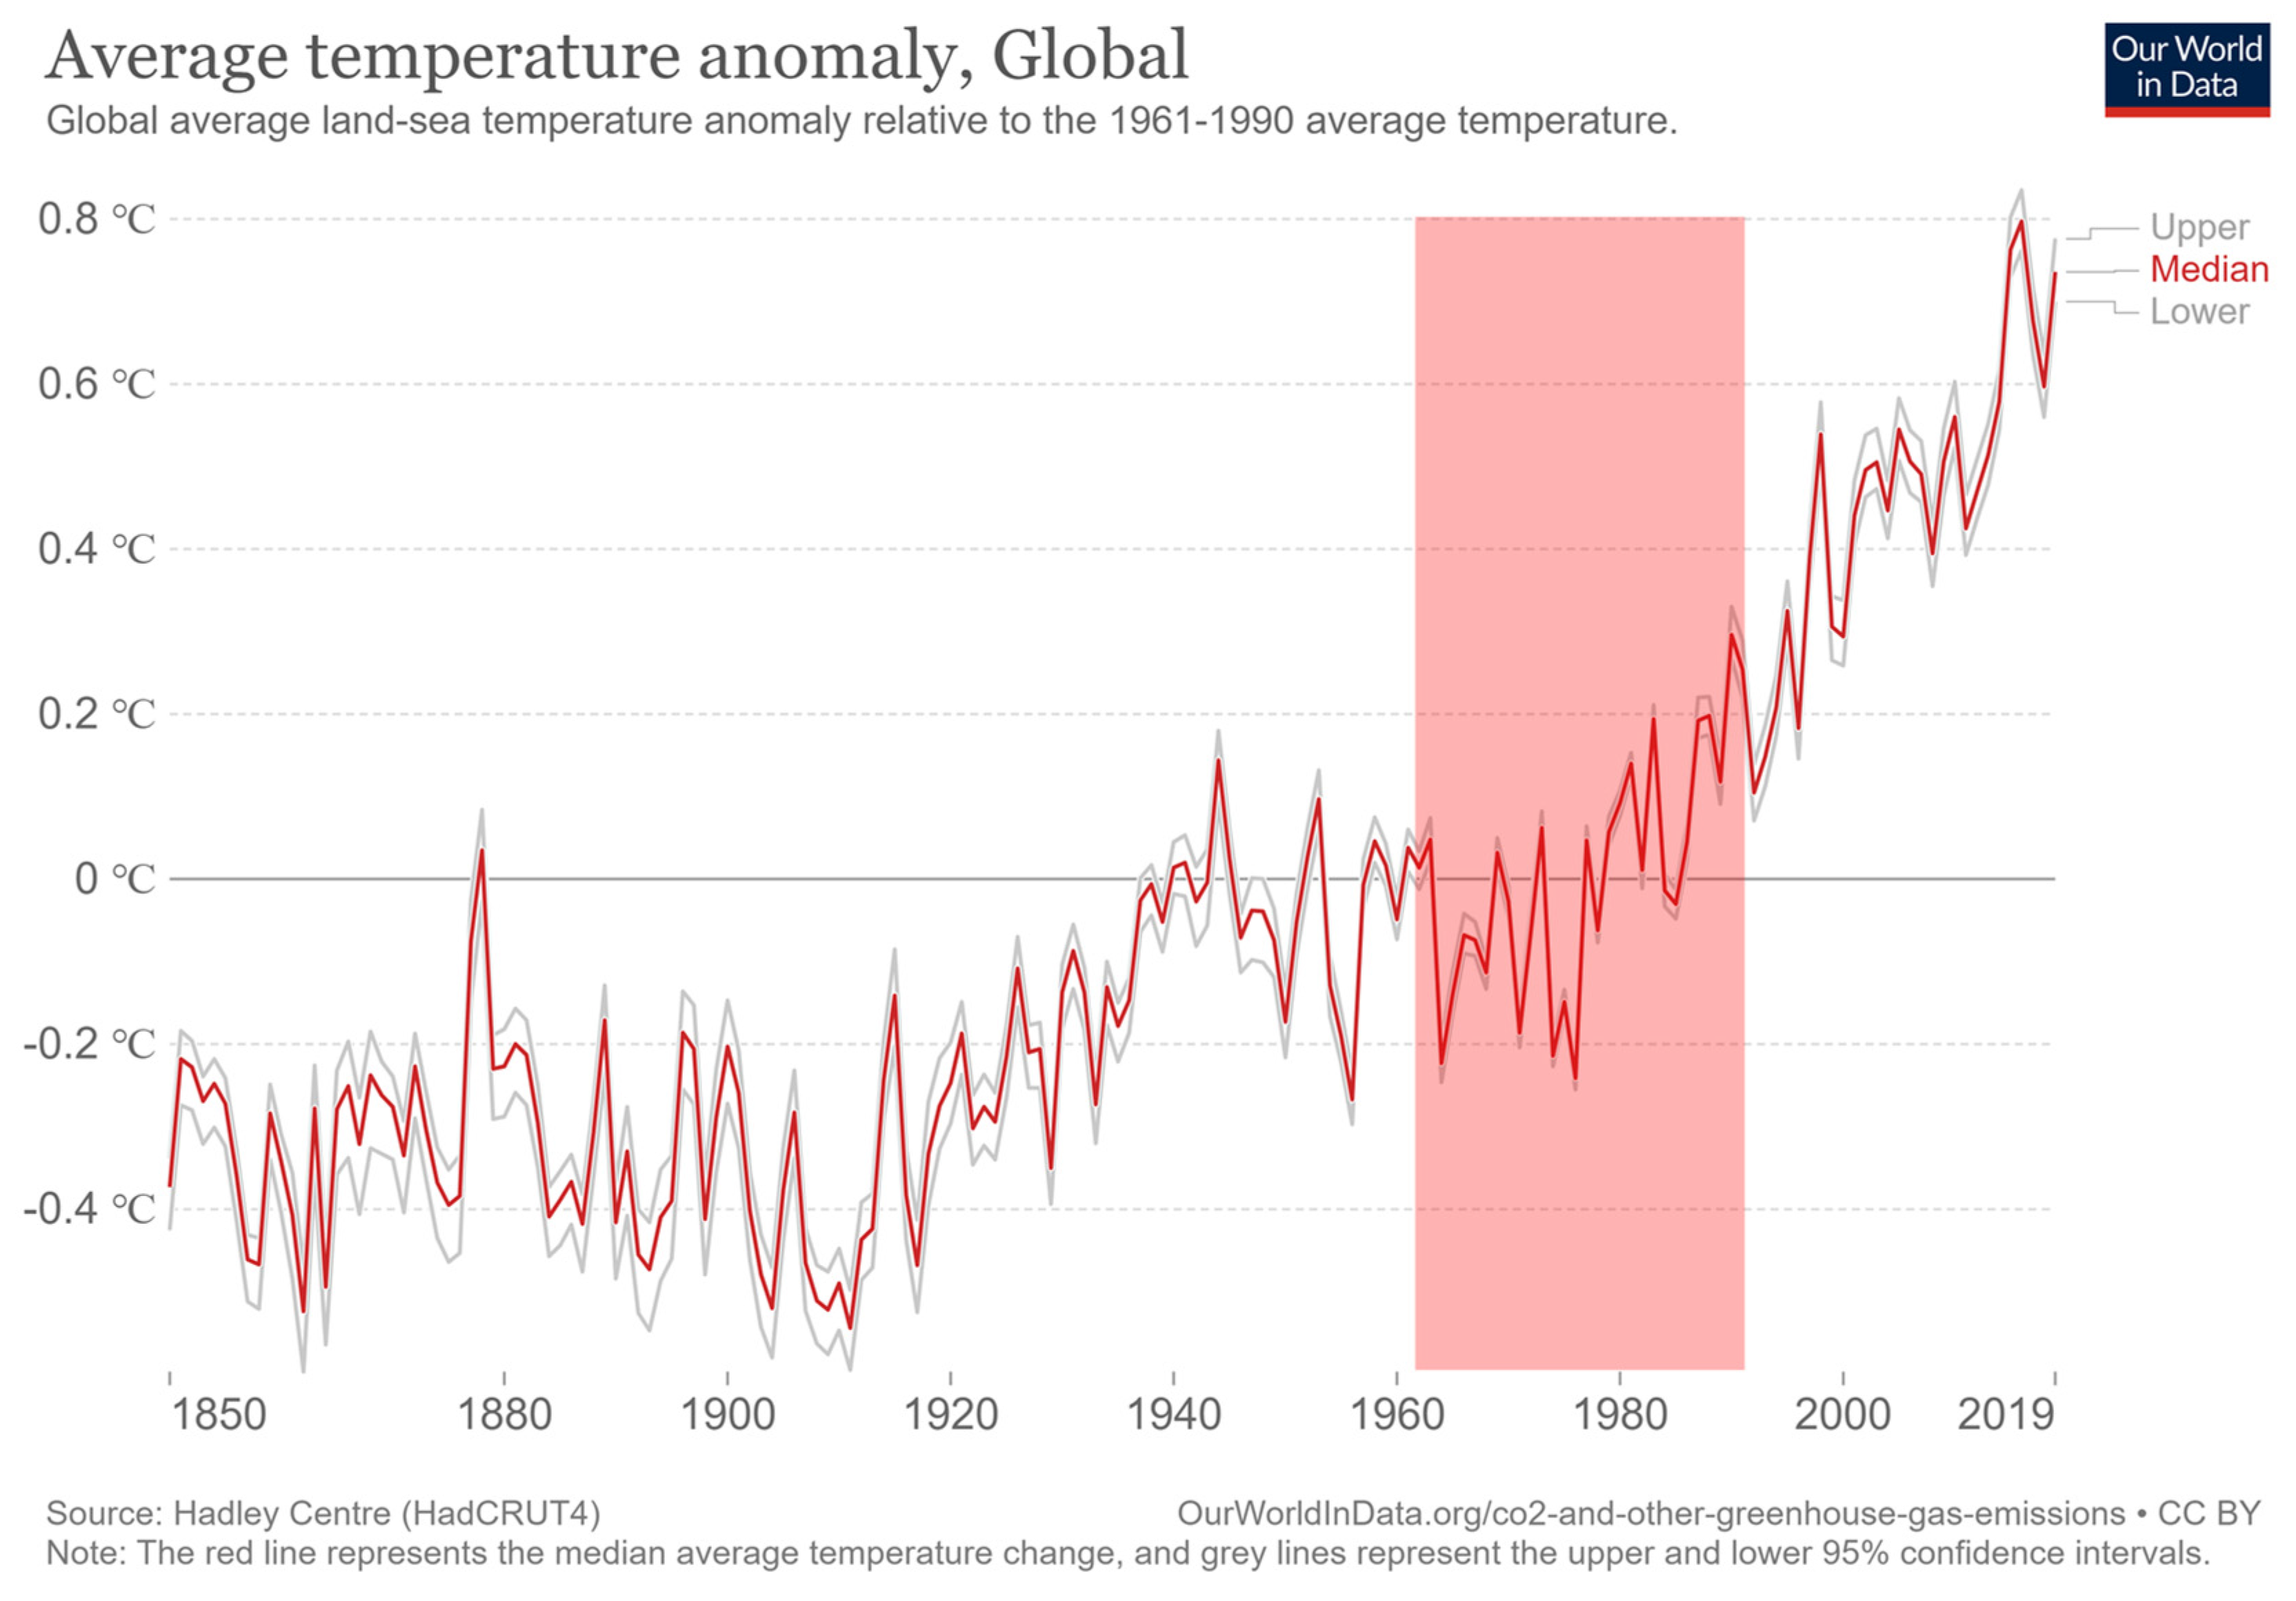
  1. Ritchie, H.; Roser, M. CO2 and Greenhouse Gas Emissions. Our World in Data. May 2020. Available online: https://ourworldindata.org/co2-and-other-greenhouse-gas-emissions (accessed on 12 September 2021).
  2. Allan, R.P.; Arias, P.A.; Berger, S.; Canadell, J.G.; Cassou, C.; Chen, D.; Cherchi, A.; Connors, S.L.; Coppola, E.; Cruz, F.A.; et al. (Eds.) Climate Change 2021: The Physical Science Basis. Contribution of Working Group I to the Sixth Assessment Report of the Intergovernmental Panel on Climate Change; Cambridge University Press: Cambridge, UK, 2021. [Google Scholar]
  3. COP26 Goals. UN Climate Change Conference (COP26) at the SEC—Glasgow 2021. Available online: https://ukcop26.org/cop26-goals/ (accessed on 2 December 2021).
  4. Dimitriou, P.; Tsujimura, T. A review of hydrogen as a compression ignition engine fuel. Int. J. Hydrog. Energy 2017, 42, 24470–24486. [Google Scholar] [CrossRef]
  5. AVL. Press Release: AVL Advances Development of Hydrogen Internal Combustion Engine for CO2 Neutral Transportation. Available online: https://www.avl.com/all-press-releases/-/asset_publisher/0RuLfhkFPSCT/content/press-release-avl-advances-development-of-hydrogen-internal-combustion-engine-for-co2-neutral-transportation?_com_liferay_asset_publisher_web_portlet_AssetPublisherPortlet_INSTANCE_0RuLfhkFPSCT_redirect=https%3A%2F%2Fwww.avl.com%3A443%2Fall-press-releases%3Fp_p_id%3Dcom_liferay_asset_publisher_web_portlet_AssetPublisherPortlet_INSTANCE_0RuLfhkFPSCT%26p_p_lifecycle%3D0%26p_p_state%3Dnormal%26p_p_mode%3Dview%26_com_liferay_asset_publisher_web_portlet_AssetPublisherPortlet_INSTANCE_0RuLfhkFPSCT_cur%3D0%26p_r_p_resetCur%3Dfalse%26_com_liferay_asset_publisher_web_portlet_AssetPublisherPortlet_INSTANCE_0RuLfhkFPSCT_assetEntryId%3D40114324 (accessed on 29 September 2021).
  6. A Hydrogen Strategy for a Climate-Neutral Europe. Available online: https://eur-lex.europa.eu/legal-content/EN/TXT/HTML/?uri=CELEX:52020DC0301&from=EN (accessed on 30 September 2021).
  7. The European Green Deal. Available online: https://eur-lex.europa.eu/legal-content/EN/TXT/HTML/?uri=CELEX:52019DC0640&from=EN (accessed on 11 April 2021).
  8. NextGenerationEU. Available online: https://europa.eu/next-generation-eu/index_en (accessed on 30 September 2021).
  9. Attard, W.P.; Parsons, P. Flame Kernel Development for a Spark Initiated Pre-Chamber Combustion System Capable of High Load, High Efficiency and Near Zero NOx Emissions. SAE Int. J. Engines 2010, 3, 408–427. [Google Scholar] [CrossRef] [Green Version]
  10. Shim, E.; Park, H.; Bae, C. Comparisons of advanced combustion technologies (HCCI, PCCI, and dual-fuel PCCI) on engine performance and emission characteristics in a heavy-duty diesel engine. Fuel 2020, 262, 116436. [Google Scholar] [CrossRef]
  11. Wei, L.; Geng, P. A review on natural gas/diesel dual fuel combustion, emissions and performance. Fuel Process. Technol. 2016, 142, 264–278. [Google Scholar] [CrossRef]
  12. Pedrozo, V.B.; May, I.; Guan, W.; Zhao, H. High efficiency ethanol-diesel dual-fuel combustion: A comparison against conventional diesel combustion from low to full engine load. Fuel 2018, 230, 440–451. [Google Scholar] [CrossRef]
  13. Saccullo, M.; Benham, T.; Denbratt, I. Dual Fuel Methanol and Diesel Direct Injection HD Single Cylinder Engine Tests; SAE Technical Paper No. 2018-01-0259; SAE: Warrendale, PA, USA, 2018. [Google Scholar] [CrossRef]
  14. Cardone, M.; Marialto, R.; Ianniello, R.; Lazzaro, M.; di Blasio, G. Spray Analysis and Combustion Assessment of Diesel-LPG Fuel Blends in Compression Ignition Engine. Fuels 2020, 2, 1–15. [Google Scholar] [CrossRef]
  15. Zheng, Z.; Xia, M.; Liu, H.; Wang, X.; Yao, M. Experimental study on combustion and emissions of dual fuel RCCI mode fueled with biodiesel/n-butanol, biodiesel/2,5-dimethylfuran and biodiesel/ethanol. Energy 2018, 148, 824–838. [Google Scholar] [CrossRef]
  16. Chen, Z.; Yao, M.; Zheng, Z.; Zhang, Q. Experimental and Numerical Study of Methanol/Dimethyl Ether Dual-Fuel Compound Combustion. Energy Fuels 2009, 23, 2719–2730. [Google Scholar] [CrossRef]
  17. Schefer, R.W. Hydrogen enrichment for improved lean flame stability. Int. J. Hydrog. Energy 2003, 28, 1131–1141. [Google Scholar] [CrossRef]
  18. Miao, H.; Lu, L.; Huang, Z. Flammability limits of hydrogen-enriched natural gas. Int. J. Hydrog. Energy 2011, 36, 6937–6947. [Google Scholar] [CrossRef]
  19. Rahnama, P.; Paykani, A.; Reitz, R.D. A numerical study of the effects of using hydrogen, reformer gas and nitrogen on combustion, emissions and load limits of a heavy duty natural gas/diesel RCCI engine. Appl. Energy 2017, 193, 182–198. [Google Scholar] [CrossRef]
  20. Zhou, J.H.; Cheung, C.S.; Leung, C.W. Combustion, performance and emissions of a diesel engine with H2, CH4 and H2–CH4 addition. Int. J. Hydrog. Energy. 2014, 39, 4611–4621. [Google Scholar] [CrossRef]
  21. Liu, F.; Kang, Y.; Wu, H.; Lee, C.-F.; Li, Y. Effect of Hydrogen Volume Ratio on the Combustion Characteristics of CNG-Diesel Dual-Fuel Engine; SAE Technical Paper No. 2017-01-2270; SAE: Warrendale, PA, USA, 2017. [Google Scholar] [CrossRef]
  22. Tripathi, G.; Sharma, P.; Dhar, A.; Sadiki, A. Computational investigation of diesel injection strategies in hydrogen-diesel dual fuel engine. Sustain. Energy Technol. Assess. 2019, 36, 100543. [Google Scholar] [CrossRef]
  23. Mattarelli, E.; Rinaldini, C.A.; Savioli, T.; Scrignoli, F. Optimization of a High-Speed Dual-Fuel (Natural Gas-Diesel) Compression Ignition Engine for Gen-sets. SAE Int. J. Engines 2021, 14, 369–386. [Google Scholar] [CrossRef]
  24. Amsden, A. KIVA-3: A KIVA Program with Block-Structured Mesh for Complex Geometries; No. LA-12503-MS; Los Alamos National Lab.: New Mexico, NM, USA, 1993. [Google Scholar]
  25. Golovitchev, V.I.; Nordin, N.; Jarnicki, R.; Chomiak, J. 3-D Diesel Spray Simulations Using a New Detailed Chemistry Turbulent Combustion Model. SAE Trans. 2000, 109, 1391–1405. [Google Scholar]
  26. Golovitchev, V.I.; Imren, A. Development of dual fuel combustion models for direct injected heavy duty diesel engines. In Diesel Fuels: Characteristics, Performance and Environmental Impacts; Nova Science Publishers: Hauppauge, NY, USA, 2013; pp. 85–118. [Google Scholar]
  27. Golovitchev, V.I.; Rinaldini, C.A.; Montorsi, L.; Rosetti, A. CFD combustion and emission formation modeling for a HSDI diesel engine using detailed chemistry. In American Society of Mechanical Engineers, Internal Combustion Engine Division (Publication) ICE; ASME: New York, NY, USA, 2006. [Google Scholar] [CrossRef]
  28. Mattarelli, E.; Rinaldini, C.A.; Golovitchev, V.I. CFD-3D analysis of a light duty Dual Fuel (Diesel/Natural Gas) combustion engine. Energy Procedia 2014, 45, 929–937. [Google Scholar] [CrossRef] [Green Version]
  29. Gustavsson, J.; Golovitchev, V.I. Spray Combustion Simulation Based on Detailed Chemistry Approach for Diesel Fuel Surrogate Model; SAE Technical Paper 2003-01-1848; SAE International: Warrendale, PA, USA, 2003. [Google Scholar] [CrossRef]
  30. Ehleskog, R.; Golovitchev, V.; Denbratt, I.; Andersson, S.; Rinaldini, C.A. Experimental and numerical investigation of split injections at low load in an hddi diesel engine equipped with a piezo injector. In Proceedings of the Powertrain & Fluid Systems Conference and Exhibition, Toronto, ON, Canada, 16–19 October 2006; pp. 932–946. [Google Scholar] [CrossRef]
  31. Cantore, G.; Mattarelli, E.; Rinaldini, C.A.; Savioli, T.; Scrignoli, F. Numerical optimization of the injection strategy on a light duty diesel engine operating in dual fuel (CNG/diesel) mode. Int. J. Heat Technol. 2019, 37, 682–688. [Google Scholar] [CrossRef]
  32. Rinaldini, C.A.; Mattarelli, E.; Golovitchev, V.I. Potential of the Miller cycle on a HSDI diesel automotive engine. Appl. Energy 2013, 112, 102–119. [Google Scholar] [CrossRef]
  33. Eng, J.A. Characterization of Pressure Waves in HCCI Combustion; SAE Technical Paper No. 2002-01-2859; SAE: Warrendale, PA, USA, 2002. [Google Scholar] [CrossRef]
Figure 1. Global average temperature variation relative to the 1961/1990 global average temperature (the red area in the graph indicates the reference interval) [1].
Fuels 03 00009 g001
Figure 2. Computational grid analysis: (a) combustion heat for different grids, varying the reference cell size, (b) computational time for different grids, varying the reference cell size, (c) the final computational grid for combustion analysis (reference cell size = 0.78, Ny = 25).
Fuels 03 00009 g002
Figure 3. Comparison between experimental and numerical in terms of in-cylinder pressure (a) for ND and (b) for DF NG/diesel) and AHRR ((c) for ND and (d) for DF NG/diesel) at 3000 rpm–177 Nm.
Fuels 03 00009 g003
Figure 4. In-cylinder pressure (a) and Apparent Heat Release Rate (b) for different Hythane blends.
Fuels 03 00009 g004
Figure 5. Contour maps of IMEP* for different H2 vol%–delta SOI combinations with peak in-cylinder pressure (a) and PPRR (b) levels superimposed.
Fuels 03 00009 g005
Figure 6. Contour maps of CA50 (a) and combustion duration CA10-90 (b).
Fuels 03 00009 g006
Figure 7. Contour maps of BTE (a) and Combustion Efficiency (b).
Fuels 03 00009 g007
Figure 8. (a) Contour maps of CO2, (b) NOx, (c) CO, (d) UHC.
Fuels 03 00009 g008
Figure 9. Comparison between “H30_SOI −2”, “H30_SOI +3”, “H30_SOI +4.5” cases in terms of IMEP* (a), combustion efficiency (b) and BTE (c).
Fuels 03 00009 g009
Figure 10. Comparison between “H30_SOI −2”, “H30_SOI +3”, “H30_SOI +4.5” cases in terms of CA50 (a) and CA10-90 (b).
Fuels 03 00009 g010
Figure 11. Comparison between “H30_SOI −2”, “H30_SOI +3”, “H30_SOI +4.5” cases in terms of peak pressure (a) and PPRR (b).
Fuels 03 00009 g011
Figure 12. Comparison between “H30_SOI −2”, “H30_SOI +3”, “H30_SOI +4.5” cases in terms of NOx (a), CO2 (b), CO (c) and HC (d).
Fuels 03 00009 g012
Table 1. Main technical data of the baseline engine.
Engine TypeHSDI 4-S Diesel, EURO IV
Cylinders4 in-line
Total displacement [L]2.78
Bore × Stroke [mm]94 × 100
Compression ratio17.5:1
N. of valves per cylinder4
Exhaust valve timing [CA °AFTDC]114 (EVO)/389 (EVC)
Intake valve timing [CA °AFTDC]337 (IVO)/590 (IVC)
Air MeteringTurbocharger with VGT + Intercooler
Injection systemCommon Rail
Max. Injection press. [MPa]160
Number of injector holes6
Injector hole diameter [mm]0.153
Max. brake power [kW@rpm]130@3800
Max. brake torque [Nm@rpm]440@1750
Max. Engine Speed [rpm]4600
Table 2. Main parameters of the simulated operating point.
ParameterNDDF NG-Diesel
Engine speed × BMEP [rpm × bar]3000 × 83000 × 8
Brake Torque [Nm]177177
Brake Power [kW]55.655.6
Amount of Diesel fuel per cylinder [mg/cycle]36.317.6
Energy provided by diesel fuel [%] (*)100.020.9
Amount of NG per cylinder [mg/cycle]-25.26
Energy provided by NG [%] (*)0.075.2
(*) Compared to the energy provided by diesel in ND mode.
Table 3. Comparison between experimental and numerical IMEP* and peak in-cylinder pressure for ND and DF NG–diesel cases at 3000 rpm–BMEP = 8 bar.
NDDF
Numerical IMEP*[bar]12.6511.69
Experimental IMEP*[bar]13.1311.64
IMEP* difference[%]3.6830.467
Numerical peak in-cylinder pressure[bar]91.1378.44
Experimental peak in-cylinder pressure [bar]89.6477.44
Peak in-cylinder pressure difference[%]1.6650.655
Table 4. Composition of the H2–NG blends analyzed.
NG5 vol% H210 vol% H220 vol% H230 vol% H240 vol% H250 vol% H2
Composition [vol%]CH496.00091.20086.40076.80067.20057.60048.000
C2H62.5002.3752.2502.0001.7501.5001.250
C3H80.5000.4750.4500.4000.3500.3000.250
N21.0000.9500.9000.8000.7000.6000.500
H20.0005.00010.00020.00030.00040.00050.000
Table 5. Main features of the H2–NG blends analyzed.
CH4
[mg]
H2
[mg]
(A/F)premix
[-]
(A/F)st,premix
[-]
λpremix
[-]
(A/F)tot
[-]
(A/F)st,tot
[-]
λtot
[-]
H2 Energy Fract.
[%]
H2 Mass Fract.
[%]
NG23.390.0030.7816.841.8323.5716.231.45--
5 vol% H223.070.1630.9416.951.8223.6616.311.451.21%0.51%
10 vol% H222.670.3331.1917.081.8323.7916.401.452.52%1.08%
20 vol% H221.770.7131.7817.371.8324.1016.601.455.46%2.37%
30 vol% H220.781.1732.4217.721.8324.4316.851.458.93%3.96%
40 vol% H219.601.7033.2218.161.8324.8417.161.4513.00%5.89%
50 vol% H218.062.3734.4218.761.8325.4517.561.4518.08%8.44%
Publisher’s Note: MDPI stays neutral with regard to jurisdictional claims in published maps and institutional affiliations.

