1. Introduction
X80 high-strength low-carbon microalloyed pipeline steels with high values of low-temperature impact toughness below −40 °C have been developed and applied. X80 pipeline steels, according to ISO 3183 standard, require yield strengths of 555–705 MPa, tensile strengths of 625–825 MPa, and 54 J absorbed energy at 0 °C for Charpy impact tests of standard specimens with a v-shaped incision [
1]. The requirements of the industry standard of the existing Bovanenkovo–Ukhta gas pipeline even exceed the requirements of ISO 3183 concerning impact toughness level [
2].
At the same time, even when considering the limited experimental data, it is evident that not all X80 steels have the same tendency towards brittle fracture at low temperatures [
3]. The occurrence of splitting is most often considered in the literature as one of the possible reasons for this phenomenon [
4,
5,
6,
7].
We assume that splitting is a mechanism for the formation of secondary cracks or splits that are parallel to the rolling plane of steel sheet. Typically, splitting is observed in T-L or L-T specimens after mechanical tests. This implies that splits are forms of cracks with well-reproducible arrangements. We perceive fissures that are present in materials before the start of the fracture process as lamination defects or delaminations and will not take them into account in the present work.
The attention that is paid to splitting is mainly caused by two factors: frequent appearance of splits on fracture surfaces during mechanical tests of steel sheets and the presence of cleavage facets on the edges of splits. However, studies of the splitting phenomenon have led to very contradictory conclusions. According to some studies, the occurrence of splits reduces impact toughness [
8,
9,
10,
11], but others have come to the opposite conclusions [
12,
13,
14,
15,
16]. These contradictions are a reflection of the complexity of the very splitting phenomenon in different materials. Such studies are based on the belief that there is an unambiguous relationship between the impact toughness level and the fractographic features of a particular specimen. However, this relationship is unambiguous only for the measured value of impact toughness and fracture pattern of the same specimen. Such an approach is equivalent to the assumption that the observed mechanism of deformation and fracture is the only one for a specified test temperature, although in actuality, it may only manifest in special cases. This is indicated by the fact that at the ductile-to-brittle transition temperature range, when a large number of nominally identical specimens are tested at the same test temperature, there is an increased scattering of impact toughness values [
17,
18,
19]. This scattering is generated by the discrete/joint action of both brittle and ductile fracture mechanisms under the inhomogeneous conditions of the ferritic steels’ local mechanic properties. This phenomenon is most noticeable during multiple Charpy impact tests using standard test specimens with U-shaped incision (U-notch) [
19,
20]. Such samples are considered more sensitive to the local features of the microstructure of the material subjected to dynamic loading.
The investigation of low-temperature impact fracture appearances in thermo-mechanically controlled processed steels shows that, along with ductile dimpled regions and splits, brittle tilted fracture regions could appear [
21,
22,
23,
24]. The latter phenomenon is beyond the scope of this study.
The assessment of splits’ influence on impact toughness is based on determining the fraction of absorbed energy that is associated with their formation. The most common approaches for this purpose involve the measurement of geometrical characteristics of splits [
4,
8,
14,
15,
25]. The low-temperature plasticity of high-toughness steels is much greater than that of conventional C-Mn steels. Therefore, there is a need for introducing other direct or indirect characteristics.
In the case of Charpy impact tests of low-carbon microalloyed X80 pipeline steels, the relationship between splits and impact toughness values is especially noticeable at low temperatures. An alternative approach is the development of mathematical models predicting changes in the toughness of steels caused by splits depending on the test temperature [
14,
25]. The advantages and disadvantages of these models were analyzed in [
15]. However, the inconsistency of the conclusions that are obtained as a result of their application indicate the subjectivity of the assumptions underlying each model.
Another attempt to improve the toughness evaluation of X80 low-carbon microalloyed pipeline steels is test specimen incision-type modification [
6,
26].
Taking into account the above considerations, on the basis of multiple Charpy impact tests of standard nominally identical specimens of three X80 low-carbon microalloyed pipeline steels fractured in equal conditions (20 specimens per each test temperature) and the consequent investigation of each tested specimen, the following aims are postulated:
To investigate the origin of impact toughness scattering;
To reveal the role of local inhomogeneity of plasticity in the scattering of impact toughness;
To study the role of splitting in fractures and its influence on impact toughness.
2. Materials and Methods
The metals of three high-strength low-carbon microalloyed pipeline steels with a predominantly bainitic microstructure, produced by industrial thermomechanical controlled process technology, were studied. Mechanical property evaluation results are shown in
Table 1. The tensile tests were conducted according to DIN EN ISO 6892-1 using standard round tensile type 1 specimens.
The steels under investigation have shown various strengths and plasticities. However, they meet all requirements of X80 strength class according to ISO 3183 [
1].
The thickness of the steel sheets under investigation was 28 mm. The chemical composition is given in
Table 2.
Charpy Impact tests were carried out according to the ASTM E2298 standard [
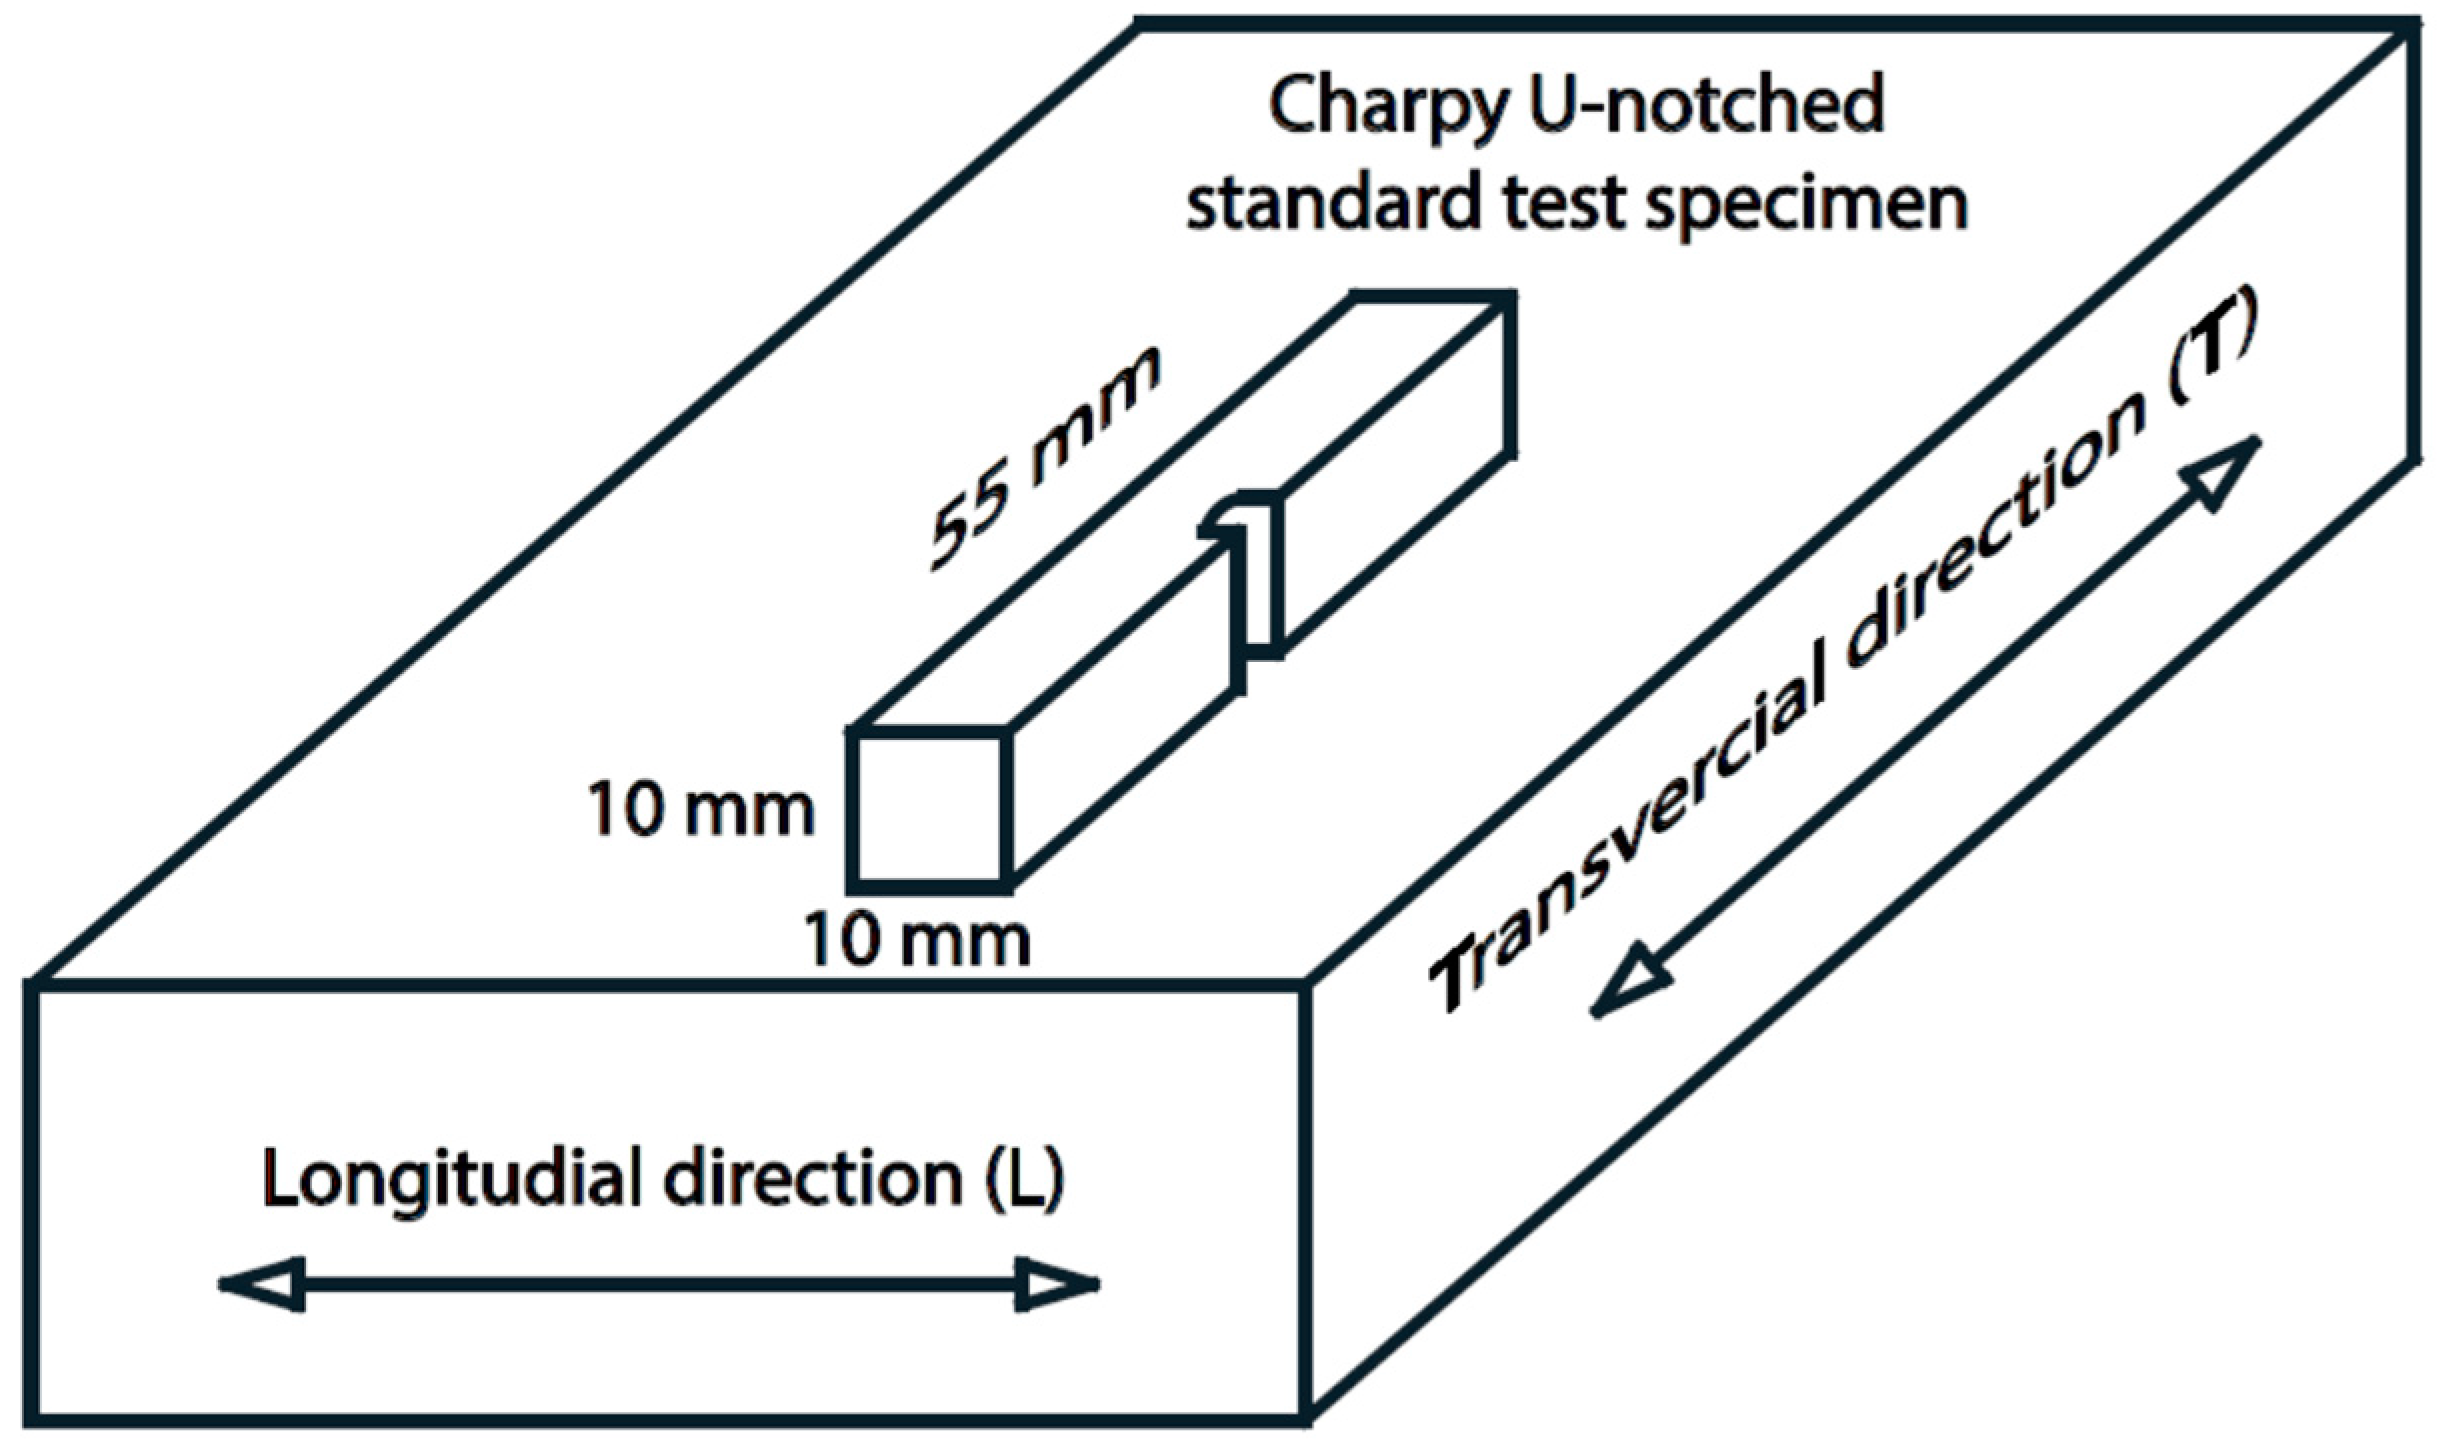
27] on a Zwick/Roell test machine with an impact energy of 750 J with the dynamic load-deflection curves record. In total, 220 nominally identical standard Charpy impact test specimens 55 × 10 × 10 mm with a U-shaped incision were subjected to impact fracture at 20 °C, −60 °C, −80 °C, −100 °C test temperatures. At each temperature, 20 specimens were tested. The specimen preparation scheme is presented in
Figure 1. A U-notched standard test specimen was selected to enhance the sensitivity of impact toughness to the local microstructural features of fractured specimen [
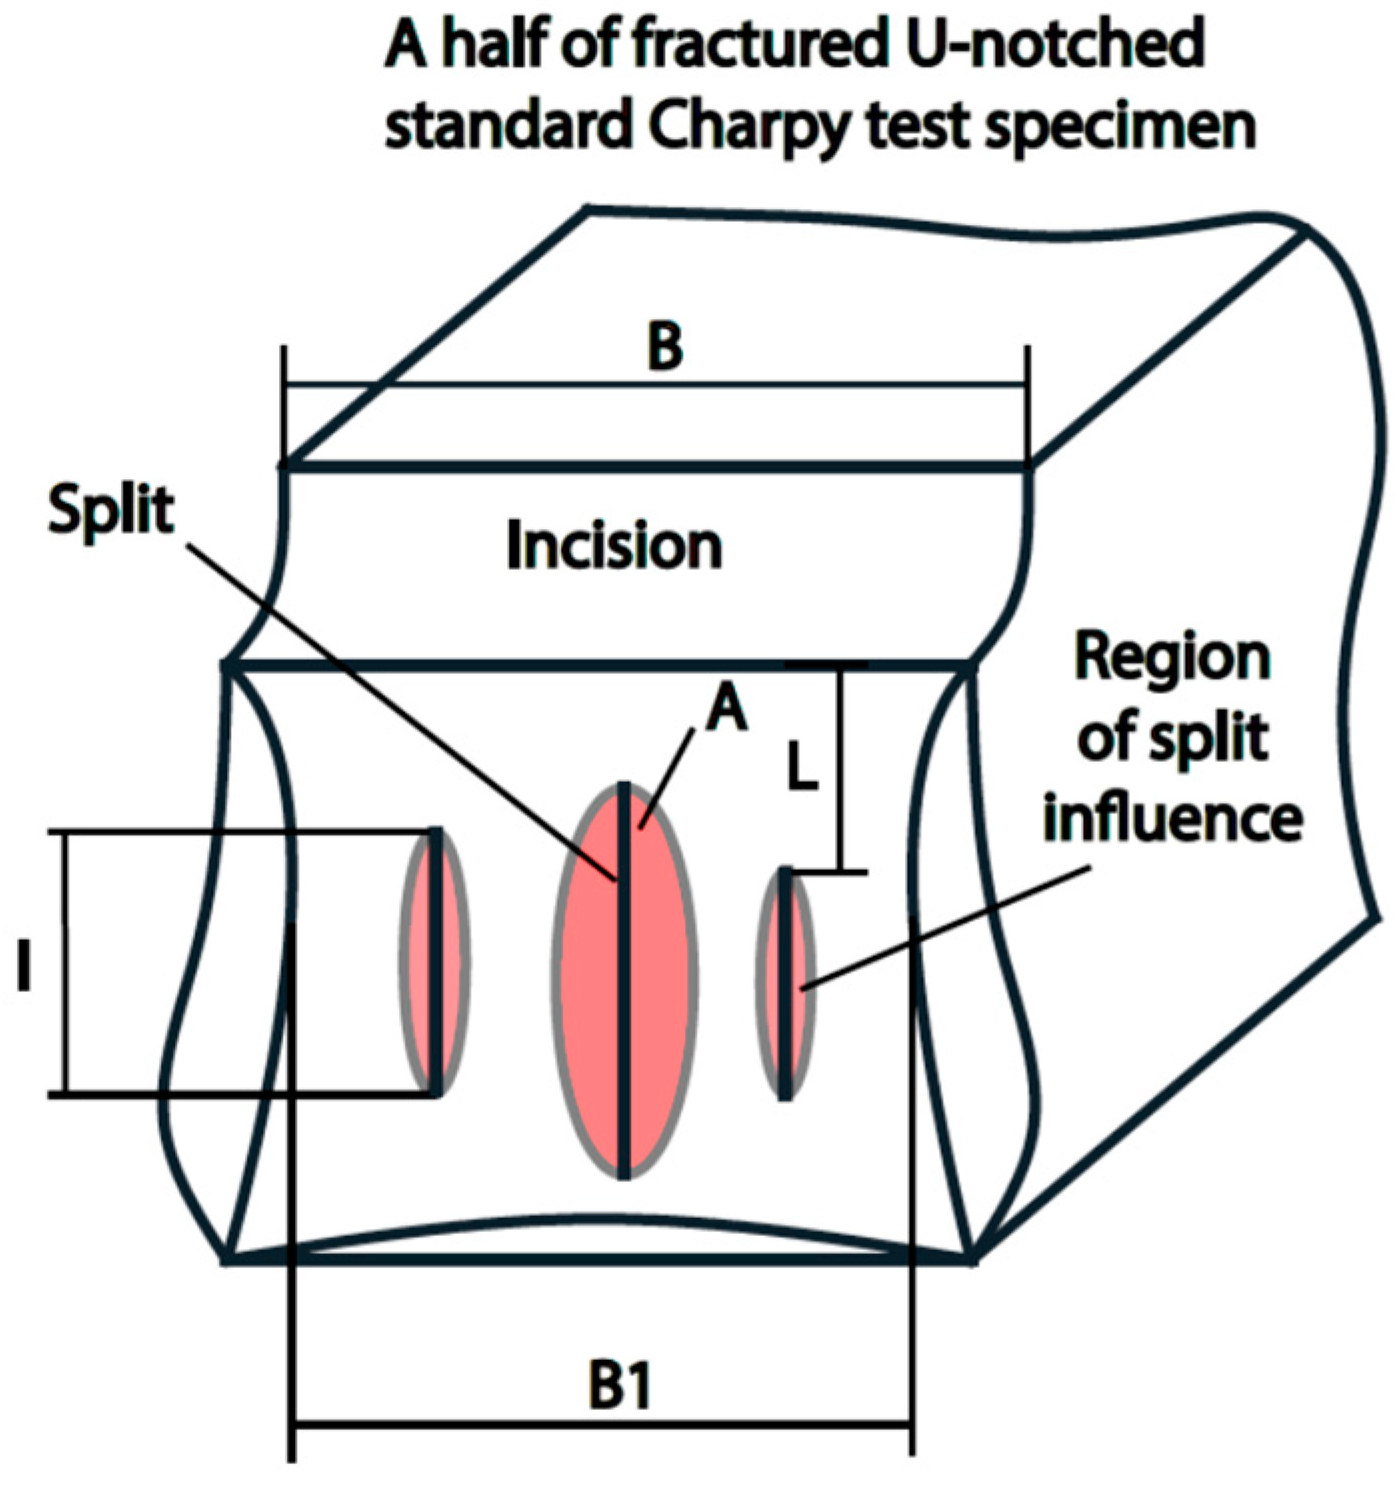
20]. The specimens had a transverse orientation relative to the sheet rolling direction (T-L orientation). Both inner and outer steel sheet surfaces were ground by 2 mm, and the axial segregation zone was cut off during the test specimens preparation procedure. The incision was introduced through the thickness direction of the sheet towards the L direction. A study of macrofractographic features of tested specimens was carried out using an imaging system that included an EOS 6D camera with a MP-E 65mm f/2.8 1-5x Macro lens (Canon, Tokyo, Japan). The following characteristics were measured: specimen width B, specimen width at the narrowest point B1, the number of splits N, the length of splits l, the summary length of all splits at both parts of each fractured specimen S, the distance between the incision root and the nearest tip of each split L, and the projection area of the fracture surface that is affected by splits, evaluated using elliptical approximation (
Figure 2). These characteristics were chosen based on existing concepts of the fracture surface structure of tested Charpy specimens with U-shaped incision showing the appearance of splits.
A microfractographic features investigation of impact-fractured specimens was conducted using a CrossBeam 1540 EsB (Carl Zeiss, Oberkochen, Germany) dual-beam station equipped with an EBSD Nordlyss S detector (Oxford Instruments, High Wycombe, UK) in the scanning electron microscope mode. The accelerating voltage was 20 kV.
A local plastic strain degree assessment was performed in electron backscatter diffraction (EBSD) mode using band contrast (BC) pattern quality parameter measurement in each point of the map. BC reflects the difference between the centerline of Kikuchi bands and their background. The BC value is responsible for lattice distortion visualization in the range from 0 to 256. The greater the lattice distortion, the smaller the BC value. Unlike other regions, the metal of the plastic zone adjacent to the ductile fracture surface is strongly distorted. Therefore, the acquisition conditions were selected in such a way that an equivalent reliable result was obtained in all cases. The acquisition of EBSD maps was carried out using averaging by 6 electron backscatter patterns per each point of square raster with 4 × 4 binning and 200 nm step size, 15 mm working distance with 20 kV acceleration voltage, and 120 µm aperture. The reliability criterion was the proportion of indexed points, which, in the case of the plastic zone under both ductile and cleavage fracture surface, was 85%. Crystallographic data were obtained and processed using Aztec 3.1 and hkl Chanel 5 (Oxford Instruments, High Wycombe, UK) software. For the local plastic strain degree assessment, the metallographic specimens were prepared from specimen sections tilted at 45 degrees angle relative to the L-T plane to obtain an undistorted geometric shape of the splits.
3. Results
Figure 3 shows the results of experimental determination of impact toughness temperature dependencies, using multiple tests (20 specimens per test temperature) of standard, nominally identical Charpy U-notched test specimens for the three steels under investigation.
The maximal level of KCU impact toughness at 20 °C is observed for steel 1, intermediate for steel 2, and the minimal level for steel 3. That result is consistent with variations in yield strength (
Table 1). Steel 1 shows the maximal value of yield strength, steel 2 shows an intermediate value, and steel 3 shows the minimal value. The impact fracture behavior under dynamic conditions is similar between the studied steels. A decrease in impact toughness values is observed with the decrease in test temperature from 20 °C to −100 °C. An increase in impact toughness values’ scattering with the test temperature is also observed.
There are two characteristics that are used for the assessment of impact toughness scattering: variation range and standard deviation (
Table 3).
The magnitude variation range describes the resultant impact toughness scattering for a given number of specimens, while the standard deviation is a measure of the obtained impact toughness values’ frequency distribution shape. Both minimal variation range magnitude and the standard deviation of impact toughness are observed for steel 2 at 20 °C. We suppose that the instrumental error is less than this scattering. In turn, the scattering magnitude, which is obtained at 20 °C values, is caused by the local impact toughness variability of fractured material. With a decrease in the test temperature below −60 °C, there is an impact toughness scattering rate increase for the three studied steels.
The observed impact toughness scatter magnitude is incomparably smaller than the conventional C-Mn steels’ ductile-to-brittle transition range value. The difference between maximal and minimal values of impact toughness at a certain test temperature in the present work did not exceed two times. Corresponding C-Mn steel values reached 3 times [
19] and even 10 times [
28].
It is worth noting the nontriviality of the following observation. Due to the impact toughness scattering and the small slope of impact toughness temperature dependence, identical values of impact toughness were recorded over a wide temperature range (
Figure 3).
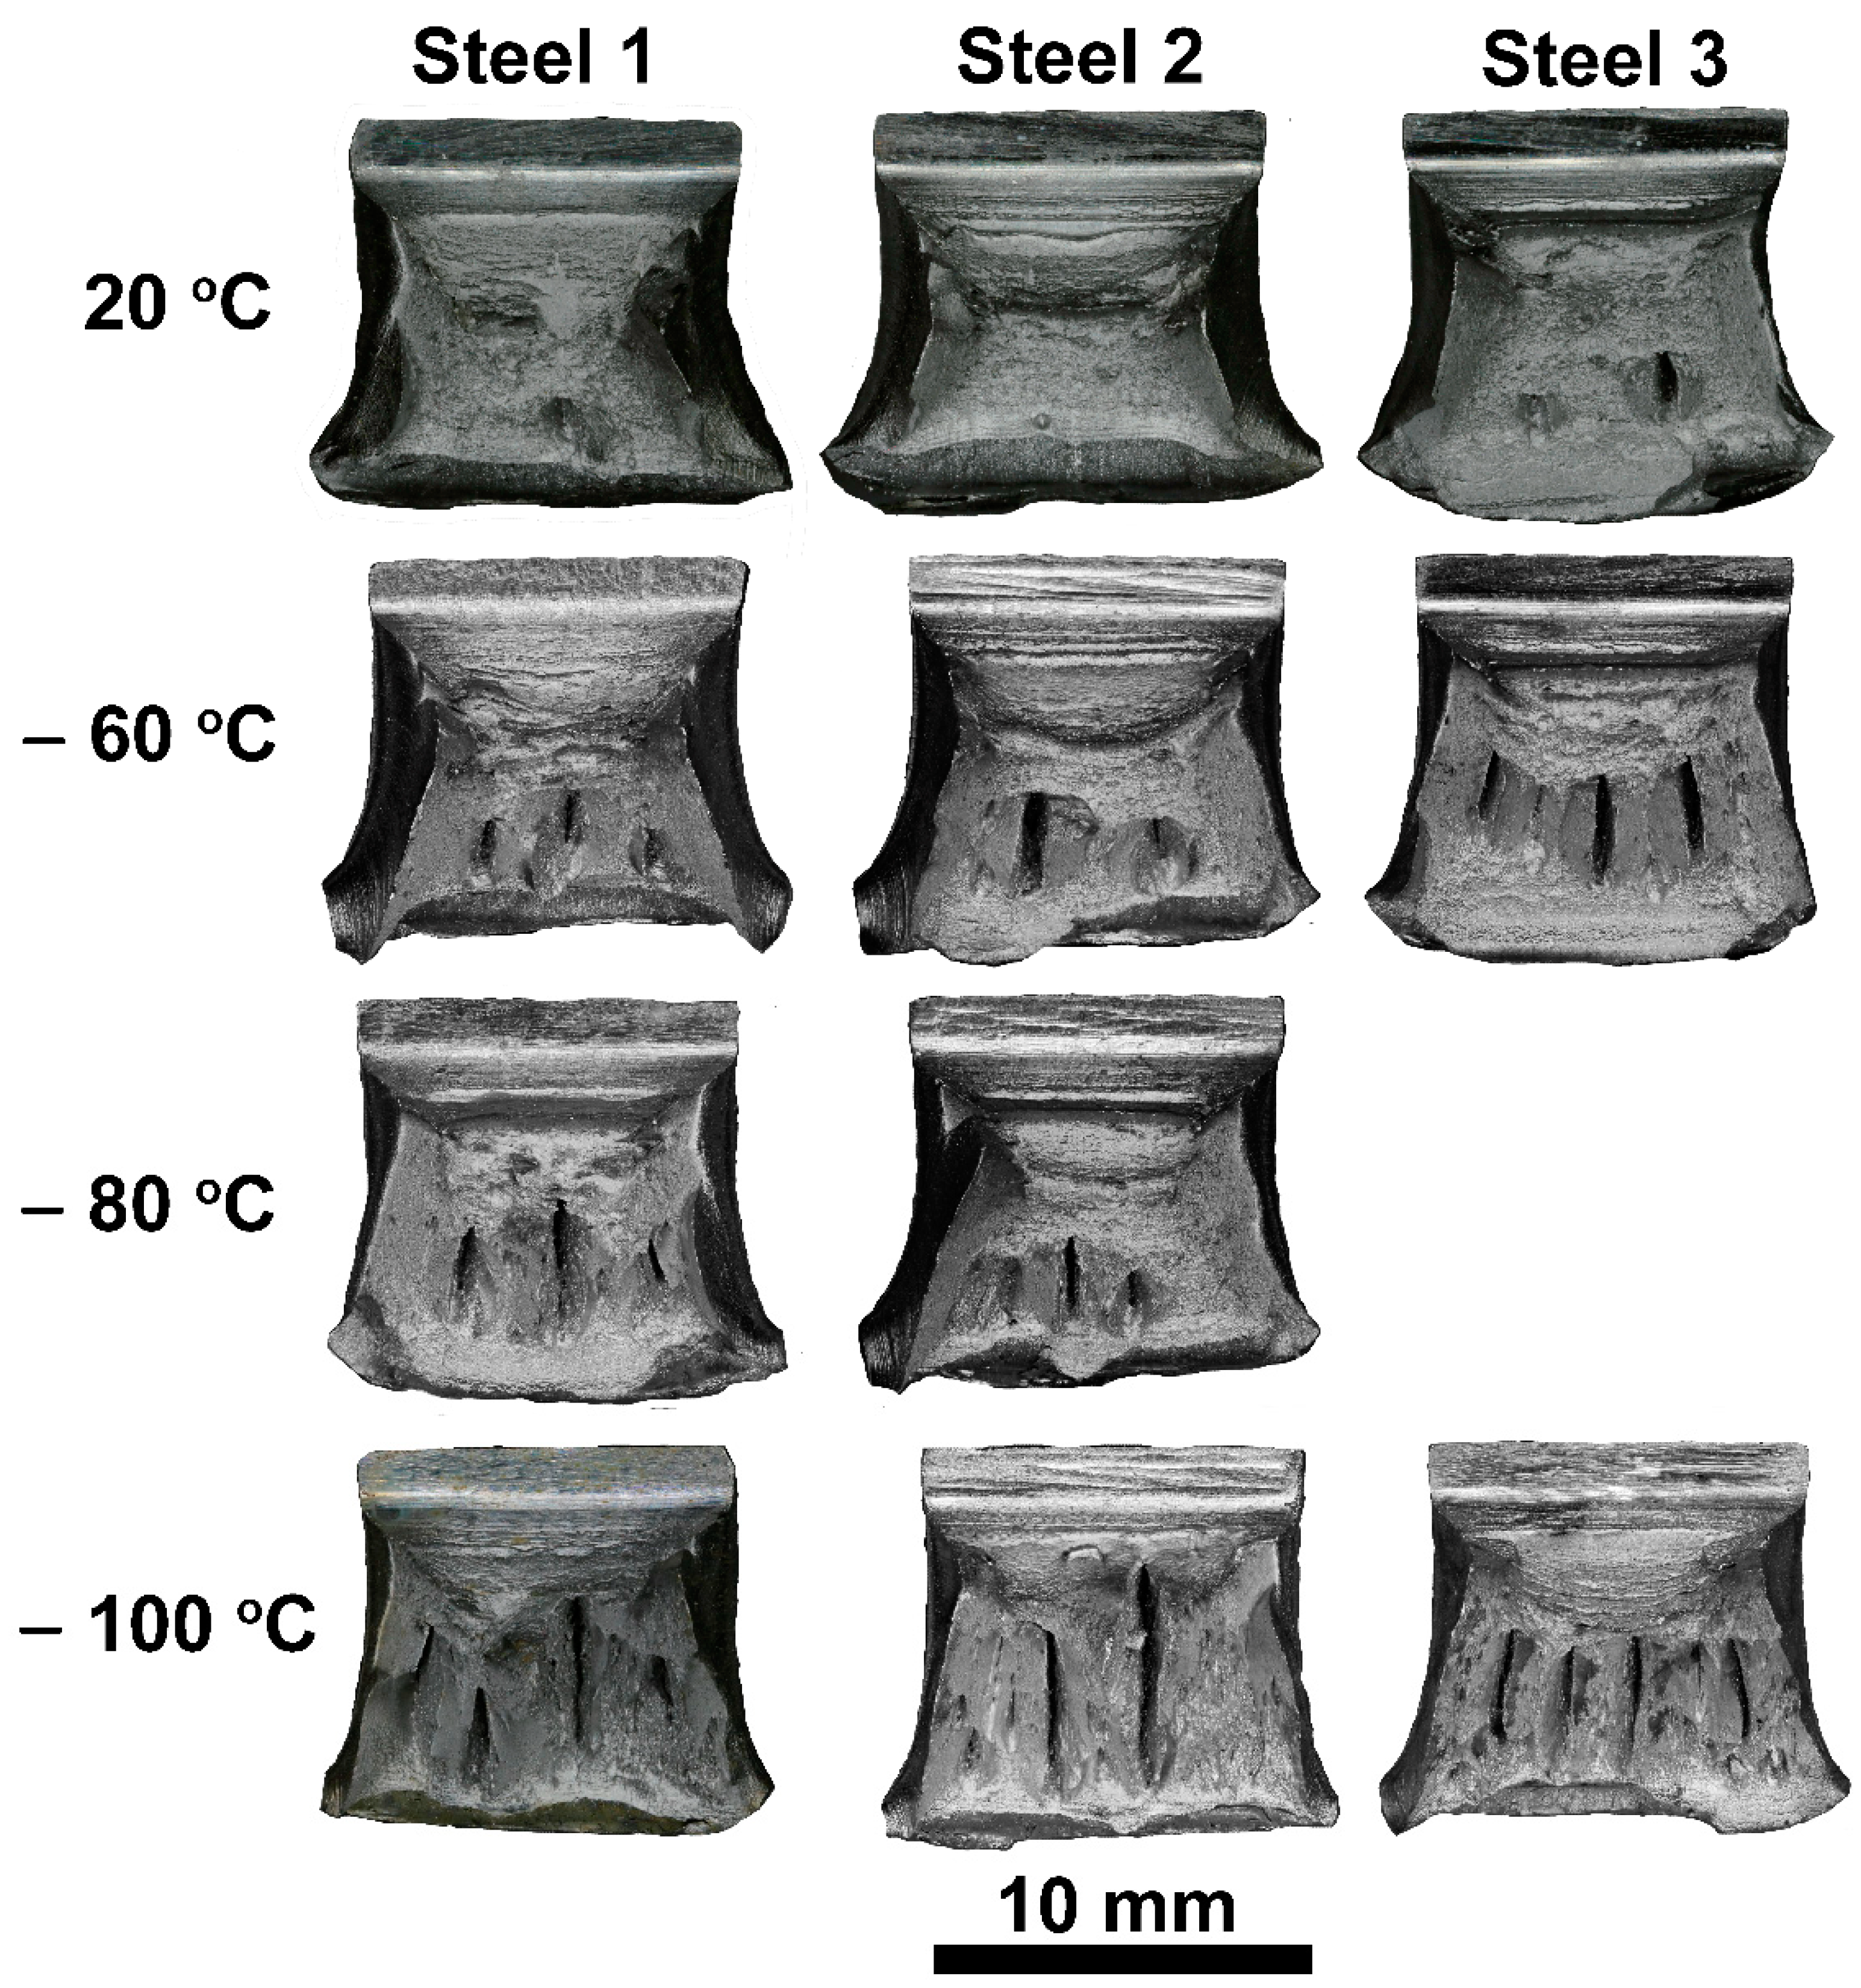
Fractographic analysis was used to study the plasticity of steels and the structure of fractures with splits. Characteristic fracture surface macroscopic images for specimens tested in the whole temperature range are represented in
Figure 4.
The samples of the three steels underwent significant lateral contraction and broadening in the entire temperature range under consideration. These effects evidence the large amount of expended plastic deformation. According to the criteria of microfractographic analysis, there is a ductile fracture of all specimens, accompanied by different levels of split severity. The fractures of the studied steels at 20 °C show the greatest fraction of shear area. In addition, small, randomly located splits may be observed near the affected by the impact of striker specimen regions. Such fracture surfaces appeared in 3 of 20 cases for steel 1, in 4 of 20 cases for steel 3, and in 7 of 20 cases for steel 3. General strain is decreased in the temperature range from −60 °C to −100 °C. This is evident from the formation of narrower shear lips. Multiple periodically located split formations in all specimens are observed. In contrast to the regularity in the arrangement of splits observed in [
15], the localization of splits in our specimens appears to be less regular. Apparently, these observations are a special case due to the precision production of an individual specimen. The split populations are located closer to the incision with decreasing test temperature, which indicates their occurrence at an earlier stage of fracture. The number of splits increases, and their length increases. This phenomenon is especially pronounced at −100 °C. We conclude that, as the test temperature decreases, the susceptibility of split formation increases. It should be noted that steel 3 exhibits the greatest tendency to split. It is worth noting that some brittle tilted fracture regions along with the splits can also appear in the temperature range below −60 °C.
From a phenomenological point of view, splits are visual indicators of stress concentration locations. Splits reveal the inhomogeneity of the stress–strain state in the fracture region. Compared with the surrounding material volumes, the locations of splits have the lowest ductility. Before the formation of splits, the volume of this region undergoes significant local plastic deformation, reaching a value of material ultimate plasticity in the transverse direction of the steel sheet (T-L specimens). Ultimate plasticity is understood as the local value of plastic deformation before crack formation [
29].
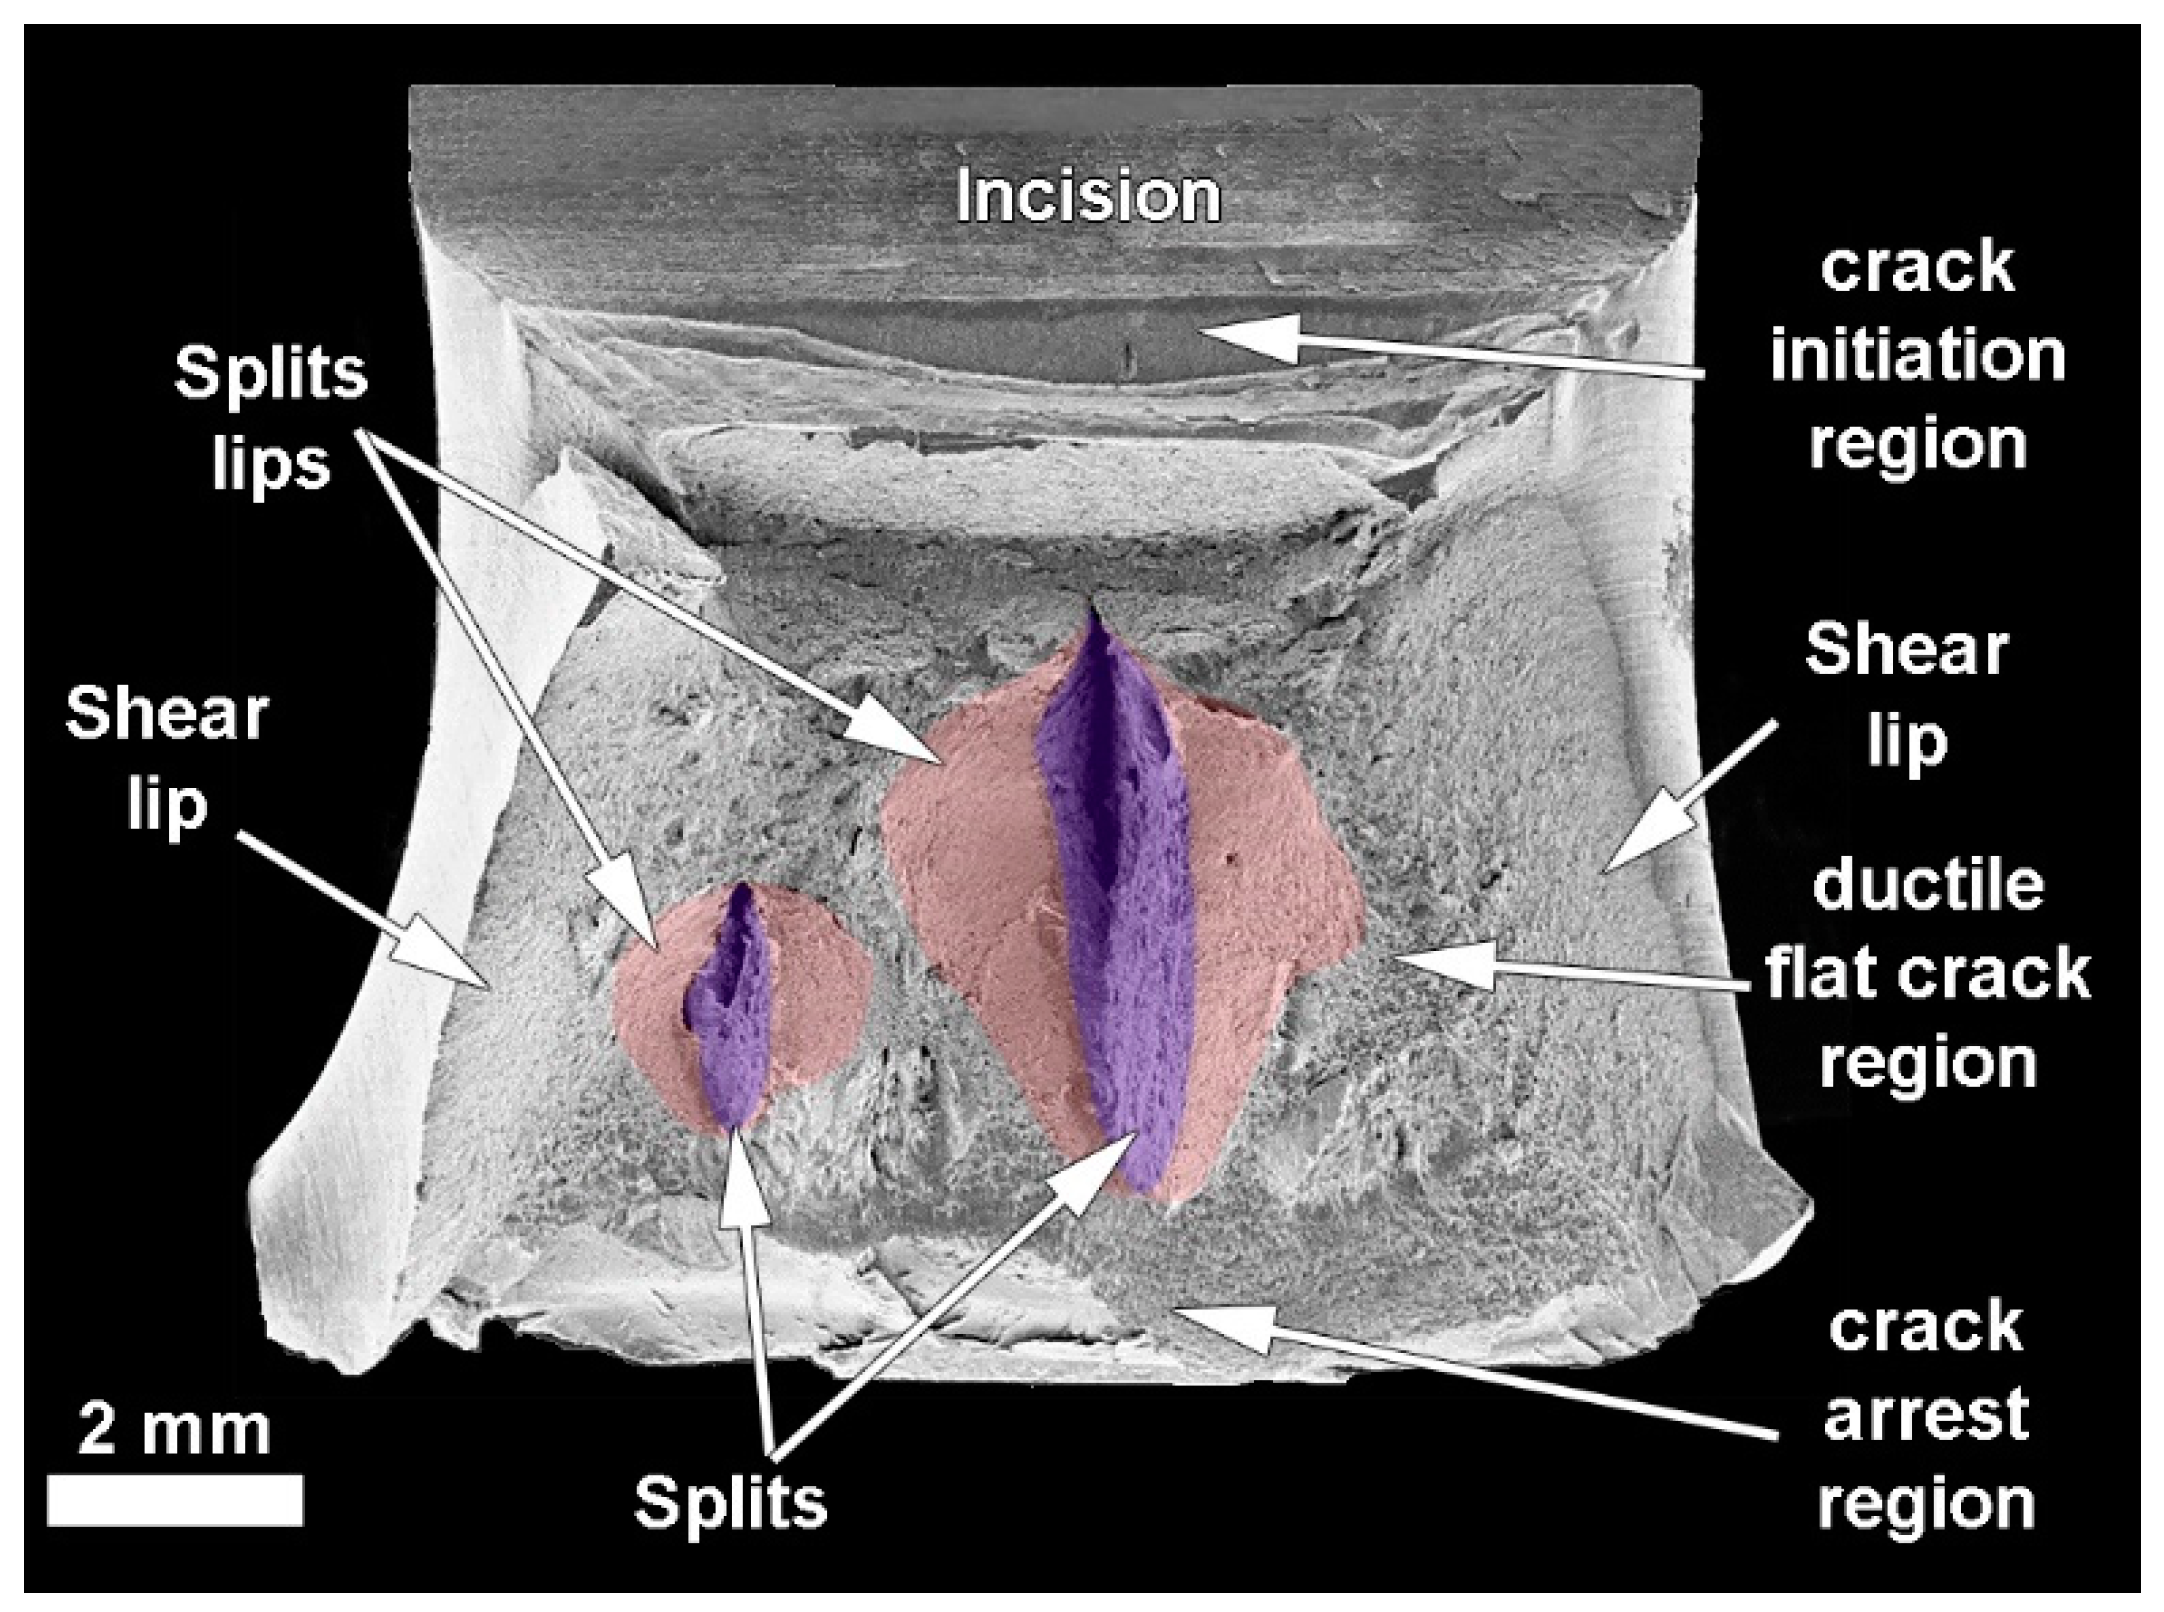
A characteristic fracture with the appearance of splits is shown in
Figure 5.
The represented specimen feature is the formation of both relatively narrow ductile crack initiation and ductile crack arrest regions, relatively wide shear lips on the sample sides, and a vast homogeneous flat ductile fracture region in the central part of fracture surface. The splitting area can be divided into the inner part of the split formed by cleavage mechanism and the outer part of the split—the lips—formed by a shear with a characteristic dimpled pattern of the fracture surface. The outer part of the split—the lips—is also called the region of split influence or relaxation region (
Figure 2).
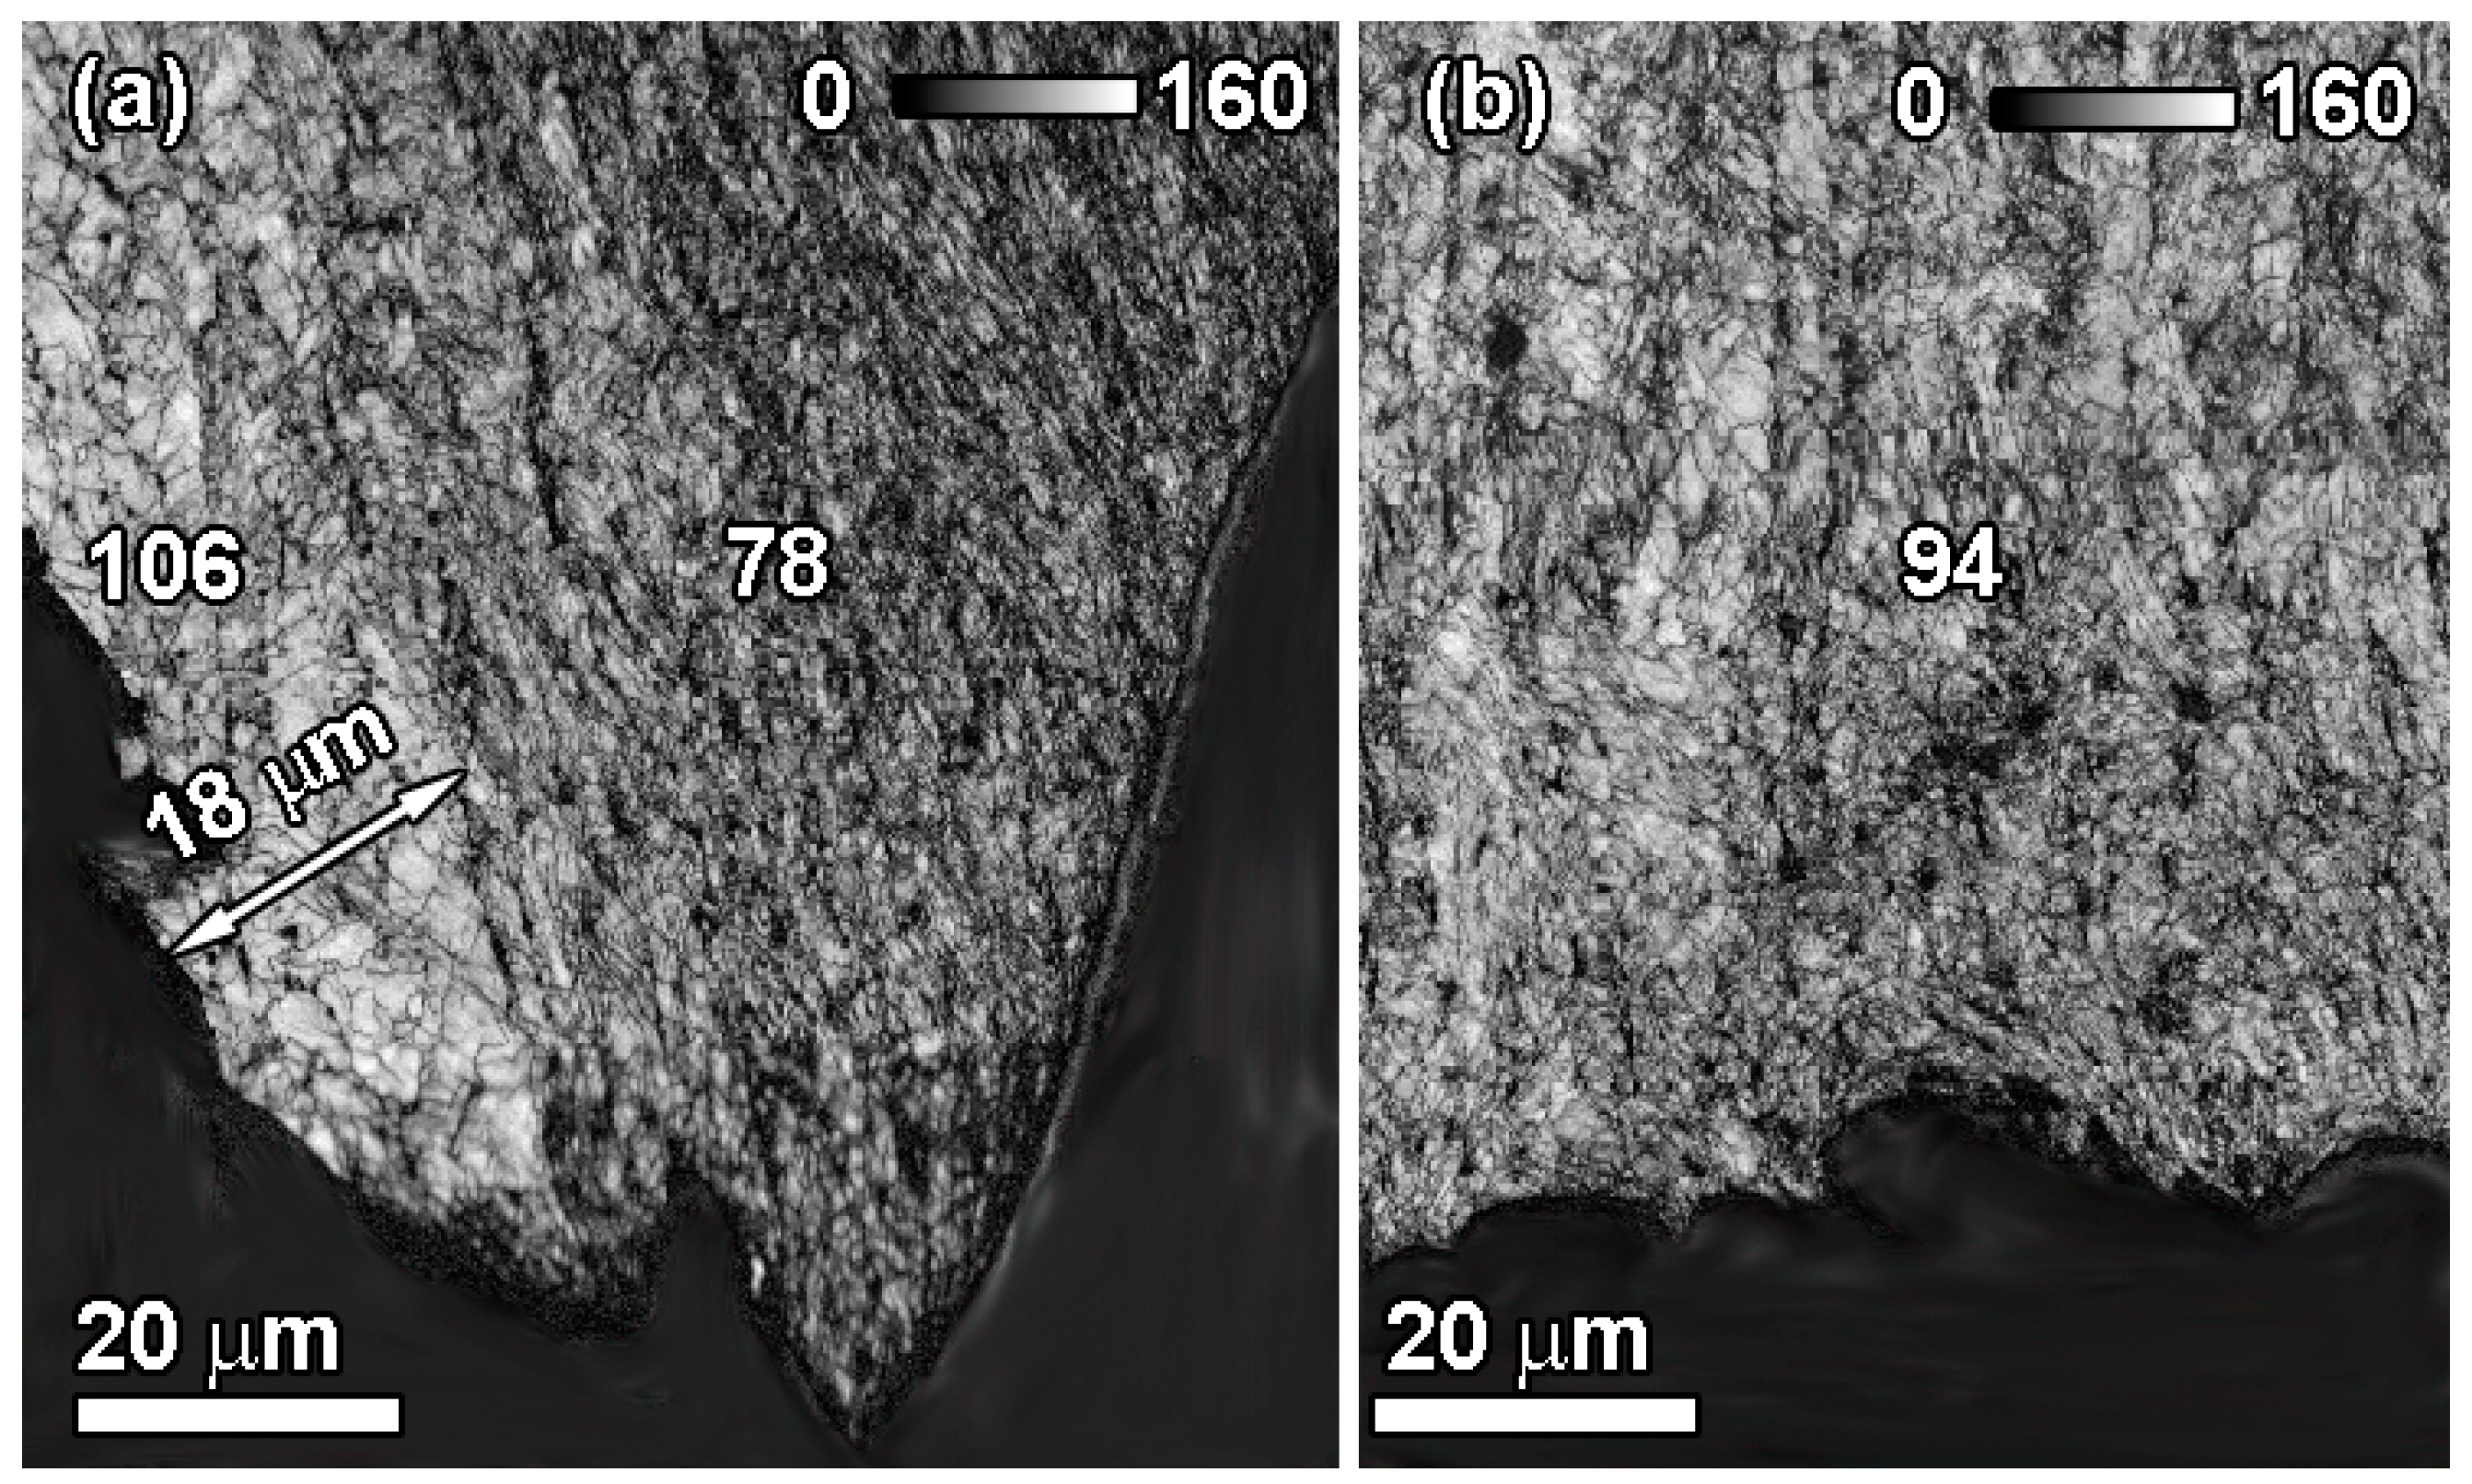
Figure 6 shows electron backscatter diffraction (EBSD) maps from different regions of the plastic zone under the fracture surface of a steel 1 specimen’s transverse section. This specimen was impact fractured at −60 °C.
The EBSD technique was used to study the local degree of the materials’ plastic deformation [
30]. EBSD is tailored for the determination of local lattice distortions’ characterization with high accuracy on the base of electron backscatter patterns analysis in each point of a map. The measure of local plastic strain is the value of the band contrast (BC) parameter. The more distorted the crystal lattice is, the lower the BC value. Unlike the plastic zone adjacent to the cleavage fracture, the metal of the plastic zone adjacent to the ductile fracture surface is strongly deformed [
31]. The least deformed microstructure was observed in the local plastic zone near the internal surface of the split formed by the cleavage (
Figure 6a, left side). The grain shape, in this case, remained almost unchanged in comparison with the initial microstructure. The depth of this area in the represented specimen section was 18 microns. The average value of BC was 106. The most deformed plastic zone microstructure was observed in the region of the outer surface of the wing of the split (
Figure 6a, right side). We can judge about the high degree of plastic deformation by a highly elongated strongly refined microstructure. The average value of the BC was 78, which is 36% less than in the first case. The depth of such an area was 3–4 times higher than the first one. In the case of a bottom crack (
Figure 6b), despite the distorted elongated microstructure, the local plastic deformation degree in the plastic zone under the ductile fracture surface was intermediate. Mean BC was 94 for the present case. Thus, the EBSD application helped to establish the non-uniformity of the plastic zone under the fracture surface of Charpy U-notched specimens with splits.
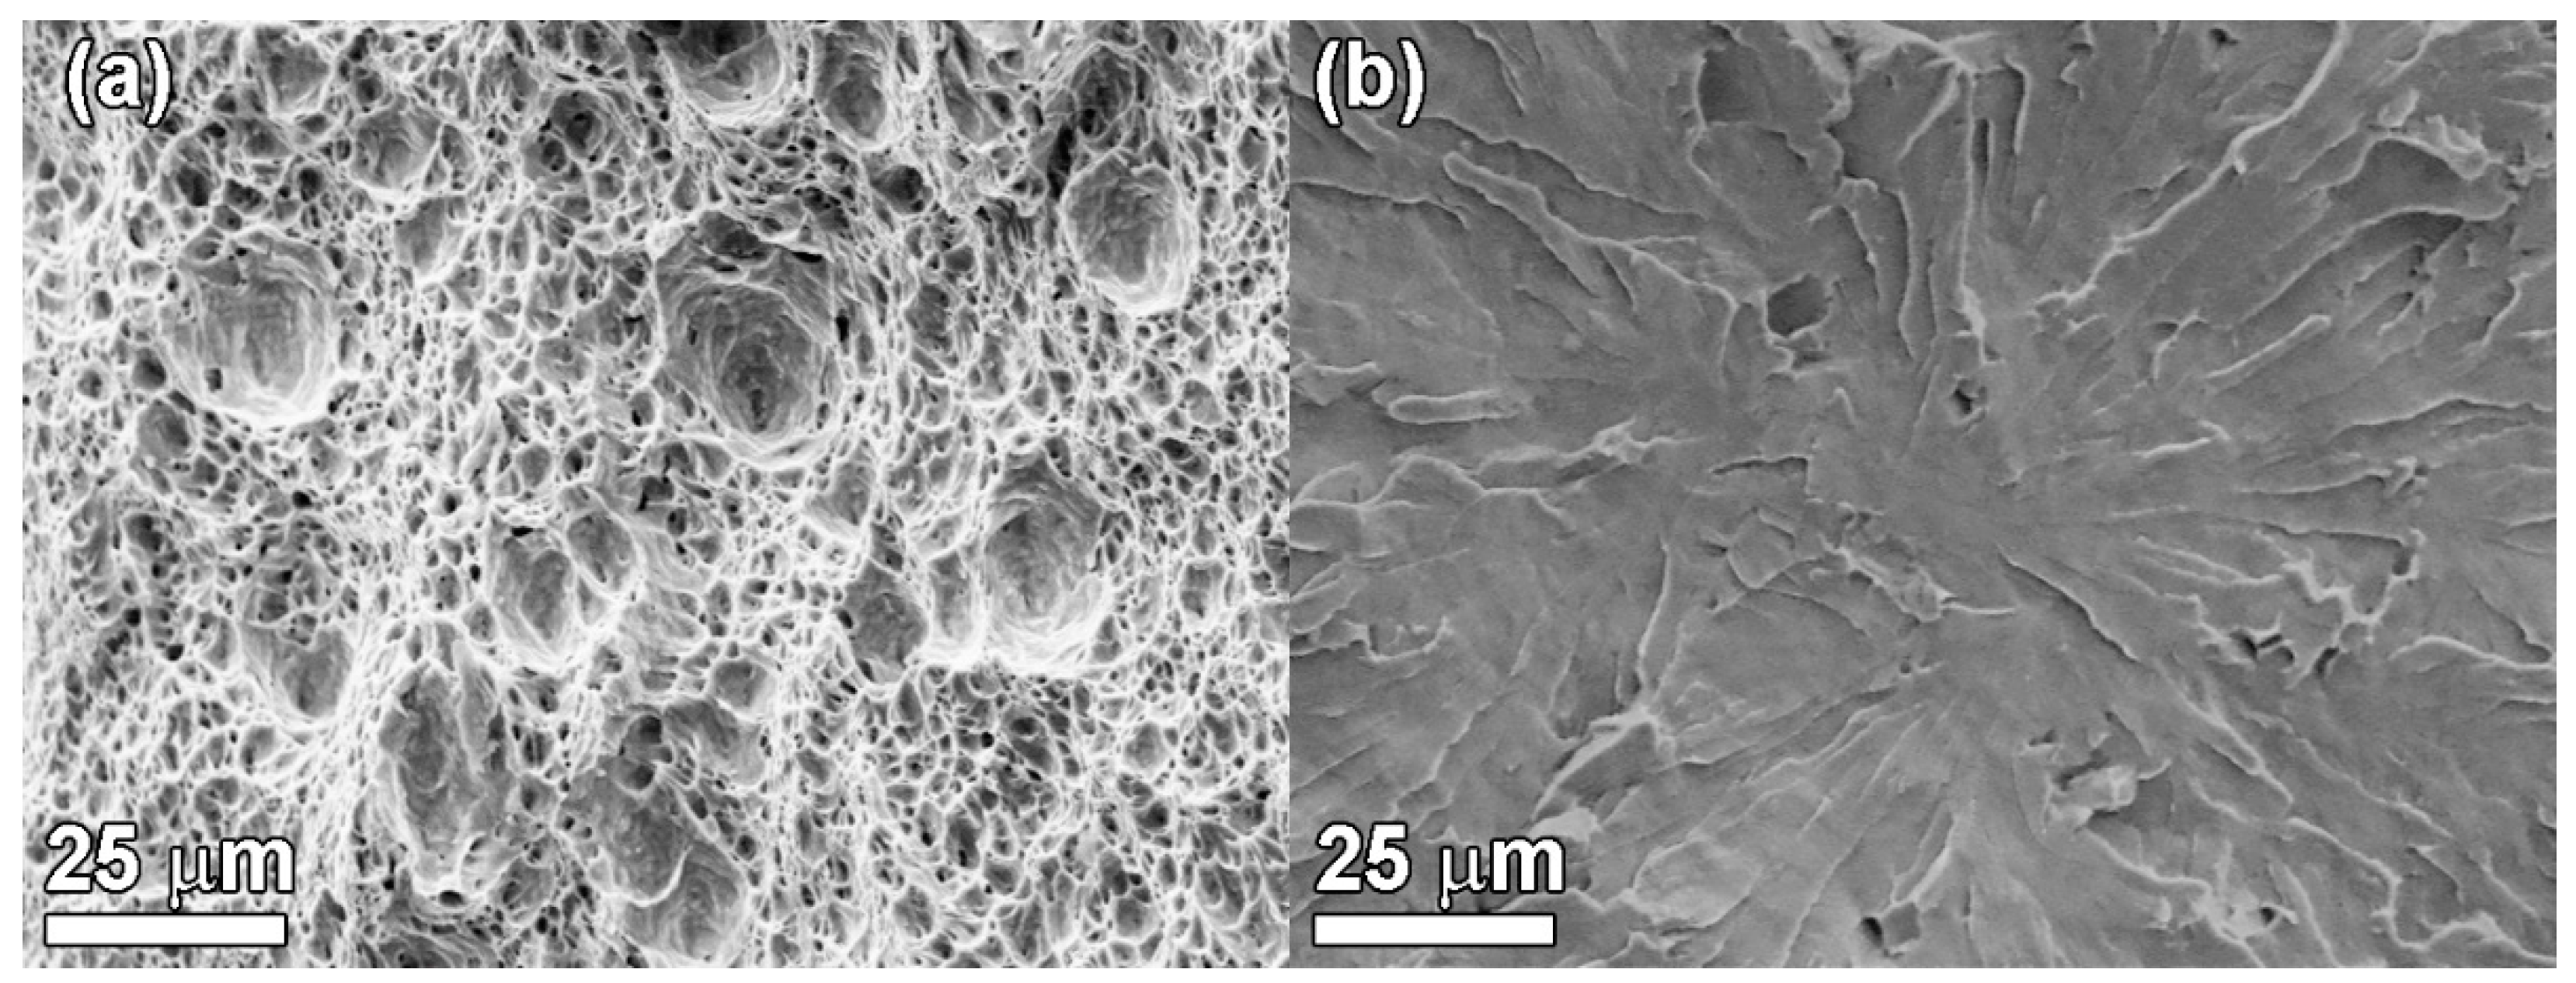
A microfractographic study of the specimen fracture behavior with splits revealed the following features (
Figure 7).
The ductile fracture mechanism action can be seen by the formation of a dimpled pattern on the fracture surfaces (
Figure 7a). This type of failure is characteristic for the shear lips, for a flat bottom crack, as well as for the outer split lips’ surfaces. The splits’ disclosure can help to reveal their brittle nature. For the studied steels, a facet or several cleavage facets are found in the splitting initiation zone (
Figure 7b). The cleavage fracture propagation during the split development is accompanied by the characteristic river pattern formation, secondary cleavage microcracks, and some dimpled ductile fractured regions.
From macro-, microfractographic and EBSD studies, taking into account the uneven local plastic deformation distribution in the fracture plastic zone, it can be assumed that the main part of the fracture area formation occurs by a ductile mechanism. The splitting crack formation occurs by a brittle mechanism but is accompanied by both the splitting shear lips formation, formed by a ductile fracture mechanism and similar shear lips near the fractured specimen outer surface.
Figure 8,
Figure 9 and
Figure 10 and
Table 4 show the quantitative fractographic analysis results including the characterization of both parts of each impact fractured specimen. We consider the relative lateral contraction Ψ in the narrowest section of the fractured specimen as an expended plastic deformation optimal characteristic during the dynamic loading of high-toughness steels (Equation (1)).
where B is an initial specimen width, and B
1 is specimen width at the narrowest point of fracture surface projection. Ψ is an easily measurable indicator of fractures, which, at the same time, although not strictly, but quite reliably, characterizes the plastic deformation degree that each specimen undergoes during the test.
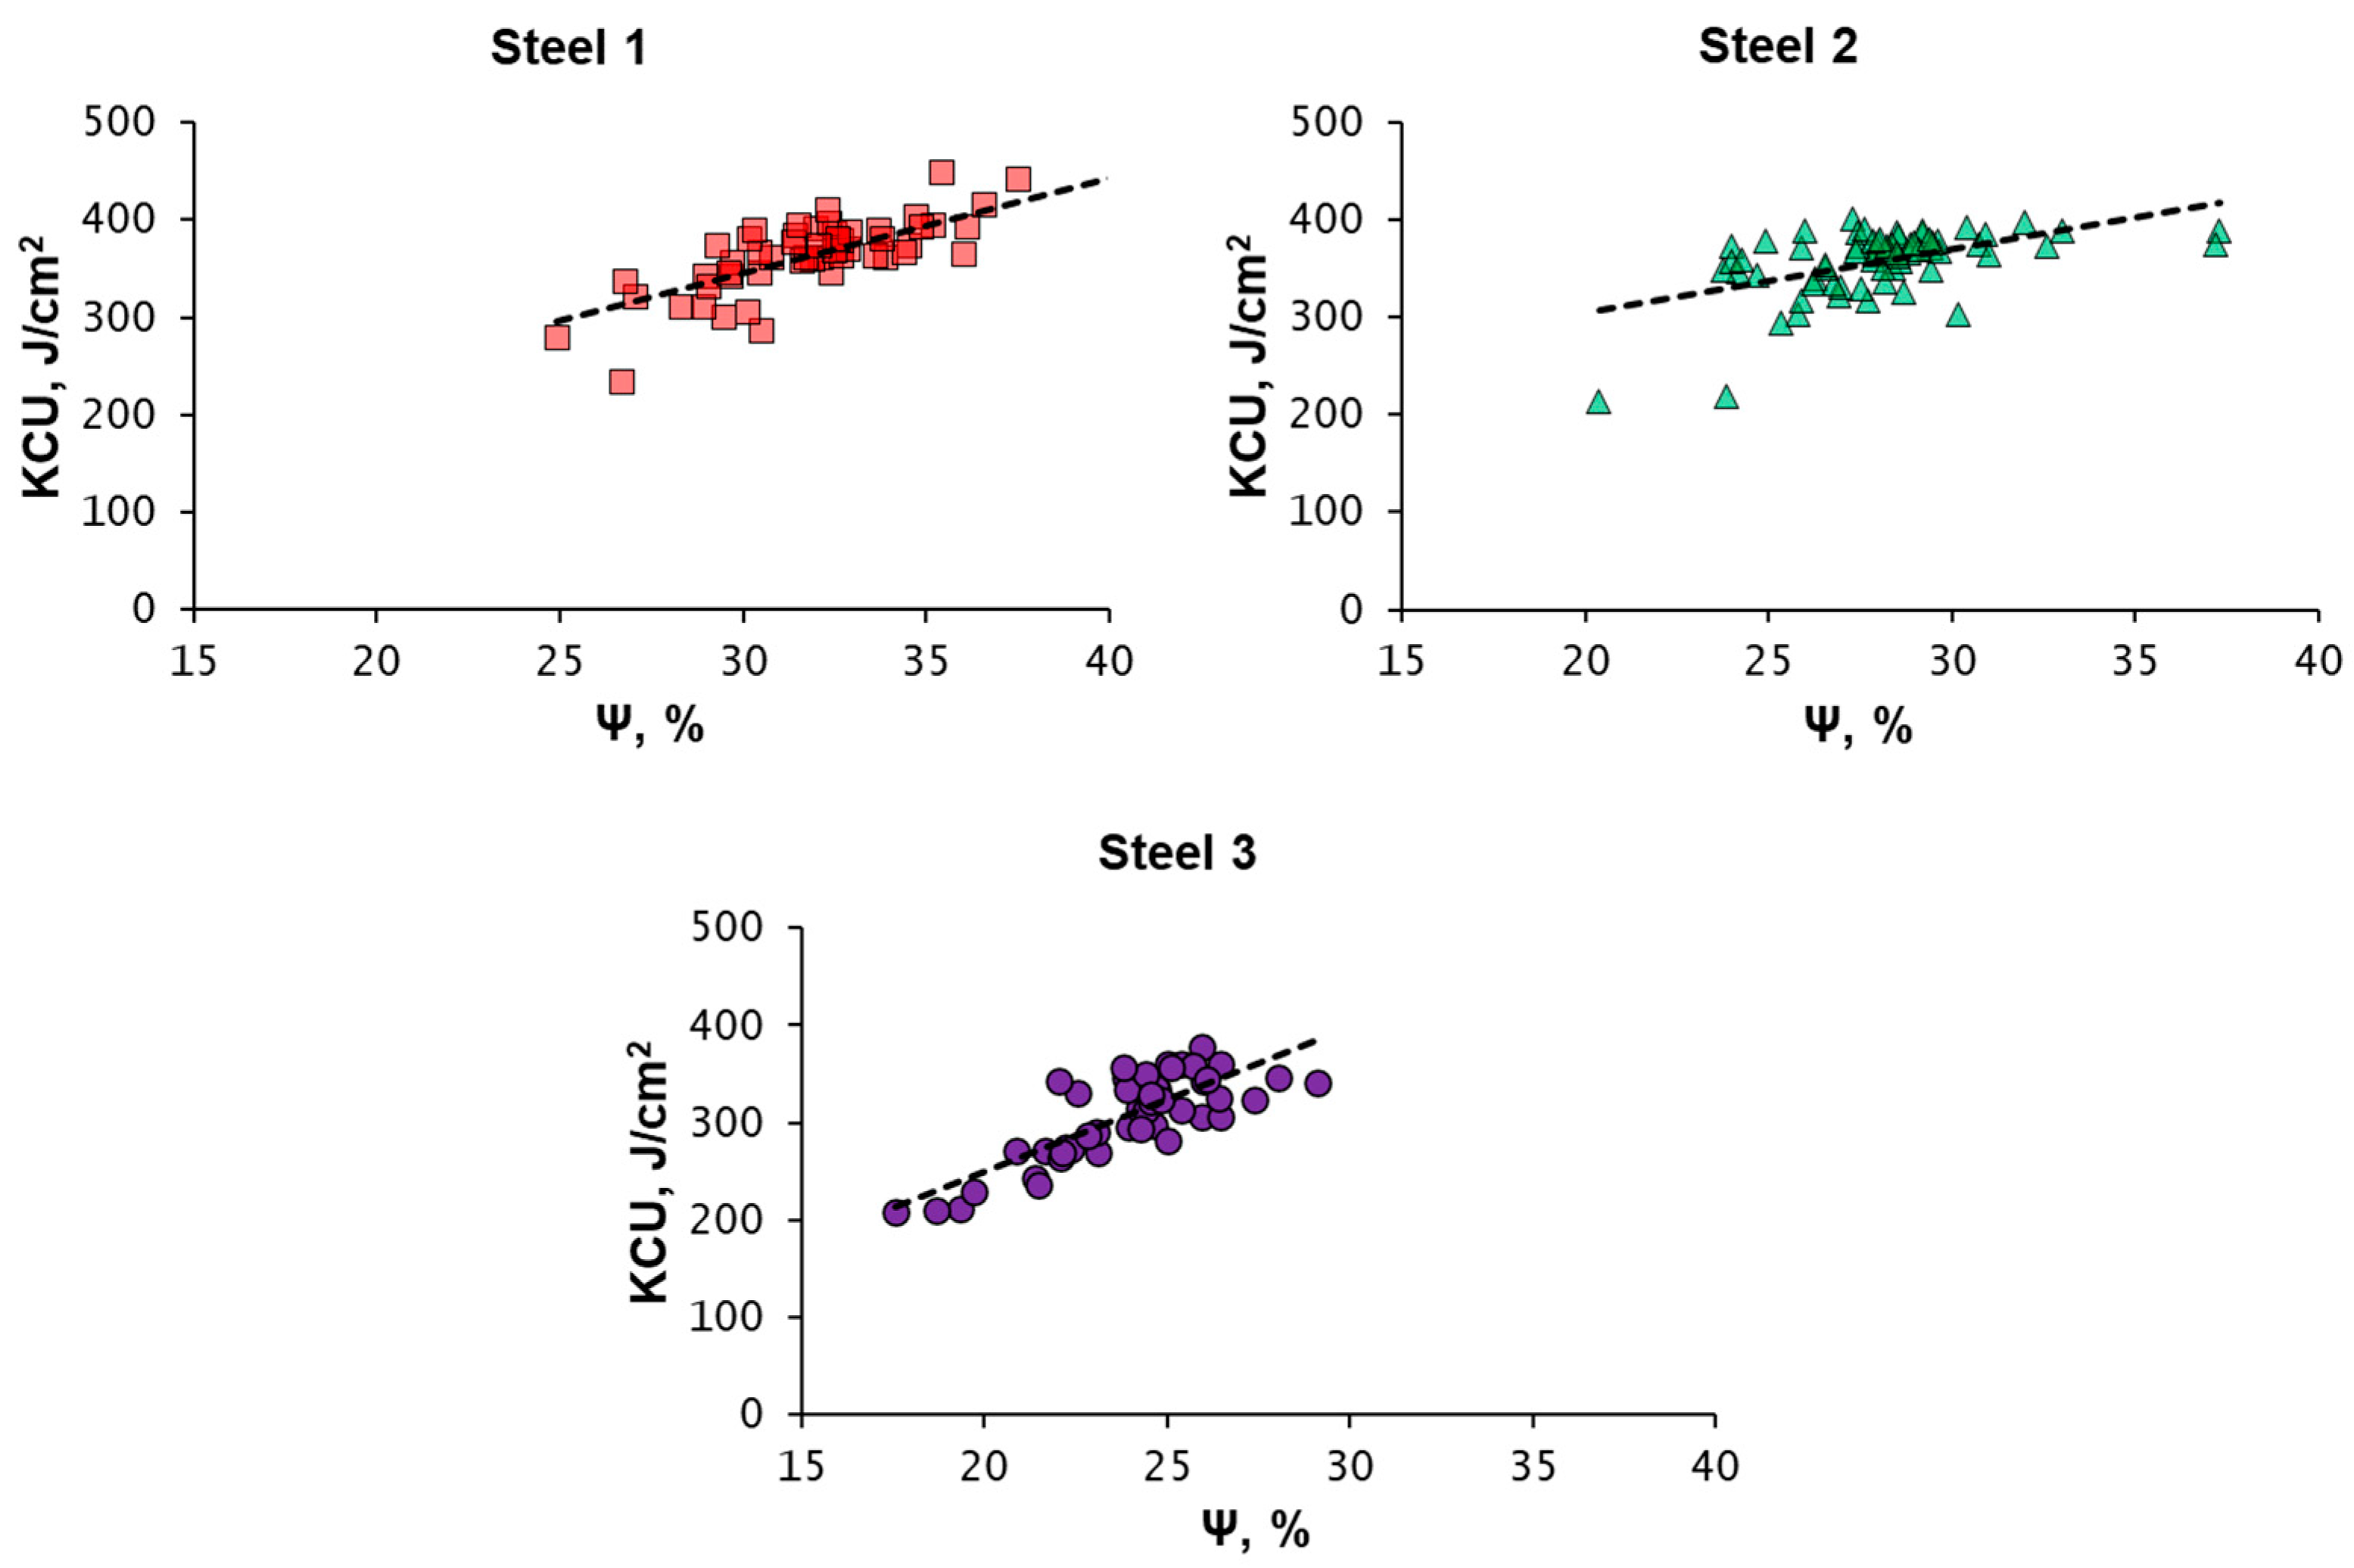
Figure 6 shows the relationship between the relative lateral contraction Ψ and the impact toughness KCU in a summary representation, including all the results obtained at all test temperatures.
The higher the impact toughness, the greater the relative lateral contraction. This dependence is common both for the three studied steels’ specimens as a whole and for each steel separately. Steel 1, the specimens of which have undergone the greatest plastic deformation degree during tests, demonstrates the highest impact toughness values. Among all fractured specimens, one steel 1 specimen, two steel 2 specimens, and six steel 3 specimens showed an impact toughness lower than 250 J/cm2. It is characteristic that these specimens have the lowest relative lateral contraction values in their populations.
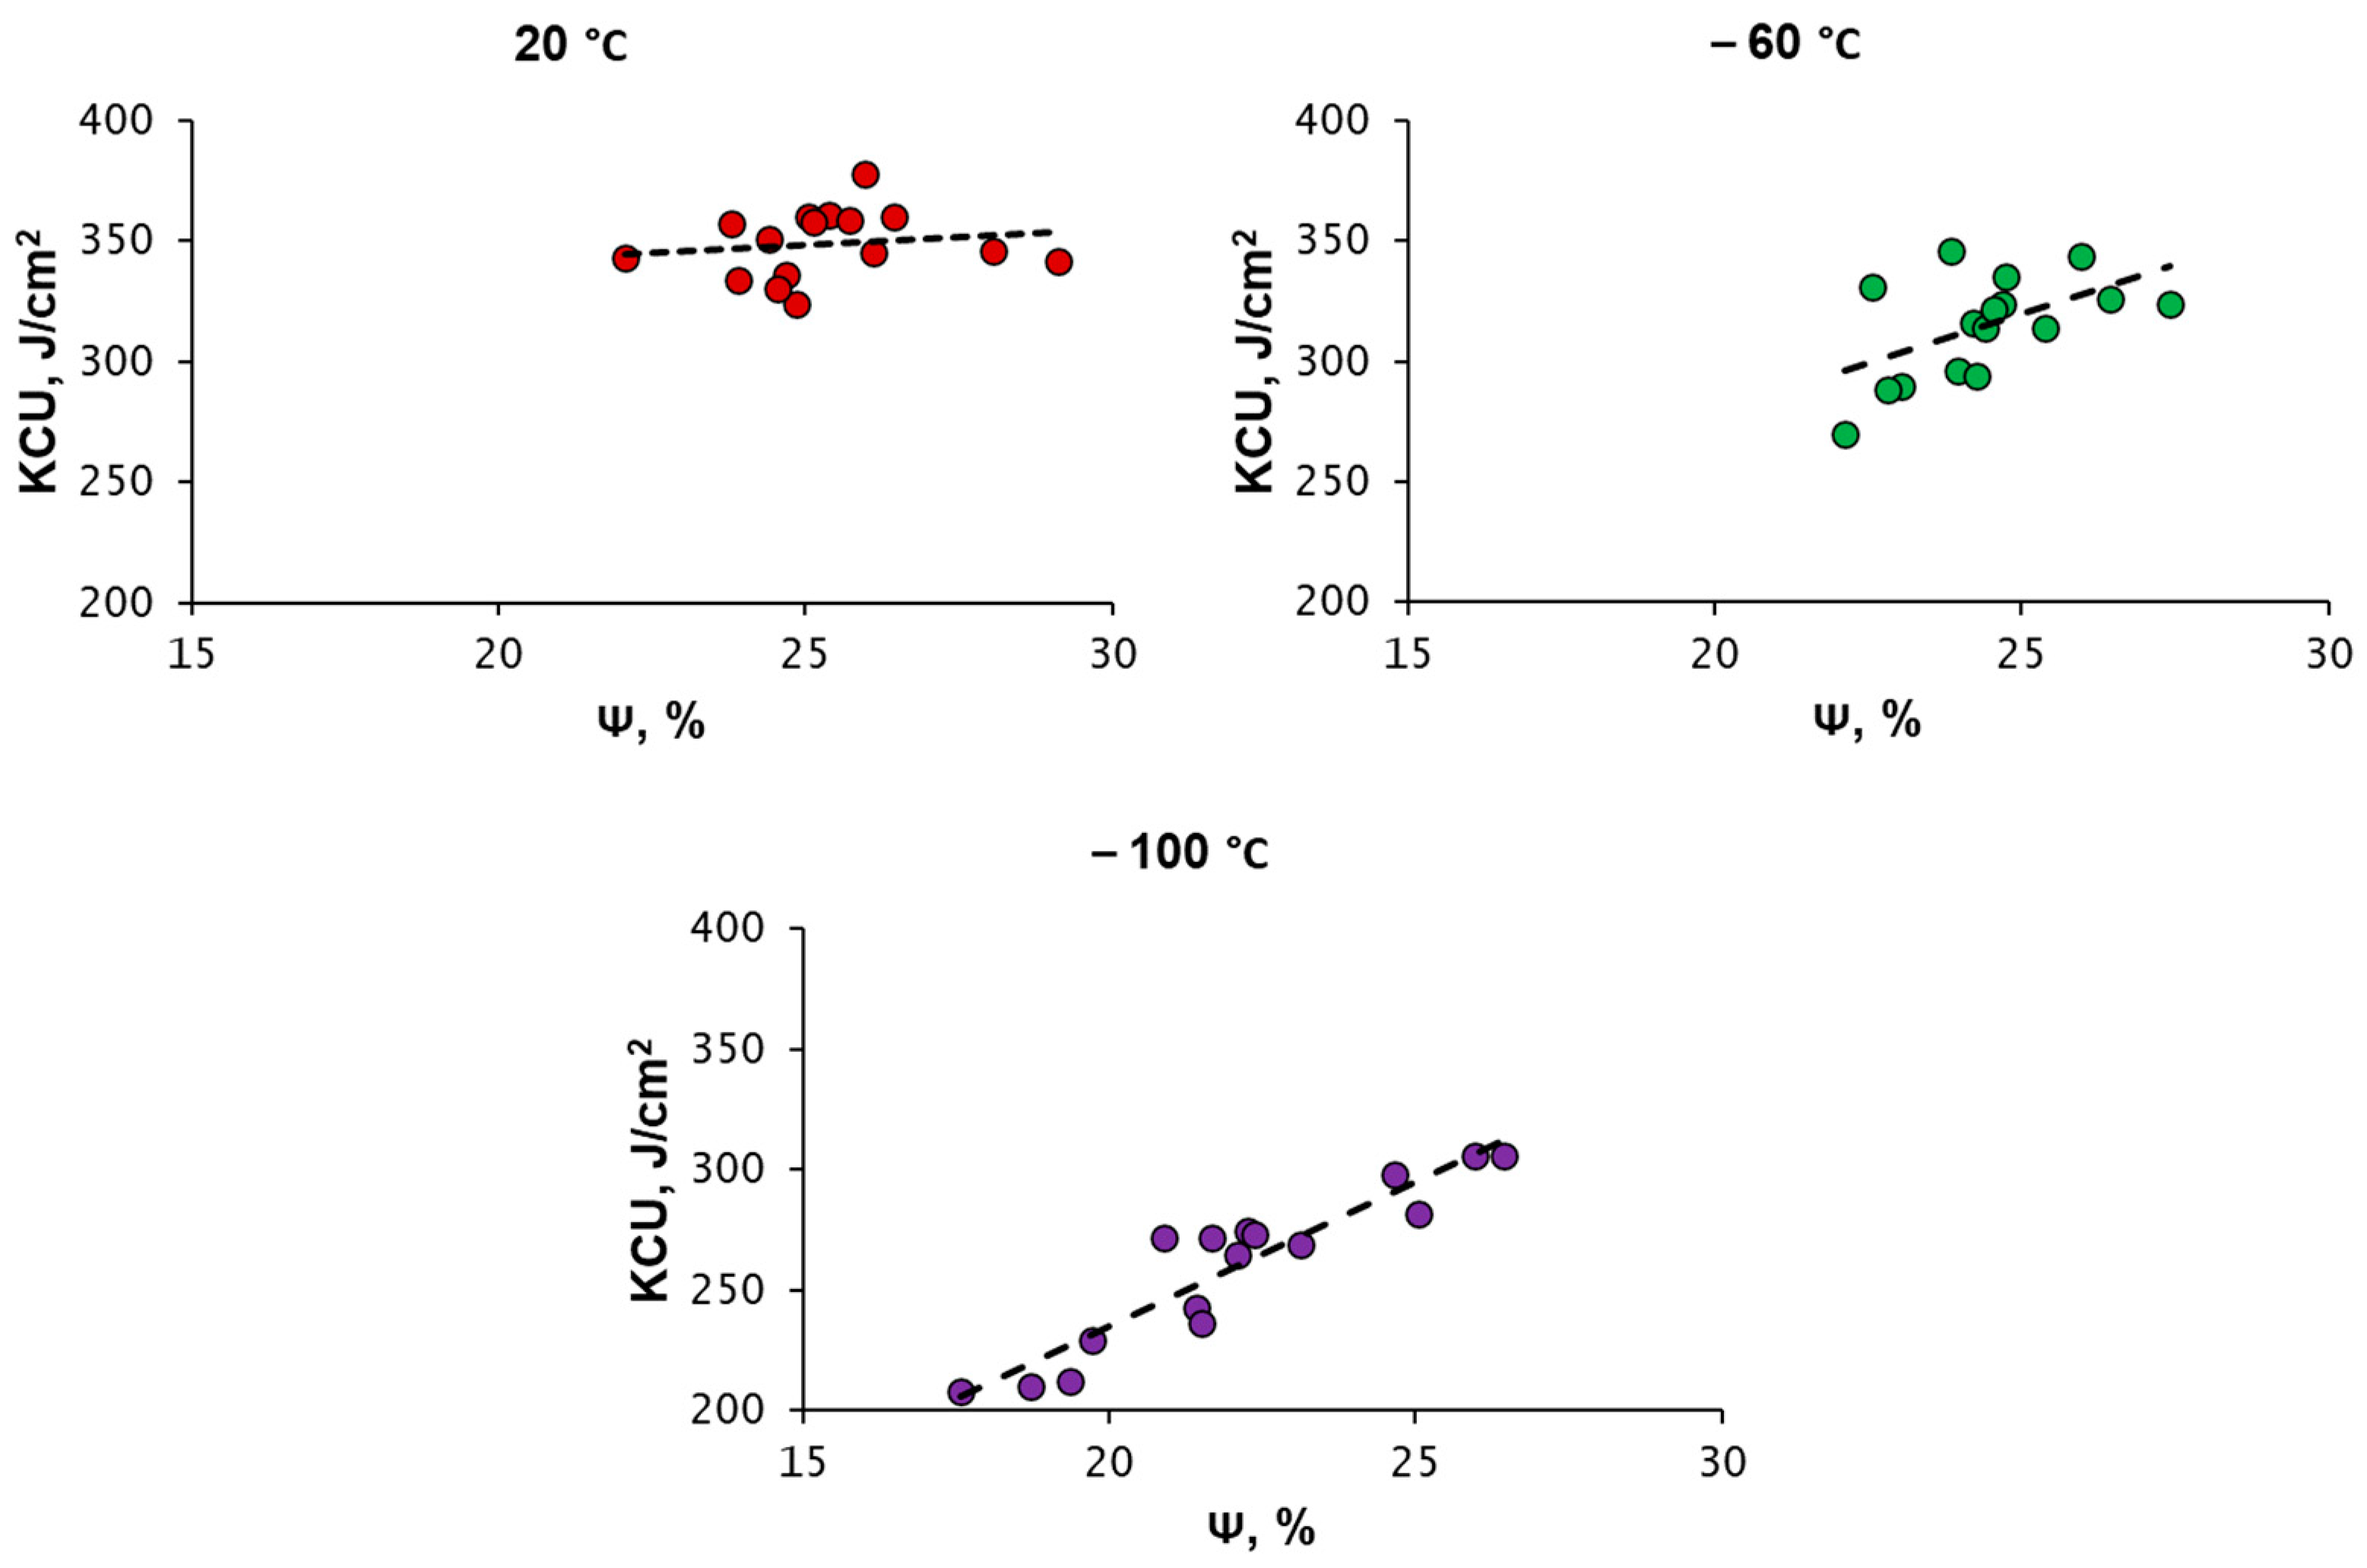
A large amount of experimental data (20 tests per temperature) made it possible to establish the relationship between the relative lateral contraction and the impact toughness at each constant test temperature, which is clearly seen from trend lines in
Figure 9.
The trendlines slope gradually changes as the test temperature decreases from 20 °C to −100 °C for each steel. The lower the temperature, the steeper the slope and the stronger the dependence between the relative lateral contraction and impact toughness values. The correlation between the relative lateral contraction and the impact toughness during multiple Charpy impact tests under the same conditions (at the same temperatures) indicates that the reason for the impact toughness values’ scattering is the local steel plasticity inhomogeneity.
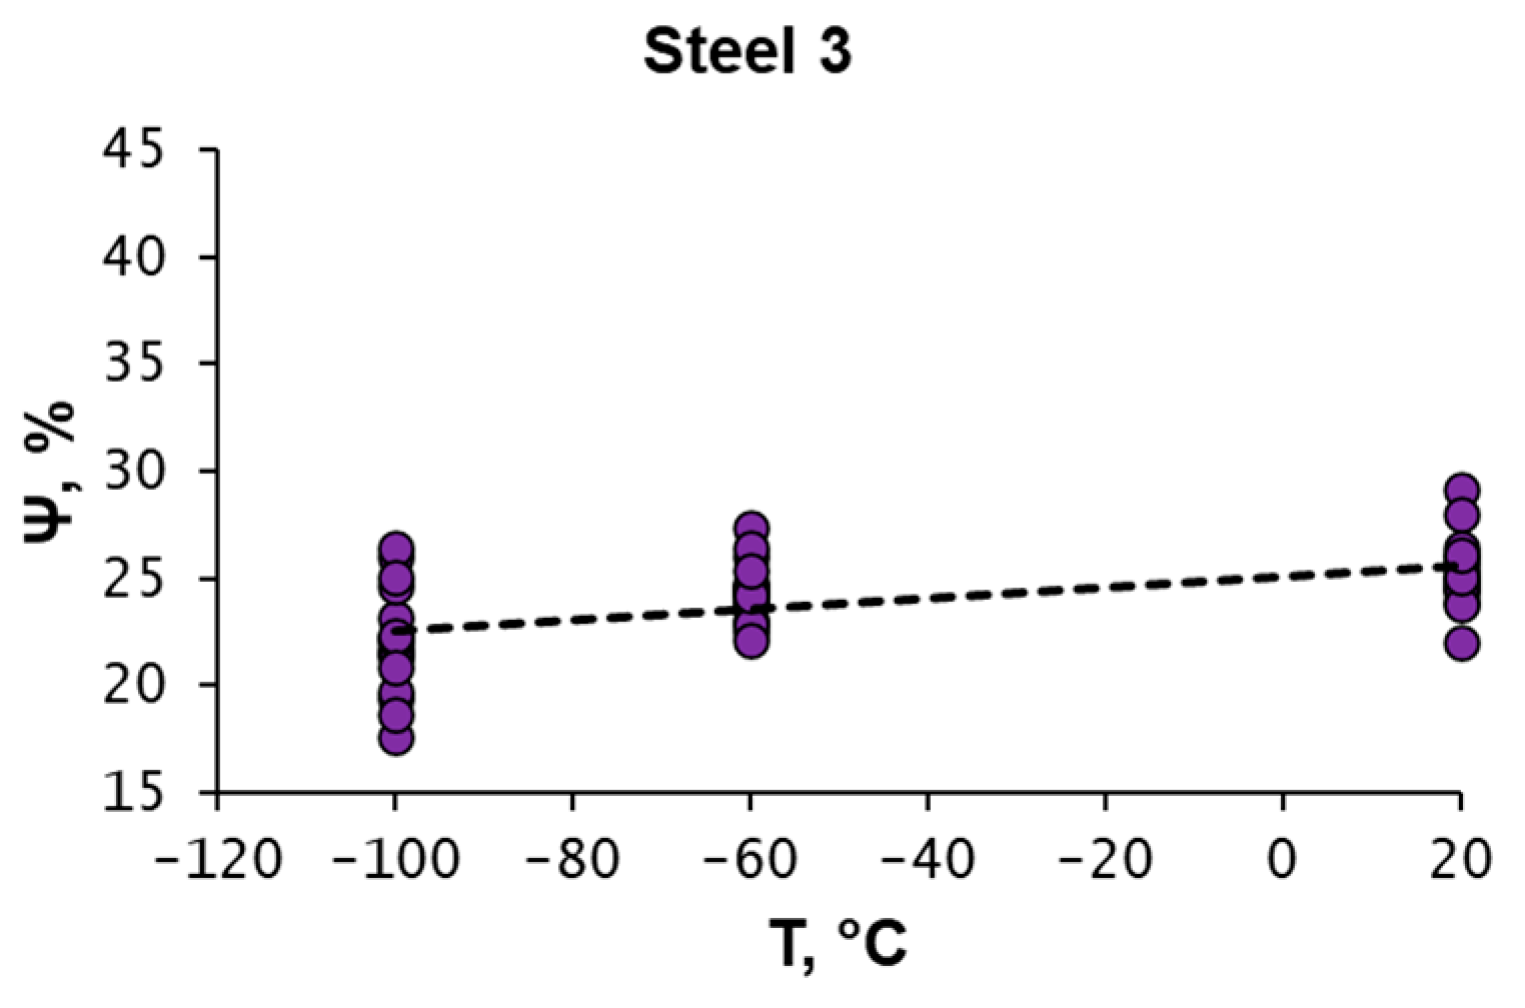
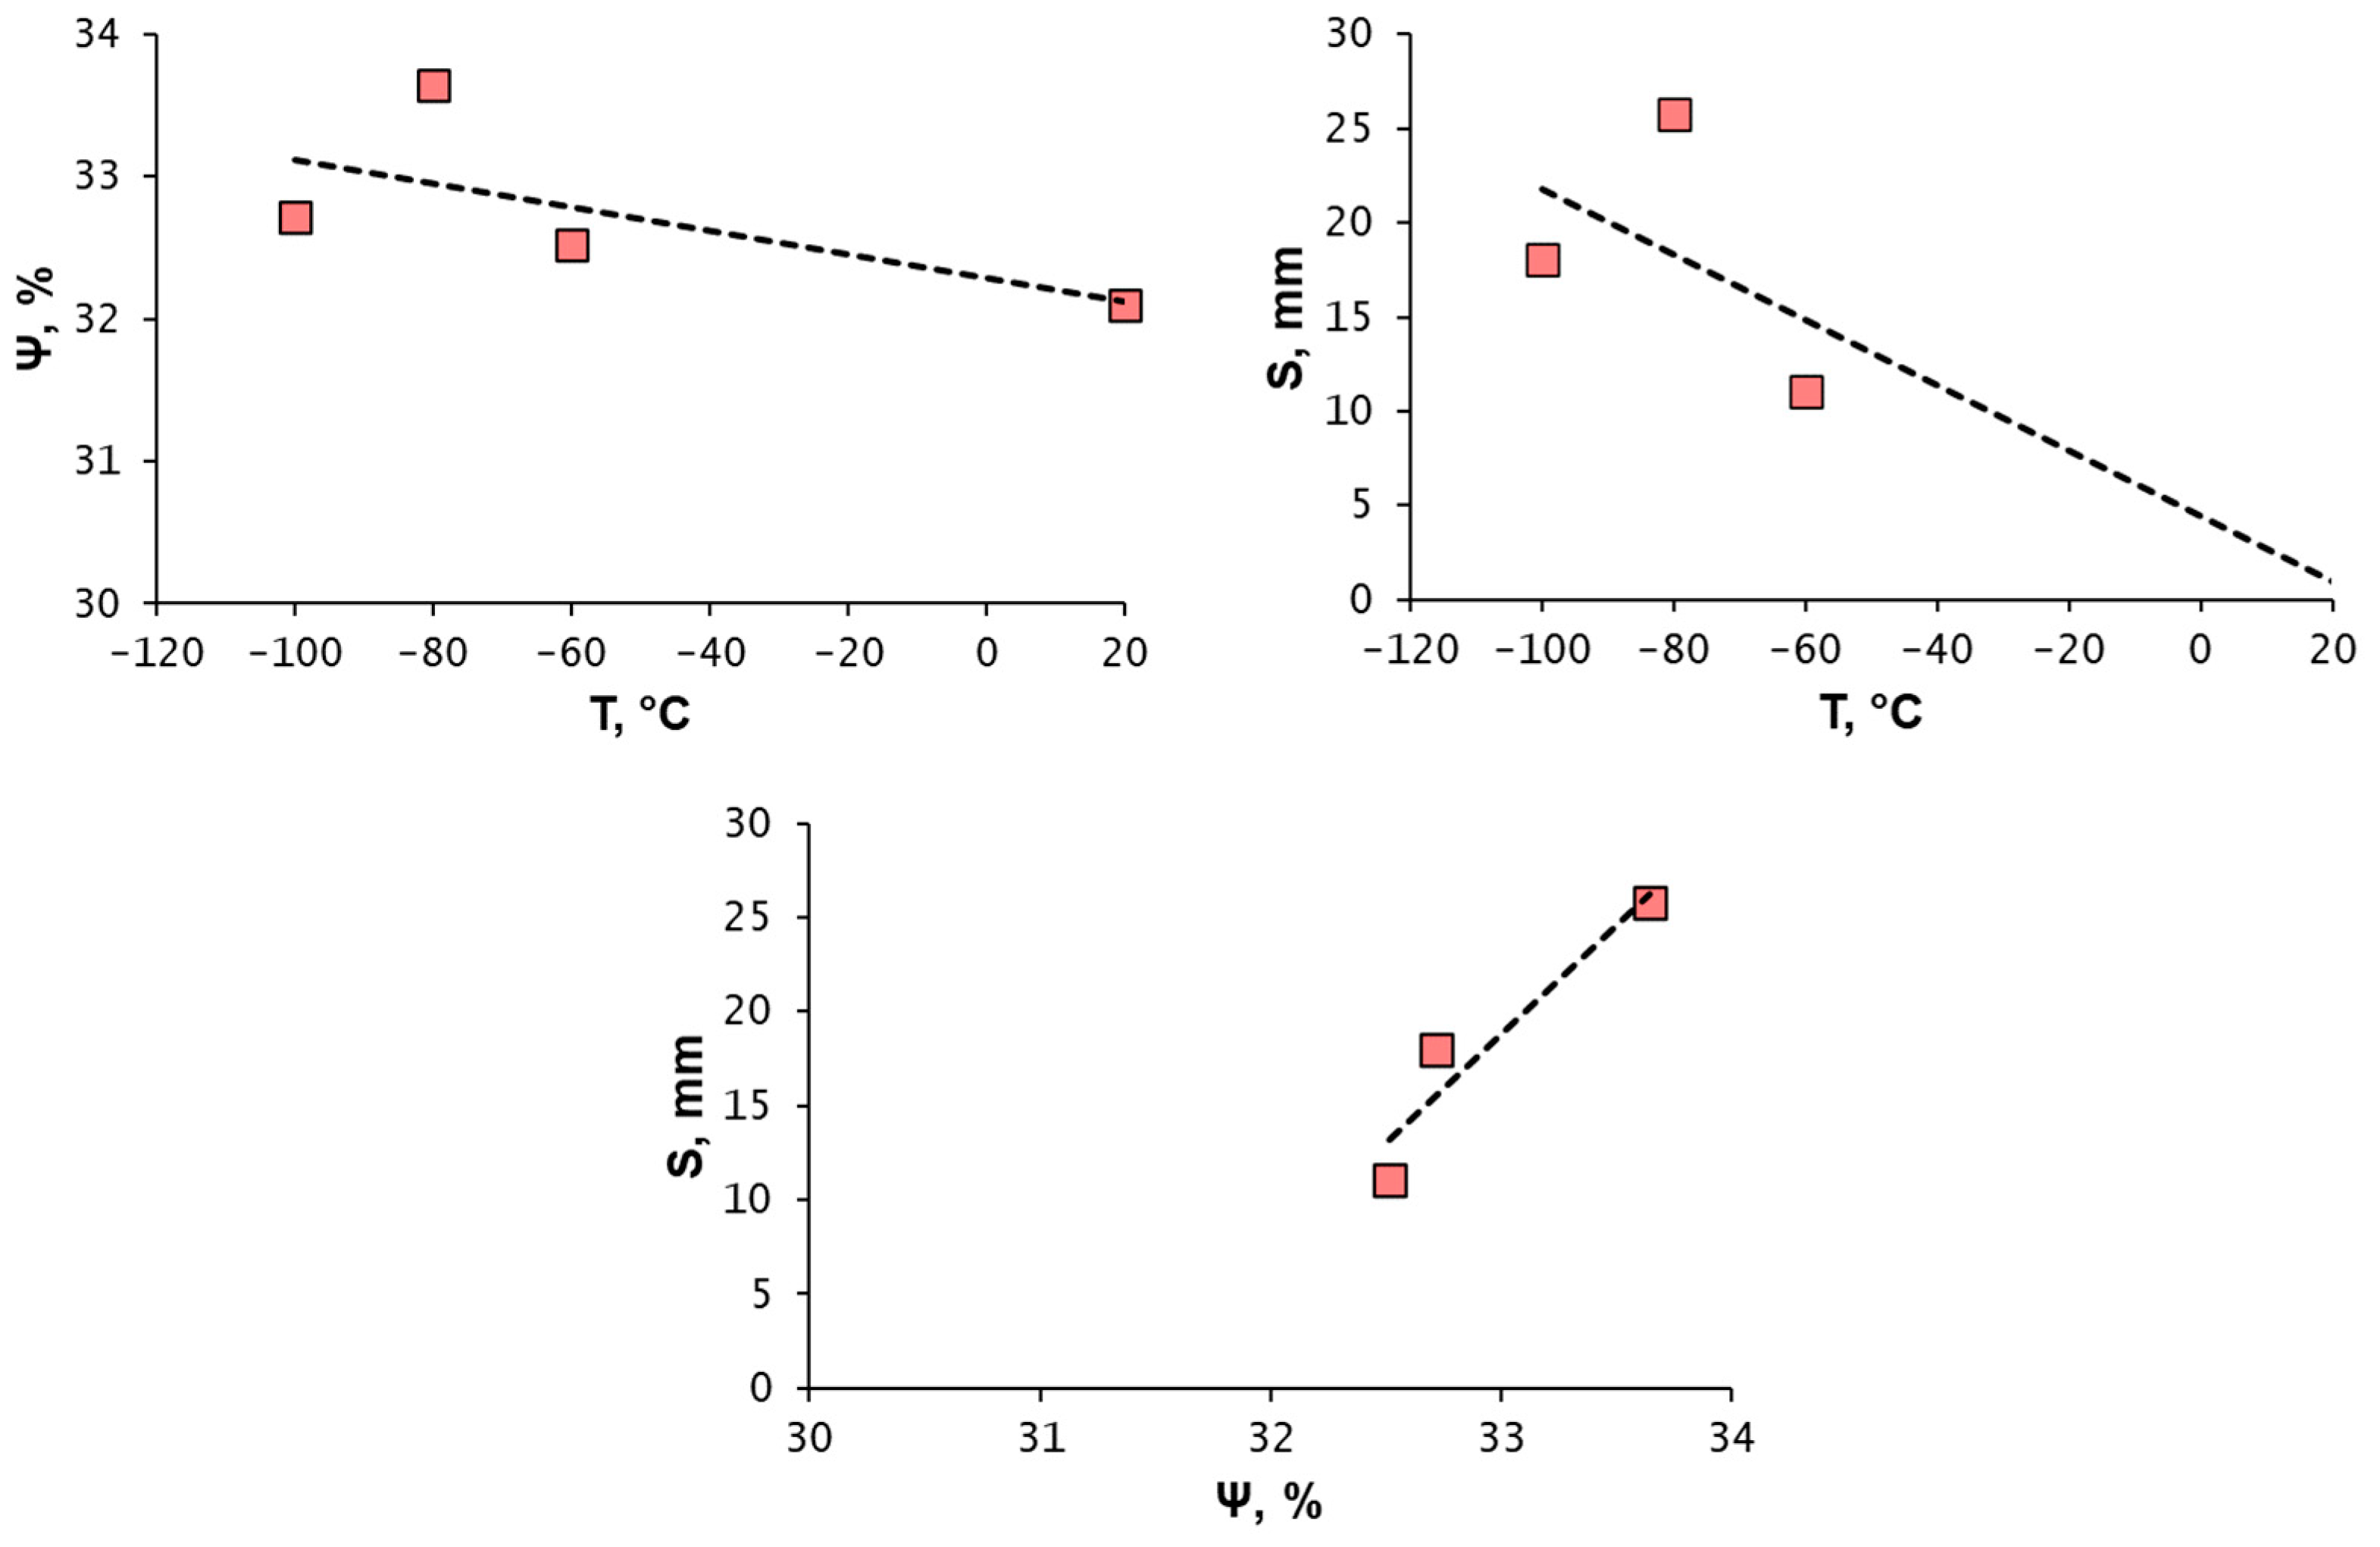
The relative lateral contraction Ψ temperature dependence for complete specimens’ population is shown in
Figure 10. A comparison with
Figure 3 shows that the relative lateral contraction temperature dependence courses coincide with the impact toughness temperature dependence courses. Thus, it is shown that an impact toughness decrease correlates with a plasticity decrease with decreasing test temperature.
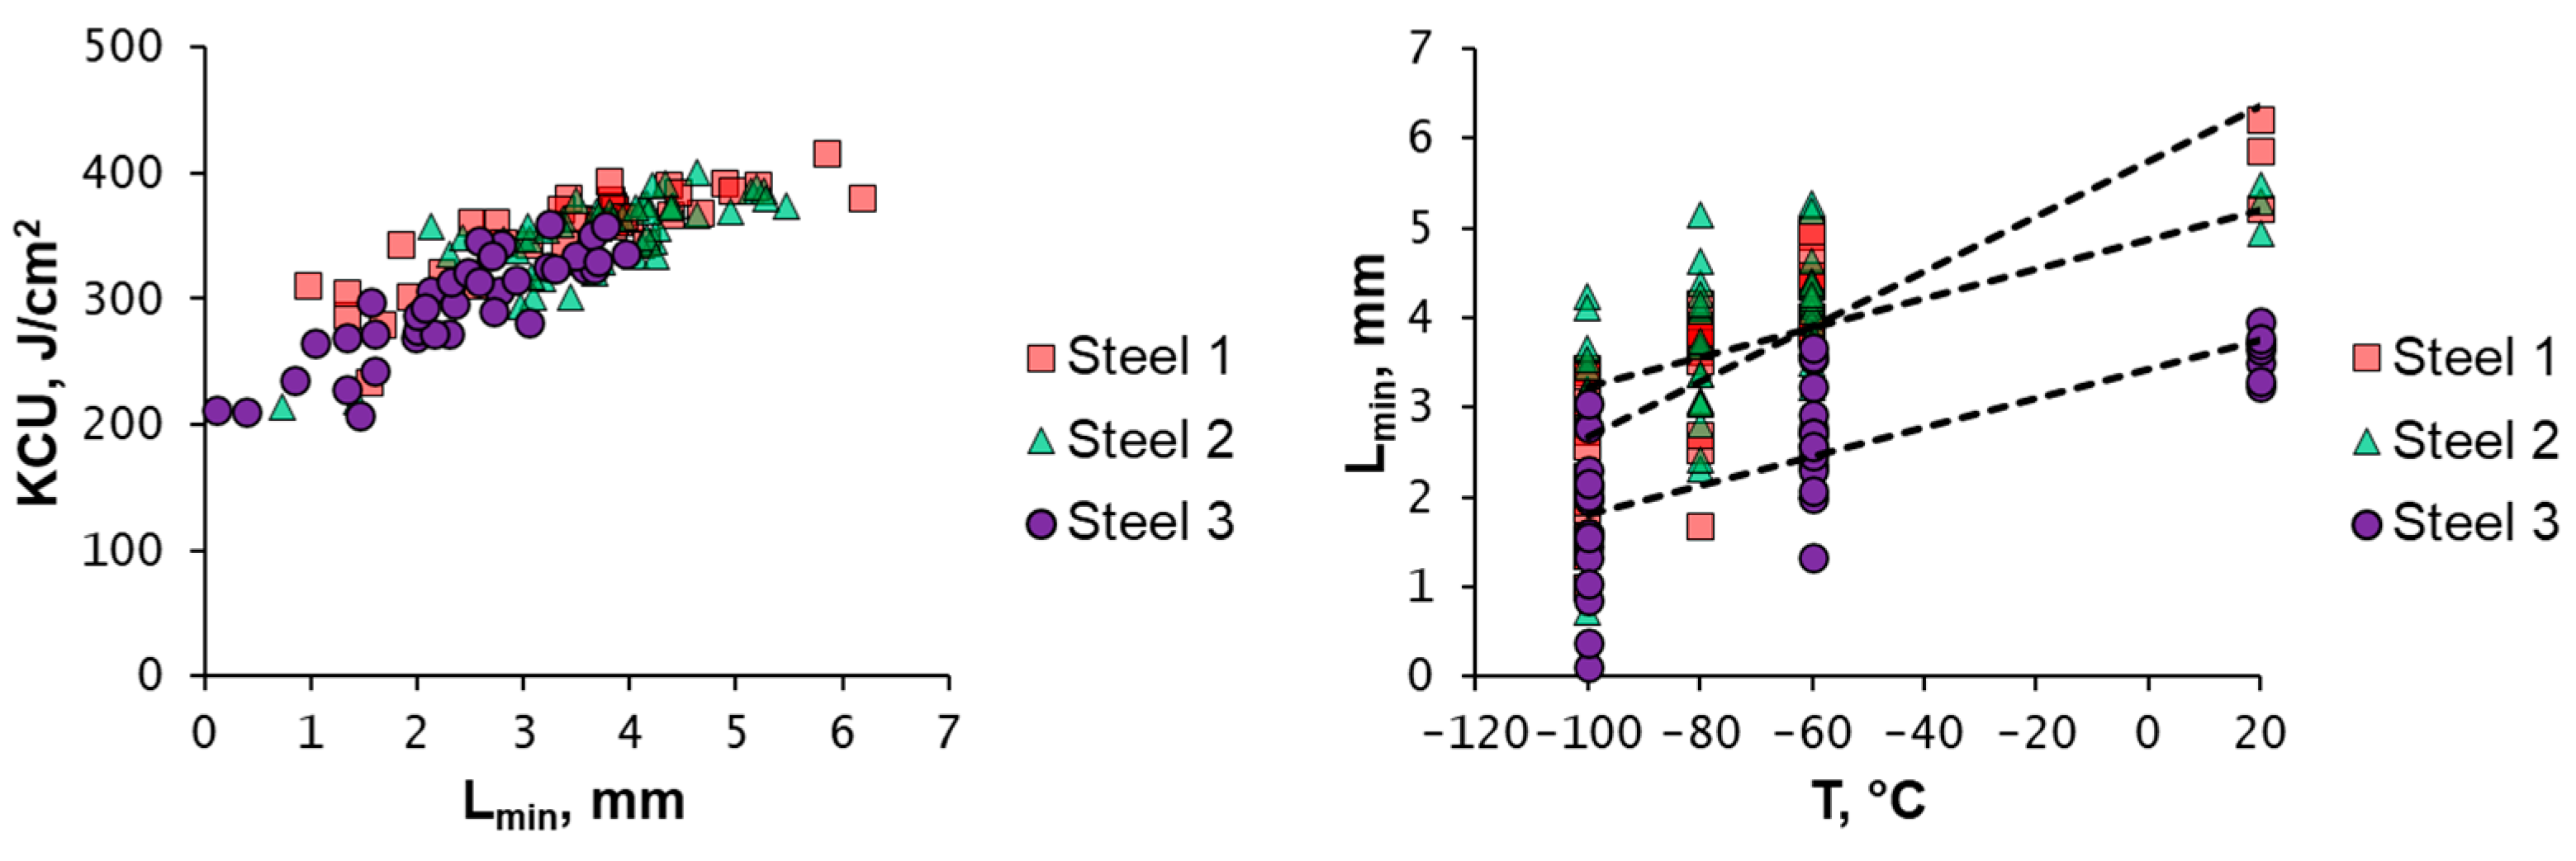
Apart from the relative lateral contraction, the main split fracture characteristics are the size and localization of splits. Impact toughness—split characteristic relationships and split characteristics—temperature dependences are represented in
Figure 11.
The impact toughness decreases with an increase in the splits number N, their summary length S, and the splits’ affected fracture projection area A. The impact toughness increases with an increase in the lowest distance between the root of the incision and the tip of the nearest split Lmin. In turn, with a decreasing test temperature, the number of splits N, their summary length S, and the fracture projection area affected by the splits A increase. As the test temperature decreases, the minimum distance between the incision root and the nearest split tip Lmin decreases.
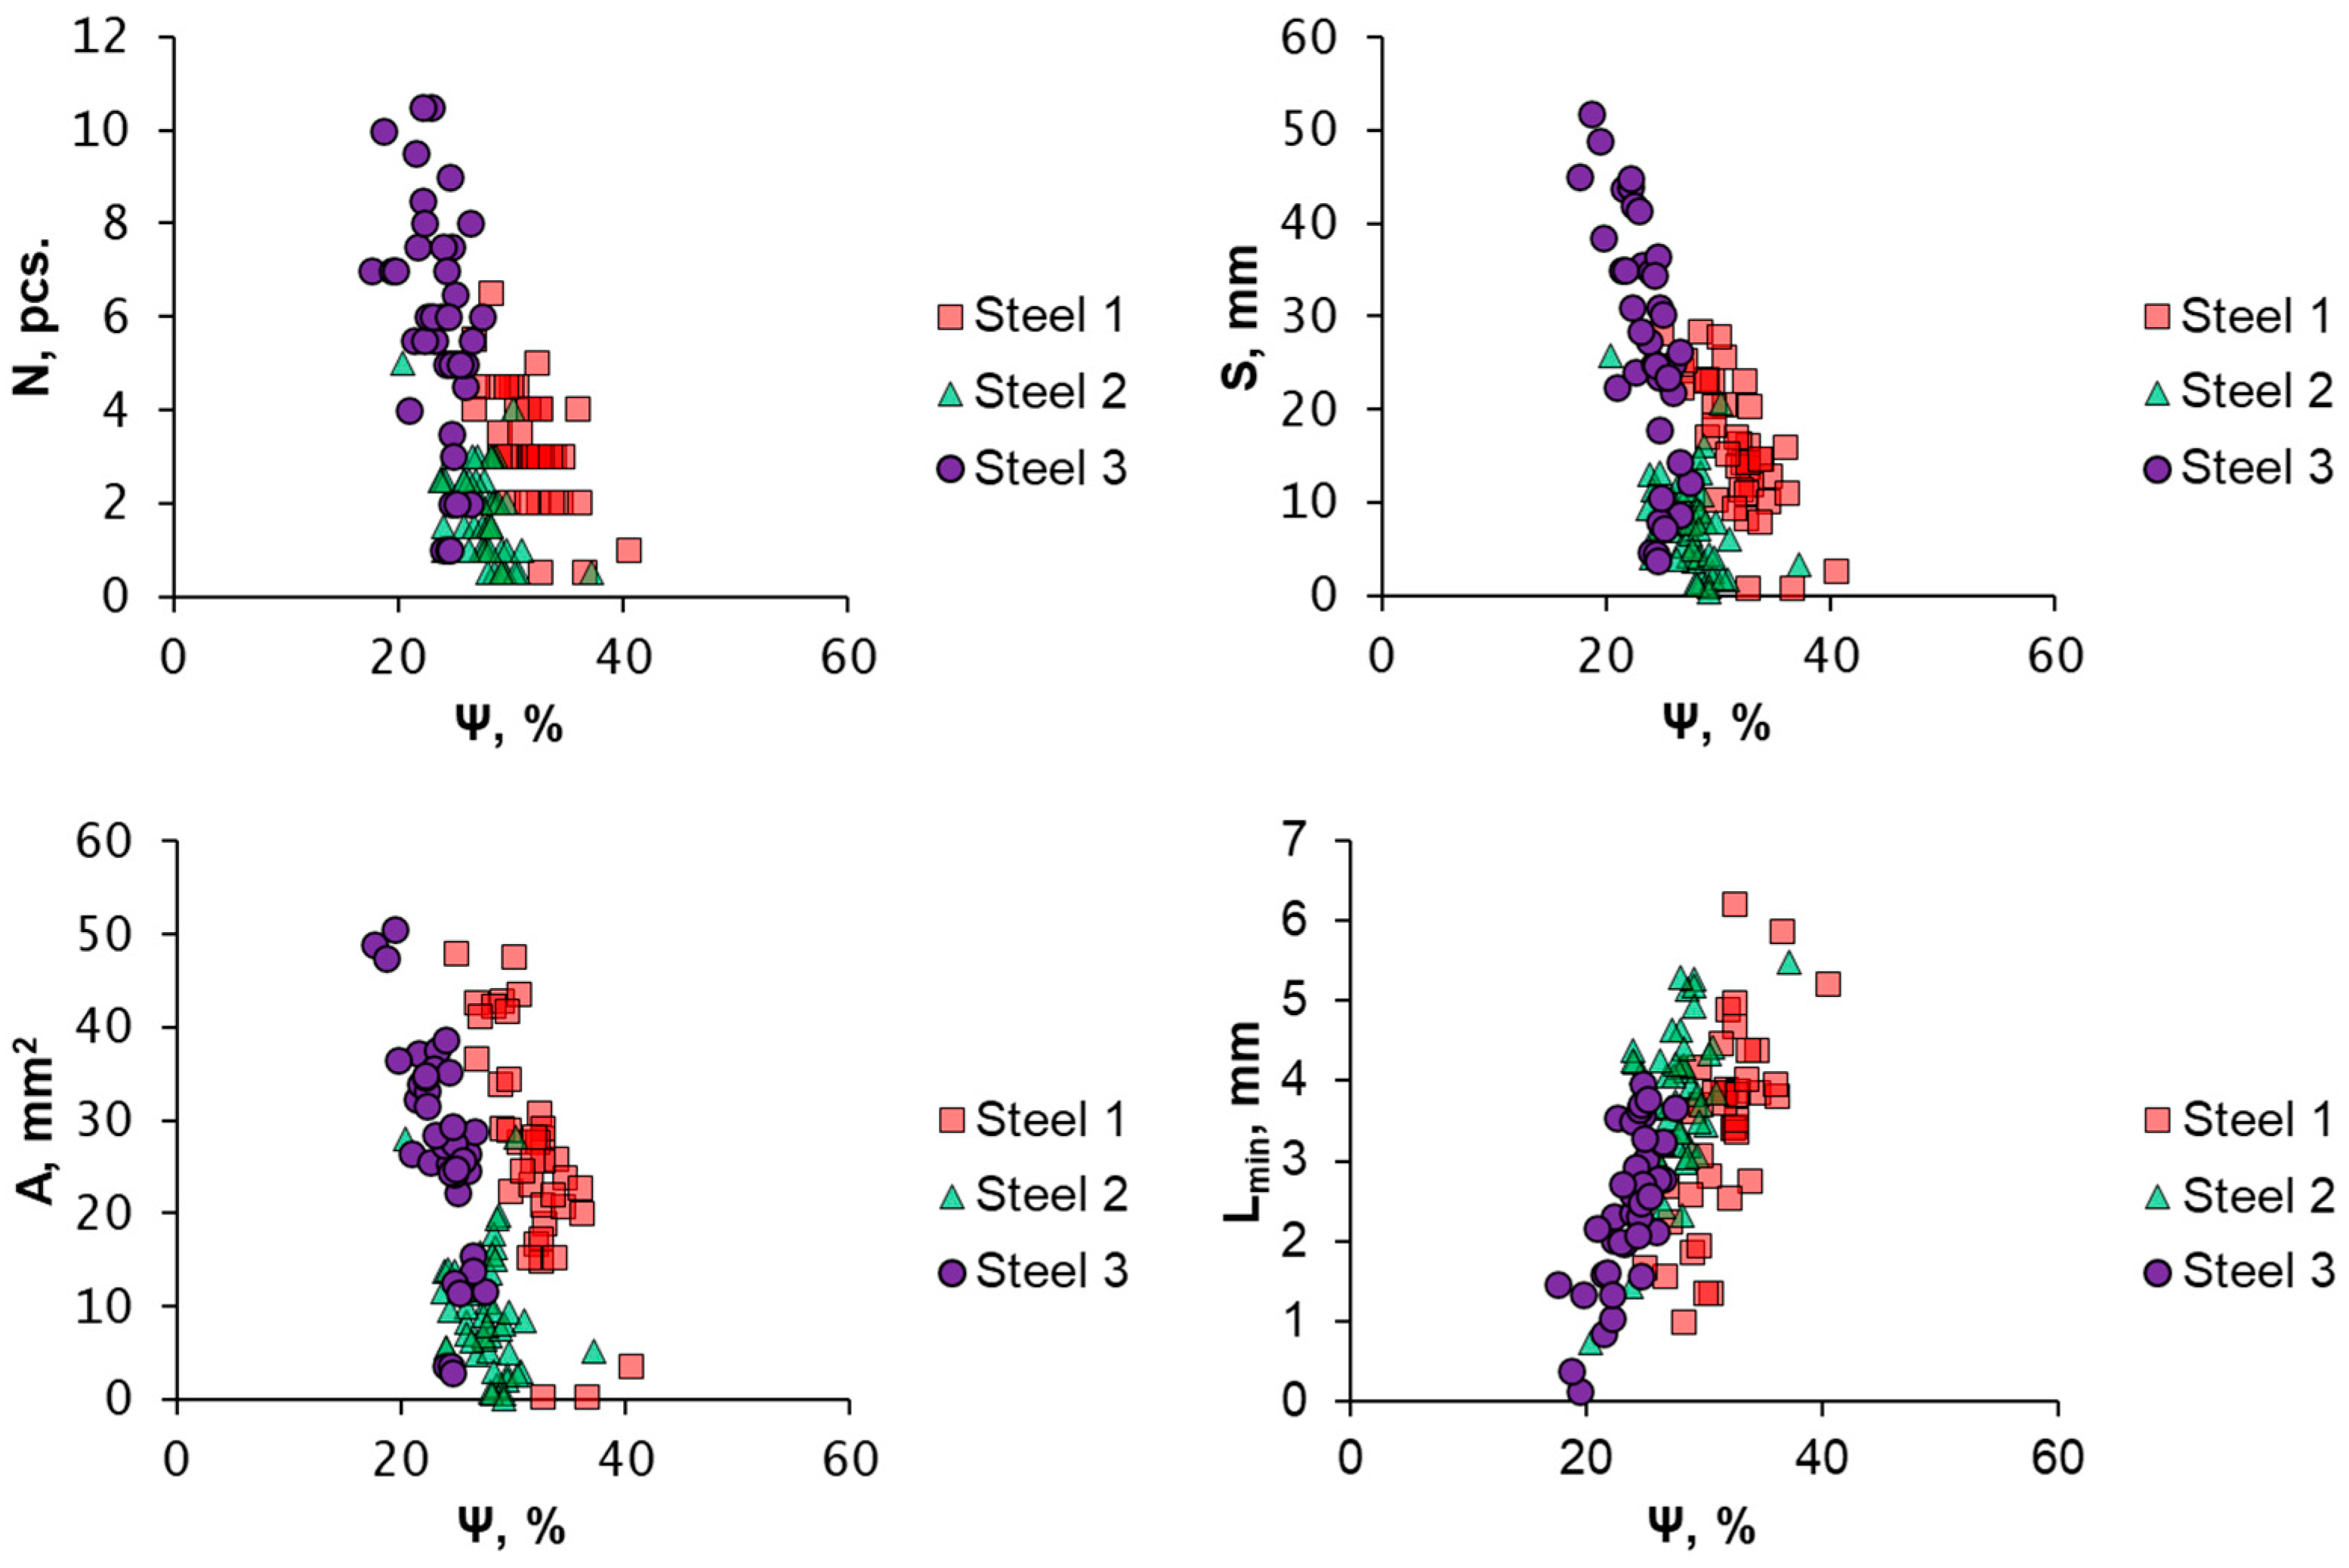
The analysis of relative lateral contraction effect on the susceptibility for splitting for three steels is shown in
Figure 12.
For each individual steel, with a whole test temperature range summary representated, it can be seen that the larger the relative lateral contraction Ψ, the smaller the splits number N, their summary length S, and the fracture projection area affected by the splits A. An increase in the relative lateral contraction Ψ leads to an increase in the minimum distance between the incision root and the nearest split tip Lmin.
The relative lateral contraction and splitting characteristics influence on the impact toughness is manifested to varying degrees depending on the test temperature (
Table 4). At room temperature, the impact toughness dependence for all steels from Ψ is rather weak. The correlation coefficient is 0.16–0.46. In the case of lower test temperatures from −60 °C to −100 °C, the correlation coefficient is 0.52–0.86. The correlation becomes more pronounced. A similar relationship can be observed between the KCU and all measured splitting characteristics, as well as between Ψ and all measured fracture characteristics.
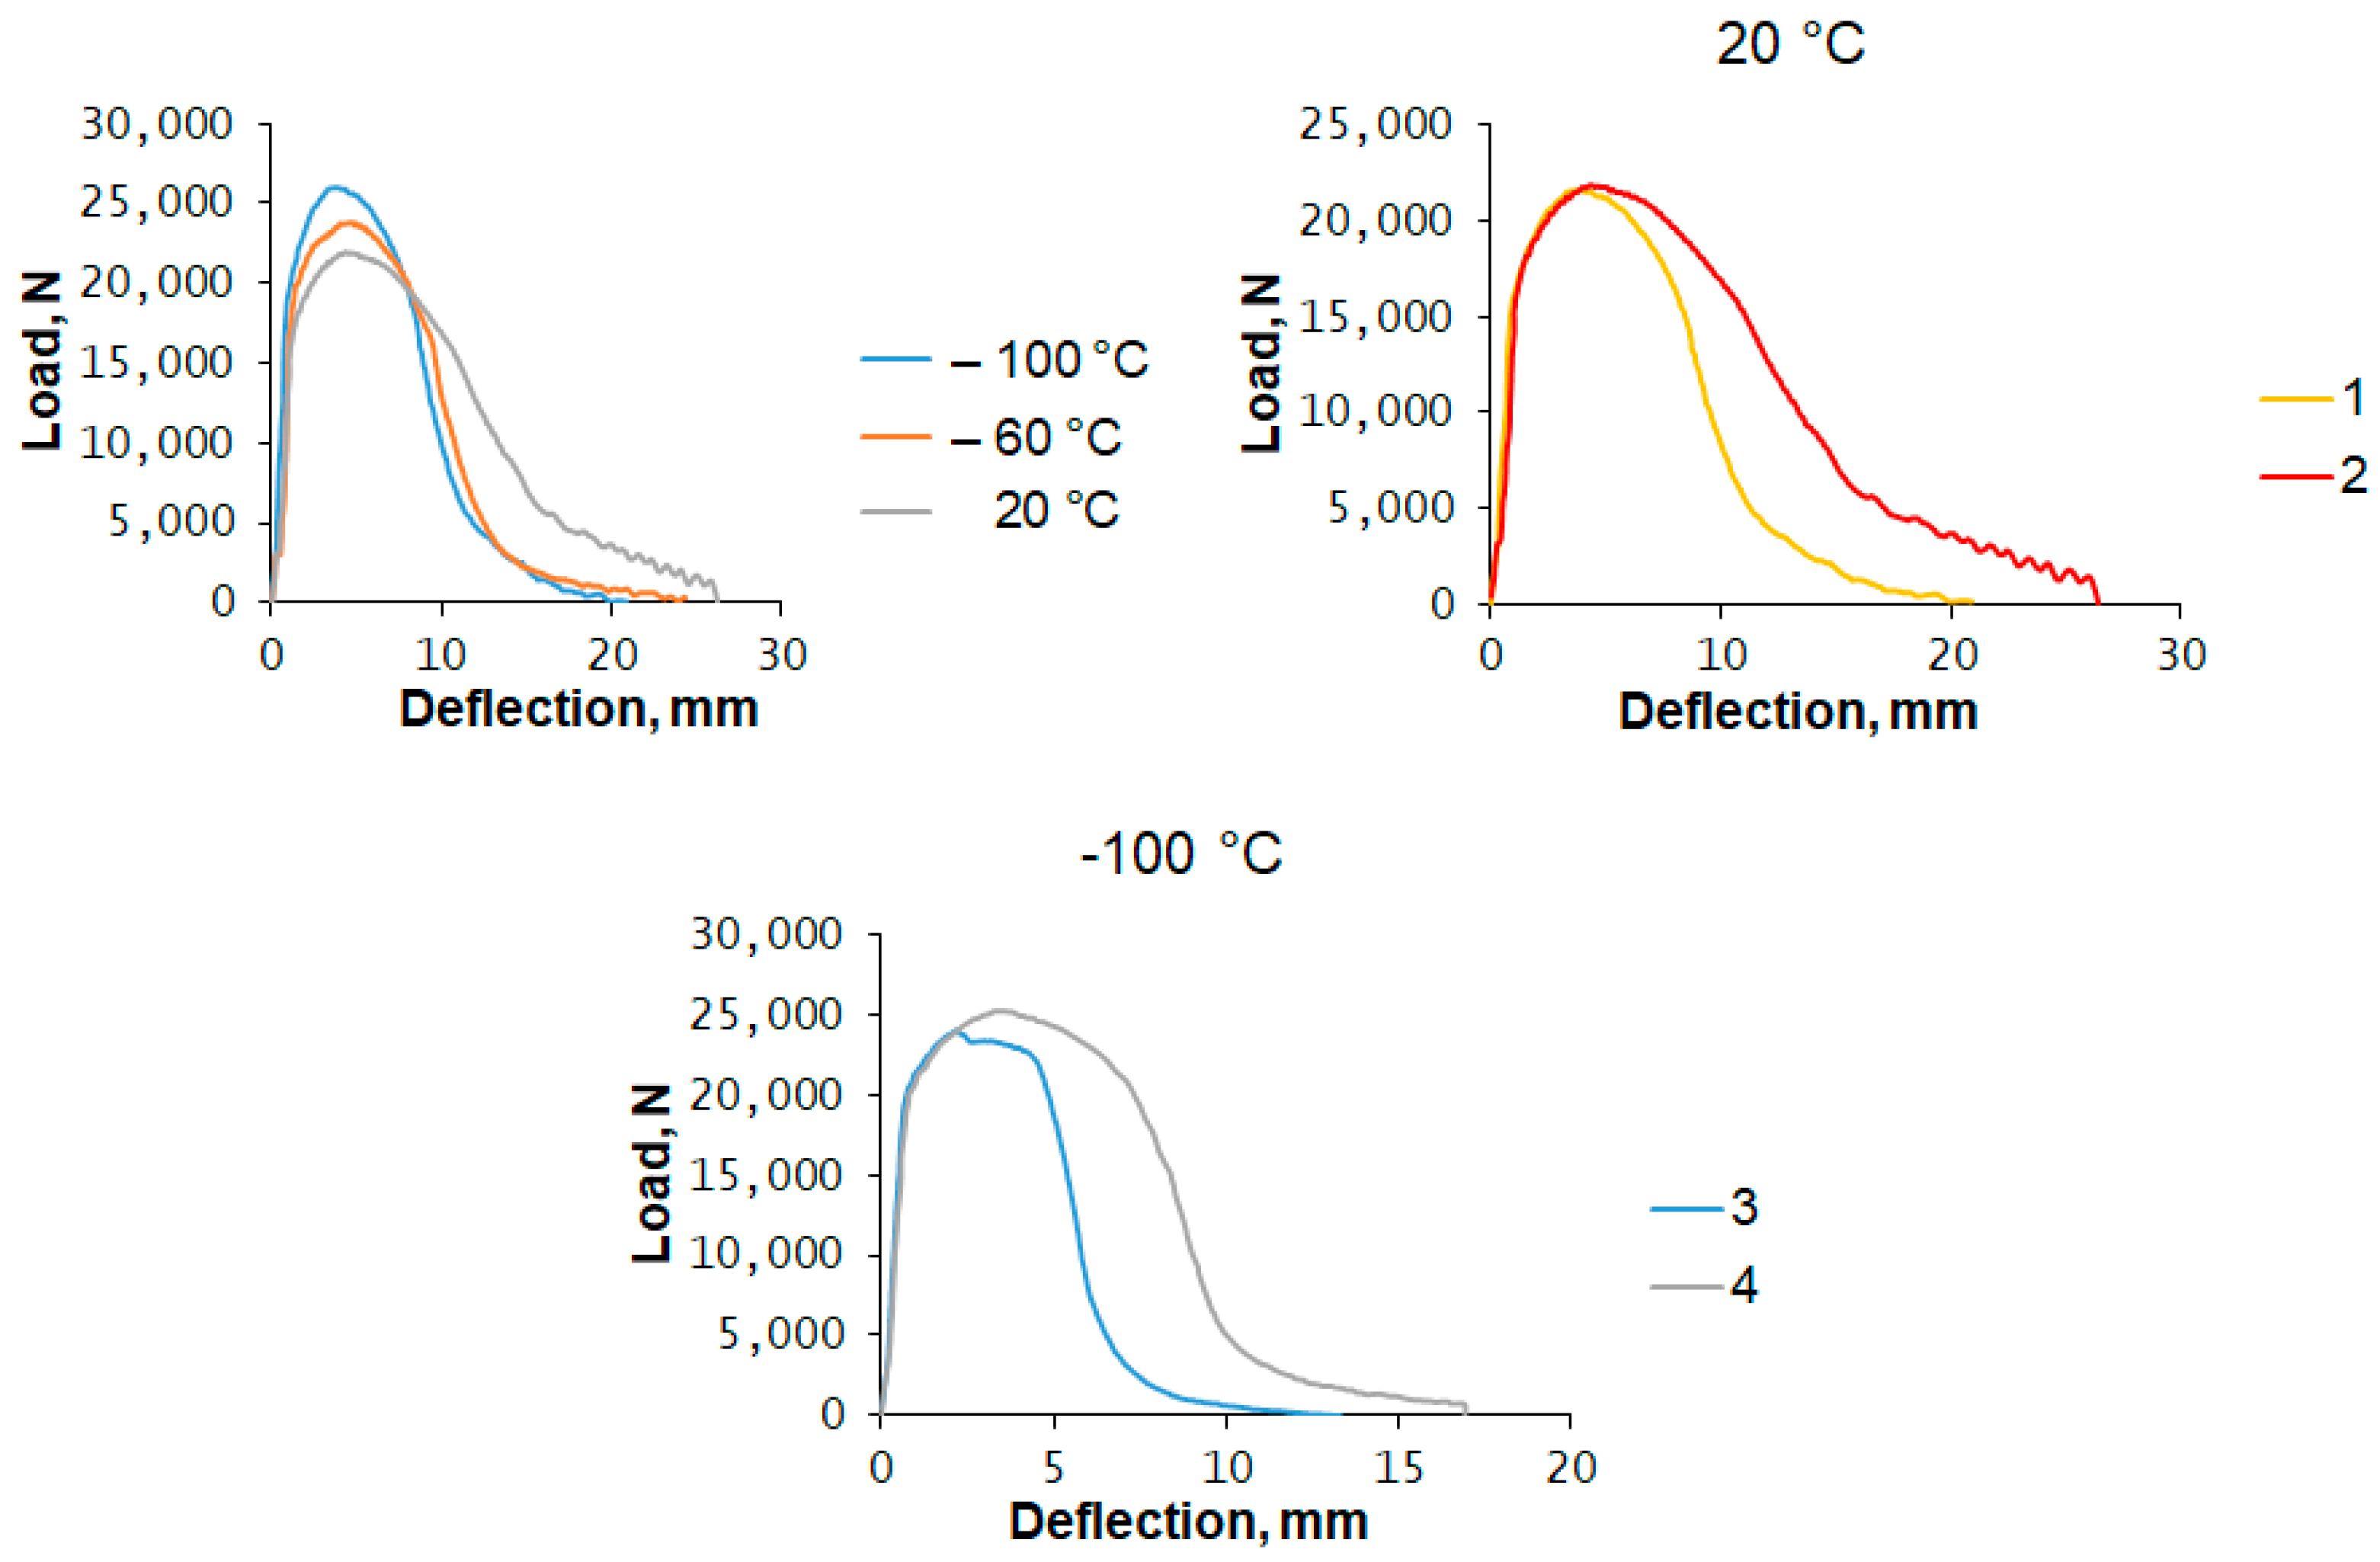
Figure 13 shows dynamic load–displacement curves for various cases of impact fracture.
As the test temperature decreases, both the dynamic (ultimate) tensile strength and the dynamic yield strength increase [
27]. At the same time, the formation of new surfaces occurs with a smaller deflection with the decreasing test temperature. The split formation leads to a dynamic curve slope change, which is apparent for specimens fractured at 20 °C with splits (1) and without splits (2). The described specimens’ dynamic tensile strength is equal, but the splits formation changes the curve slope. It results in a significant fracture energy decrease. In cases where the split tip intersects the incision root, a load drop occurs with a sharp bend in the dynamic curve (1 of 20 specimens fractured at −100 °C for steel 3). The split formation is observed before reaching a possible dynamic tensile strength value for a certain test temperature (3). Further failure occurs with the additional maximum formation on the dynamic curve with a reduced dynamic tensile strength value. The main crack front is divided into two parts. Then, each of the specimen resulting parts continues to deform and a second local maximum is reached; after that, the load gradually decreases. In conventional splitting cases (4), the dynamic tensile strength possible for certain temperature is reached. In this case, the second local maximum formation does not occur. Thus, the split formation at an early fracture stage reduces the impact toughness through the material fracture behavior change.
A large number of Charpy impact tests and impact toughness values’ scattering allowed us to identify and analyze individual specimens that showed the same absorbed fracture energies in a wide test temperature range. The fracture characteristics analysis of such specimens is shown in
Figure 14.
For specimens with a similar absorbed fracture energy, the relative lateral contraction remains almost unchanged, regardless of the test temperature. The values’ differences between different temperatures did not exceed 2%. At the same time, the Ψ difference for specimens with maximum and minimum values from the entire test population for a certain temperature reached 11%. The measured split characteristics variability was observed. For instance, the summary splits length of S for steel 1 is given in
Figure 14. S for steel 1 lay in the 9–26 mm range. The S variation range for the entire population, depending on the test temperature, was 7–14 mm. With a decreasing test temperature, a certain increase in the summary splits length was observed. In contrast to the impact-fractured specimens’ entire population, the fractures of specimens with equal impact toughness values shows that, with increasing plasticity, an increasing summary split length is observed.
4. Discussion
Impact toughness is a function of the strength and plasticity of a material. However, during high toughness materials analysis, it is necessary to emphasize the plasticity significance. In the above-described experiments, we characterized plasticity by relative lateral contraction, which is the ultimate strain achieved in material during impact fracture. We consider the ultimate strain as a non-strict form of plasticity assessment. We treat steel 1 as having the highest plasticity level, since this steel specimen undergoes the greatest plastic deformation during the impact fracture (
Figure 8). That is why we used relative lateral contraction and its temperature dependence (
Figure 9), as basic characteristics. In accordance with the concepts outlined in [
19], the intrinsic steel toughness value at each test temperature is the maximum impact toughness value, which could be obtained in the material without any additional microstructural defects. The impact toughness scattering is generated by microstructure defects [
32]. Therefore, it can be assumed that the undisclosed secondary microcracks formation will be one of the reasons for impact toughness scattering. It follows that if we compare the maximum impact toughness values at each test temperature with the other impact toughness values obtained at the same test temperature, it is possible to reveal in a very approximate form the impact toughness values’ scattering caused by the splits’ formation. Experimentally, this scattering was detected as the impact toughness values’ scattering exceeding the instrumental error (
Figure 3,
Table 3). As mentioned above, its magnitude is significantly less than the impact toughness scattering caused by the ductile–brittle transition, leading to the formation of fracture surfaces’ brittle and ductile components. Exactly such scattering was observed during Charpy impact tests at temperatures less than room temperature, in spite of the fact that these temperatures were higher than the upper shelf transition temperature. In other words, this impact toughness scattering takes place at test temperatures leading to the ductile fracture of steels (
Figure 4 and
Figure 5). Only by conducting a large number of tests at the same temperature can we reveal this scattering. From the relative lateral contraction temperature dependence measurements (
Figure 10), it follows that all the studied steels’ plasticities decrease with a decreasing test temperature. The degree of this decrease varies depending on test temperature (
Table 4). The impact toughness also changes in the same way. Such a correlation does not yet indicate a cause–effect relationship between these values. Nevertheless, multiple tests and measurements allowed us to show the mutual dependence of the relative lateral contraction and impact toughness of each studied steel at each test temperature (
Figure 9). The fact that splitting was observed only in every 10th specimen at a 20 °C test temperature indicates an uneven stress concentrator distribution. In our case, splits play the role of such stress concentrators. In turn, the splits’ occurrence is a consequence of the uneven distribution of both local plasticity and local toughness.
The EBSD application allowed the quantification of the degree of local plastic deformation in the plastic zone of the specimens fractured during Charpy impact tests (
Figure 6). The local strain heterogeneity in the region of splits and bottom crack is shown.
For each investigated steel in the temperature range from 20 °C to −100 °C, the splitting susceptibility increases with the decreasing plasticity (
Figure 12). At the same time, it should be noted that the test temperature of 20 °C is close to the upper temperature threshold for the splits’ formation (
Figure 4).
The splits’ effect on impact toughness is studied. With a decreasing temperature, an increase in susceptibility to splits’ formation was observed over the whole test temperature range. A large number of tests allowed us to establish that the splitting parameters and impact toughness are interrelated at each test temperature (
Figure 11). At the same time, the greater the split formation susceptibility, the lower the impact toughness is for each investigated steel.
From the fact that plasticity decreases with a decreasing temperature, and the number and extent of splits increases, it follows that splits may not necessarily occur at the steel’s maximum total plasticity value. The condition for the splitting occurrence is: local stresses exceeding the cleavage stress in the transverse direction, local plastic deformation is exhausted, and as a result, local ultimate strain in the transverse direction is achieved.
A large number of Charpy impact tests conducted at each temperature allow to identify specimens with the same absorbed fracture energies values in a wide temperature range (
Figure 3 and
Figure 14). The equal KCU values obtained at different test temperatures are caused by the individual specimen’s local plasticity values’ scattering. Apparently, the local plasticity scattering even compensates the increasing splitting characteristics with decreasing temperature (
Figure 14).
The results of a dynamic curve character and fractographic feature comparison shows that splits, which intersect incision, are formed at an early fracture stage. Their contribution to the impact toughness reduction is most significant (
Figure 13). The splitting moment in load-deflection curve appears as a sharp curve character change [
15]. The fractographic feature of this phenomenon is the distance between the incision root and the nearest split tip L
min (
Figure 2,
Figure 5 and
Figure 11).
We observed the split formation only during ductile fracture (
Figure 3,
Figure 4 and
Figure 5). According to the literature data, there is a temperature below which splits are not formed [
16]. In our experiments, we revealed that splits’ maximum number and size are observed at −100 °C test temperature. We assume that splits appearance is a feature of Charpy impact tests at temperatures approaching the ductile-to-brittle transition temperature. Any ductile-to-brittle transition feature is a conditional concept in its essence. Therefore, we should agree with the opinion stated in works [
33,
34] that the ductile-to-brittle transition temperature concept is conditional not so much in a subjective as in an objective sense.
We propose to consider the splits’ temperature range in high-strength X80 pipeline steels as a special intermediate “ductile fracture with splits” temperature range.
