Article

Investigation of the First Hydrogenation of LaNi5

Hydrogen Research Institute, Université du Québec à Trois-Rivières, 3351 des Forges, Trois-Rivières, QC G9A 5H7, Canada
*
Author to whom correspondence should be addressed.
Reactions 2024, 5(3), 419-428; https://doi.org/10.3390/reactions5030021
Submission received: 6 May 2024 / Revised: 6 June 2024 / Accepted: 27 June 2024 / Published: 2 July 2024
(This article belongs to the Special Issue Hydrogen Production and Storage, 2nd Edition)

Abstract

:
The first hydrogenation of most metal hydrides is a lengthy process that usually requires high pressure and temperature. This, in turn, significantly increases the production cost of metal hydrides. In this paper, the low temperature hydride-forming LaNi5 was selected to investigate the mechanism of first hydrogenation. For the first time, the effect of particle size, temperature and pressure on the incubation time were studied. We found that the first hydrogenation of LaNi5 follows an Arrhenius process, with an activation energy of EA = 78 ± 4 kJ/mol H2. We also found that the pre-exponential factor depends on the applied pressure.

1. Introduction

The increasing demand for sustainable and clean energy sources has brought hydrogen to the center of the energy landscape [1]. As a clean and renewable energy carrier, hydrogen has the potential to transform our energy systems. However, realizing this potential requires addressing the challenge of efficient hydrogen storage. The present methods for hydrogen storage, such as gaseous forms, liquid forms or chemical compounds, each come with some limitations [2,3]. Therefore, new ways to store hydrogen have to be developed. Among these, metal hydrides have gained attention due to their capability to absorb and release hydrogen under controlled conditions. Their ability to form bonds with hydrogen addresses the drawbacks of gaseous or liquid storage, offering a safer, more stable, and higher volumetric energy density than the other storage methods [4,5].
The intermetallic compound LaNi5, categorized under AB5 metal hydrides, was identified for hydrogen storage back in the 1970s [6]. This compound is considered effective in storing hydrogen, making it a promising candidate for various applications in hydrogen storage technologies, including fuel cells for clean energy production and portable hydrogen-powered devices [7]. LaNi5 is used in nickel-metal hydride (NiMH) batteries for portable devices and hybrid vehicles [8]. Additionally, it exhibits potential in catalytic processes and the refinement of hydrogen for industrial applications [9]. LaNi5 fibers were also studied for hydrogen storage and the results were promising [10].
Studies have shown that LaNi5 alloys show good kinetics, high reversible capacities, good cycling stability and resistance to gas impurities [11,12,13,14]. LaNi5 has a hexagonal CaCu5-type structure with space group P6/mmm. Upon hydrogenation, it forms LaNi5Hx hydrides, where 5 < x < 7. The hydride possesses a hydrogen volumetric capacity of 115 kg H2.m−3 and a maximum gravimetric capacity of about 1.5 wt.% H2. The pressure composition temperature (PCT) curves exhibit a flat plateau, and hysteresis is minimal [15].
LaNi5 can absorb and release hydrogen at room temperature and pressures below 100 bar. Achieving its hydrogen storage capacity requires a relatively prolonged first hydrogenation process during the initial exposure to hydrogen, commonly referred to as activation [16].
The first hydrogenation of most metal hydrides is often slow and difficult [17,18,19,20]. The slow diffusion of hydrogen into the alloy could be related to the presence of surface oxides. These oxides, whose thickness varies with synthesis technique and alloy composition, prevent the penetration of hydrogen into the alloy. Usually, this result is a period when no apparent reaction is seen, and the alloy is basically not absorbing hydrogen until the reaction suddenly starts. This period of no or very small absorption is usually called incubation time.
Generally, high pressure and high temperature conditions are needed to facilitate hydrogen penetration through the oxide layers for direct interaction with the fresh metal. Once this activation process is completed, the alloy could rapidly and easily absorb and desorb hydrogen [21]. Therefore, the activation step is important from an industrial perspective to ensure the metal hydride efficiently performs its function. It also has an important impact on the metal hydride cost. Ideally, the activation process should be performed under the same conditions as the operating conditions.
Determining the precise activation parameters remains challenging due to the absence of a formal method [22]. Different approaches, such as additives [23,24,25] and mechanical processing [22,26,27], have been employed to enhance the activation process. Having a comprehensive understanding of the steps and factors involved in the first hydrogenation is essential for the optimization of the activation process and, therefore, the reduction in the cost of the metal hydride. In a previous investigation, we have shown that the activation process of the high-entropy alloy TiVZrHfNb is strongly dependent on temperature, following an Arrhenius law [19].
In this paper, we present an investigation of the activation process of the LaNi5 alloy. To our knowledge, this is the first time a systematic examination on the impact of temperature, constant driving force, and pressure on the activation is conducted.

2. Materials and Methods

A commercial LaNi5 alloy was purchased from Whole Win (Beijing, China) Materials Sci. & Tech. Co., Ltd. The alloy was hand crushed in the air using a hardened steel mortar and pestle. After hand crushing, the powder was sieved using sieves of size 45 μm, 150 μm, 500 μm, 1250 μm and 2000 μm. After sieving, the powder was divided into five populations: particles of size less than 45 μm, between 45 μm and 150 μm, particles between 150 μm and 500 μm, particles between 500 μm and 1250 μm and particles between 1250 μm and 2000 μm. The sieving process and the preparation of samples for activation were carried out under the air. The activation measurements were performed under different conditions using a homemade Sievert’s apparatus [28]. Initially, the activation was conducted at 298 K under 20 bars of hydrogen pressure for the five different particle size populations. Here, activation was carried out at temperatures between 298 K and 333 K and pressures between 4 bars to 50 bars. For every measurement, a fresh sample was used. The incubation time was given by the onset of the slope, which is the intersection of the tangent of the curve well before the reaction and the tangent of the curve after the reaction started. It was determined using Origin 2024 software.

3. Results and Discussions

3.1. Effect of Particle Size on Incubation Time

The activation curves of the LaNi5 alloy with different particle sizes, conducted at 298 K and under 20 bars of hydrogen pressure, are shown in Figure 1.
The kinetics of all particles between 150 and 2000 μm are the same. For particles between 45 to 150 μm, the incubation time increases as the particle size decreases. The slowest activation was for the smallest particle size (<45 μm), showing the longest incubation time. This is surprising, as one would expect faster kinetics for smaller particle sizes due to their larger specific surface area. All the samples absorbed hydrogen to a maximum capacity of around 1.5 wt.%. These results are in agreement with a previous work of Strozi et al. [27].
To study the effect of temperature, driving force and pressure on the first hydrogenation, we selected the smallest particle size (<45 μm) because it has the longest incubation time, and variations in incubation times will be easier to measure.

3.2. Effect of Temperature on Incubation Time

To study the impact of temperature on the activation behavior, we carried out the activation at 298 K, 308 K, 313 K, 323 K and 333 K under two pressures of hydrogen: 40 bars and 50 bars.

3.2.1. Hydrogen Pressure of 40 Bars

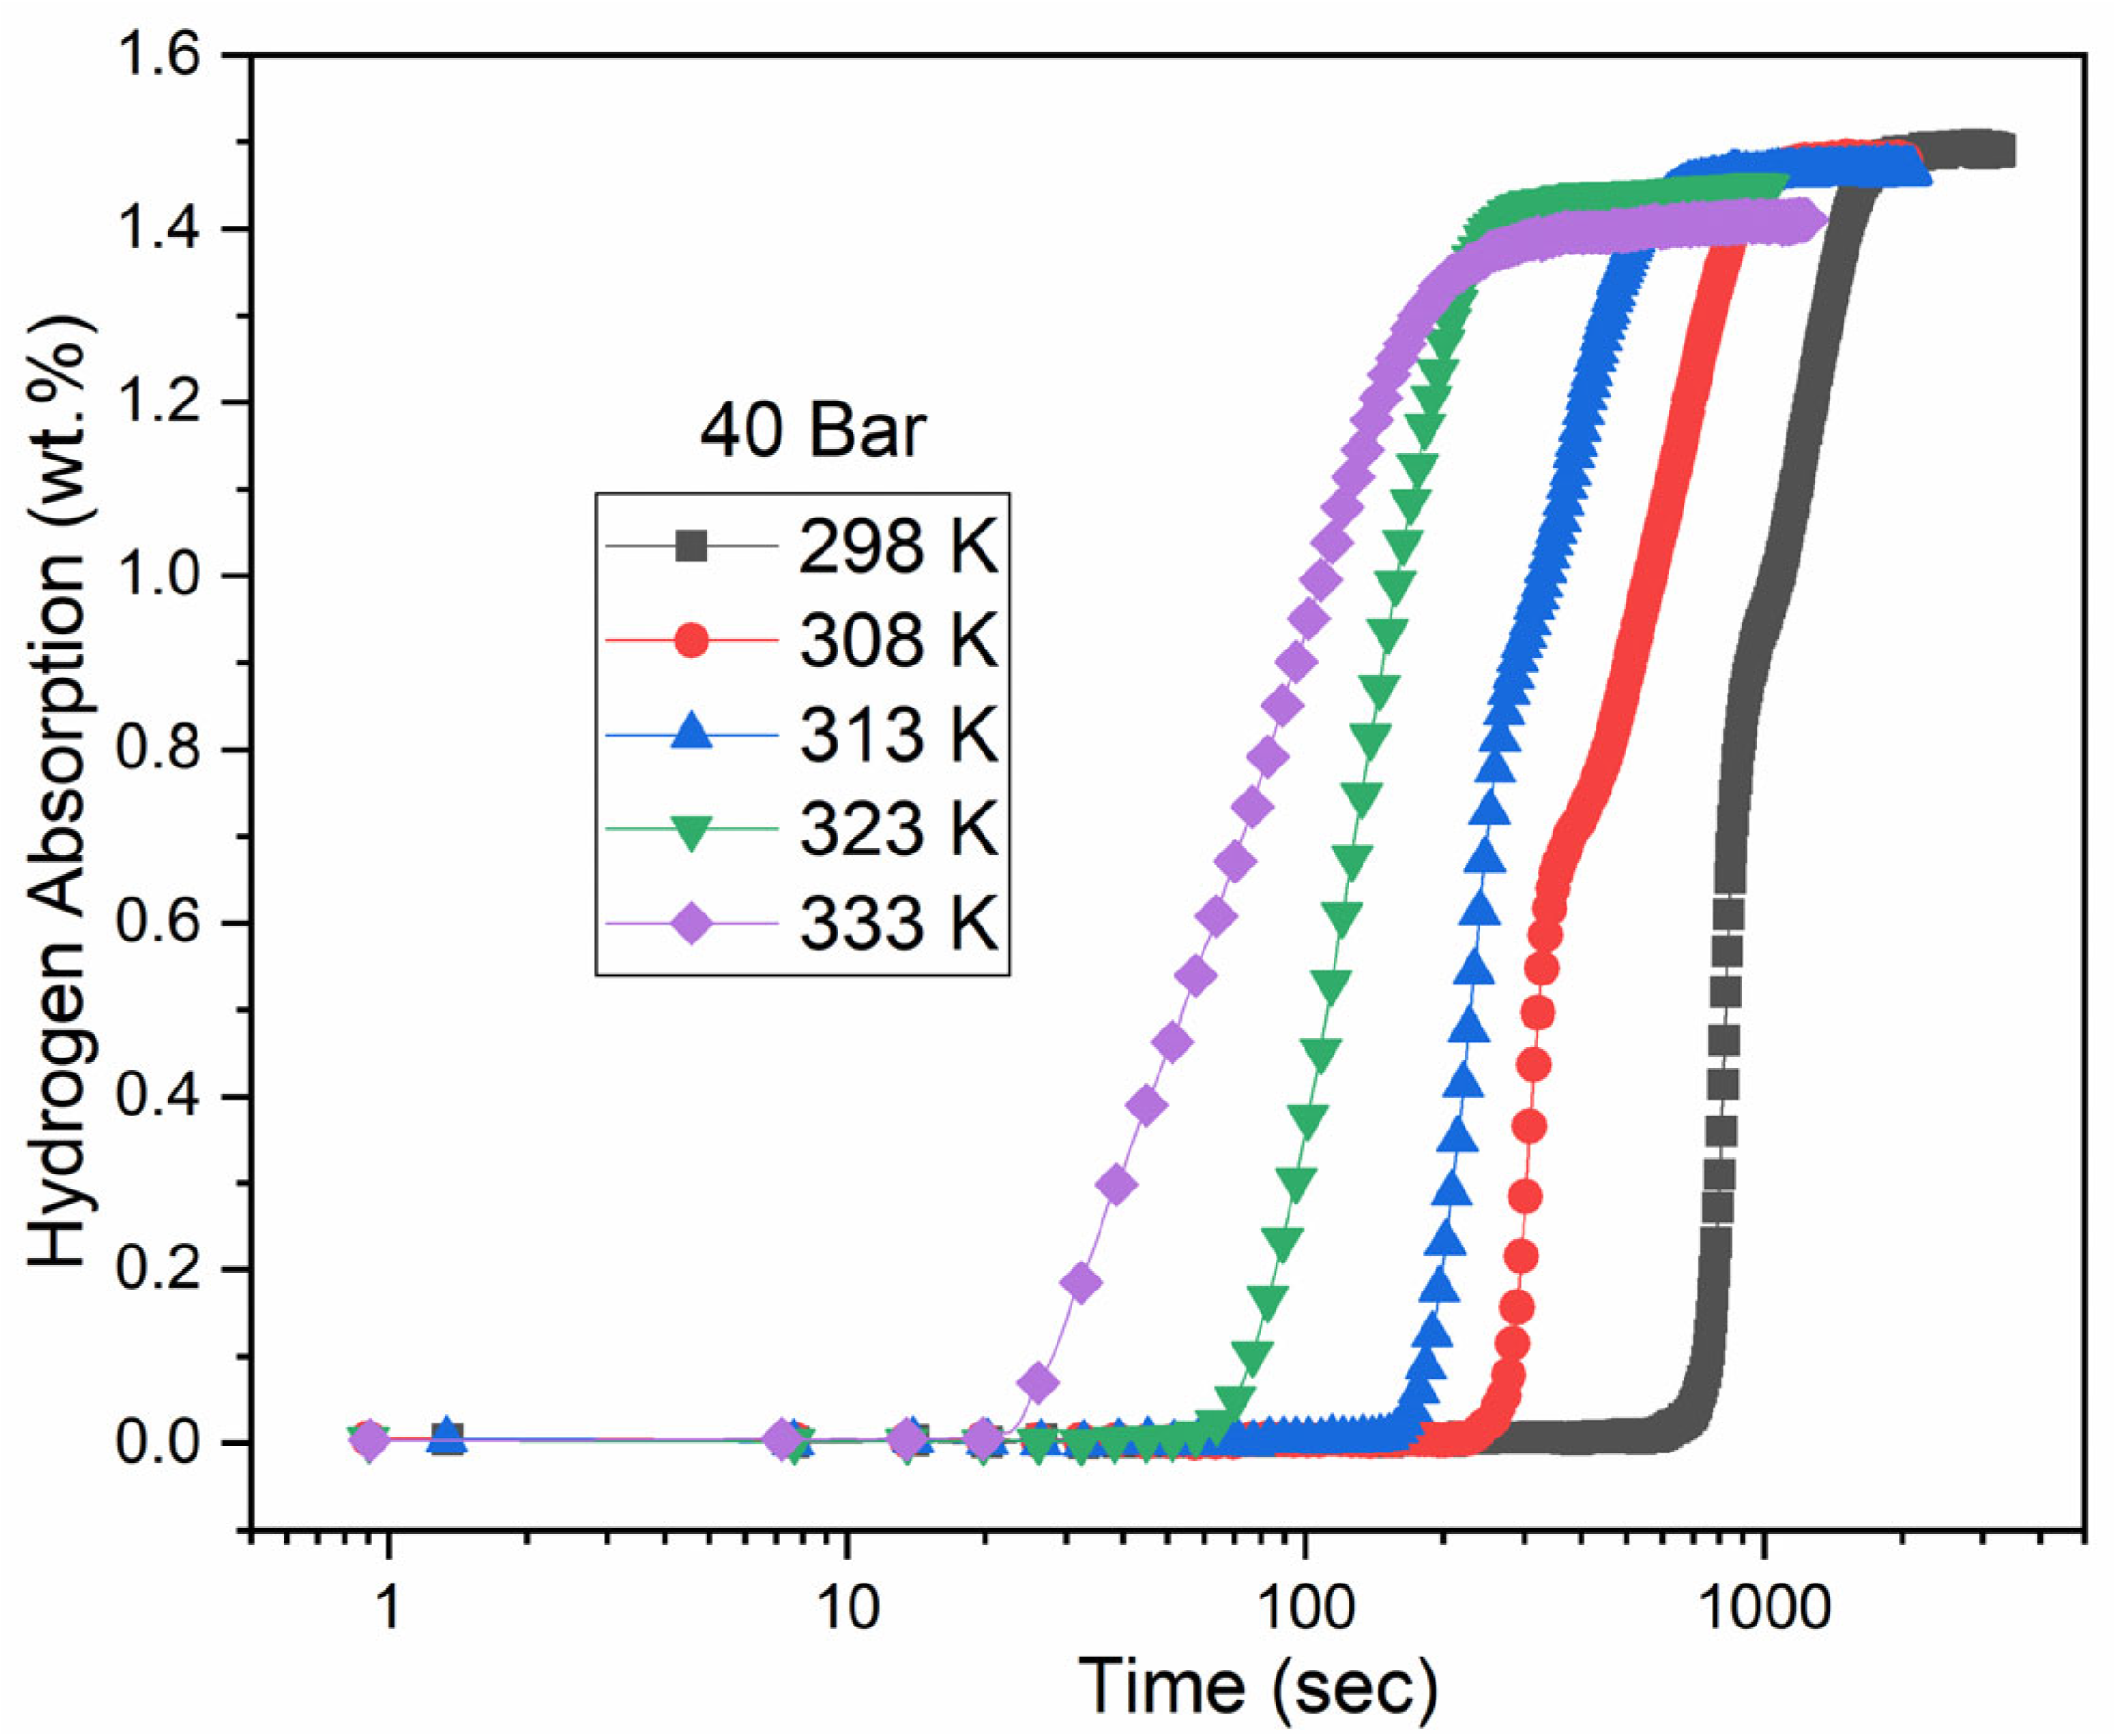
The activation curves under 40 bars are shown in Figure 2.
The differences between the curves are in their incubation time. Notably, distinct kinks are observed in the curves at 298 K, 308 K and 313 K. This kink may be related to the transition between the H/M = 1 to H/M = 2 hydride. However, these kinks appear at different capacities. Therefore, a dedicated investigation on this phenomenon should be undertaken.
The incubation time decreases with temperature, ranging from about 12 min at 25 °C to just a few seconds at 333 K. This observed variation in incubation time with temperature may suggest an Arrhenius-type mechanism. The Arrhenius equation is typically written as follows:
B = A e E A R T
where B is the rate constant of the reaction, and A is the pre-exponential factor or frequency factor. A represents the frequency of collisions of reacting molecules (s−1). EA is the activation energy in J/mol; it represents the minimum energy required for a reaction to occur. R is the universal gas constant 8.314  J/(mol·K) and T is the temperature (Kelvin). The Arrhenius equation helps in predicting how changes in temperature will affect the rate of a chemical reaction.
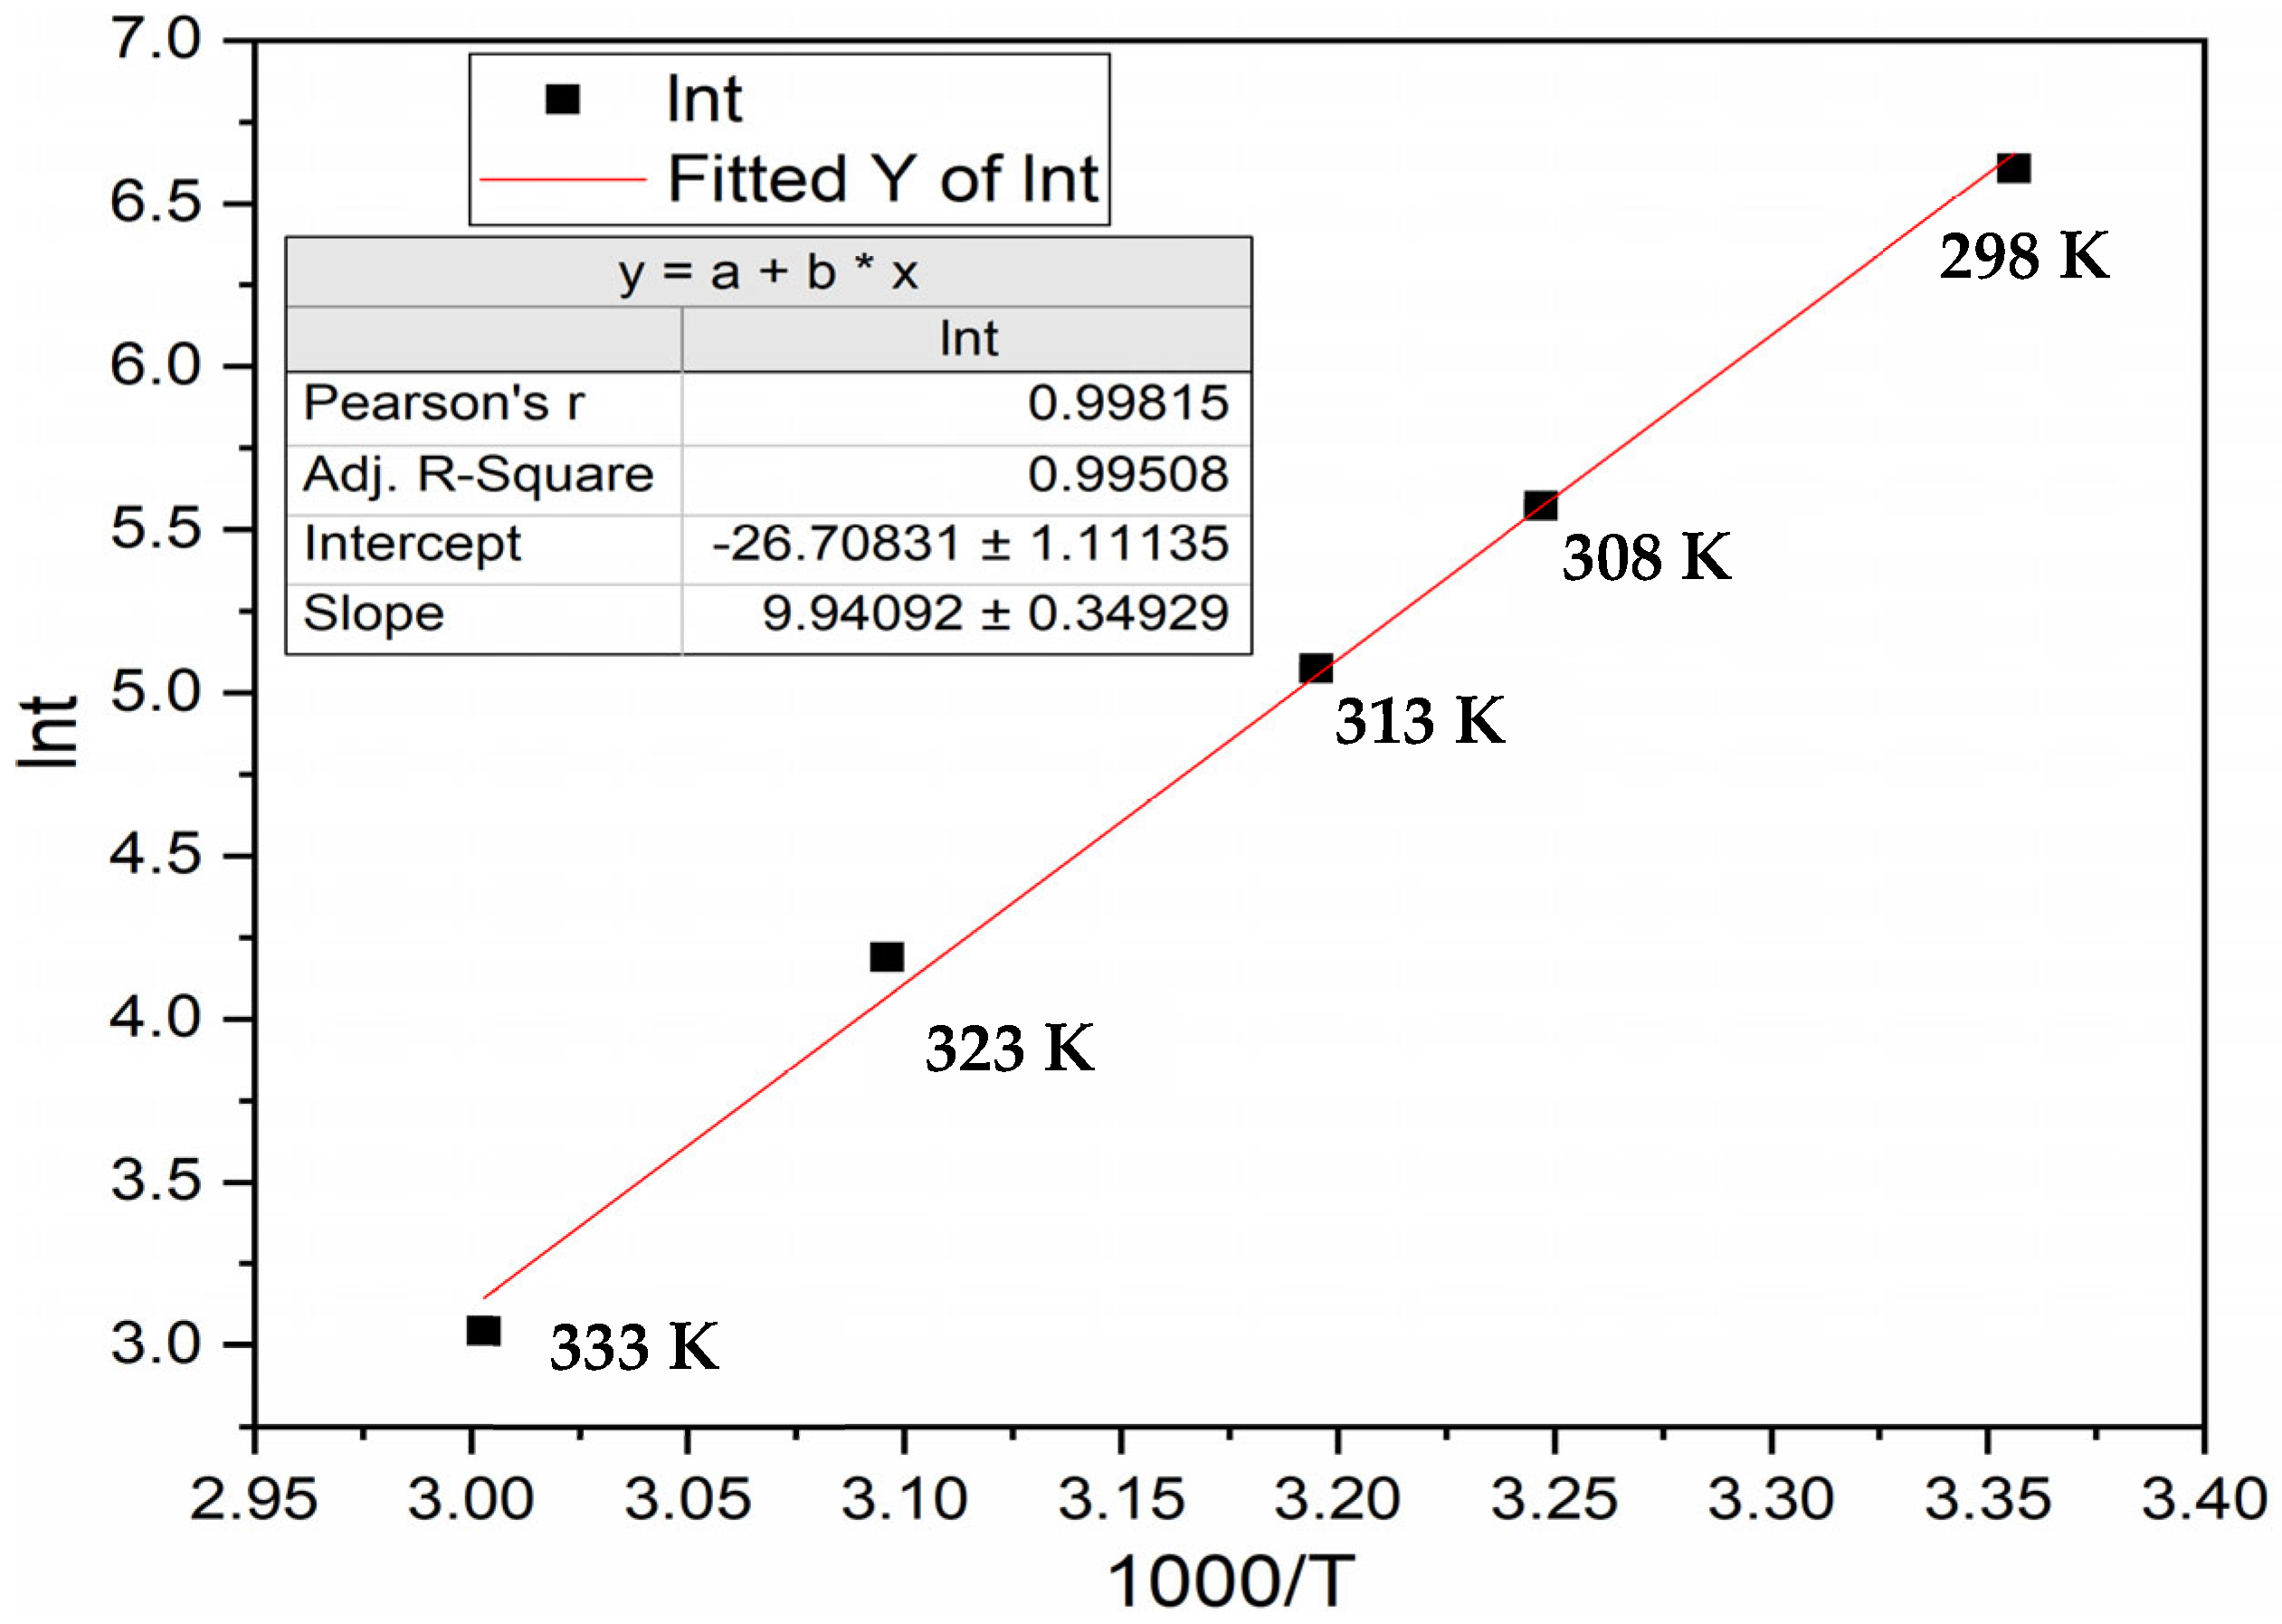
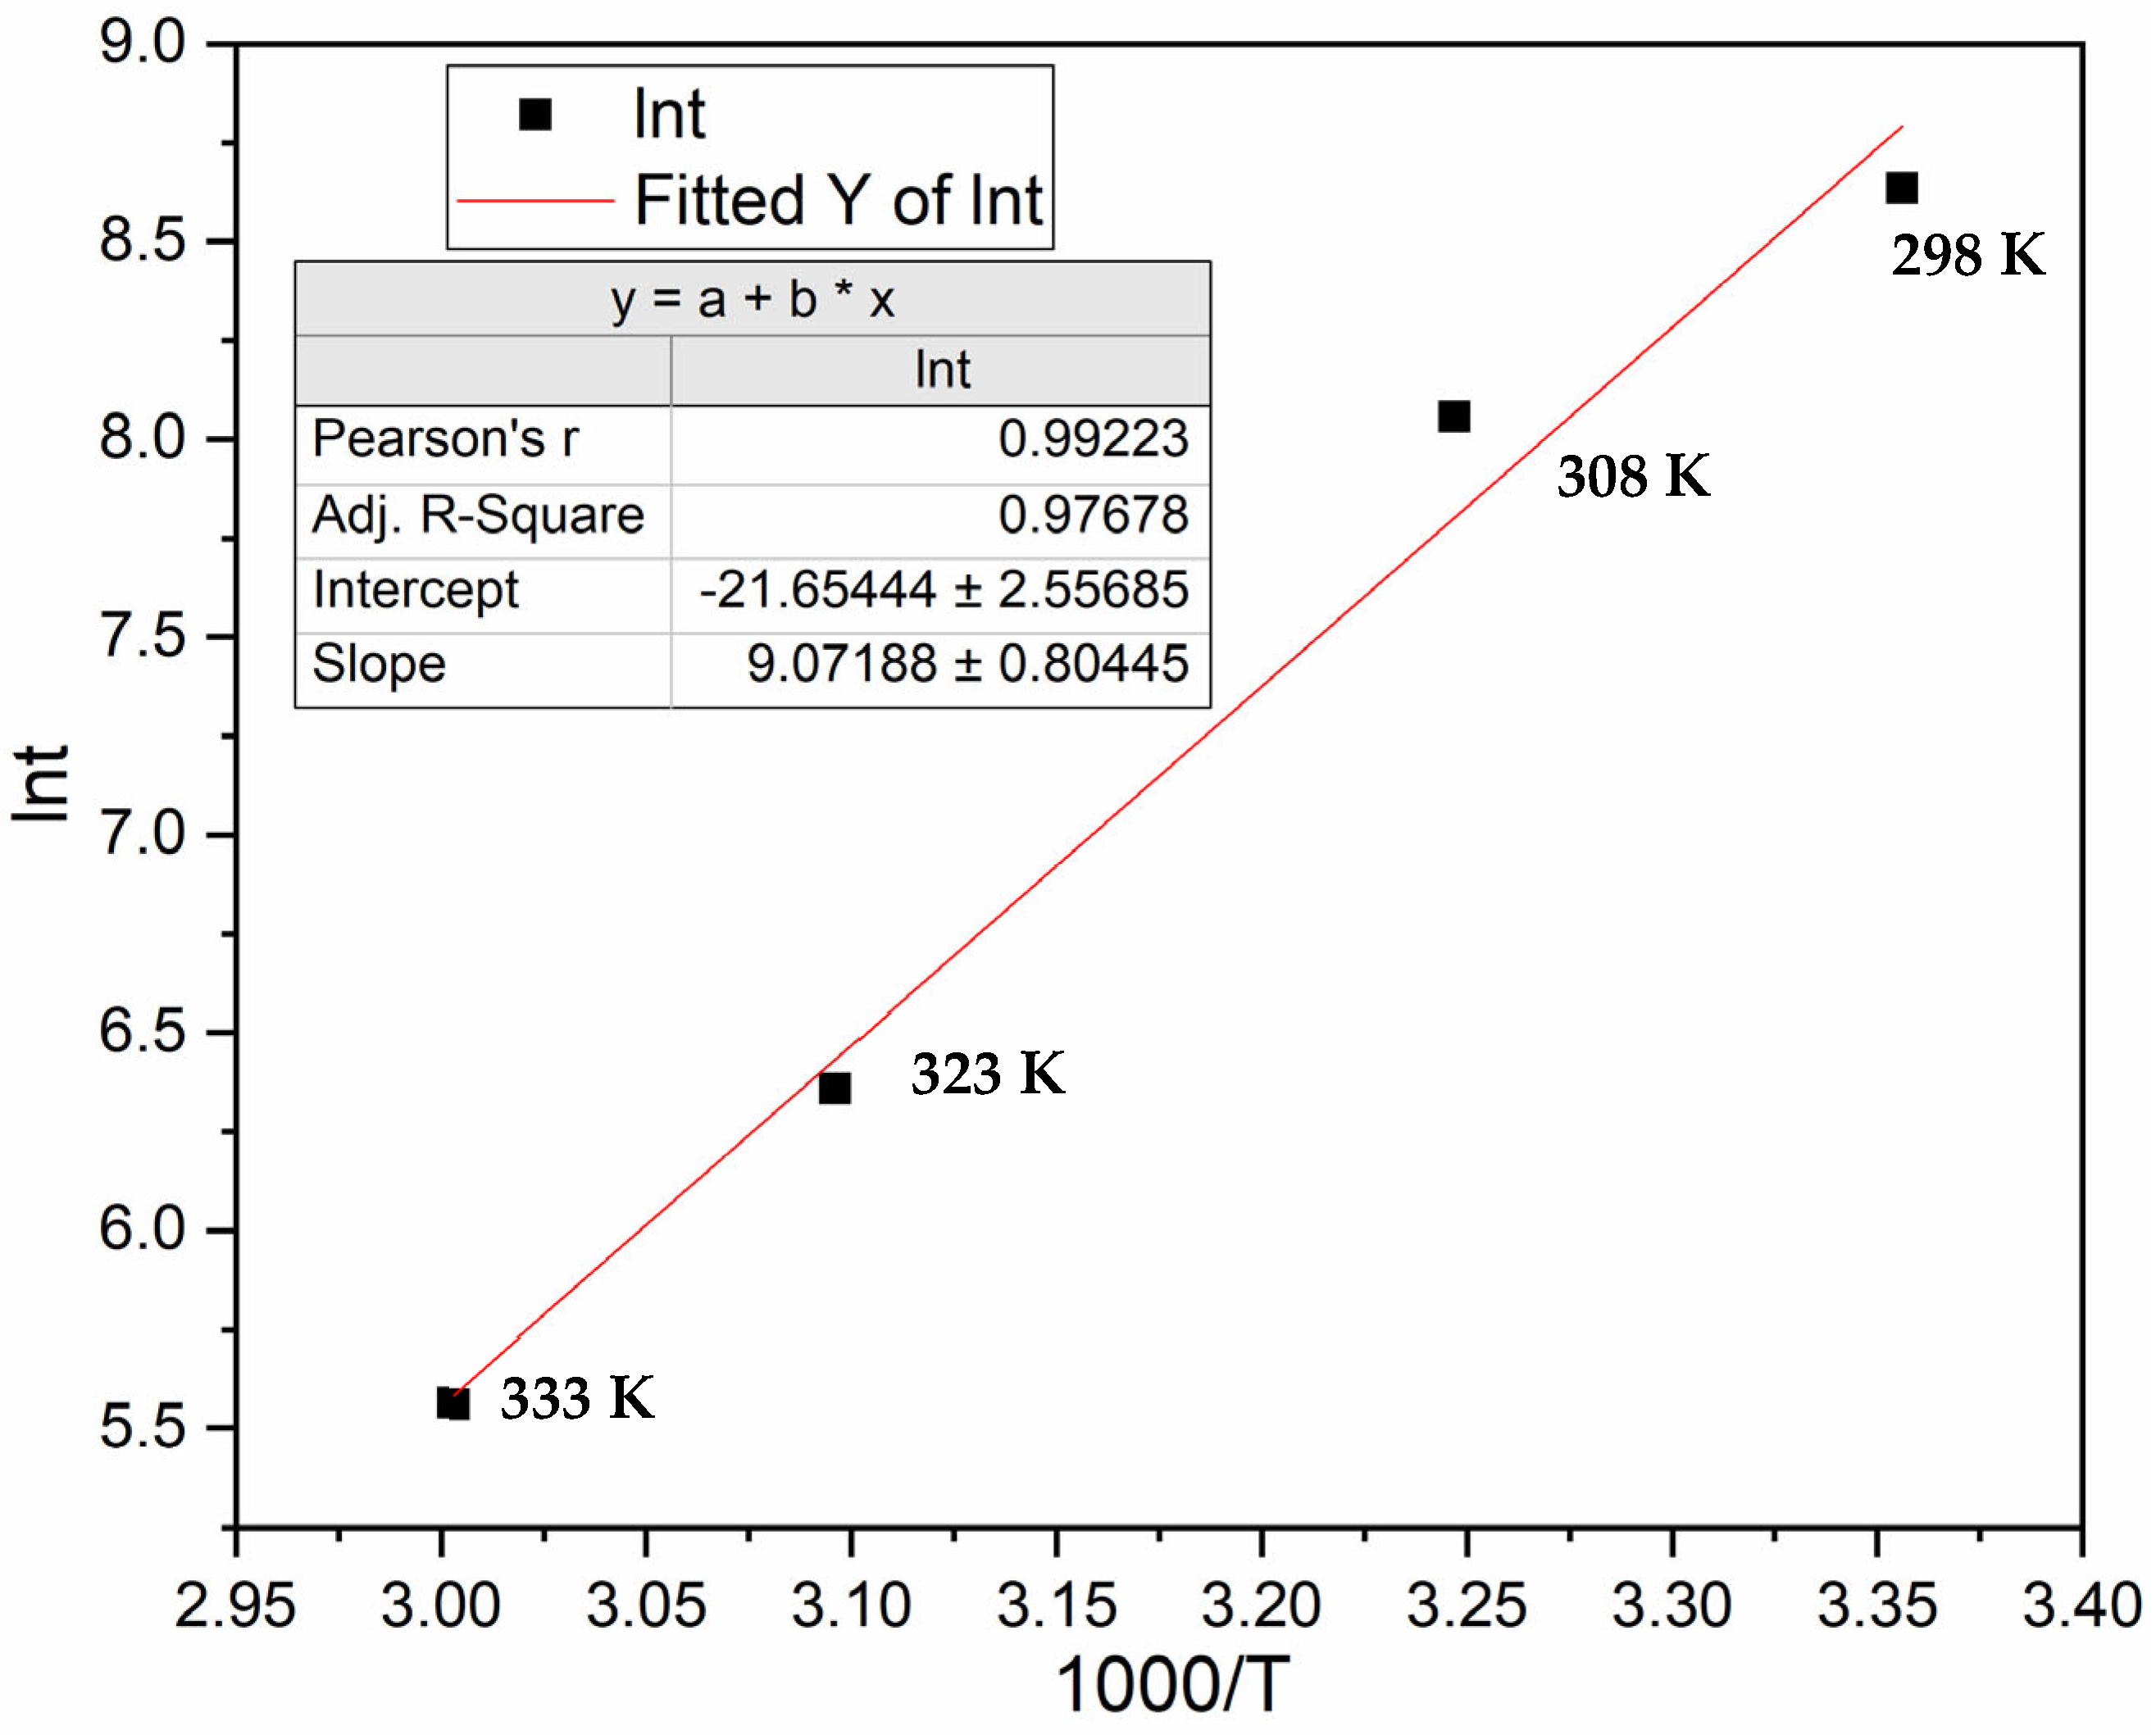
To verify if incubation time follows the Arrhenius equation, we plotted the incubation time as a function of 1000/T in Figure 3. Figure 3 shows the variation in ln t (incubation time) as a function of the inverse of temperature, following the Arrhenius law.
The incubation time can then be expressed by:
ln B = ln A E A R T  
At the end of the incubation time the reaction is complete, and we should have:
B t = 1
Thus, for the onset point (the time when the incubation is complete) we have:
ln t = ln B = ln A + E A R T
From the slope of the fitted line of Figure 3, we obtain EA = 83 ± 3 kJ/mol H2. From the intercept, the A value is 3.9 × 10¹¹ s−1 with a range from 1.3 × 10¹¹ to 1.2 × 10¹² s−1.

3.2.2. Hydrogen Pressure of 50 Bars

To study the impact of pressure on the activation energy and the pre-exponential factor, we conducted the activation under 50 bars. Figure 4 shows the activation curves conducted under 50 bars.
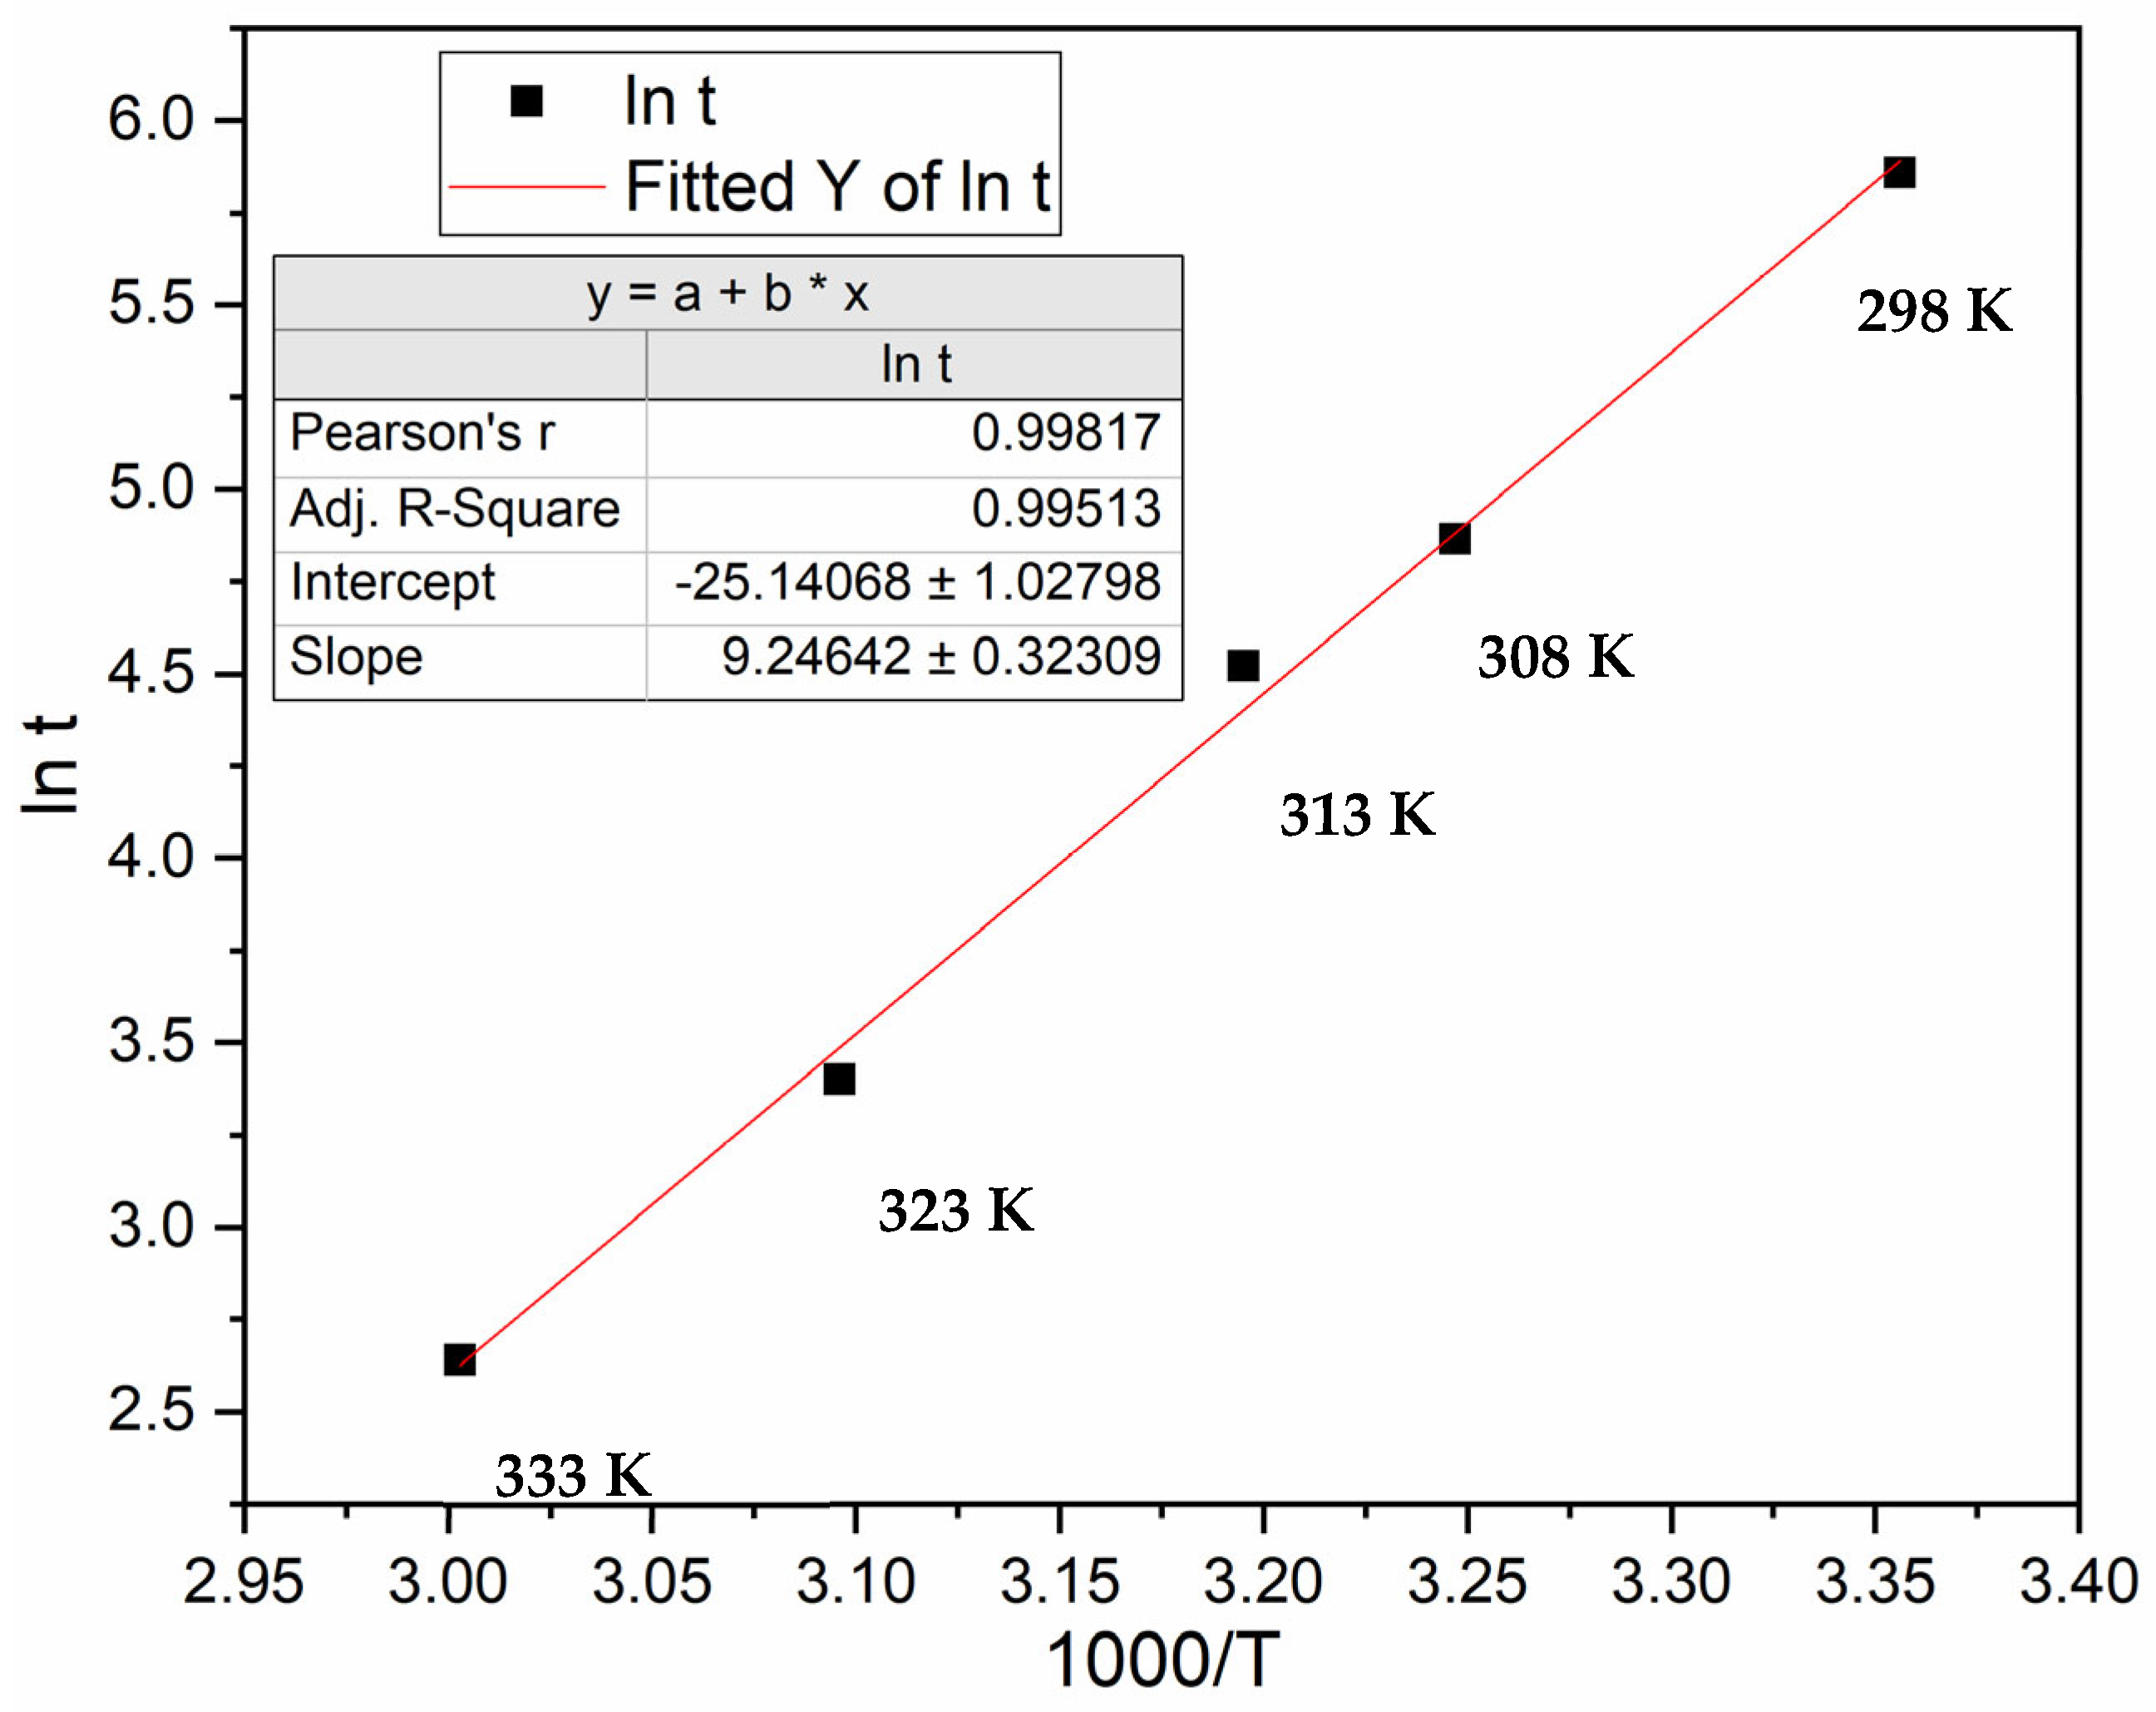
Here, no kinks are observed in the curves. Upon comparing Figure 3 and Figure 4, we observe a leftward shift in all the curves of Figure 4, indicating shorter incubation times compared to the curves obtained at 40 bars. To check the Arrhenius mechanism, we plotted the incubation time as a function of 1000/T in Figure 5.
The incubation time also follows Arrhenius mechanism. From the fitted slope, EA = 77 ± 3 kJ/mol H2. From the intercept, we obtain an A value of 8.2 × 10¹⁰ s−1 with a range from 3.0 × 10¹⁰ to 2.3 × 10¹¹ s−1.
Comparing these findings with the results obtained from Figure 3, it is evident that the activation energy EA values of 77 and 83 kJ/mol H2 are remarkably close, falling within their margin of error. Regarding the pre-exponential factor A values, there is a very small overlap in the ranges of these factors. It is noteworthy that A is linked to the frequency of molecular collisions, representing the number of reactions per second. This could explain the higher maximum A value for 50 bars of hydrogen pressure compared to 40 bars, indicating a greater number of collisions at the higher pressure.

3.3. Incubation Time under Constant Driving Force

In the context of absorption reactions in metal hydrides, the hydrogenation reaction could occur only if the applied pressure is higher than the equilibrium pressure of hydrogenation. As this equilibrium pressure of the reaction changes with temperature, if a constant pressure is applied at all temperatures, then the difference between the applied pressure and the equilibrium pressure of the hydride reaction changes, which may have a big impact of the reaction kinetics. The difference between the applied pressure and the equilibrium pressure is called the driving force and is given by the relation [29]:
C = T 1 P P e
where T is the temperature, P is the applied pressure, Pe is the equilibrium pressure and C is the driving force parameter.
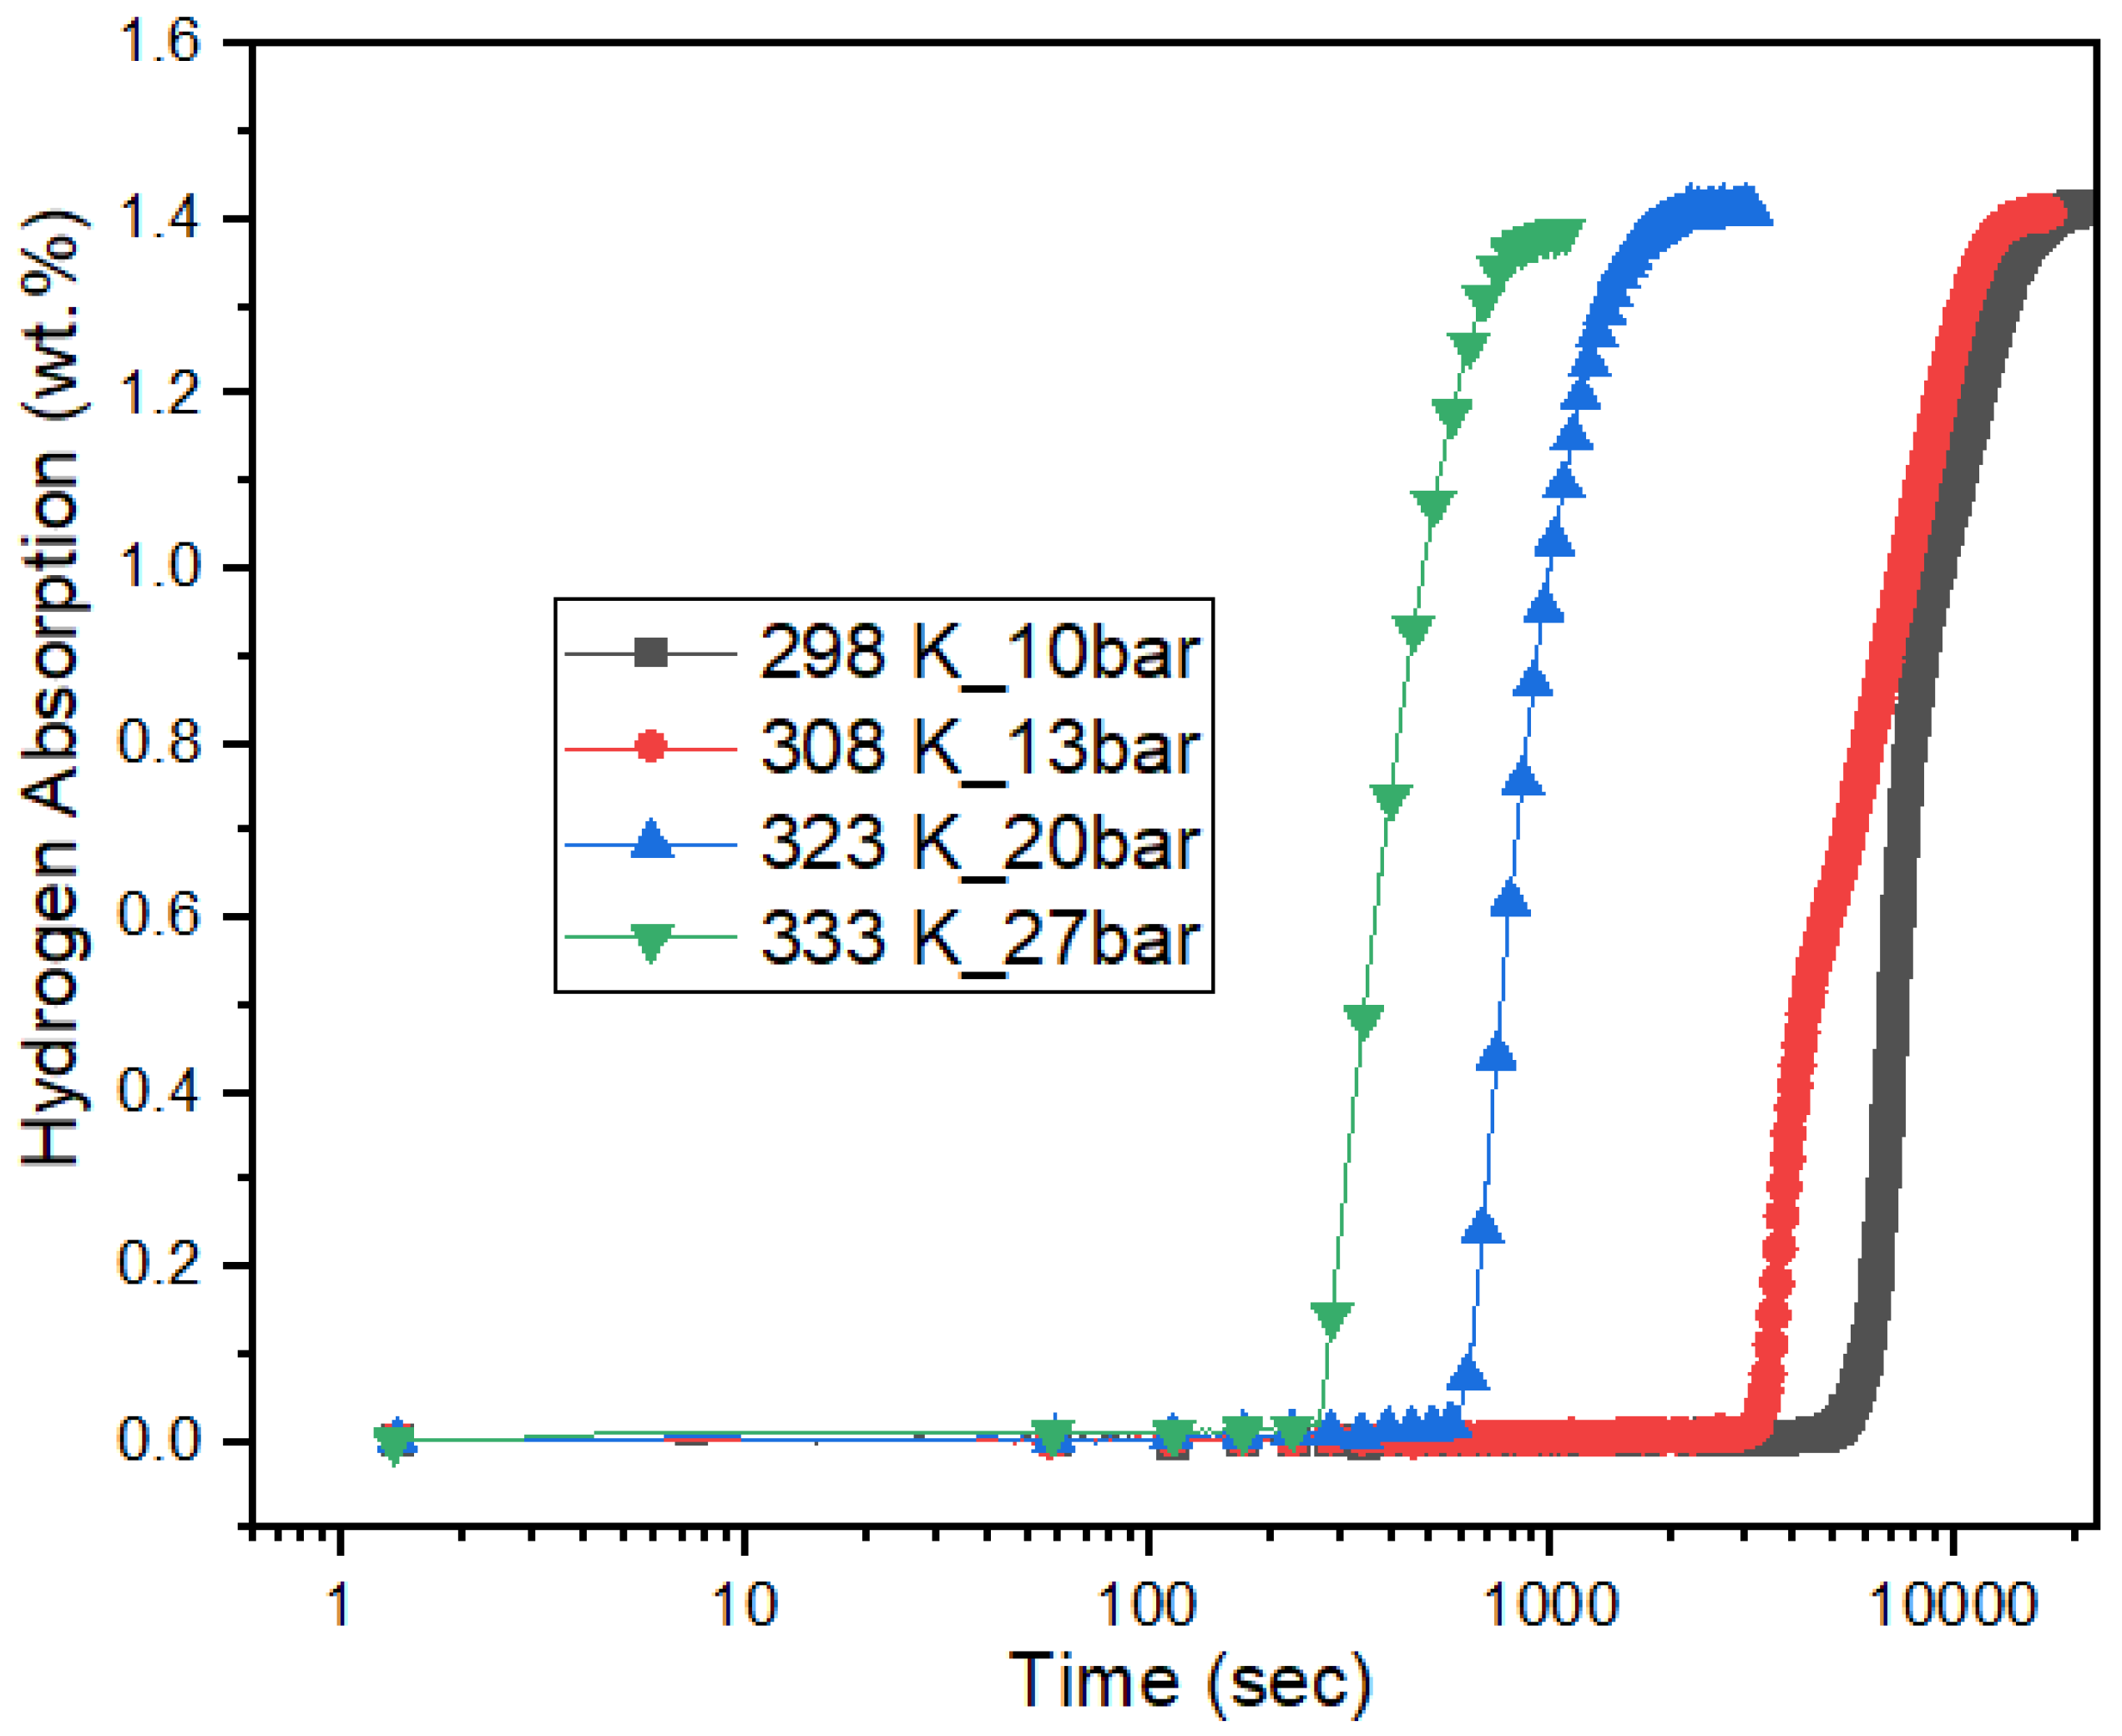
A higher “C” value suggests a stronger driving force for the absorption reaction. We used C = 170 for our measurements of incubation time under the same driving force. The results are shown in Figure 6.
In spite of a constant driving force, the incubation time decreases with increasing pressure and temperature. A kink is observed at lower temperatures and pressures. To check if the Arrhenius mechanism still holds, we plotted the incubation time as a function of 1000/T in Figure 7.
We see that the incubation time follows the Arrhenius mechanism again. From the fitted slope, EA = 75 ± 7 kJ/mol H2. From the intercept, we obtain an A value of 2.5 × 10⁹ s−1 with a range from 2.0 × 10⁸ to 3.3 × 10¹⁰ s−1. Referring to the results of Section 3.2, it appears that the activation energy is almost constant. This is reasonable, as EA should not change with temperature and pressure, but the values of the pre-exponential clearly change with the applied pressure. Thus, the pressure dependence of incubation time is in the pre-exponential factor A. For functional form, we assumed that the dependence of A on pressure follows a power law, so that:
A ( P ) = A 0 P P 0 x
where A0 and x are constants, P is the applied pressure and P0 = 1 bar.

3.4. Effect of Pressure on Incubation Time

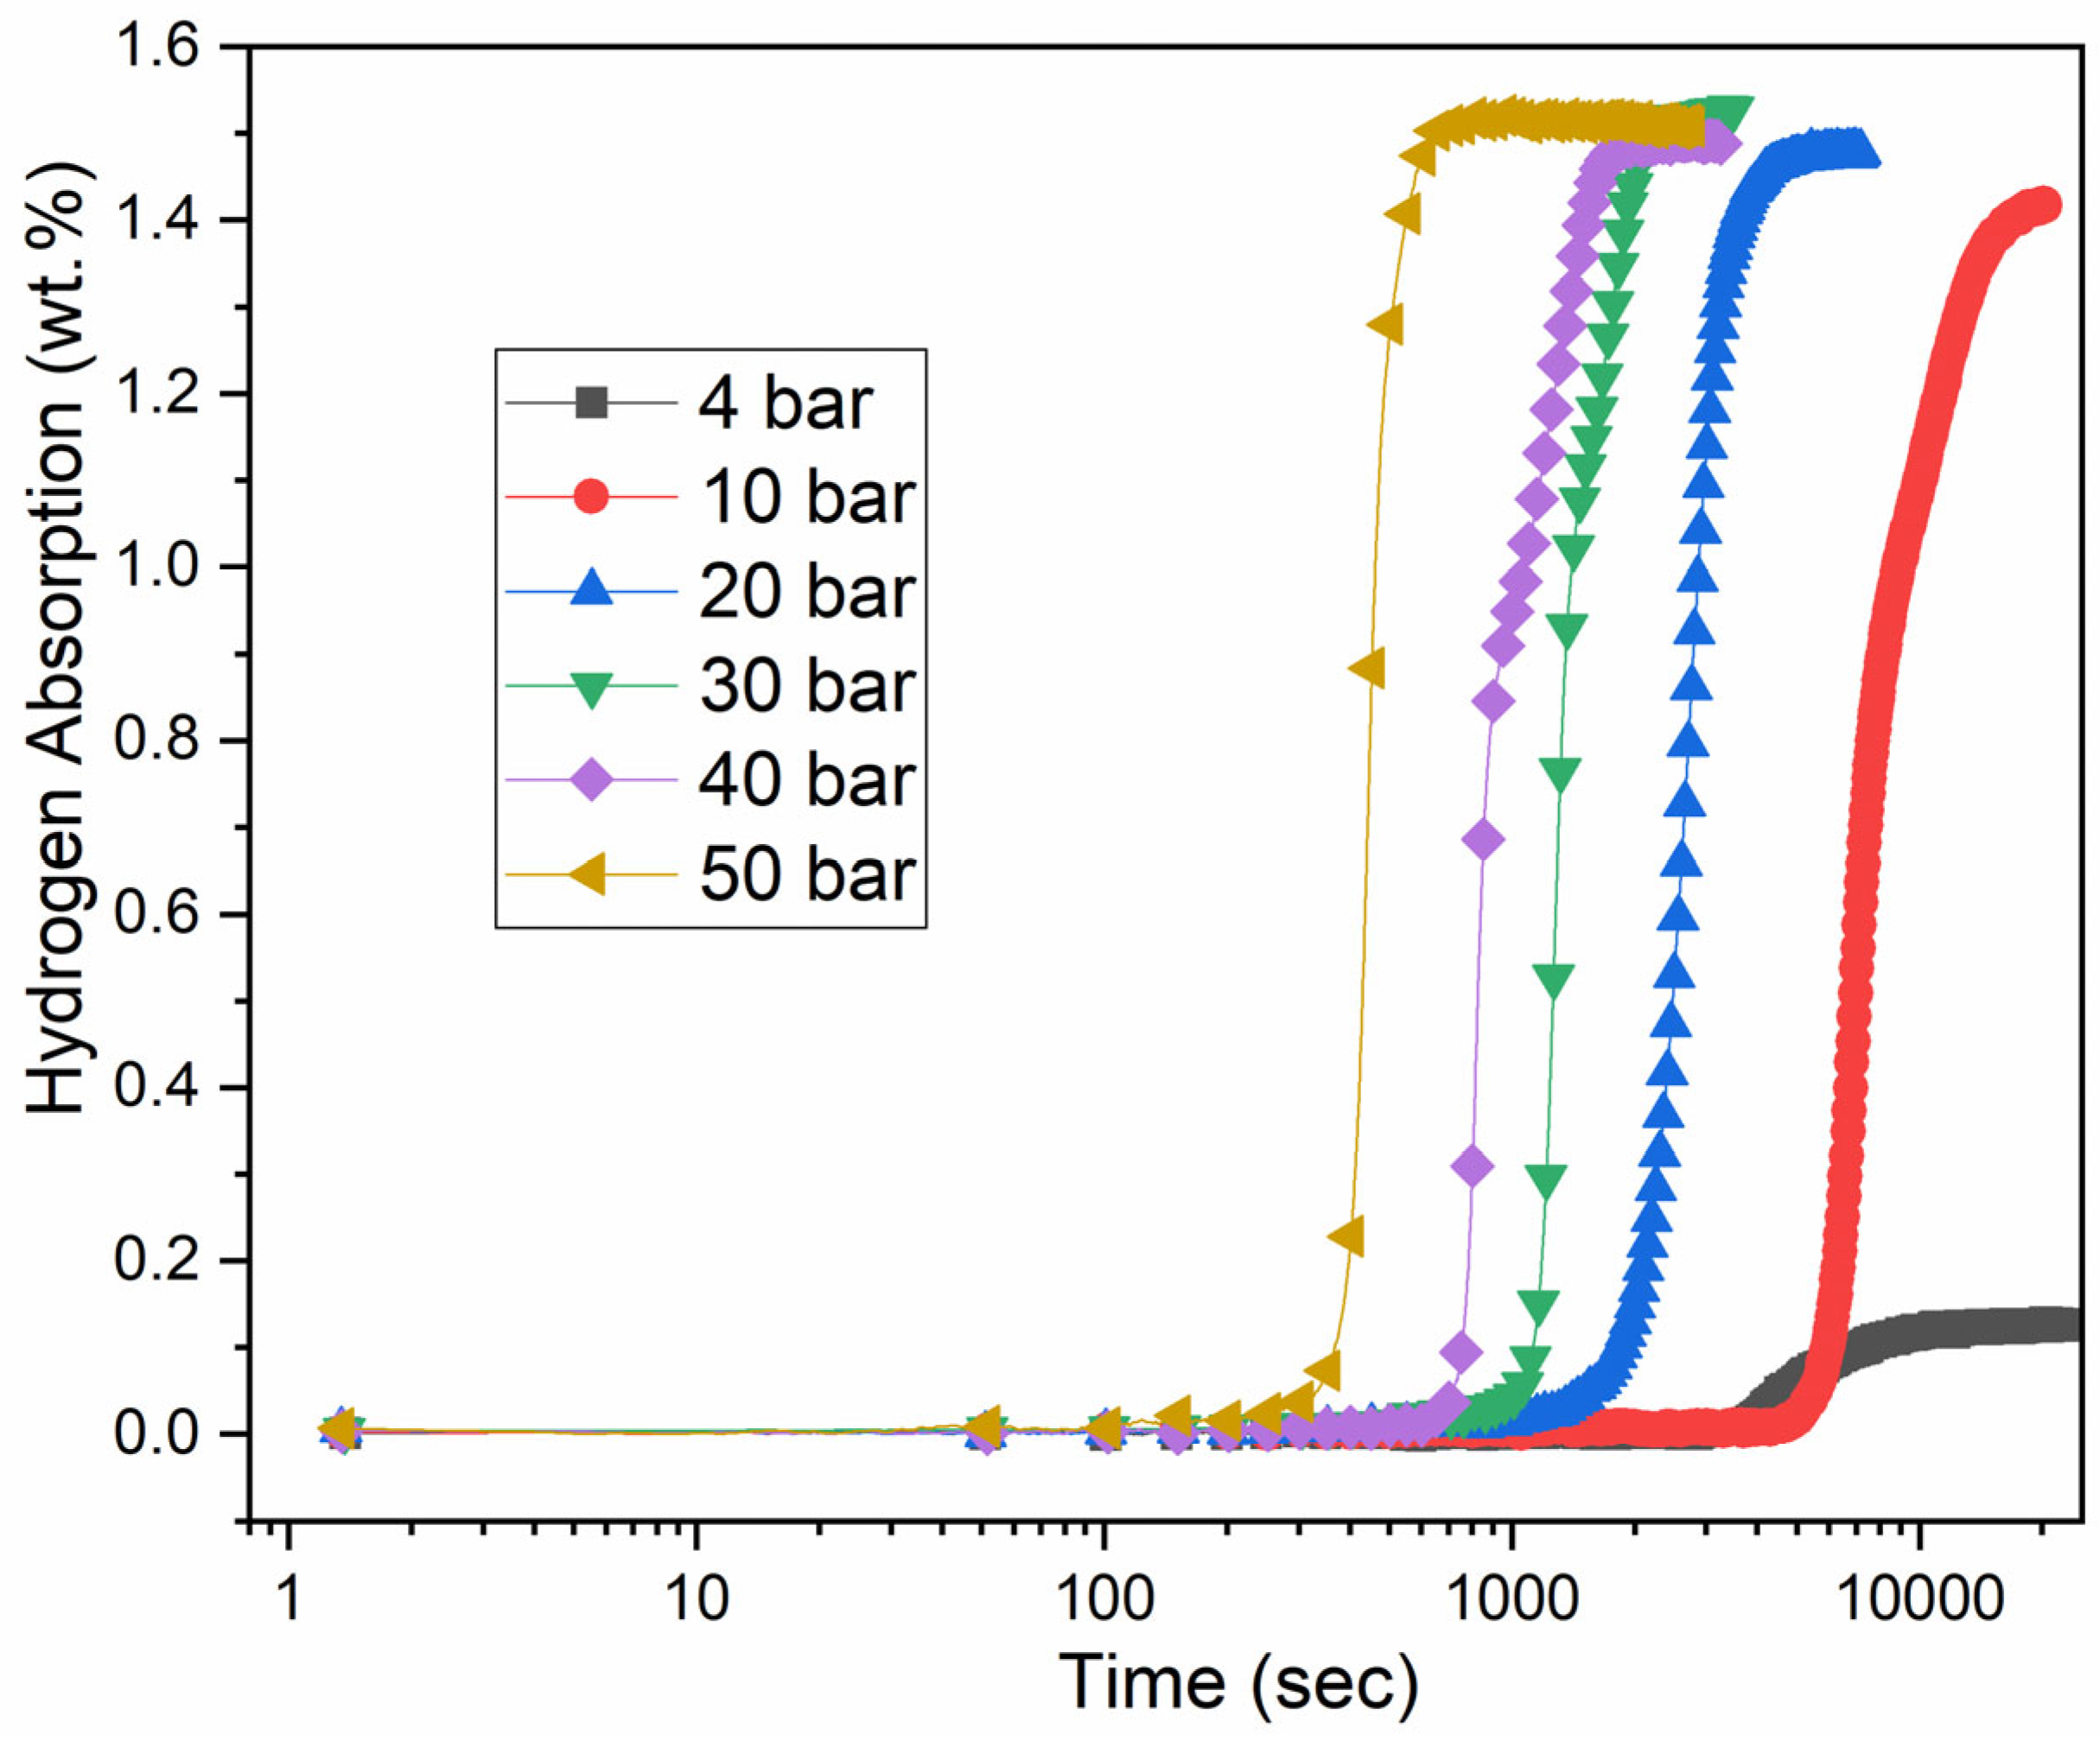
To study the impact of pressure on the incubation time, we conducted the activation at 298 K under 4, 10, 20, 30, 40 and 50 bars of hydrogen pressure. The activation curves are shown in Figure 8.
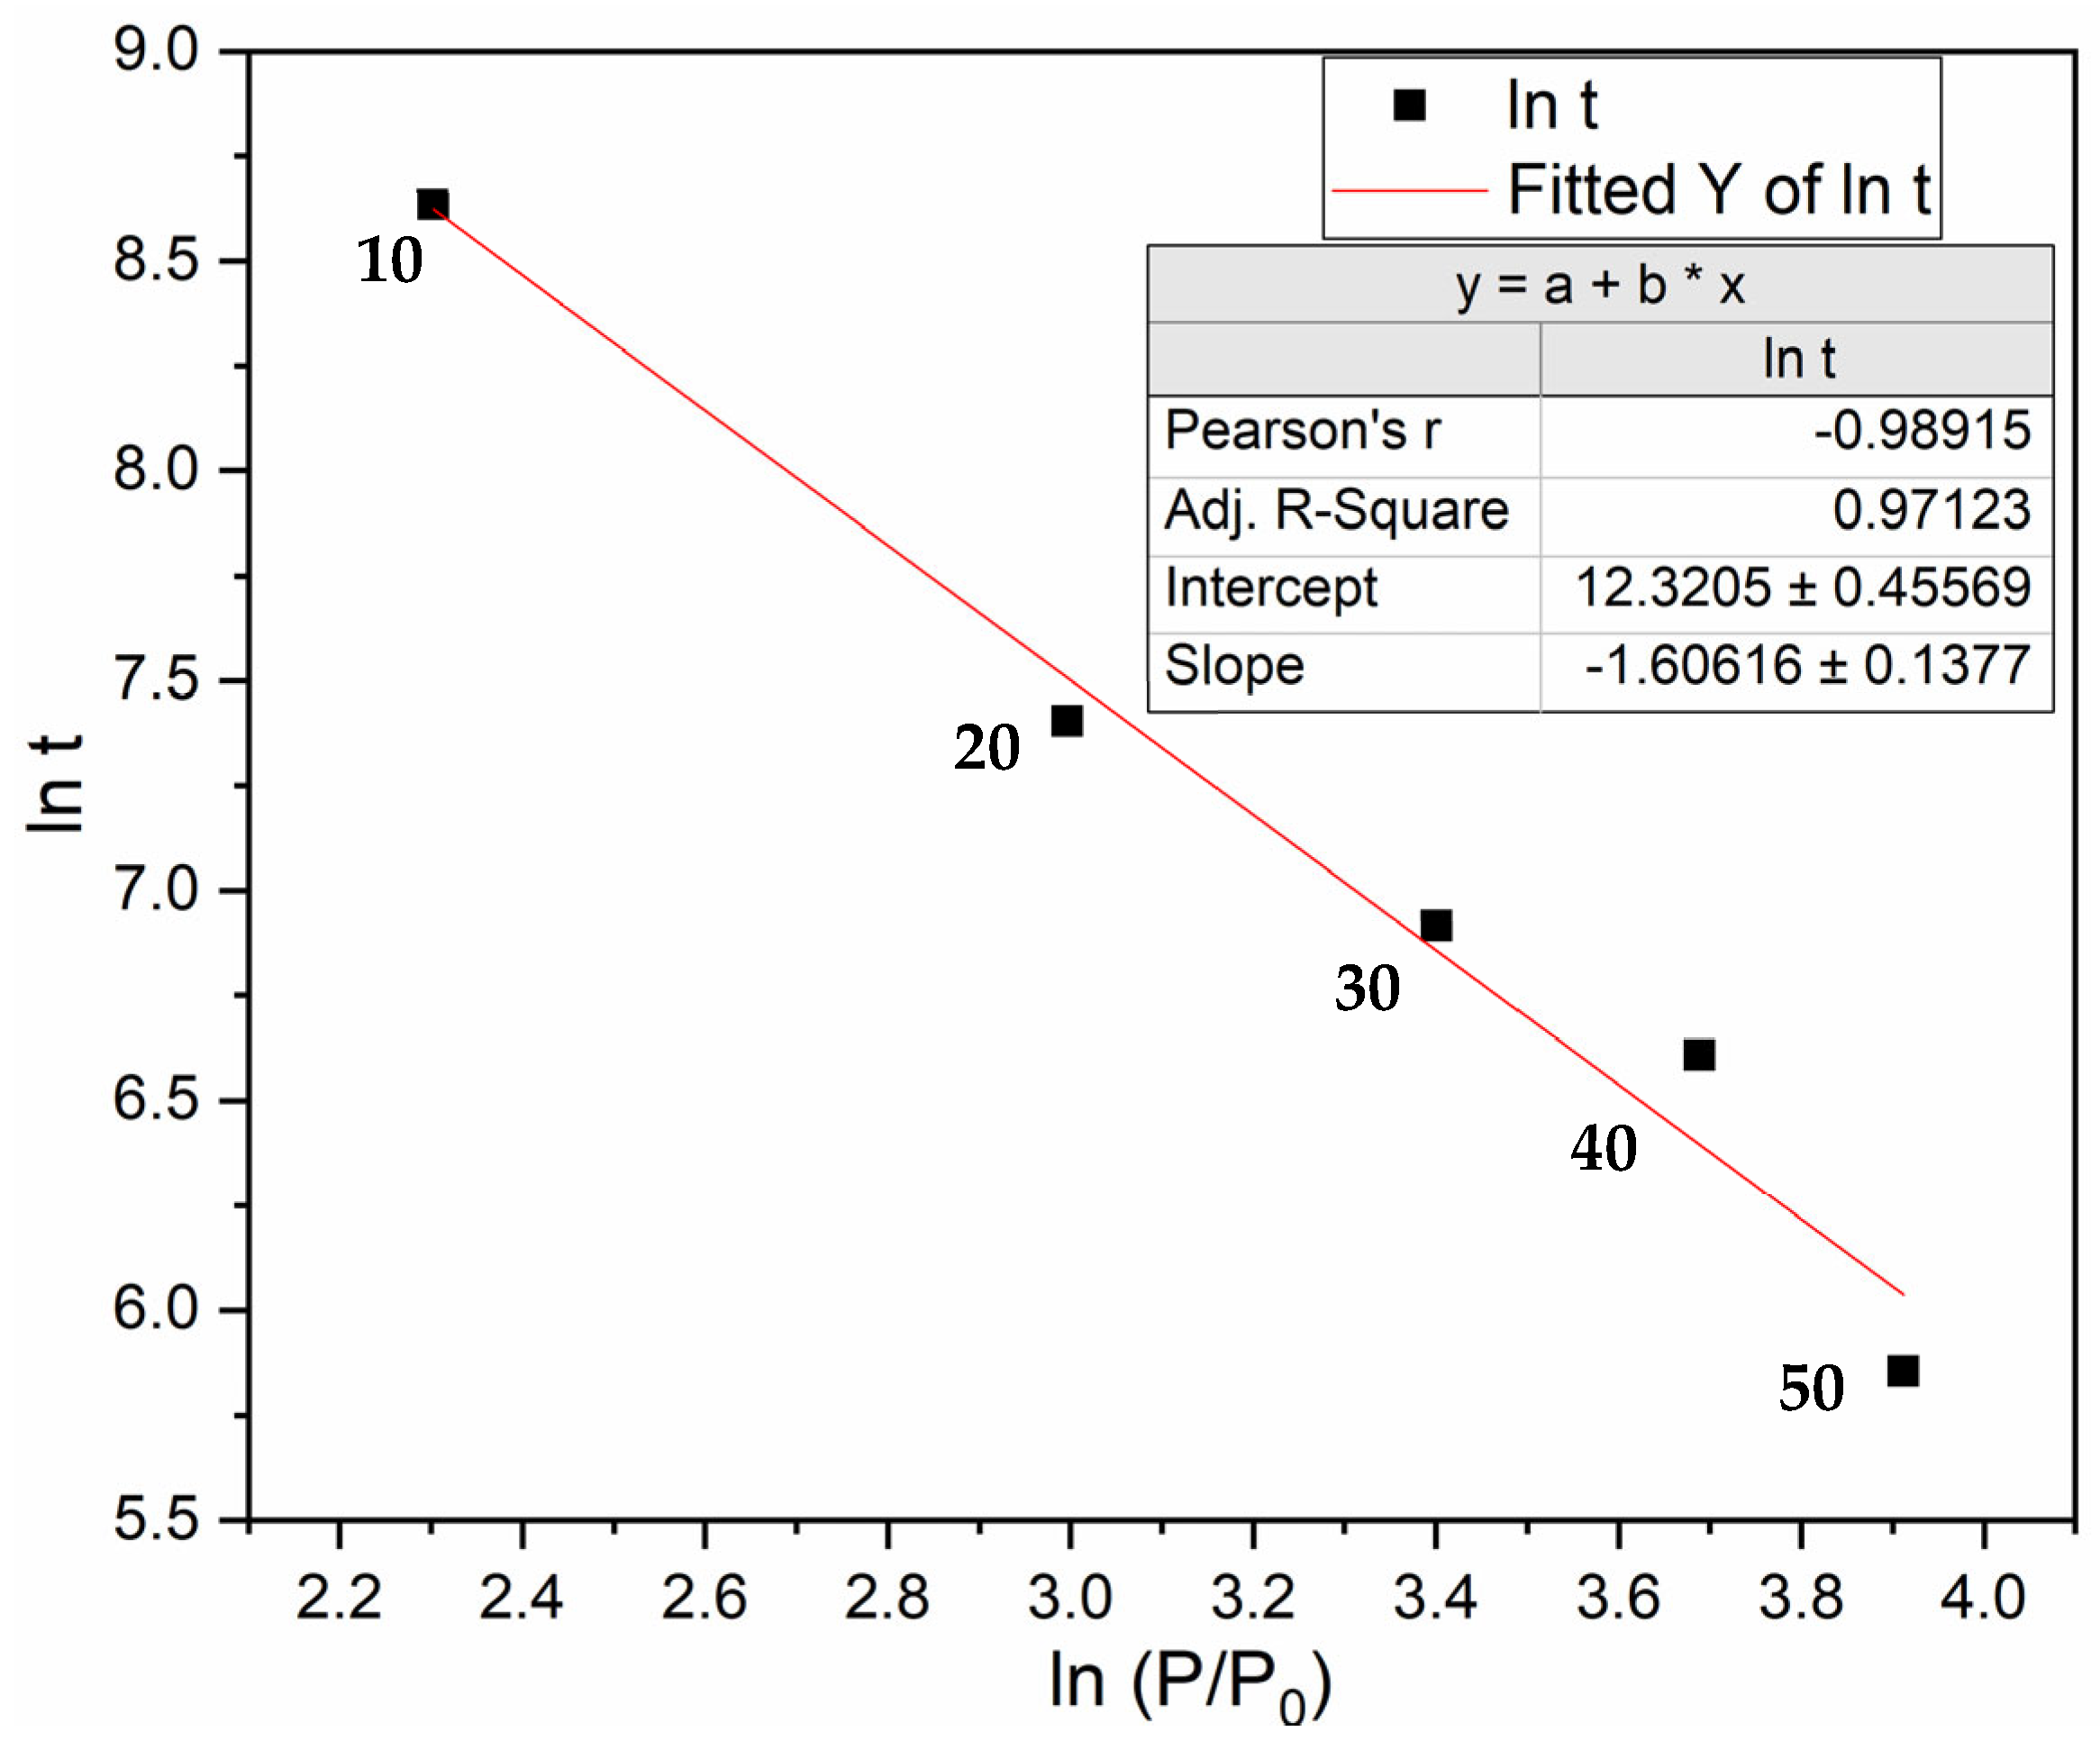
The sample did not absorb hydrogen under 4 bars of hydrogen pressure at 25 °C even after 24 h of hydrogen exposure. In this condition, the driving force C = 100 is probably too low and the reaction is kinetically limited. The activation became possible under 10 bars of pressure, with the sample starting to absorb hydrogen after an incubation time of approximately one and a half hours. We see that as the pressure increases, the incubation time decreases. We drew the variation in ln t as a function of ln P, as presented in Figure 9.
As the incubation time is always obeying Arrhenius law, substituting Equation (6) into Equation (4), we obtain:
ln t = E A R T ln A 0 x   l n P P 0
where P0 = 1 bar.
From the fitted slope, x = 1.6 ± 0.1 .
From the intercept, and taking EA of 78 kJ/mol H2, the A0 value is 2.1 × 10⁸ s−1 with a range from 1.3 × 10⁸ and 3.3 × 10⁸ s−1.
Thus, it seems that the pre-exponential factor A has a functional form of the type, as follows:
A = A 0 P P 0 1.6
From Equation (7) we see that, at a given temperature, when the applied pressure increases the ln (P/P0) increases, thus reducing the ln t value.
Table 1 presents the values of activation energy EA and pre-exponential factor A under 40 and 50 bars and at a constant driving force.
The values of the activation energy are constant within the experimental errors. The average value being 78 ± 4 kJ/mol H2. The dependence of incubation time on pressure is in the pre-exponential factor A and is given by Equation (8), where A0 = 2.1 × 10⁸ s−1.
The activation energy could be compared to the activation energy of a fully activated sample. Using a TG–DTA–MS system, Kumar et al. found an activation energy of 40 ± 7 kJ/mol H2 [30]. This seems to indicate that the presence of oxide on the surface adds a supplementary activation energy of 38 kJ/mol H2. This additional energy barrier can be attributed to the extra energy required for hydrogen to diffuse through the oxide layer. Thus, the overall activation energy EA of 78 kJ/mol H2 could be related to the combined processes of the diffusion through the oxide layer and hydrogenation reaction. As the pre-exponential factor was not reported by Kumar et al. [30], we could not verify if the presence of oxide also has an impact on this factor.

4. Conclusions

The effects of particle size, temperature, a constant driving force, and pressure on the activation of LaNi5 were investigated. It was found that bigger particles, with a diameter between 1250 μm and 2000 μm, activate quickly, but for a smaller particle size—less than 45 μm—the dependence of activation time on particle size is not clear. The impact of temperature on the incubation time is much clearer. It was found that the incubation time follows an Arrhenius relation, with activation EA = 78 ± 4 kJ/mol H2. This value is 38 kJ/mol H2 higher than the activation energy of hydrogenation of a well-cycled LaNi5 sample. The pre-exponential factor is pressure dependent. We propose a functional form for A = A 0 P P 0 1.6 with A0 = 2.1 × 10⁸ s−1, and the pressure dependence on A is (P/P0)1.6. As it is known that the incubation time changes with mechanical deformations, such as ball milling and cold rolling or with some form of heat treatment, it will be interesting to investigate which parameter (EA or A) is affected.

Author Contributions

All experiments, except electron microscopy, were performed by S.S. (Salma Sleiman) under the supervision of J.H. J.H., S.S. (Salma Sleiman) and S.S. (Samaneh Shahgaldi) analyzed the results and wrote the paper. All authors have read and agreed to the published version of the manuscript.

Funding

This research received no external funding.

Data Availability Statement

Data are available upon demand.

Acknowledgments

We would like to thank Kéziah Milette for the electron microscopy measurements.

Conflicts of Interest

The authors declare no conflicts of interest.

References

  1. Global Hydrogen Review 2023. Available online: https://www.iea.org/energy-system/low-emission-fuels/hydrogen (accessed on 31 July 2023).
  2. Hirscher, M.; Yartys, V.A.; Baricco, M.; von Colbe, J.B.; Blanchard, D.; Bowman, R.C., Jr.; Broom, D.P.; Buckley, C.E.; Chang, F.; Chen, P. Materials for hydrogen-based energy storage–past, recent progress and future outlook. J. Alloys Compd. 2020, 827, 153548. [Google Scholar] [CrossRef]
  3. Züttel, A.; Remhof, A.; Borgschulte, A.; Friedrichs, O. Hydrogen: The future energy carrier. Philos. Trans. R. Soc. Lond. A Math. Phys. Eng. Sci. 2010, 368, 3329–3342. [Google Scholar] [CrossRef] [PubMed]
  4. Abe, J.O.; Popoola, A.P.I.; Ajenifuja, E.; Popoola, O.M. Hydrogen energy, economy and storage: Review and recommendation. Int. J. Hydrogen Energy 2019, 44, 15072–15086. [Google Scholar] [CrossRef]
  5. Tarasov, B.P.; Fursikov, P.V.; Volodin, A.A.; Bocharnikov, M.S.; Shimkus, Y.Y.; Kashin, A.M.; Yartys, V.A.; Chidziva, S.; Pasupathi, S.; Lototskyy, M.V. Metal hydride hydrogen storage and compression systems for energy storage technologies. Int. J. Hydrogen Energy 2021, 46, 13647–13657. [Google Scholar] [CrossRef]
  6. Van Vucht, J.H.; Kuijpers, F.; Bruning, H.C. Reversible room-temperature absorption of large quantities of hydrogen by intermetallic compounds. Philips Res. Rep. 1970, 25, 133–140. [Google Scholar]
  7. Joubert, J.-M.; Paul-Boncour, V.; Cuevas, F.; Zhang, J.; Latroche, M. LaNi5 related AB5 compounds: Structure, properties and applications. J. Alloys Compd. 2021, 862, 158163. [Google Scholar] [CrossRef]
  8. Joubert, J.M.; Latroche, M.; Percheron-Guégan, A. Metallic hydrides ii: Materials for electrochemical storage. MRS Bull. 2002, 27, 694–698. [Google Scholar] [CrossRef]
  9. Miura, S.; Fujisawa, A.; Ishida, M. A hydrogen purification and storage system using metal hydride. Int. J. Hydrogen Energy 2012, 37, 2794–2799. [Google Scholar] [CrossRef]
  10. Shahgaldi, S.; Yaakob, Z.; Mat Jalil, N.; Tasirin, S.M. Synthesis of high-surface-area hexagonal LaNi5 nanofibers via electrospinning. J. Alloys Compd. 2012, 541, 335–337. [Google Scholar] [CrossRef]
  11. Ikeda, K.; Ohshita, H.; Otomo, T.; Sakaki, K.; Kim, H.; Nakamura, Y.; Machida, A.; Von Dreele, R.B. Pressure cells for in situ neutron total scattering: Time and real-space resolution during deuterium absorption. J. Appl. Crystallogr. 2022, 55, 1631–1639. [Google Scholar] [CrossRef]
  12. Joubert, J.M.; Latroche, M.; Černý, R.; Percheron-Guégan, A.; Yvon, K. Hydrogen cycling induced degradation in LaNi5-type materials. J. Alloys Compd. 2002, 330–332, 208–214. [Google Scholar] [CrossRef]
  13. Liang, G.; Huot, J.; Schulz, R. Hydrogen storage properties of the mechanically alloyed LaNi5-based materials. J. Alloys Compd. 2001, 320, 133–139. [Google Scholar] [CrossRef]
  14. Van Mal, H.H.; Buschow, K.H.J.; Miedema, A.R. Hydrogen absorption in LaNi5 and related compounds: Experimental observations and their explanation. J. Less Common Met. 1974, 35, 65–76. [Google Scholar] [CrossRef]
  15. Rusman, N.A.A.; Dahari, M. A review on the current progress of metal hydrides material for solid-state hydrogen storage applications. Int. J. Hydrogen Energy 2016, 41, 12108–12126. [Google Scholar] [CrossRef]
  16. Tousignant, M.; Huot, J. Hydrogen sorption enhancement in cold rolled LaNi5. J. Alloys Compd. 2014, 595, 22–27. [Google Scholar] [CrossRef]
  17. Lv, P.; Huot, J. Hydrogenation improvement of tife by adding ZrMn2. Energy 2017, 138, 375–382. [Google Scholar] [CrossRef]
  18. Montero, J.; Ek, G.; Sahlberg, M.; Zlotea, C. Improving the hydrogen cycling properties by Mg addition in Ti-V-Zr-Nb refractory high entropy alloy. Scr. Mater. 2021, 194, 113699. [Google Scholar] [CrossRef]
  19. Sleiman, S.; Huot, J. Effect of particle size, pressure and temperature on the activation process of hydrogen absorption in TiVZrHfNb high entropy alloy. J. Alloys Compd. 2021, 861, 158615. [Google Scholar] [CrossRef]
  20. Sun, Z.; Lu, X.; Nyahuma, F.M.; Yan, N.; Xiao, J.; Su, S.; Zhang, L. Enhancing hydrogen storage properties of MgH2 by transition metals and carbon materials: A brief review. Front. Chem. 2020, 8, 552. [Google Scholar] [CrossRef]
  21. Huot, J. Enhancing Hydrogen Storage Properties of Metal Hybrides: Enhancement by Mechanical Deformations; Springer: Berlin/Heidelberg, Germany, 2016. [Google Scholar]
  22. Sleiman, S.; Aliouat, A.; Huot, J. Enhancement of first hydrogenation of Ti1V0.9Cr1.1 BCC alloy by cold rolling and ball milling. Materials 2020, 13, 3106. [Google Scholar] [CrossRef]
  23. Dixit, V.; Huot, J. Investigation of the microstructure, crystal structure and hydrogenation kinetics of Ti-V-Cr alloy with Zr addition. J. Alloys Compd. 2019, 785, 1115–1120. [Google Scholar] [CrossRef]
  24. Shelyapina, M.; Dost, A.; Skryabina, N.; Privalov, A.; Vogel, M.; Fruchart, D. Effect of Zr7Ni10 additive on hydrogen mobility in (TiCr1.8)1-xVx (x= 0.2, 0.4, 0.6, 0.8): An 1H NMR SFG study. Int. J. Hydrogen Energy 2020, 45, 7929–7937. [Google Scholar] [CrossRef]
  25. Sleiman, S.; Huot, J. Microstructure and hydrogen storage properties of Ti1V0.9Cr1.1 alloy with addition of x wt % Zr (x = 0, 2, 4, 8, and 12). Inorganics 2017, 5, 86. [Google Scholar] [CrossRef]
  26. Balcerzak, M. Hydrogenation properties of nanocrystalline TiVMn body-centered-cubic alloys. Int. J. Hydrogen Energy 2020, 45, 15521–15529. [Google Scholar] [CrossRef]
  27. Strozi, R.B.; Ivanisenko, J.; Koudriachova, N.; Huot, J. Effect of HPT on the first hydrogenation of LaNi5 metal hydride. Energies 2021, 14, 6710. [Google Scholar] [CrossRef]
  28. Broom, D.P. Hydrogen Storage Materials: The Characterisation of Their Storage Properties; Springer: Berlin/Heidelberg, Germany, 2011; Volume 1. [Google Scholar]
  29. Rudman, P. Hydrogen-diffusion-rate-limited hydriding and dehydriding kinetics. J. Appl. Phys. 1979, 50, 7195–7199. [Google Scholar] [CrossRef]
  30. Kumar, S.; Kojima, Y.; Dey, G.K. Thermodynamics and kinetics of hydrogen absorption–desorption of highly crystalline laNi5. J. Therm. Anal. Calorim. 2018, 134, 889–894. [Google Scholar] [CrossRef]
Figure 1. Activation curves at 298 K of LaNi5 alloy for different particle size.
Reactions 05 00021 g001
Figure 2. Activation curves at 298 K, 308 K, 313 K, 323 K and 333 K of a particle size less than 45 μm under 40 bars of hydrogen pressure.
Reactions 05 00021 g002
Figure 3. Graph of ln t as a function of 1000/T, where t is the incubation period and T is the temperature, for activation under 40 bars of hydrogen pressure.
Reactions 05 00021 g003
Figure 4. Activation curves at 298 K, 308 K, 313 K, 323 K and 333 K of a particle size less than 45 μm under 50 bars of hydrogen pressure.
Reactions 05 00021 g004
Figure 5. Graph of ln t as a function of 1000/T, where t is the incubation time and T the temperature, for activation under 50 bars of hydrogen pressure.
Reactions 05 00021 g005
Figure 6. Activation curves of a particle size less than 45 μm under constant driving force.
Reactions 05 00021 g006
Figure 7. Graph of ln t as a function of 1000/T, where t is the incubation time and T the temperature, for activation under constant driving force.
Reactions 05 00021 g007
Figure 8. Activation curves of a particle size less than 45 μm at 298 K under 4, 10, 20, 30, 40 and 50 bars of hydrogen pressure.
Reactions 05 00021 g008
Figure 9. Graph of ln t as a function of ln P/P0 at T = 298 K, where t is the incubation time and P is the pressure.
Reactions 05 00021 g009
Table 1. EA and A values under 40 and 50 bars and at a constant driving force.
40 Bars50 BarsC = 170
EA (kJ/mol H2)83 ± 377 ± 375 ± 7
A (s−1)3.9 × 10118.2 × 10102.5 × 109
Disclaimer/Publisher’s Note: The statements, opinions and data contained in all publications are solely those of the individual author(s) and contributor(s) and not of MDPI and/or the editor(s). MDPI and/or the editor(s) disclaim responsibility for any injury to people or property resulting from any ideas, methods, instructions or products referred to in the content.