Article

Applicability of Polarization Resistance for Assessment of Lead Corrosion State and Efficiency of Stabilization by Carbon Dioxide


by
Kristýna Charlotte Schelkalin
,
Milan Kouřil
*,
Andrei Kazanskii
and
Matěj Reiser
Department of Metals and Corrosion Engineering, University of Chemistry and Technology, Prague, 166 28 Prague, Czech Republic
*
Author to whom correspondence should be addressed.
Heritage 2026, 9(6), 219; https://doi.org/10.3390/heritage9060219
Submission received: 26 February 2026 / Revised: 13 May 2026 / Accepted: 19 May 2026 / Published: 27 May 2026
(This article belongs to the Special Issue Conservation and Restoration of Metal Artifacts)

Abstract

The appearance of a historical metal object and the presence of corrosion products on its surface are not always decisive for assessing the corrosion state of the object. A simple, fast, and instrumentally undemanding technique for measuring the corrosion rate of corroded lead is linear polarization resistance. Its value, determined in a non-aggressive electrolyte, tap water, is able to distinguish between a corrosion-active and corrosion-stable state. While the corrosion-active state is characterized by polarization resistance values in the order of tenths of Ω·m2, the stable state is characterized by values exceeding 1 Ω·m2. Lead acetates formed by reaction with volatile acetic acid, although present in very small quantities that are difficult to detect by XRD, are the cause of increased corrosion rate of lead in the presence of moisture. Acetates can be rapidly transformed into stable carbonates by exposing the object to moistened carbon dioxide. The polarization resistance measured in tap water showed considerable decrease in the corrosion rate of lead after stabilization with carbon dioxide. In contrast, thermal treatment at temperatures up to 70 °C is not as effective in terms of stabilization. Stabilization treatment of historical lead objects with carbon dioxide can be part of an ethoxene disinfection procedure.

1. Introduction

Electrochemical methods for measuring corrosion rate of metals have long been used in the field of heritage conservation [1]. Their great advantage is the ability to study the mechanisms of metal corrosion behavior under various conditions, assess and compare the aggressiveness of given environments on metal, and subsequently evaluate the effectiveness of conservation measures for given environments [2,3]. However, their use has been mainly associated with laboratory testing and verification of corrosion behavior on prepared samples. In recent years, a large number of studies have appeared that focus on the use of electrochemical methods for direct in situ measurement of the corrosion state of cultural objects in real time [2,3,4,5,6,7,8,9,10,11,12]. This approach enables detection of corrosion of the metal core under a layer of already formed corrosion products and the possibility of regular monitoring of the activity of the object’s surface (e.g., after conservation intervention or when exposed outside the recommended storage conditions) [13]. For metals that are selectively sensitive to certain components of atmospheric pollution or to increased humidity in the environment (e.g., copper, zinc, silver, lead [14]), a change in the corrosion activity of the surface of the object under observation would also provide information about a problem with the surrounding atmosphere.
The use of electrochemical methods to measure corrosion directly on the surface of historical objects poses a major challenge in finding a suitable experimental procedure that would allow reproducible data to be obtained on uneven surfaces with minimal disruption to the surface of the historical object. Although the current trend in studies focused on cultural monuments is clearly electrochemical impedance spectroscopy (EIS) [3], where the reference electrode and counter electrode are stored in agar gel electrolyte, which is in contact with the measured object (working electrode) [15], a conventional measurement method with a clearly defined procedure has not yet been established [2], and the authors of these studies themselves are coming up with further improvements and new alternative procedures are emerging.
A major advantage of using agar filling, especially in the field of cultural heritage, is its non-aggressive nature, simple preparation, low cost, formation of a solid gel even at very low concentrations of agar, and its very good adaptability to uneven surfaces [16]. Sufficient conductivity also allows the use of non-aggressive electrolytes [15] that do not affect the condition of the historical object, such as mineral water.
Contrary to EIS, linear polarization resistance (LPR) measurement, which ultimately provides the corrosion rate, is a faster and less demanding method that would sufficiently meet the needs of conservators in museums and galleries when choosing a conservation intervention. Corrosion rate measurements need to be performed as quickly as possible so that the object is not unnecessarily exposed to the electrolyte, even if this electrolyte is non-aggressive in terms of its corrosion stimulator content. The results of a study by Ch. Petiti et al. [3], which was conducted in situ on historical objects, show that when determining the polarization resistance (Rp) or calculating the corrosion rate, both methods (EIS and LPR) achieve comparable reliability and reproducibility of the results on a stabilized surface. Although the resulting Rp values or corrosion rates for both methods may differ due to the set measurement parameters (e.g., EIS measurement frequency range) or system geometry, they show the same trend when comparing changes in the reactivity of the measured surface over time, in different areas of natural patina, or after conservation treatment.
Although historical objects made of lead and its alloys are not as abundant in the collections of most cultural institutions as objects made of copper and its alloys or iron, determining the reactivity of the surface is very important when choosing a conservation treatment for these objects, especially if these objects have been and are stored in depositories with materials of organic origin that can release volatile organic compounds into the surrounding environment [17,18] or if they are finds from soil in which organic matter was present [19].
The lead objects that are preserved to this day date back to ancient times and originate from historically significant empires (China, Egypt, and the Roman Empire [20]). Examples of small lead objects include seals used to seal or authenticate correspondence, tokens used as confirmation of payment or debt, substitutes for coins in financial transactions or as tickets, merchant weights, etc. Larger items include statuettes or tableware, as well as parts of building elements such as water pipes, window pane profiles, or fragments of stained glass window profiles [19,21,22].
Lead objects are typically characterized by the presence of a passive protective layer. Most often, this is a double layer as clearly shown in [23]: a thin inner layer adjacent to the metal, lead oxide of both modifications—massicot and litharge [19]—and an outer, more stable, and voluminous layer composed of lead carbonates (the composition of this layer varies depending on the surrounding conditions; for example, under soil conditions, cerussite PbCO3 predominates, while under atmospheric conditions, hydrocerussite Pb3(CO3)2(OH)2 [22,24] and cerussite are converted to hydrocerussite [20]). Depending on the surrounding environment, other lead compounds (anglesite PbSO4, kotunnite PbCl2, laurionite PbCl(OH), etc.) may also be present in the layer of corrosion products [20,21]. The passive layer on the surface of lead objects causes the surface to darken. If volatile organic compounds (VOCs), especially acetic acid, appear in the environment, accelerated corrosion of the underlying lead occurs, the mechanism of which is described and represented graphically in [18]. It has been experimentally verified that the presence of a layer of corrosion products on the surface of lead significantly accelerates the process of active corrosion due to acetic acid [25]. Various forms of lead acetate (lead acetate Pb(CH3COO)2, lead acetate hemihydrate Pb3O2(CH3COO)2(H2O)0.5, or hydrated lead oxide acetate Pb(CH3COO)2·2PbO·H2O [26]), which are formed by the reaction of lead corrosion products with acetic acid, react with environmental components to form hydrocerussite or plumbonacrite [24], which are not protective in nature and have low adhesion to the surface and therefore subsequently fall off the surface together with the original corrosion products [18]. In addition, their formation releases acetic acid, which re-enters the active corrosion mechanism [18]. If acetic acid is not removed from the environment and lead corrosion products, this corrosion process can result in complete pulverization of the object. VOC-induced lead corrosion also affects lead solder and lead bronze [21].
The aim of this work was to verify that the polarization resistance measurement method allows for monitoring changes in the corrosion rate of lead during active corrosion due to acetic acid, even after conservation treatment, through a layer of corrosion products. In connection with this, several noninvasive conservation treatments were tested. The results of these measurements show that CO2 atmosphere can be used as a conservation agent to stabilize lead corroding in an active state while preserving the layer of corrosion products.

2. Materials and Methods

2.1. Lead Samples

Lead samples with a purity of 99.9% (Kovohutě Příbram nástupnická, a.s., Czechia) and dimensions of 30 × 30 × 3 mm were ground under running water using P320 grit sandpaper. They were then rinsed with distilled water and ethanol and dried with a paper towel or hair dryer. The prepared samples were placed in a plastic box measuring 60 × 40 × 40 cm, into which beakers containing an acetic acid solution with a concentration of 1 mmol·L−1, 10 mmol·L−1, or 100 mmol·L−1 were placed. The volume of the solution was approximately two liters. A processor fan ensured a uniform atmosphere inside the box. The sample was then exposed in the closed exposure box for 2, 7, and 16 days at laboratory temperatures. The relative humidity within the box was close to 100%. The aim was to prepare lead coupons with varying amounts of corrosion products on the surface.
A cardboard with a high content of wood components, lignin, was selected for the natural aging of the lead samples. The acidity of the cardboard was verified by measuring the pH of the cardboard cold extract used according to ISO 6588 [27]. The resulting pH was 6.4. Approximately 300 g of pre-moistened cardboard was placed in a tightly closed box measuring 40 × 20 × 20 cm. Moistening was carried out by spraying the surface of the cardboard with a small amount of distilled water. Lead samples were placed under a layer of cardboard. During the aging of the samples, a beaker with distilled water was placed in the box to maintain high relative humidity, and a Gastec Acetic Acid No. 81D dosimetric indicator tube (GASTEC Corporation, Ayase, Japan) was used to determine the acid concentration in the closed atmosphere. The resulting content was 0.026 ppm. The atmosphere in the box was homogenized using a processor fan.

2.2. Methods

Measurements were performed on a θ-θ powder diffractometer X’Pert PRO (Malvern Panalytical, Malvern, UK) in Bragg–Brentano para-focusing geometry using CuKα radiation wavelength (λ = 1.54 Å, U = 40 kV, I = 30 mA) at laboratory temperature. Data were scanned using an ultrafast PIXcel1D detector (Malvern Panalytical, Malvern, UK) in the 5–90° (2θ) angular range with a measurement step of 0.039° (2θ). Data evaluation was performed with HighScore Plus 5.1 software and the PDF4+ reference sample database. First, the entire lead sample was scanned with a layer of corrosion products on its surface. Later, the corrosion products were removed from the surface of the lead sample with a scalpel and homogenized to reveal the phases hidden inside the layer of corrosion products.
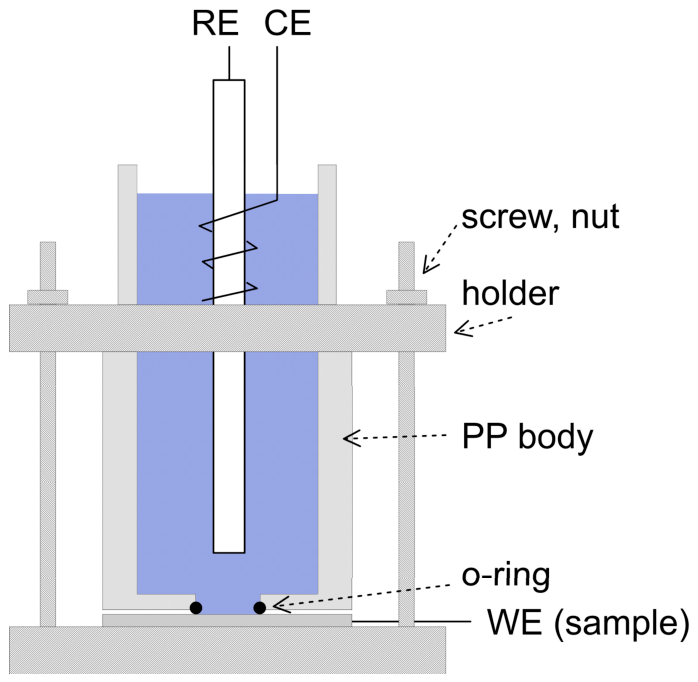
The polarization resistance of the lead samples was measured in a compression cell with a volume of 40 mL. The cell consists of a polypropylene shell and a bottom with an opening. The cell was pressed against the sample via an O-ring that defined an exposed area of 1.3 cm2 (Figure 1). Tap water was chosen as the electrolyte, i.e., an environment that is not aggressive to lead and does not pose a risk to historical objects, while also being sufficiently conductive for electrochemical measurement. The annual average composition and conductivity are presented in Table 1. The ZENNIUM E electrochemical measuring system (Zahner-Elektrik GmbH & Co. KG, Kronach, Germany) was used for the measurement. The sample was used as the working electrode (WE), a saturated calomel electrode served as the reference electrode (RE), and a platinum wire was used as the counter electrode (CE). First, the free corrosion potential (Eoc) in tap water was stabilized for 20 min. The sample was then polarized at a rate of 0.1 mV·s−1 in the range of −20 mV to +20 mV relative to Eoc. From the polarization curve obtained, the polarization resistance was evaluated in the Thales XT Analysis program (version 1.7.5, Zahner-Elektrik GmbH & Co. KG, Kronach, Germany) as the slope of the regression line fitted to the collected data in the interval ±5 mV from Eoc. Each corrosion state was measured four times on four different identically prepared samples.
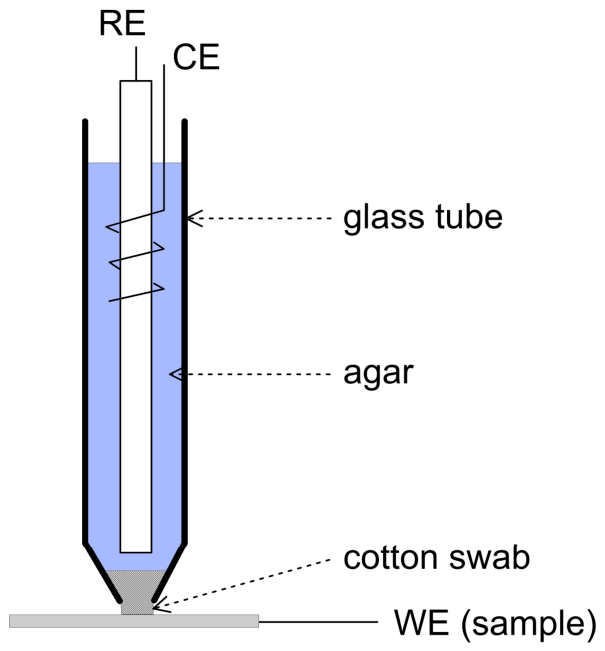
The compression cell is not suitable for measuring the polarization resistance of real samples with a relief surface. For real objects, a local electrode arrangement is more practical (Figure 2), which can be attached to the surface of a lead object with an embossed or cast surface, which may not always be horizontal. The body of the cell consists of a glass tube with a narrow end. The narrowed end of the tube was closed with a cotton swab. A reference electrode and platinum wire were inserted into the body of the cell. The cell was filled with a solution of agar in tap water. Once solidified, this filling ensures sufficient moistening of the swab and solution does not leak from the tube when tilted. The gel was prepared by dissolving 1 g of agar (Agar 700 E406, GumrEko, Radonice, Czechia) in 250 mL of cold tap water and left to swell for 10 min. The solution was then brought to a boil. After being cooled to approximately 40 °C, the solution was transferred to a glass tube with electrodes and left to solidify.
Polarization resistance was measured using a local cell by placing a lead sample or lead object horizontally on a needle fixed under the sample. The needle ensured an electron-conductive connection with the metal core of the object. A local cell was attached to the sample from above. The mouth of the cell with a cotton swab defined an exposed sample area of 0.9 cm2. Measurement and evaluation were performed in the same manner as described above.
A resistometric sensor was used to monitor corrosion loss during exposure to acetic acid vapors during the formation of a layer of corrosion products and during subsequent stabilization treatment with carbon dioxide. The resistometric method involves measuring the electrical resistance of a metal layer during corrosion. The reduction in the cross section of the metal layer due to corrosion causes an increase in electrical resistance. By measuring the electrical resistance of a thin layer of lead, it is possible to monitor the corrosion loss of lead during exposure and thus measure its corrosion rate. Details of the technique are given, for example, in the publication [29]. The AirCorr resistometric sensor used in this work had an initial lead trace thickness of 150 μm. The ACD-03 recorder (Metricorr AsP, Rødovre, Denmark), which was connected to the sensor by a cable, was calibrated to this initial thickness. Before each measurement, the sensor was cleaned by immersion in a 1% HCl solution, rinsed with distilled water and dried. The resistometric sensor was placed in the exposure chamber together with the lead samples, on which the polarization resistance was measured after exposure.

3. Results

3.1. Corrosion Rate of Lead in the Presence of Acetic Acid

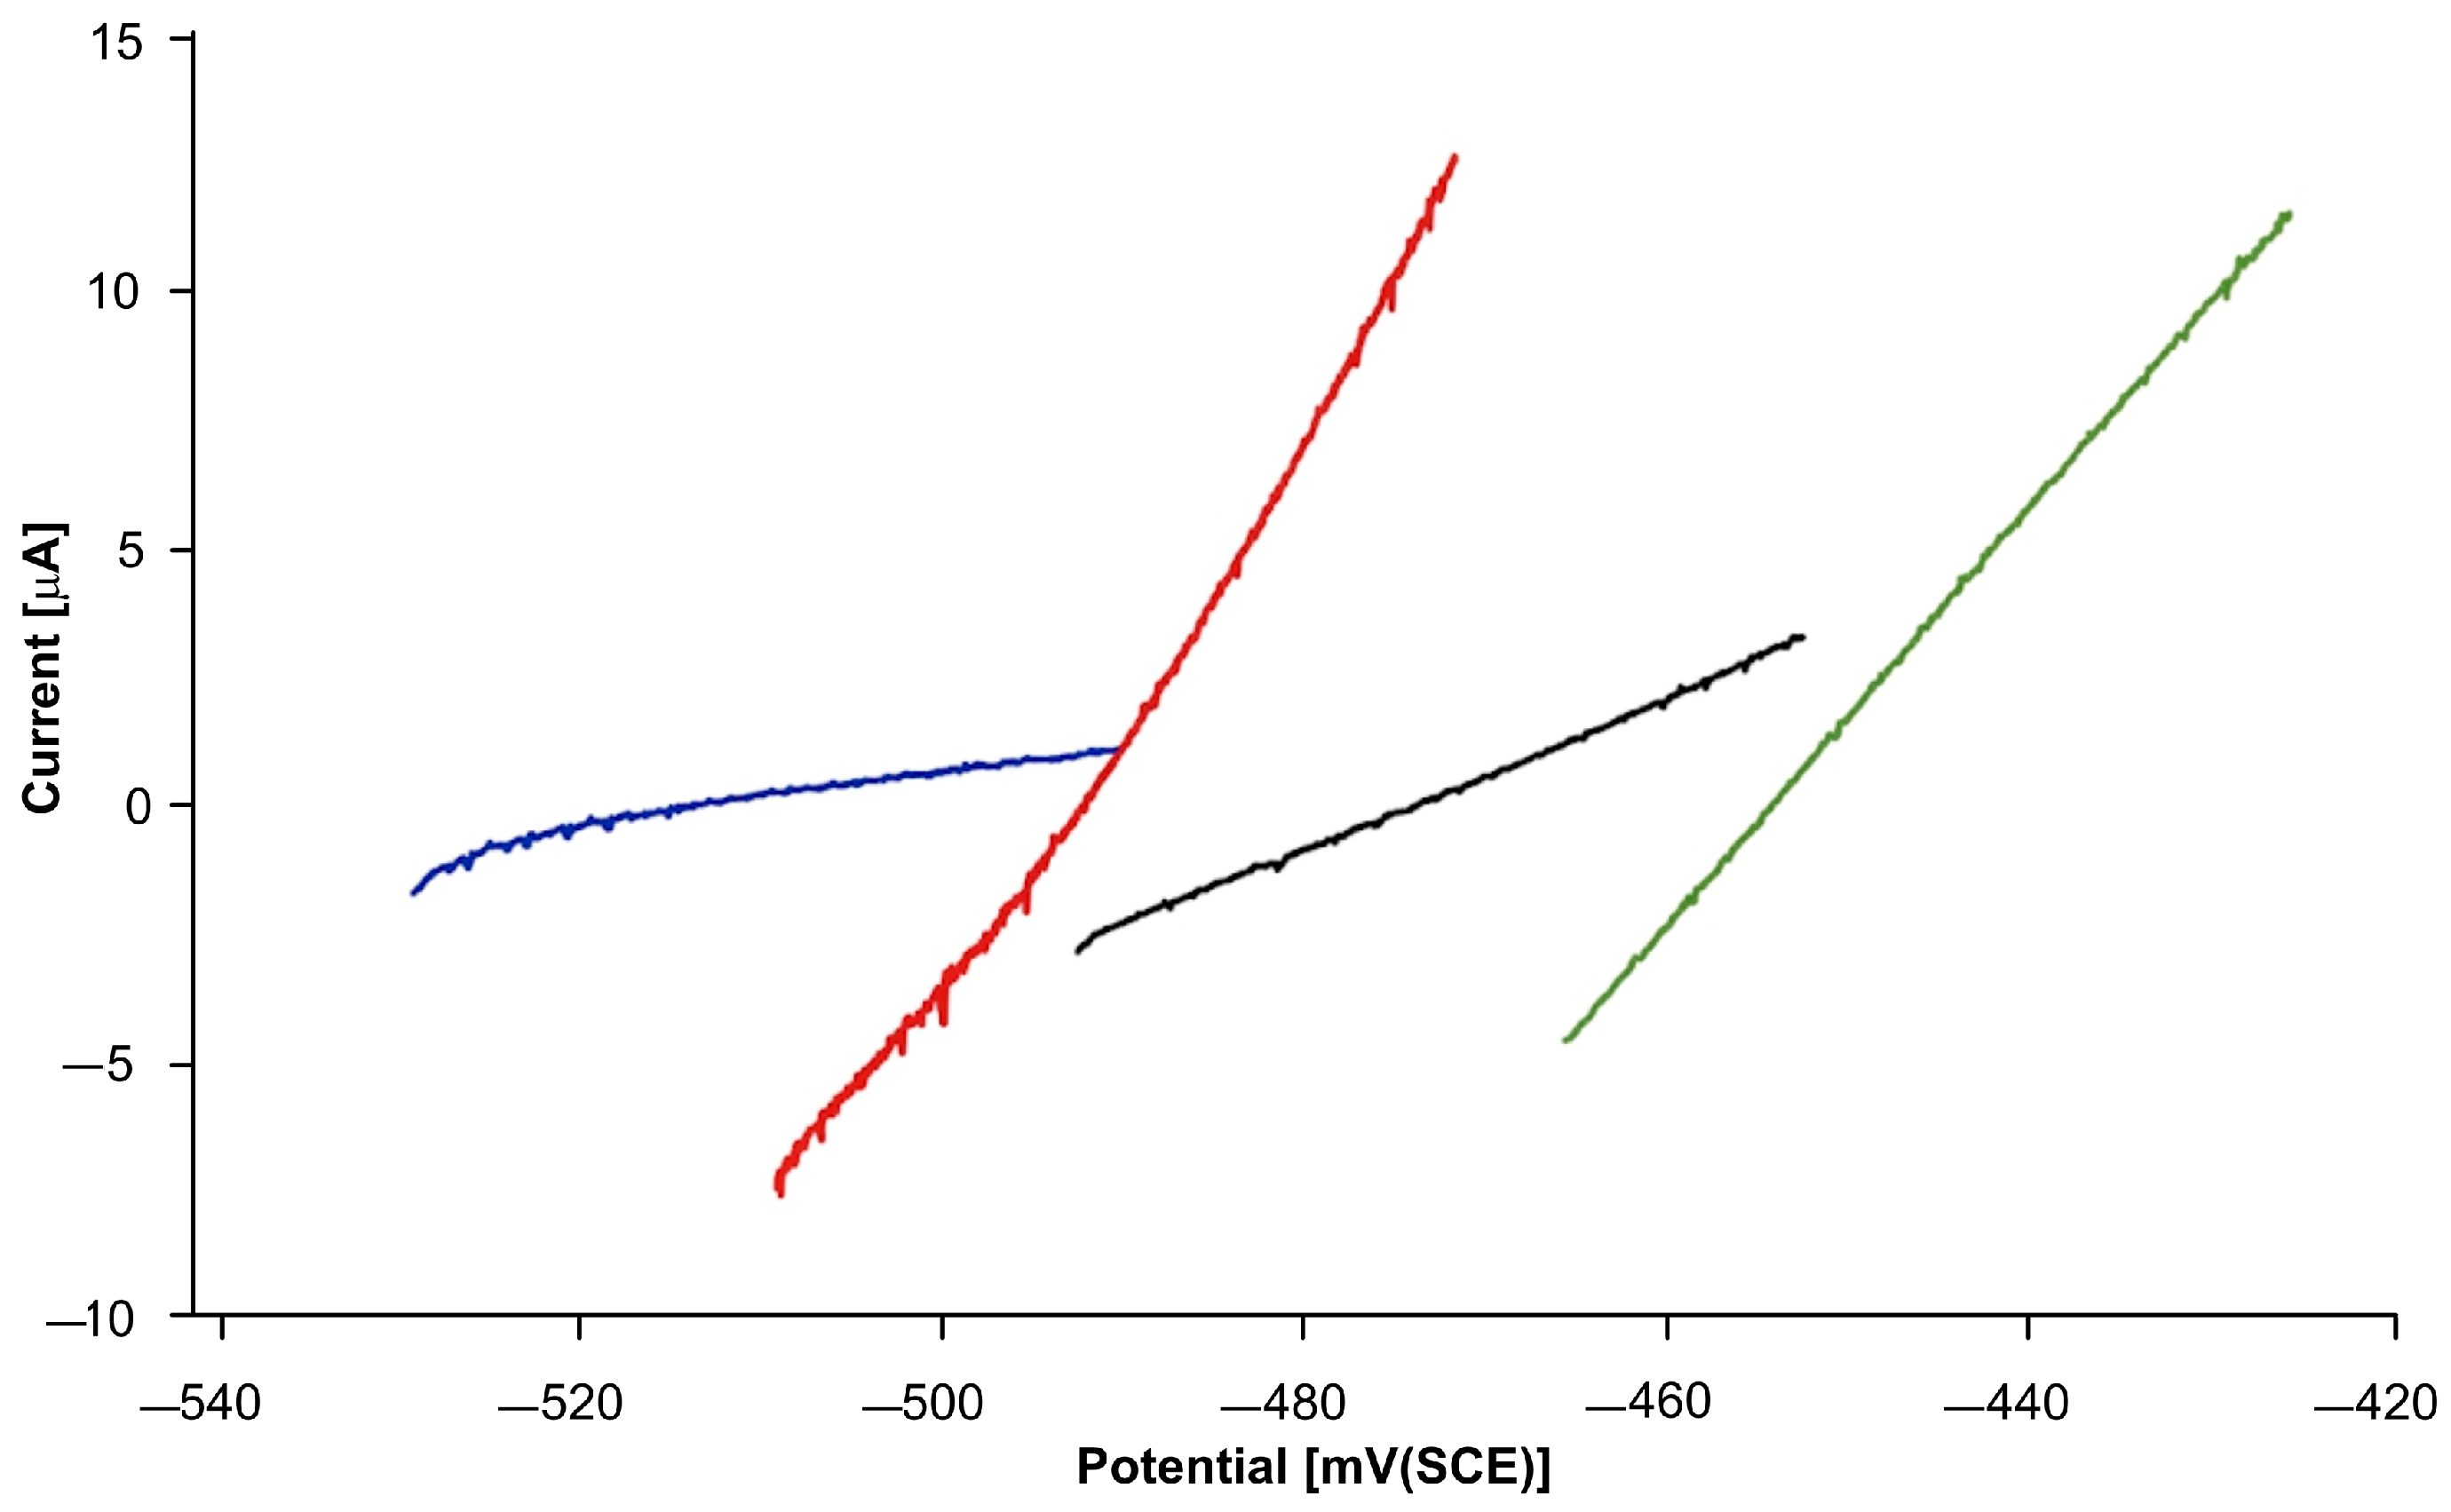
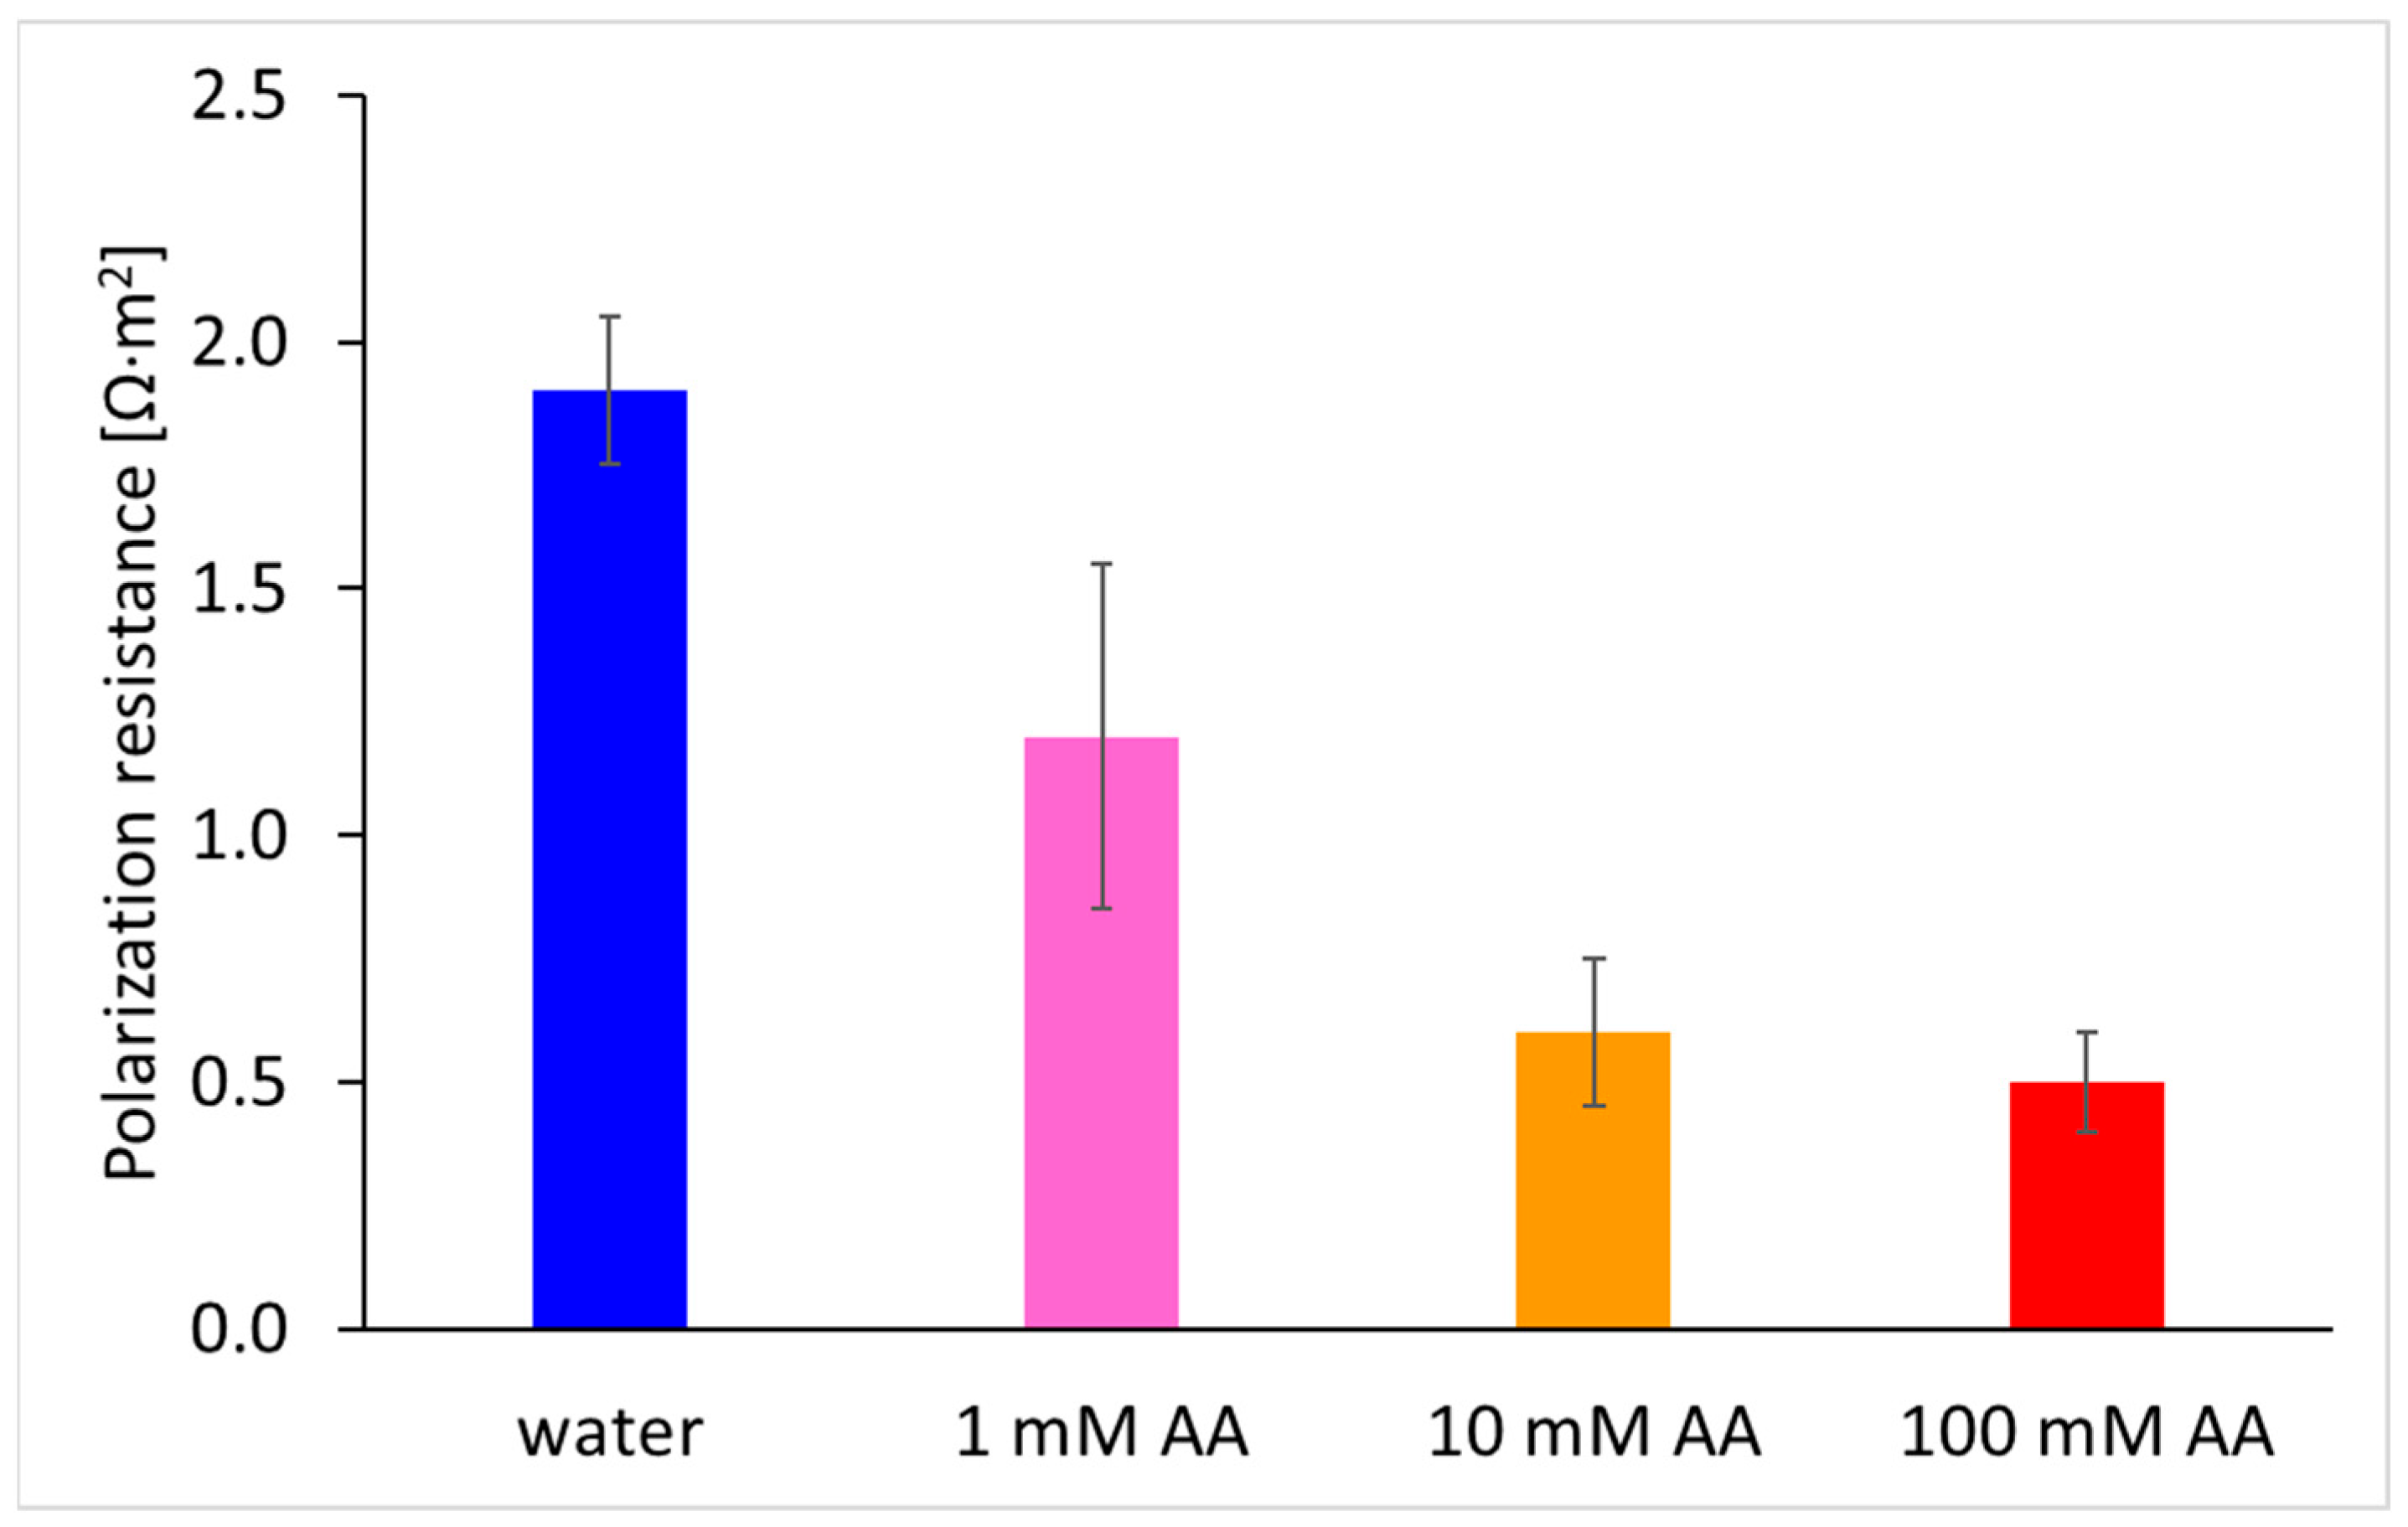
The basic prerequisite for the nondestructive use of electrochemical methods for corrosion monitoring is that the electrolyte connecting the working electrode (monitored object), counter electrode, and reference electrode is sufficiently conductive to enable subtle polarization of the working electrode and, at the same time, is itself non-aggressive toward the monitored object. Tap water was chosen as such an electrolyte. It is assumed that in pH-neutral tap water, lead spontaneously transitions to a passive state and the corrosion rate is therefore low. If corrosion stimulators, such as acetic acid, are present in the corrosive environment, the passive state is unstable, and the lead transitions to an active state, which is associated with a higher corrosion rate and thus a lower polarization resistance. The polarization resistance was therefore measured first in tap water and then in tap water with the addition of acetic acid. The examples of raw polarization curves can be seen in Figure 3. The polarization resistance of ground lead in tap water without the addition of acetic acid is reproducibly close to 2 Ω·m2 (Figure 4). Even a small addition of acetic acid (at a concentration of 1 mM) leads to a decrease in Rp, but only an addition at a concentration of 10 mM or 100 mM causes a decrease in Rp by an order of magnitude and thus a 10-fold increase in the corrosion rate. Based on the Rp values (0.6 and 0.5 Ω·m2, respectively), it can be concluded that with a further increase in the concentration of acetic acid, the corrosion rate of lead does not increase significantly.
From the measured Rp values in a non-aggressive tap water environment and in an aggressive acetic acid solution in tap water, it can therefore be concluded that a corrosion-stable situation in non-aggressive conditions is characterized by Rp values exceeding 1 Ω·m2, while a corrosion-unstable situation in aggressive conditions corresponds to Rp in the order of tenths of Ω·m2. The corrosion rate of lead that is not corrosion-stable is therefore several times higher than that of lead that is corrosion-stable.

3.2. Corrosion of Lead in an Unstable State Under a Layer of Corrosion Products

A situation in which lead is covered with a freshly formed layer of corrosion products in a corrosive environment can be considered unstable in terms of lead corrosion. This may be the case for lead exposed for a short time to an atmosphere containing volatile organic acids, in which a layer of corrosion products based on lead acetates is first formed, which are gradually transformed into carbonates by reaction with atmospheric carbon dioxide [17,30,31], or even in the case of historical lead covered with a layer of stable corrosion products, mostly based on carbonates, in an atmosphere containing volatile organic acids, which penetrate the corrosion products and renew the corrosion process at the interface between lead and corrosion products. To simulate the first case (short-term exposure of lead in an atmosphere containing volatile organic acids), a set of model lead samples was prepared, on which a layer of corrosion products was created over various periods of time by exposure to an atmosphere above an acetic acid solution with a concentration of 10 mmol·L−1. Since the exposure was aimed at accelerating the corrosion products’ formation process, acetic acid content and relative humidity may obviously exceed the real conditions. However, for comparison, the equilibrium vapor pressure has been calculated using the dissociation constant of acetic acid Ka = 1.75 × 10⁻⁵ and the Henry’s constant H = 48 mol·dm−3·Pa−1 [32]. The equilibrium partial pressure of acetic acid vapors above the 10 mmol.L−1 acetic acid solution at 25 °C is 8.7 mPa, which is equivalent to 86 ppbv. This content corresponds well to realistic values [17,33].

3.2.1. Characterization of Model Samples of Short-Term Exposure to Lead in an Atmosphere Containing Acetic Acid

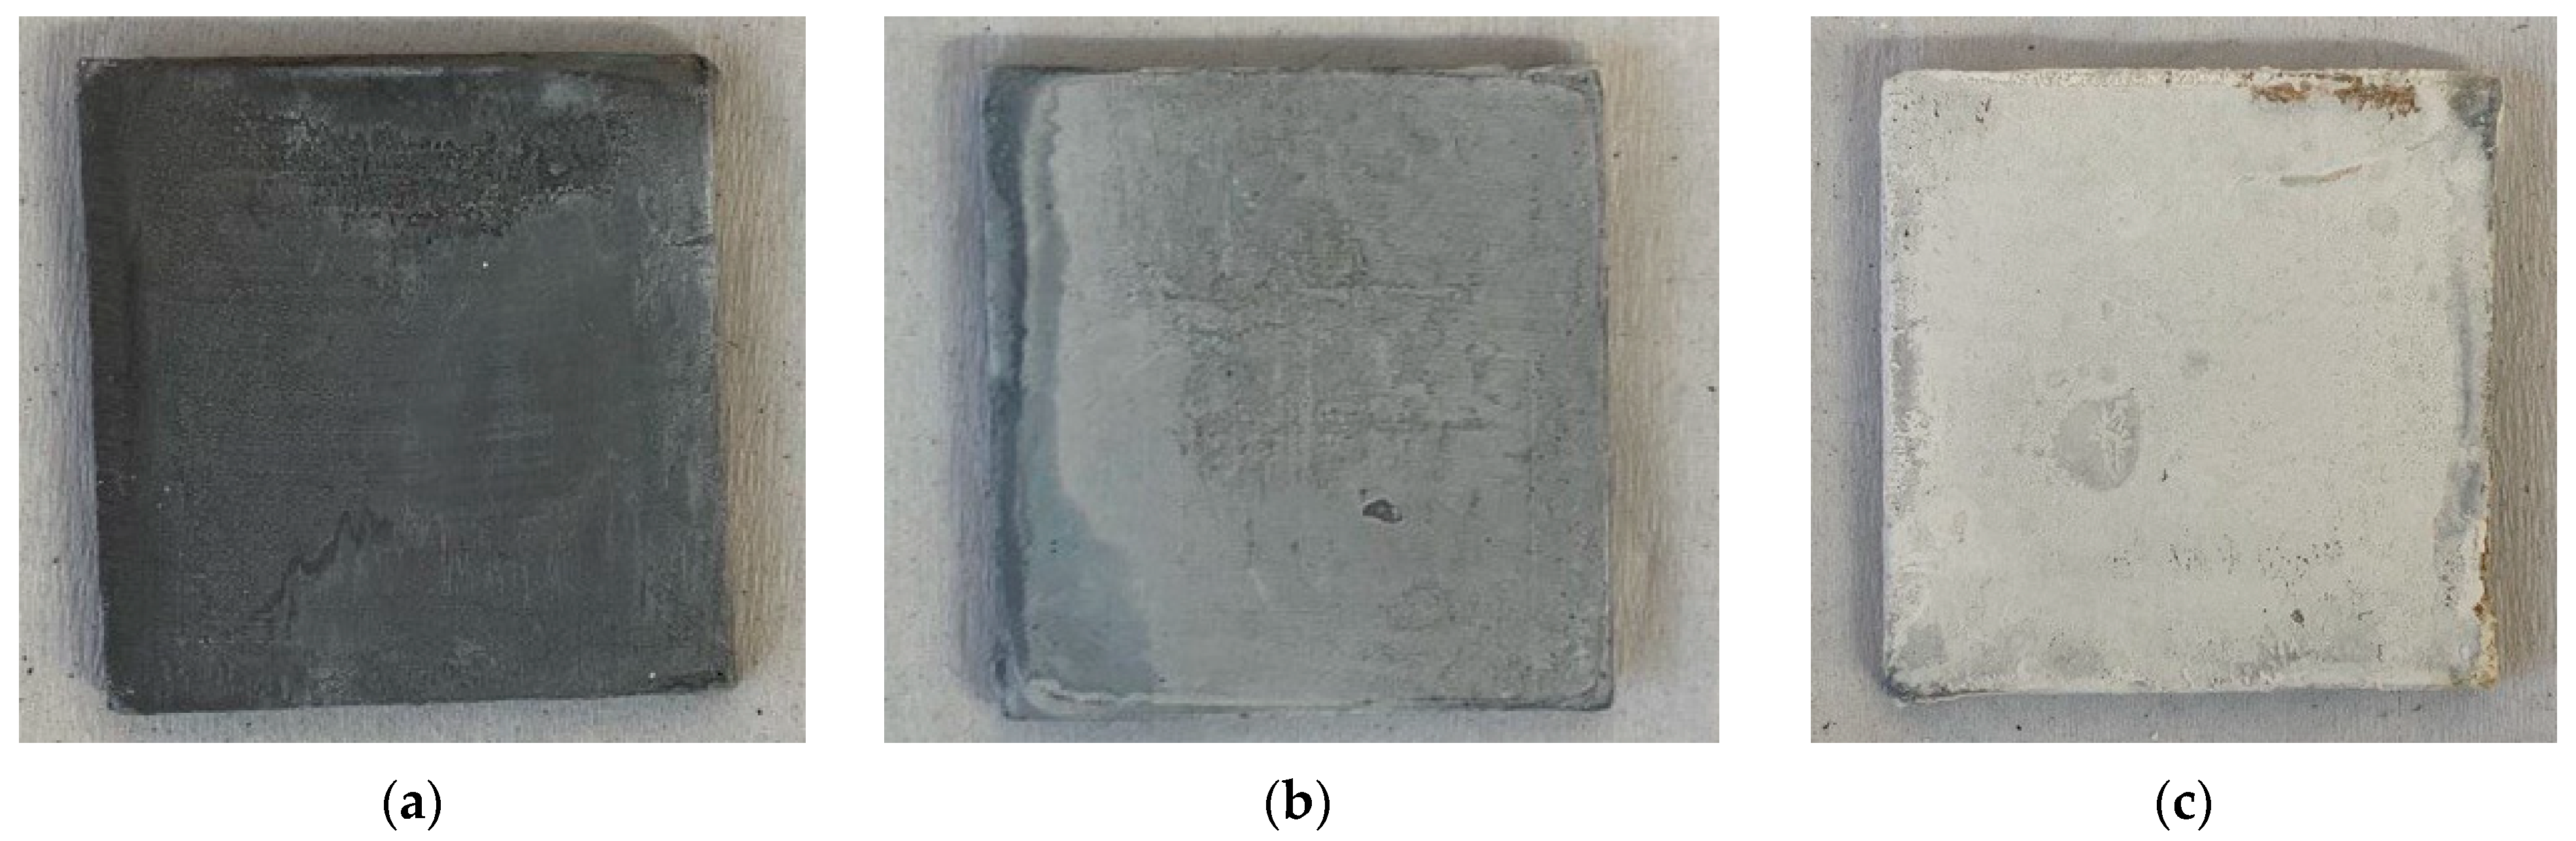
The thickness of the layer of corrosion products on lead naturally increases with the duration of exposure to acetic acid solution. This is evident not only from the appearance of the samples after exposure (Figure 5), but also from the semi-quantitative evaluation of X-ray diffraction of flat lead samples. Table 1 shows that as the exposure time increases, the diffraction signal from the underlying lead decreases and the response of the corrosion products increases. At the same time, the ratio of the two main components identified in the corrosion products also changes. Over time, the proportion of acetate decreases and the proportion of the carbonate phase increases. This is a manifestation of the ongoing transformation of acetate-based corrosion products into carbonate-based corrosion products in the presence of carbon dioxide as a natural component of the atmosphere, as it is expected in the case of historical lead [34]. However, it should be noted that this ratio may not reflect the overall proportion of phases in the entire layer of corrosion products, but rather indicates the proportion of phases on the surface of the layer of corrosion products. A gradient in the content of individual phases across the layer can be assumed, such that the proportion of acetates increases towards the lead–corrosion product interface. The surface of the lead is therefore likely to have a higher acetate content than that indicated by the results in Table 2, which was confirmed by analyses of scraped corrosion products in further parts of the paper.
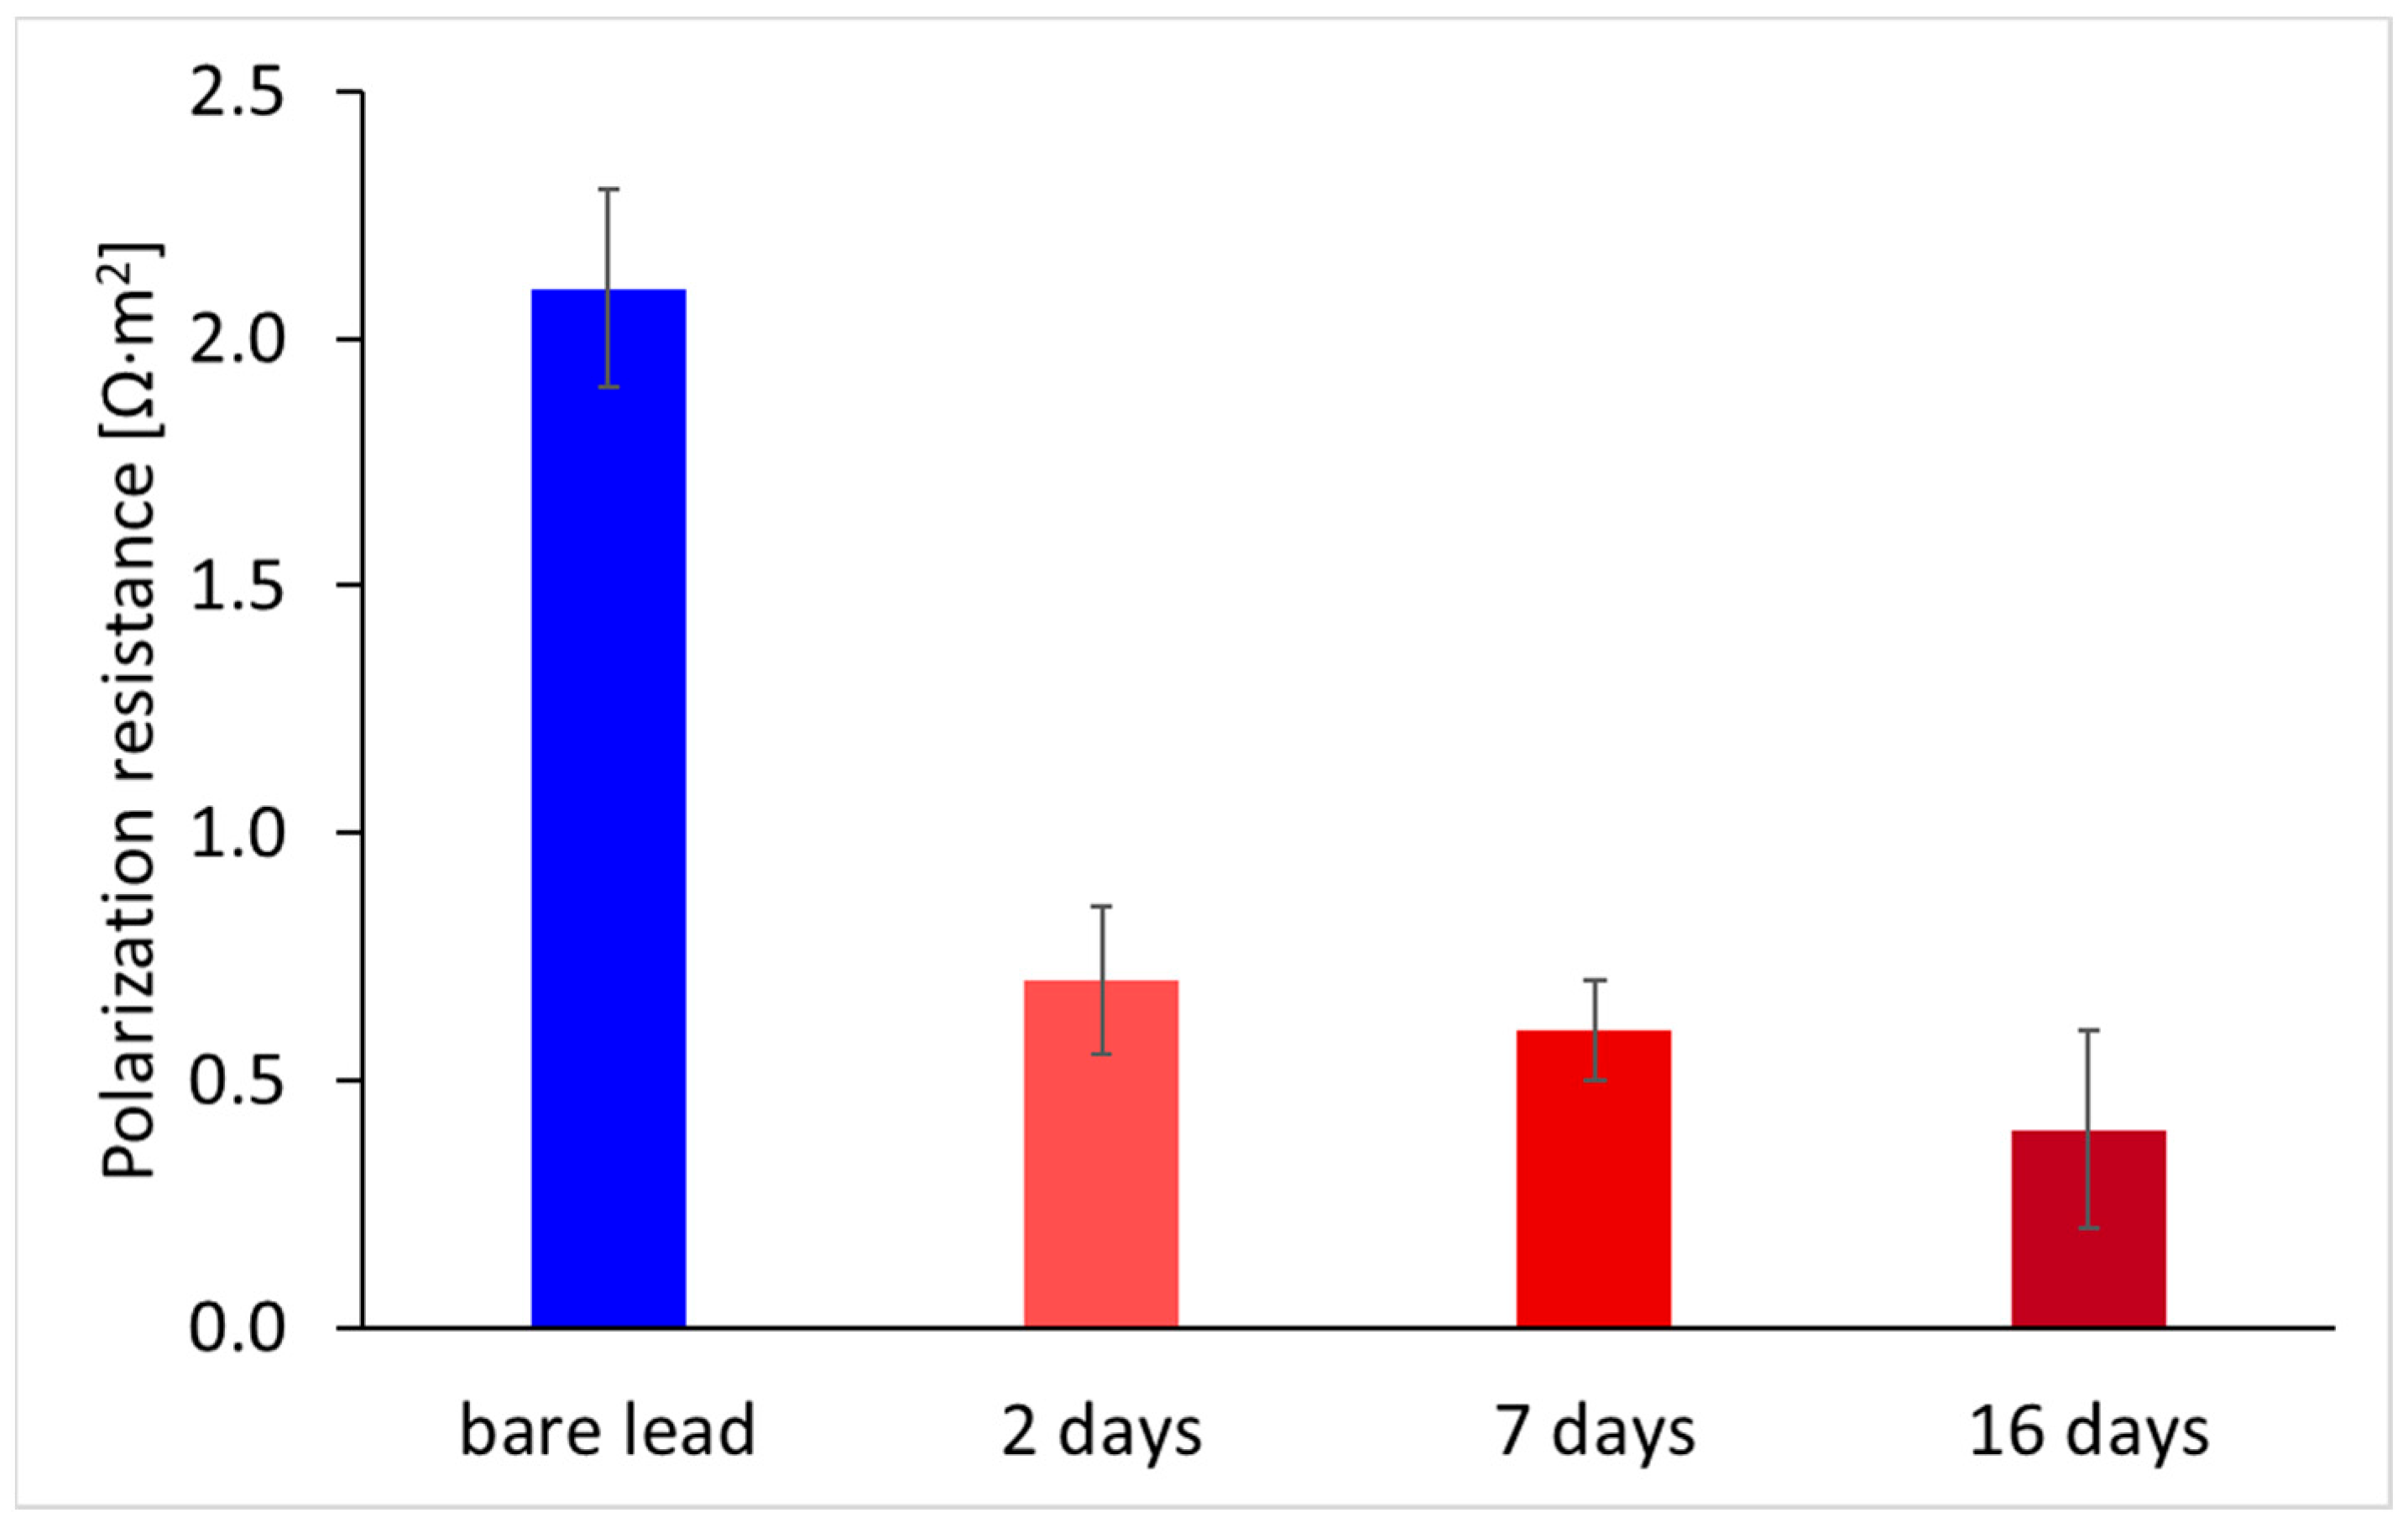
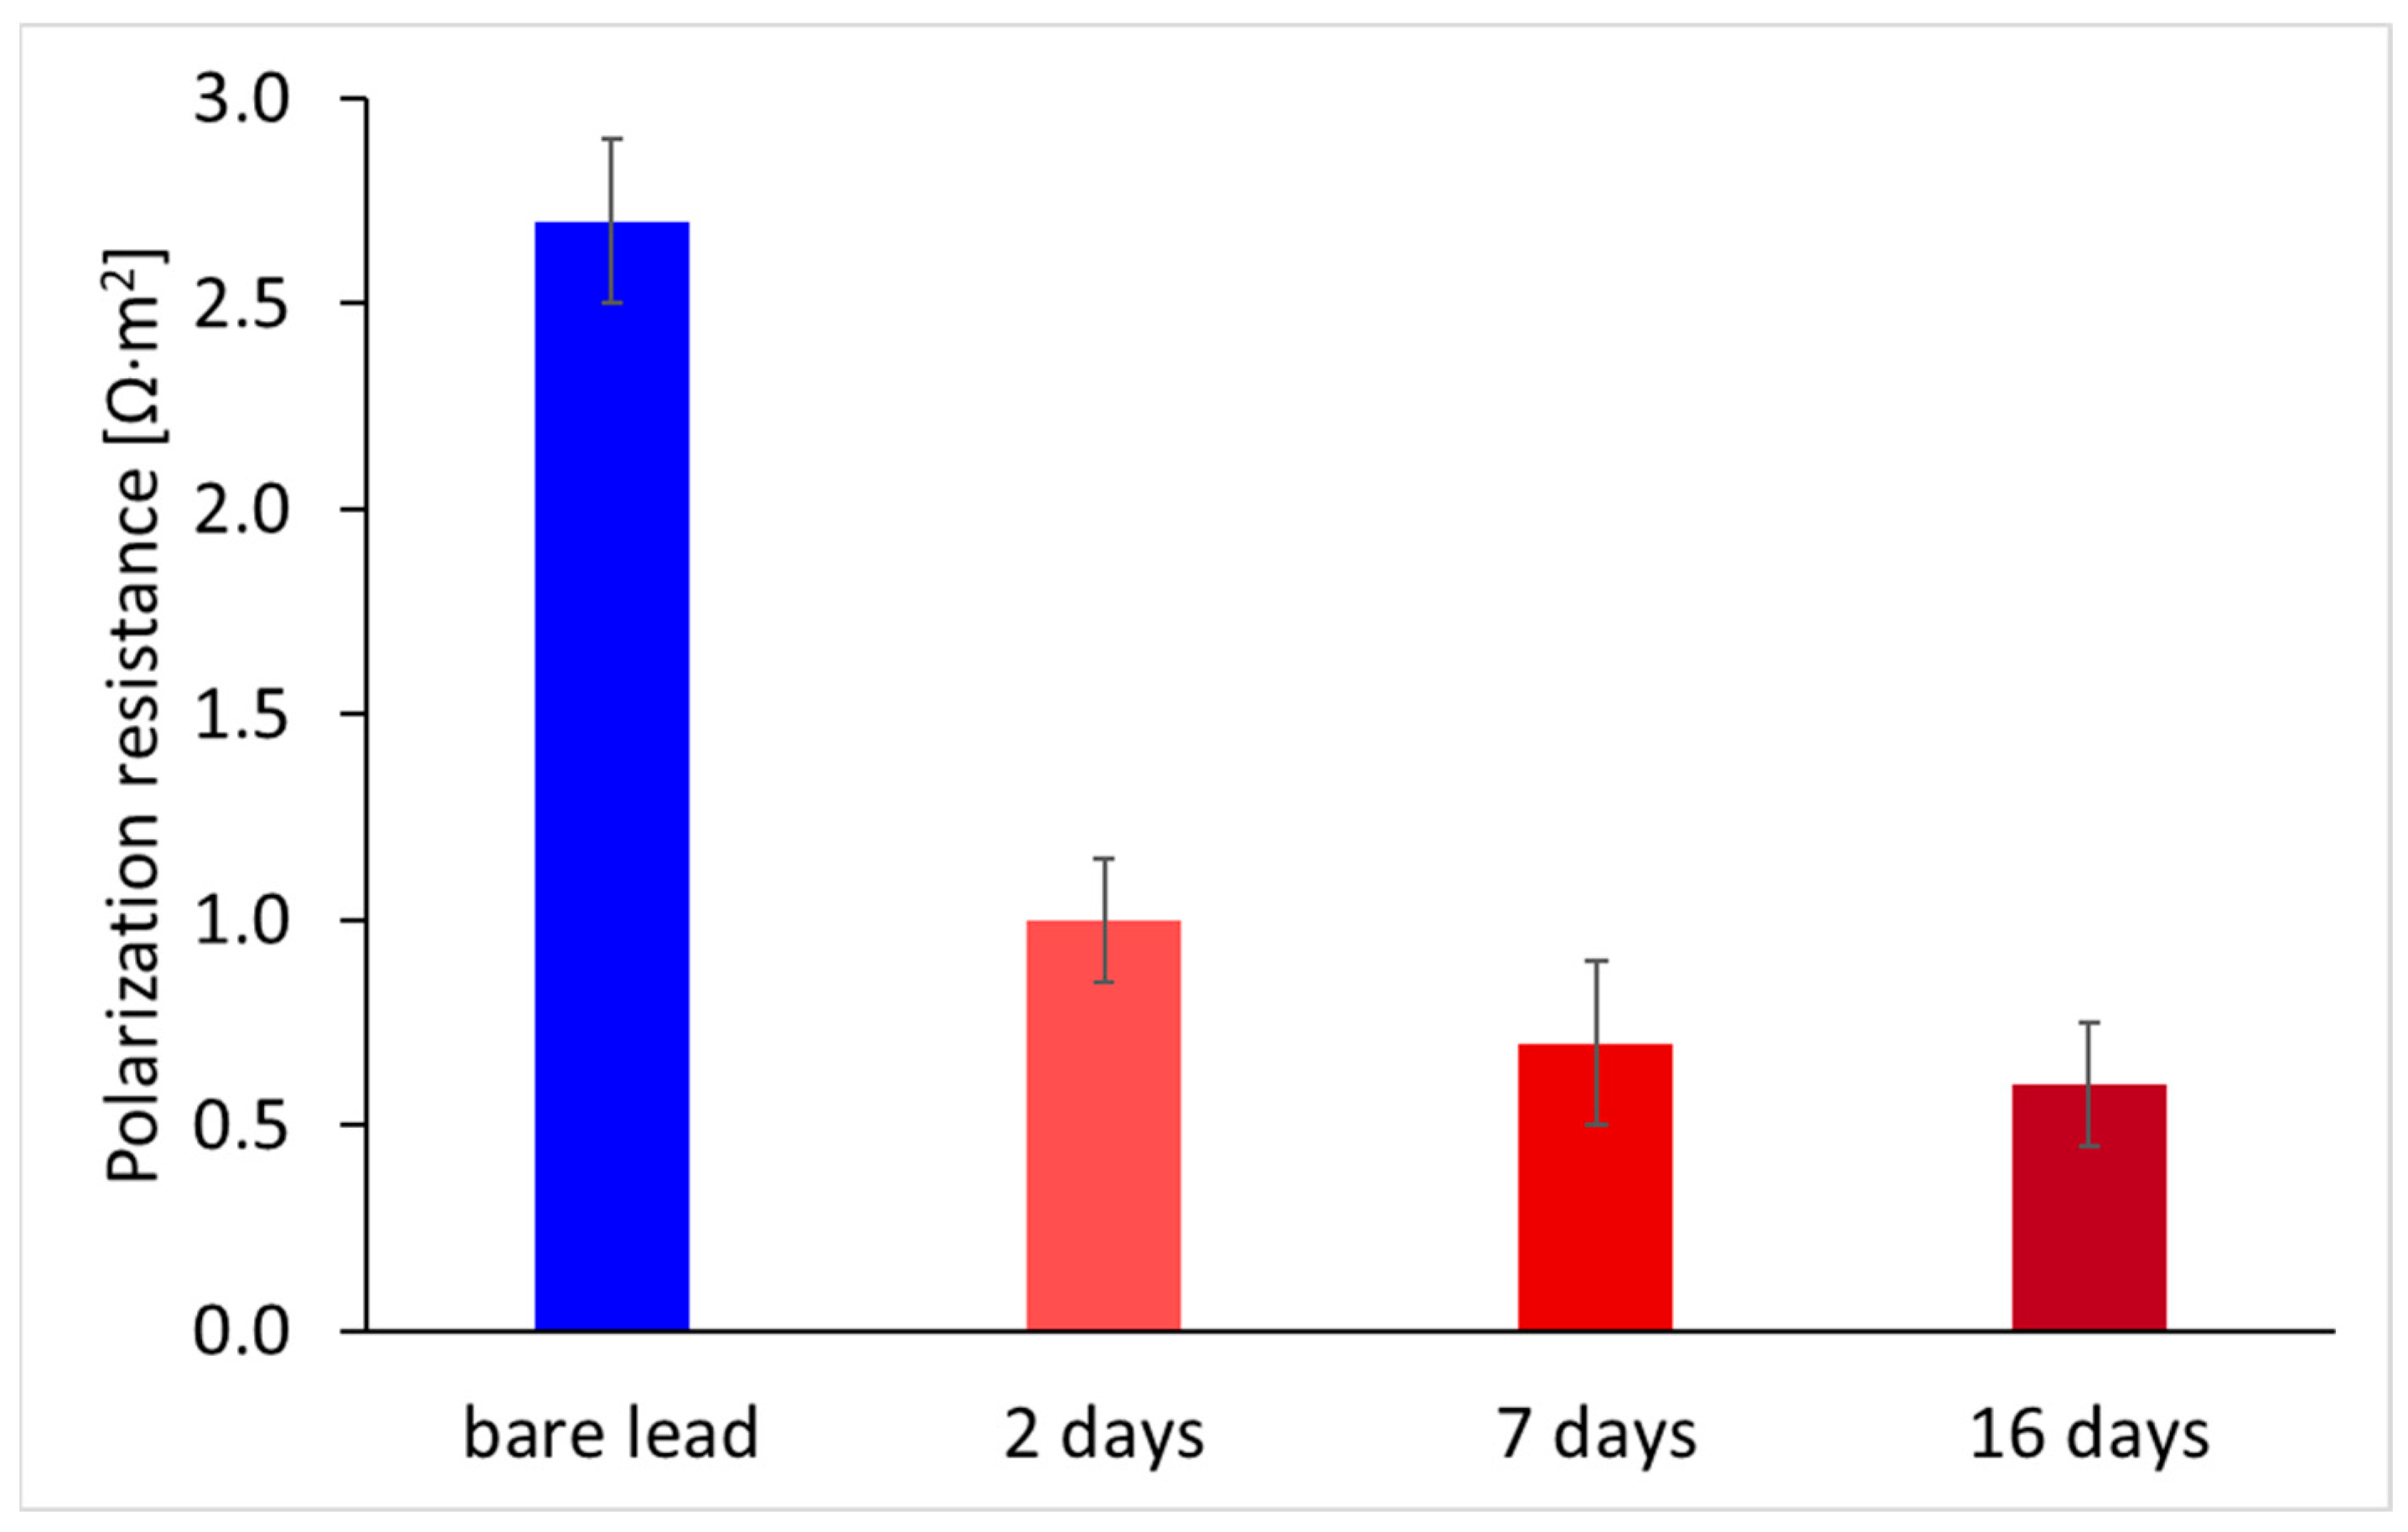
The samples with an artificially created layer of corrosion products were then subjected to measurements of polarization resistance in tap water and their values were compared with the polarization resistance of lead without corrosion products in the same environment (Figure 6). Regardless of the time of corrosion product formation or the thickness of the corrosion product layer, the polarization resistance values of the corroded samples are of the order of tenths of Ω·m2, which corresponds to an unstable corrosion situation where lead is exposed to corrosively aggressive conditions. In this case, these corrosively aggressive conditions are not represented by the test electrolyte, which is tap water, but by acetates released from unstable acetate-based corrosion products. Lead without corrosion products again showed a polarization resistance value close to 2 Ω·m2, which is statistically the same value as that found in the previous section (Figure 4).

3.2.2. Characterization of Model Samples of Short-Term Exposure to Lead in an Atmosphere Influenced by Acidic Paper

The layer of corrosion products artificially created on model lead samples by short-term exposure of lead in an atmosphere containing acetic acid may, obviously, differ in character from naturally corroded lead. In an attempt to approximate the real situation as closely as possible and model naturally occurring corrosion products, we exposed lead samples to an atmosphere influenced by the current exposure of a commonly used storage material, cardboard archive boxes. Measurement of the pH of the cold leachate showed that it was indeed an acidic material (pH 6.4) and that the material was likely capable of releasing volatile acidic compounds. The presence of acetic acid vapors was also demonstrated in the exposure chamber using a dosimetric tube, which detected an acetic acid content of 0.026 ppm. This value is far below maximum allowable acetic acid concentrations (400 ppb) as identified for a general collection [35]. Obviously, the interaction of acetic acid with lead depends on, e.g., relative humidity and synergism with other air pollutants. Nevertheless, low or negligible impact of 0.01–0.02 ppm acetic acid pollution and relative humidity below 50% was confirmed by evaluation of corrosivity of indoor museum atmospheres using lead specimens [36]. However, the conditions in our test were harsher, as the cardboard had been moistened with distilled water, bringing the humidity to around 85%.
Lead samples were exposed in a closed atmosphere, the composition of which was influenced by the simultaneous exposure of cardboard, for 153 days. X-ray diffraction after exposure showed that the layer of corrosion products mainly contained carbonate-based corrosion products (plumbonacrite and hydrocerussite), but also a relatively small amount of acetate (Table 3). The polarization resistance of such a corroded sample measured in tap water is 0.6 Ω·m2, which corresponds to a corrosion-unstable state, probably due to the presence of acetates on the surface of the lead under the layer of corrosion products. In terms of both the phase composition of the corrosion product layer and the corrosion rate of lead under the corrosion product layer, the artificially created corrosion product layer above the acetic acid solution is therefore similar to the naturally formed corrosion product layer when exposed to acidic paper material.

3.3. Stabilization of Lead Corrosion Products and Its Effect on the Corrosion Rate of Lead

Measurement of the corrosion rate of lead using polarization resistance and phase analysis of corrosion products covering lead clearly show the connection between increased corrosion rate and the presence of acetate-based corrosion products, whose transformation into carbonates by reaction with atmospheric carbon dioxide releases acetic acid, which returns to the corrosion process [30,31]. Accelerated decomposition or transformation of acetate corrosion products and venting of the released acetic acid appear to be a promising way to stabilize corrosion products and convert a corroded lead object from a corrosion-unstable state to a corrosion-stable state characterized by a lower corrosion rate of the underlying lead. Decomposition can be achieved by heat, whereby lead acetate decomposes at elevated temperatures to form oxide and acetic acid. Acetic acid is then carried away by a stream of hot air. Obviously, the temperature must not be so high as to threaten the stability of attached or nearby organic materials if such materials are part of the historical object. In terms of transformation, the natural transition of acetates to carbonates can be accelerated by short-term exposure of the object to a carbon dioxide atmosphere with simultaneous ventilation of the released acetic acid. Essentially, this process is similar to those used in the past to produce lead white pigment [37]. Such a process can be part of the ethoxene procedure, which uses a mixture of ethylene oxide and carbon dioxide to disinfect historical organic materials. More details about the ethoxene procedure can be found here [38,39]. Since the reaction requires the presence of water, it would probably be necessary to moisten the ethoxene mixture. However, it must be emphasized that, given the toxicity of ethylene oxide, the process must be used only in compliance with all safety regulations and conditions.

3.3.1. Stabilization of Lead Corrosion Products by Heat

Samples with artificially prepared corrosion products above an acetic acid solution were heated with warm air from a hair dryer. The distance between the dryer and the sample controlled the air temperature. The distance was set so that the temperature was 40 and 70 °C, respectively. This was verified by a thermometer placed at the given distance. The treatment lasted 15 min. Samples exposed to acetic acid for 2 days were used. These were samples with a relatively thin layer of corrosion products. If stabilization was not successful in the case of a thin layer, it would probably not be successful for thicker layers either.
The phase composition of the corrosion products after hot air treatment compared to the untreated sample is shown in Table 4. When corrosion products were analyzed directly on the surface of the corrosion sample, acetate was not detected by XRD. On the basis of this result, it could be concluded that both selected temperatures are sufficient for the decomposition of acetate, which is a prerequisite for the stabilization of corrosion products. For a detailed analysis of the entire volume of corrosion products, the corrosion products were scraped from the sample with a scalpel and reanalyzed. This analysis showed that the corrosion products do indeed contain acetate corrosion products, both at 40 °C and at 70 °C. This finding suggests that even such mild heating of corrosion products leads to the modification of lead acetate, but only on the surface. Acetate continued to appear beneath the surface of the corrosion products. It is possible that a longer application of hot air would lead to further modification and a reduction in the proportion of acetate in the corrosion product layer. It is also possible that the basic lead acetate hemihydrate on the surface did not undergo complete thermal decomposition, but only dehydration and transformation into an amorphous state, and the product was therefore not detectable by XRD. Dehydration is confirmed by previous studies [34,40], in which it was observed that hydrated lead acetate loses water up to a temperature of approximately 450 K. Partial or complete decomposition of lead acetate occurs only at temperatures of 500 K and 600 K, respectively. Regardless of the changes in composition that occur, corrosion resistance improved during heat treatment, as shown below. Further detailed analyses are needed to fully understand the changes in composition during heat treatment.
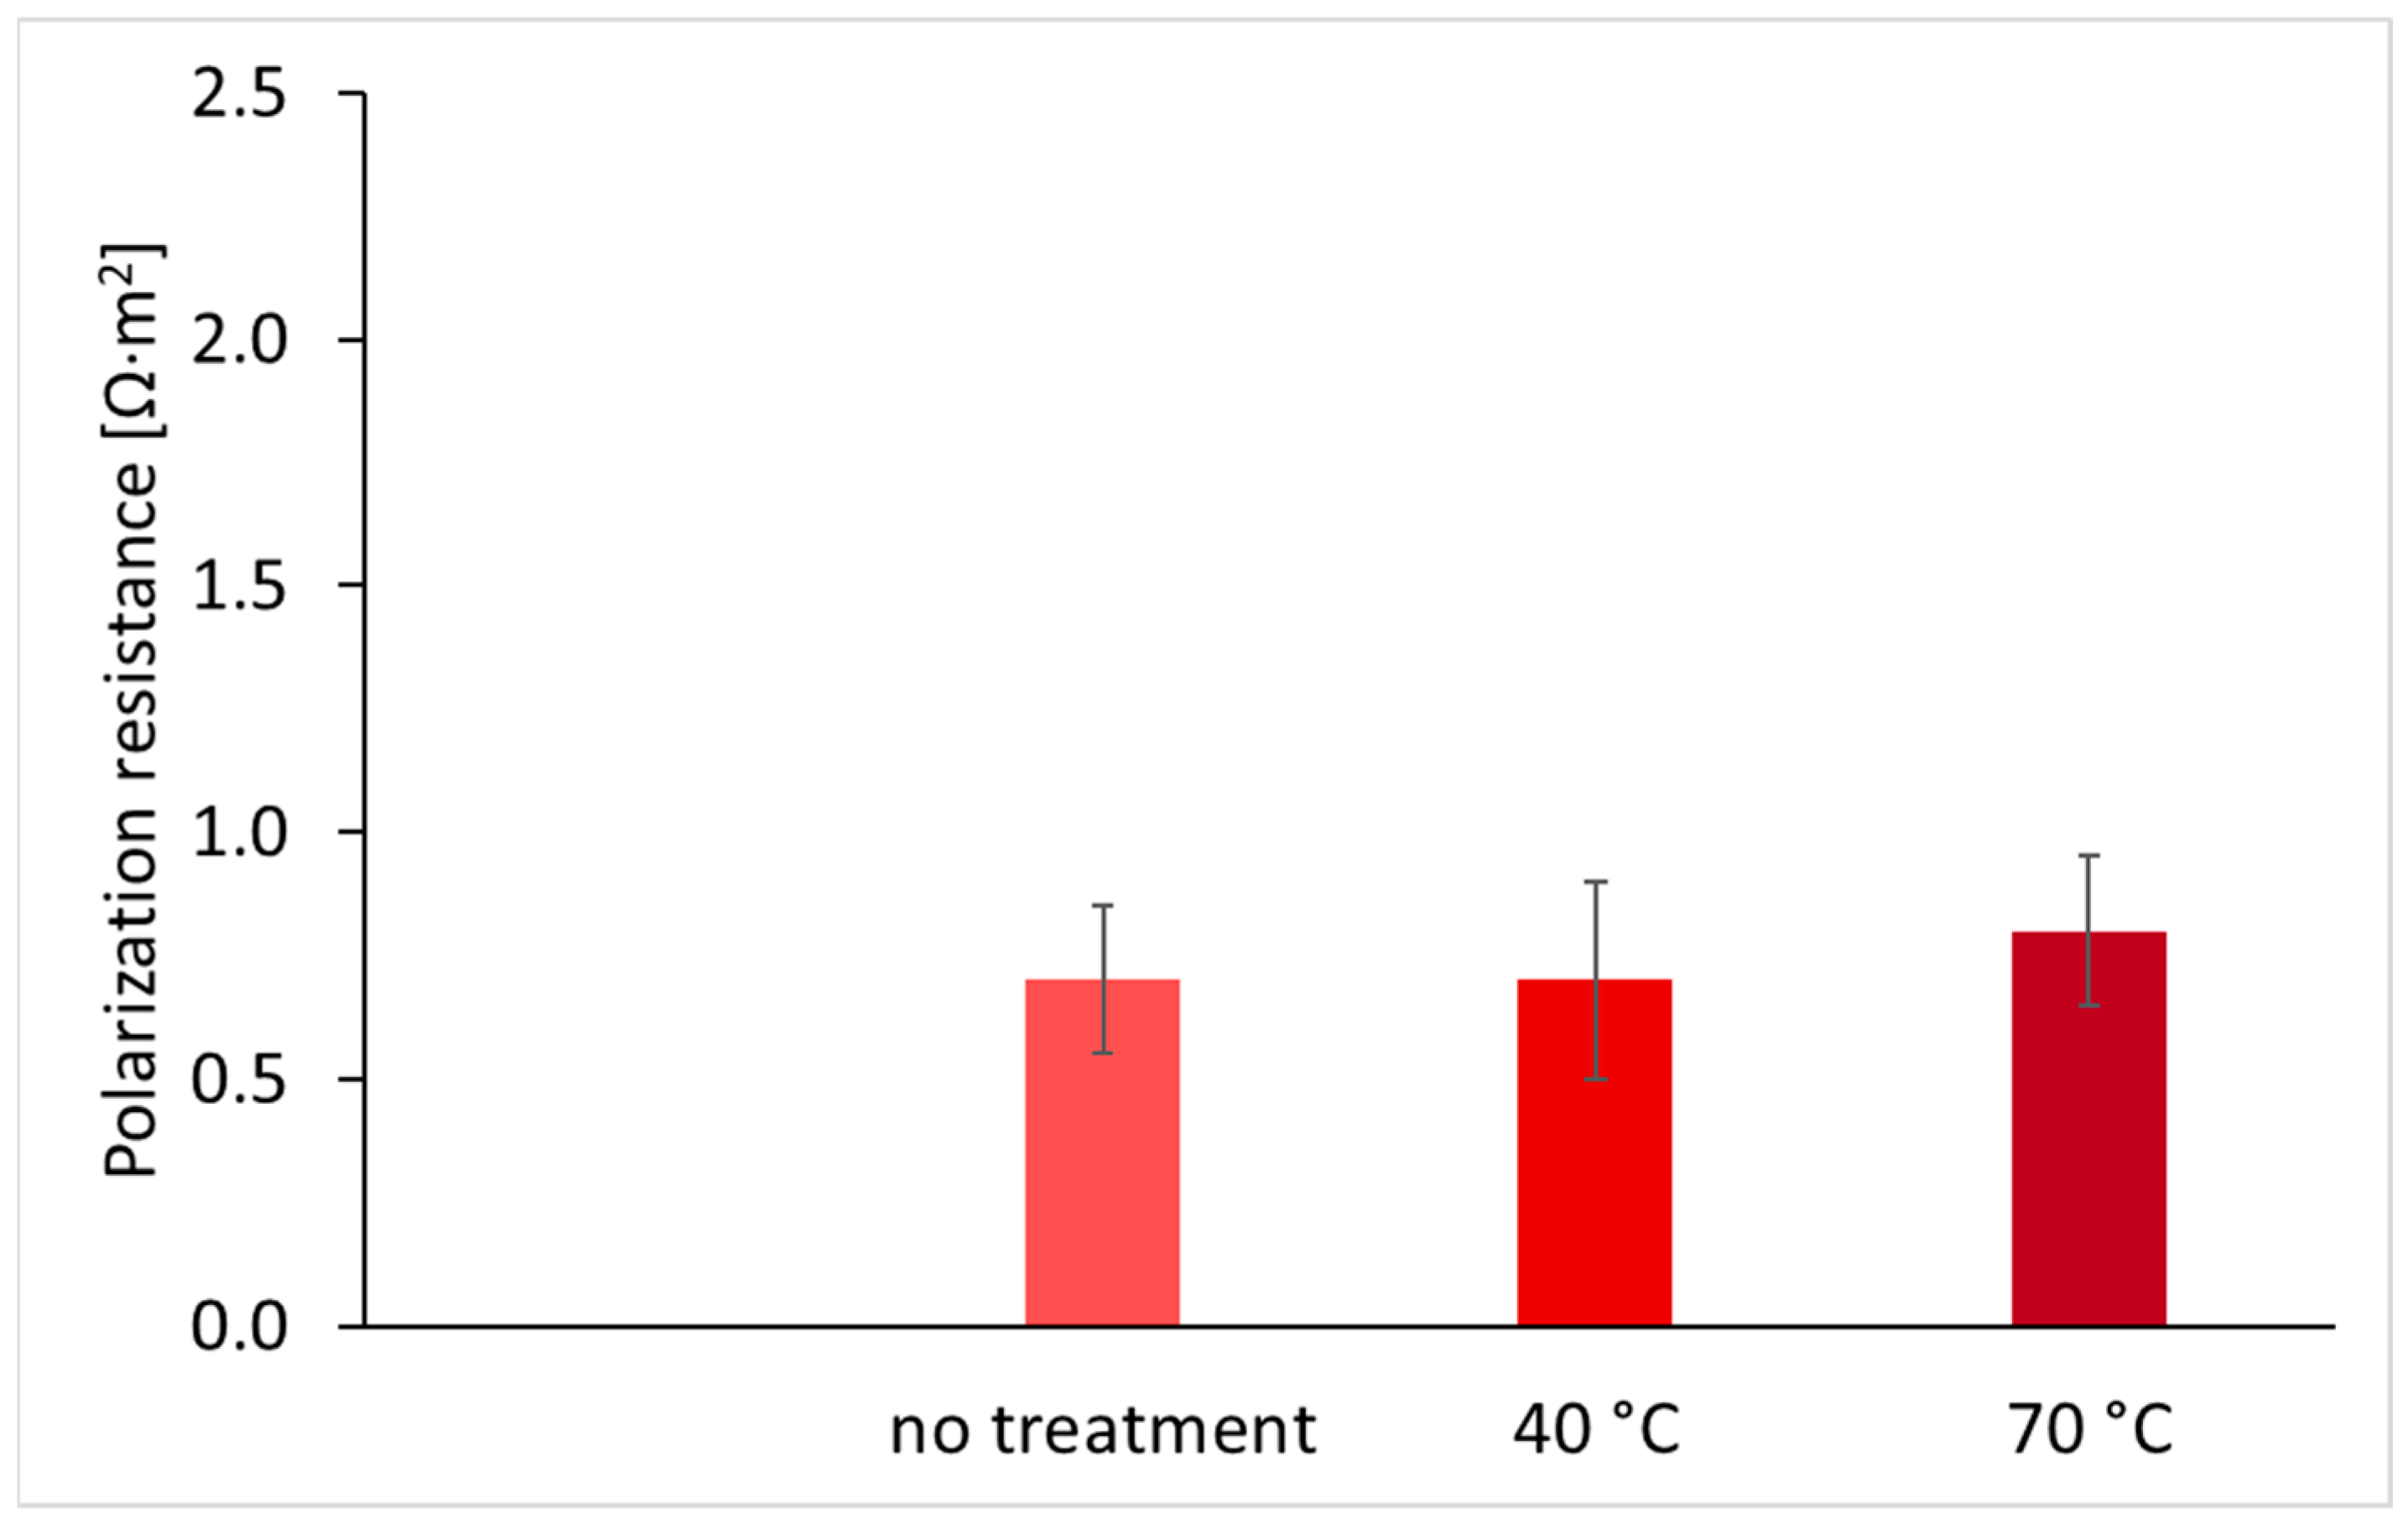
The presence of an aggressive environment in the layer of insufficiently stabilized corrosion products was confirmed by polarization resistance measurements in tap water. Treatment with hot air for 15 min did not lead to a significant increase in polarization resistance, even at a temperature of 70 °C (Figure 7). Although the application of heat leads to partial modification of acetate and partial stabilization of corrosion products in this way, from a corrosion point of view, stabilization did not occur at the metal–corrosion product interface and lead remains in a corrosion-unstable state.

3.3.2. Stabilization of Lead Corrosion Products with Carbon Dioxide

Samples with artificially prepared corrosion products above an acetic acid solution were exposed to a humidified carbon dioxide atmosphere for 2, 7, and 16 days. It is assumed that acetate-based corrosion products will convert to carbonate corrosion products in carbon dioxide at a much faster rate than in a normal atmosphere. The assumed reaction mechanism (1) indicates that moisture is required for the conversion of lead acetate to carbonate in the form of hydrocerussite. Therefore, the introduced CO2 (99.9 vol. %) was humidified by passing it through water in a scrubber. It is assumed that the relative humidity in an atmosphere composed of pure CO2 is close to 100%. The reaction product is volatile acetic acid that escapes with the flow of humidified carbon dioxide. For effective ventilation of acetic acid, it is desirable that the treated object is exposed to flowing carbon dioxide, not just stagnant gas.
Pb(CH3COO)2∙2PbO∙1/2H2O + 2CO2 + 3/2H2O → Pb3(CO3)2(OH)2 + 2CH3COOH ↑
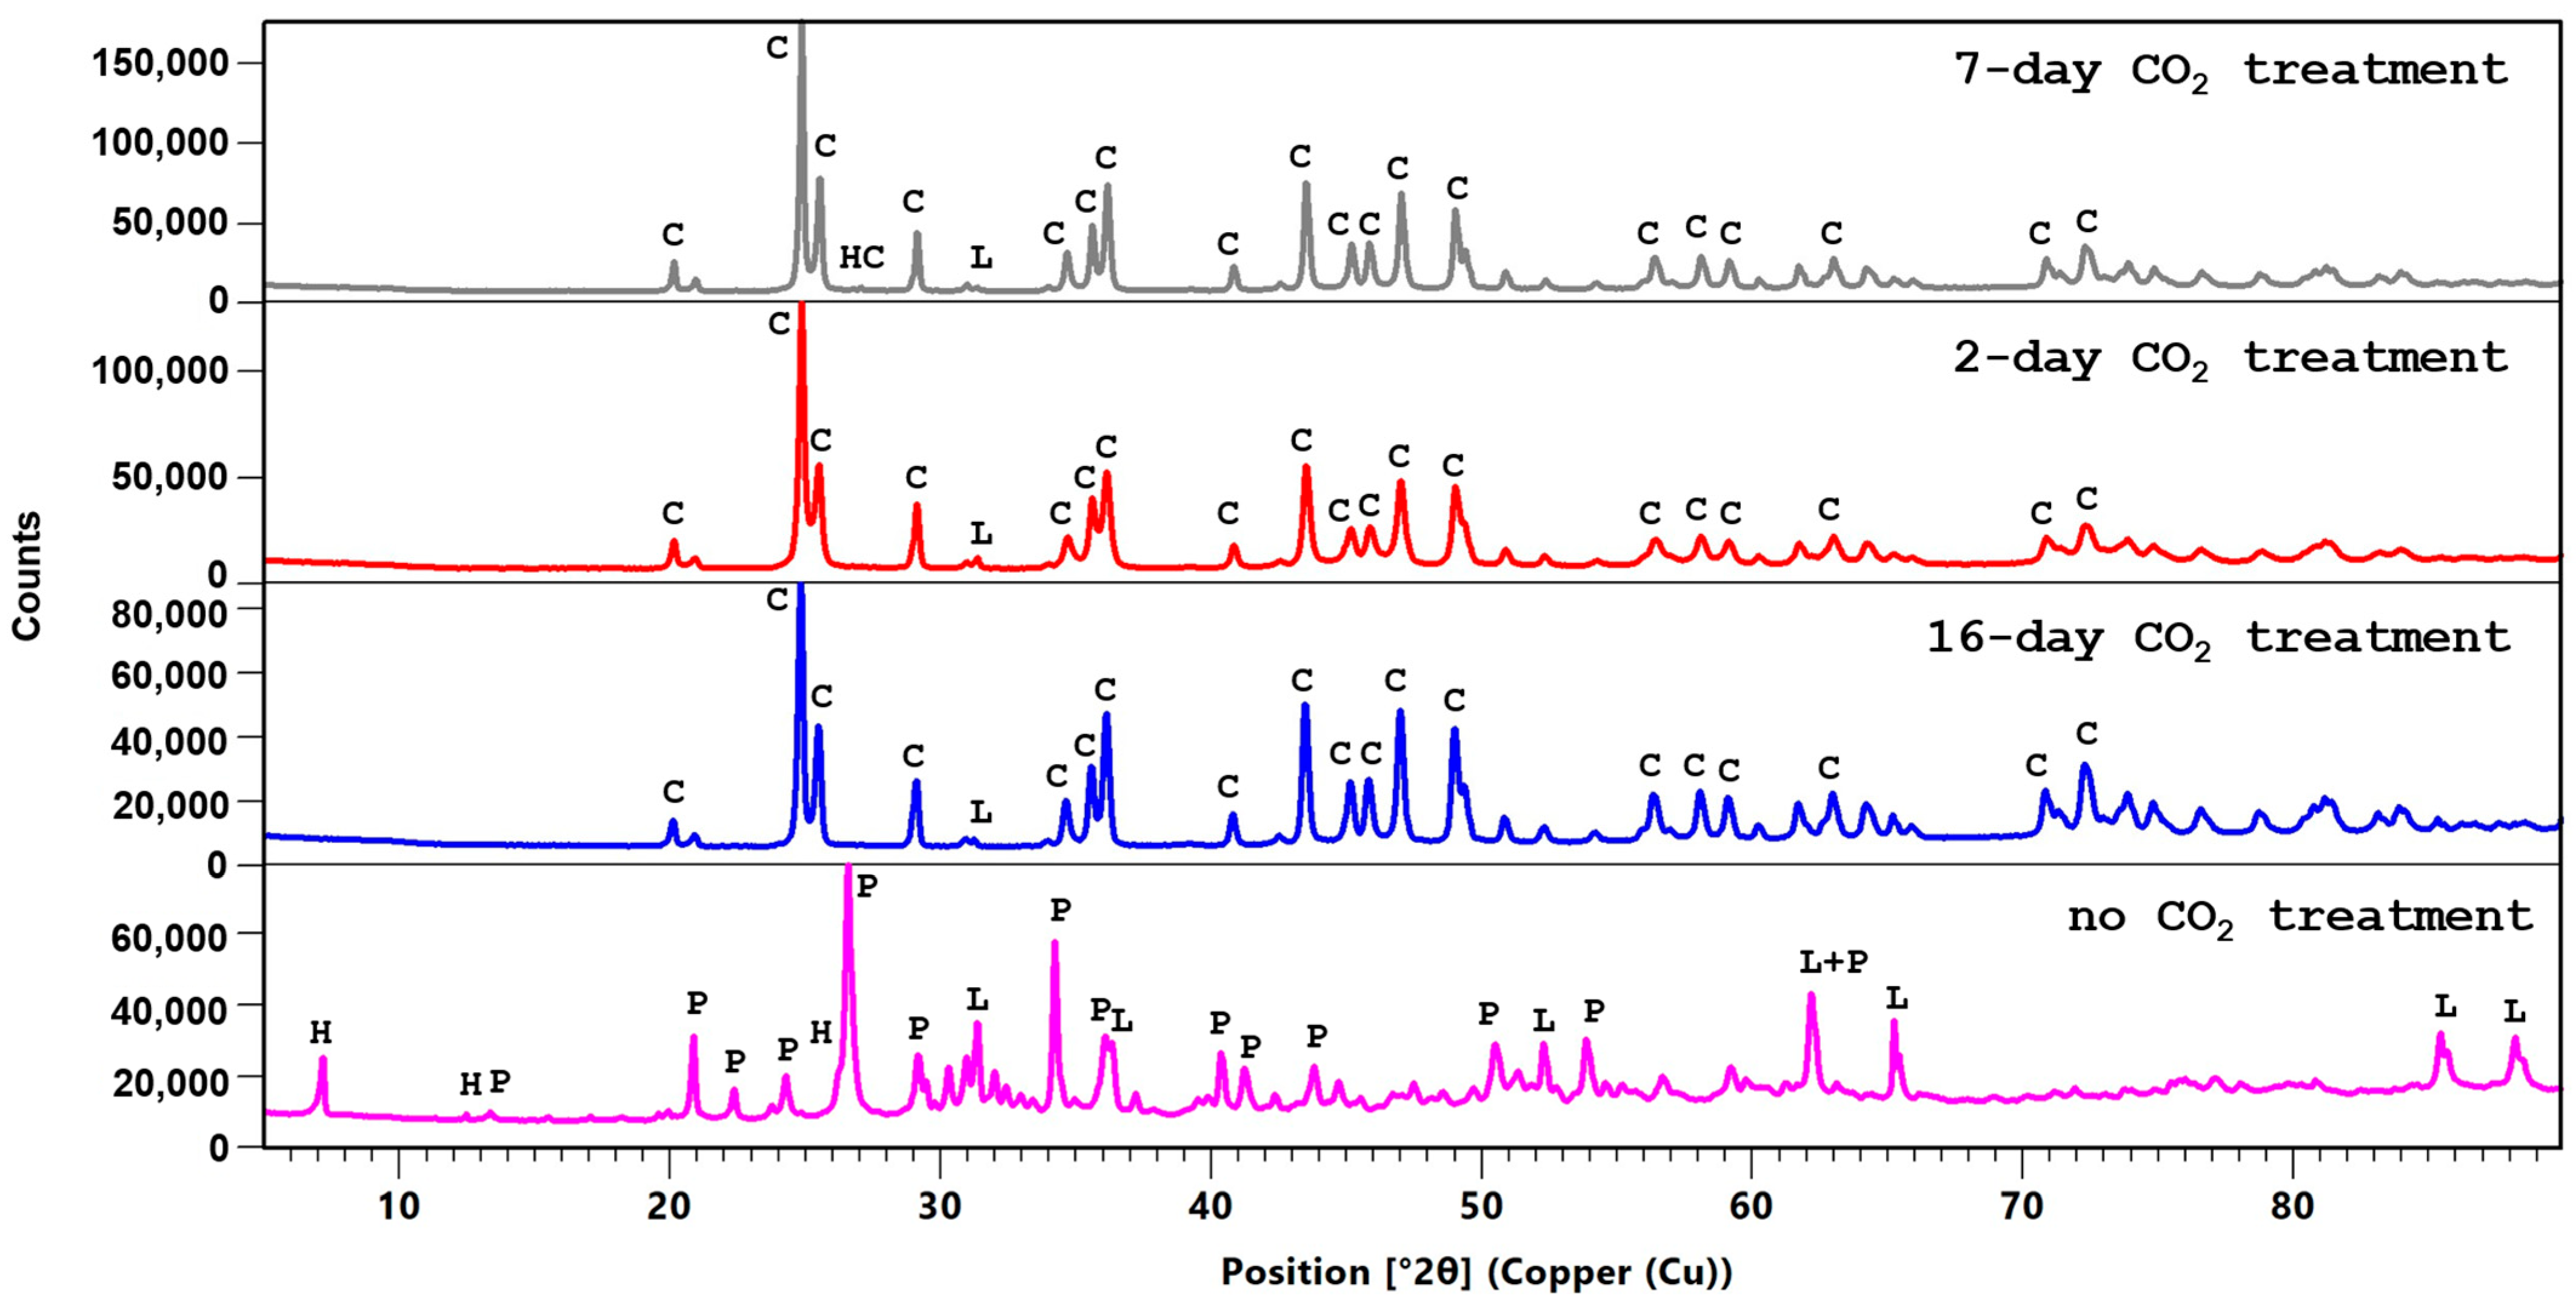
The phase composition of the corrosion products after carbon dioxide treatment compared to the untreated sample is shown in Table 5 and examples of diffraction patterns are presented in Figure 8. Previous results have shown that phase analysis of the layer adhering to the surface of the corrosion sample does not reveal the composition of the internal volume of corrosion products; only the phase composition and its semi-quantitative evaluation of homogenized corrosion products removed from the corrosion sample with a scalpel are obtainable. To demonstrate the high efficiency of stabilizing corrosion products using carbon dioxide, the results of stabilizing a thick layer of corrosion products prepared artificially by exposure to a 10 mM acetic acid solution are presented for the longest selected period, that is, 16 days. The analysis shows that after only two days of carbon dioxide, the acetate content in the corrosion products is below the detection limit, which is expected to be 1% if the phases remain crystalline. After 2 days of stabilization, the acetate response no longer appears. However, a surprising finding is that shortly after the start of stabilization, plumbonacrite also disappears completely. The only carbonate phase that appears on the treated samples is cerussite (PbCO3). Therefore, all acetate is rapidly converted to cerussite during CO2 treatment, but at the same time, plumbonacrite is also transformed into cerussite. This is the result of the action of an acidic CO2 solution in water on alkaline phases, a process known, for example, in lime and concrete, as carbonation. According to the original assumption (1), hydrocerussite is not formed. Therefore, the transformation of acetate apparently proceeds according to (2), and plumbonacrite completely carbonates according to (3).
Pb(CH3COO)2∙2PbO∙1/2H2O + 3CO2 + 1/2H2O → 3PbCO3 + 2CH3COOH ↑
Pb5(CO3)3O(OH)2 + 2CO2 → 5PbCO3 + H2O
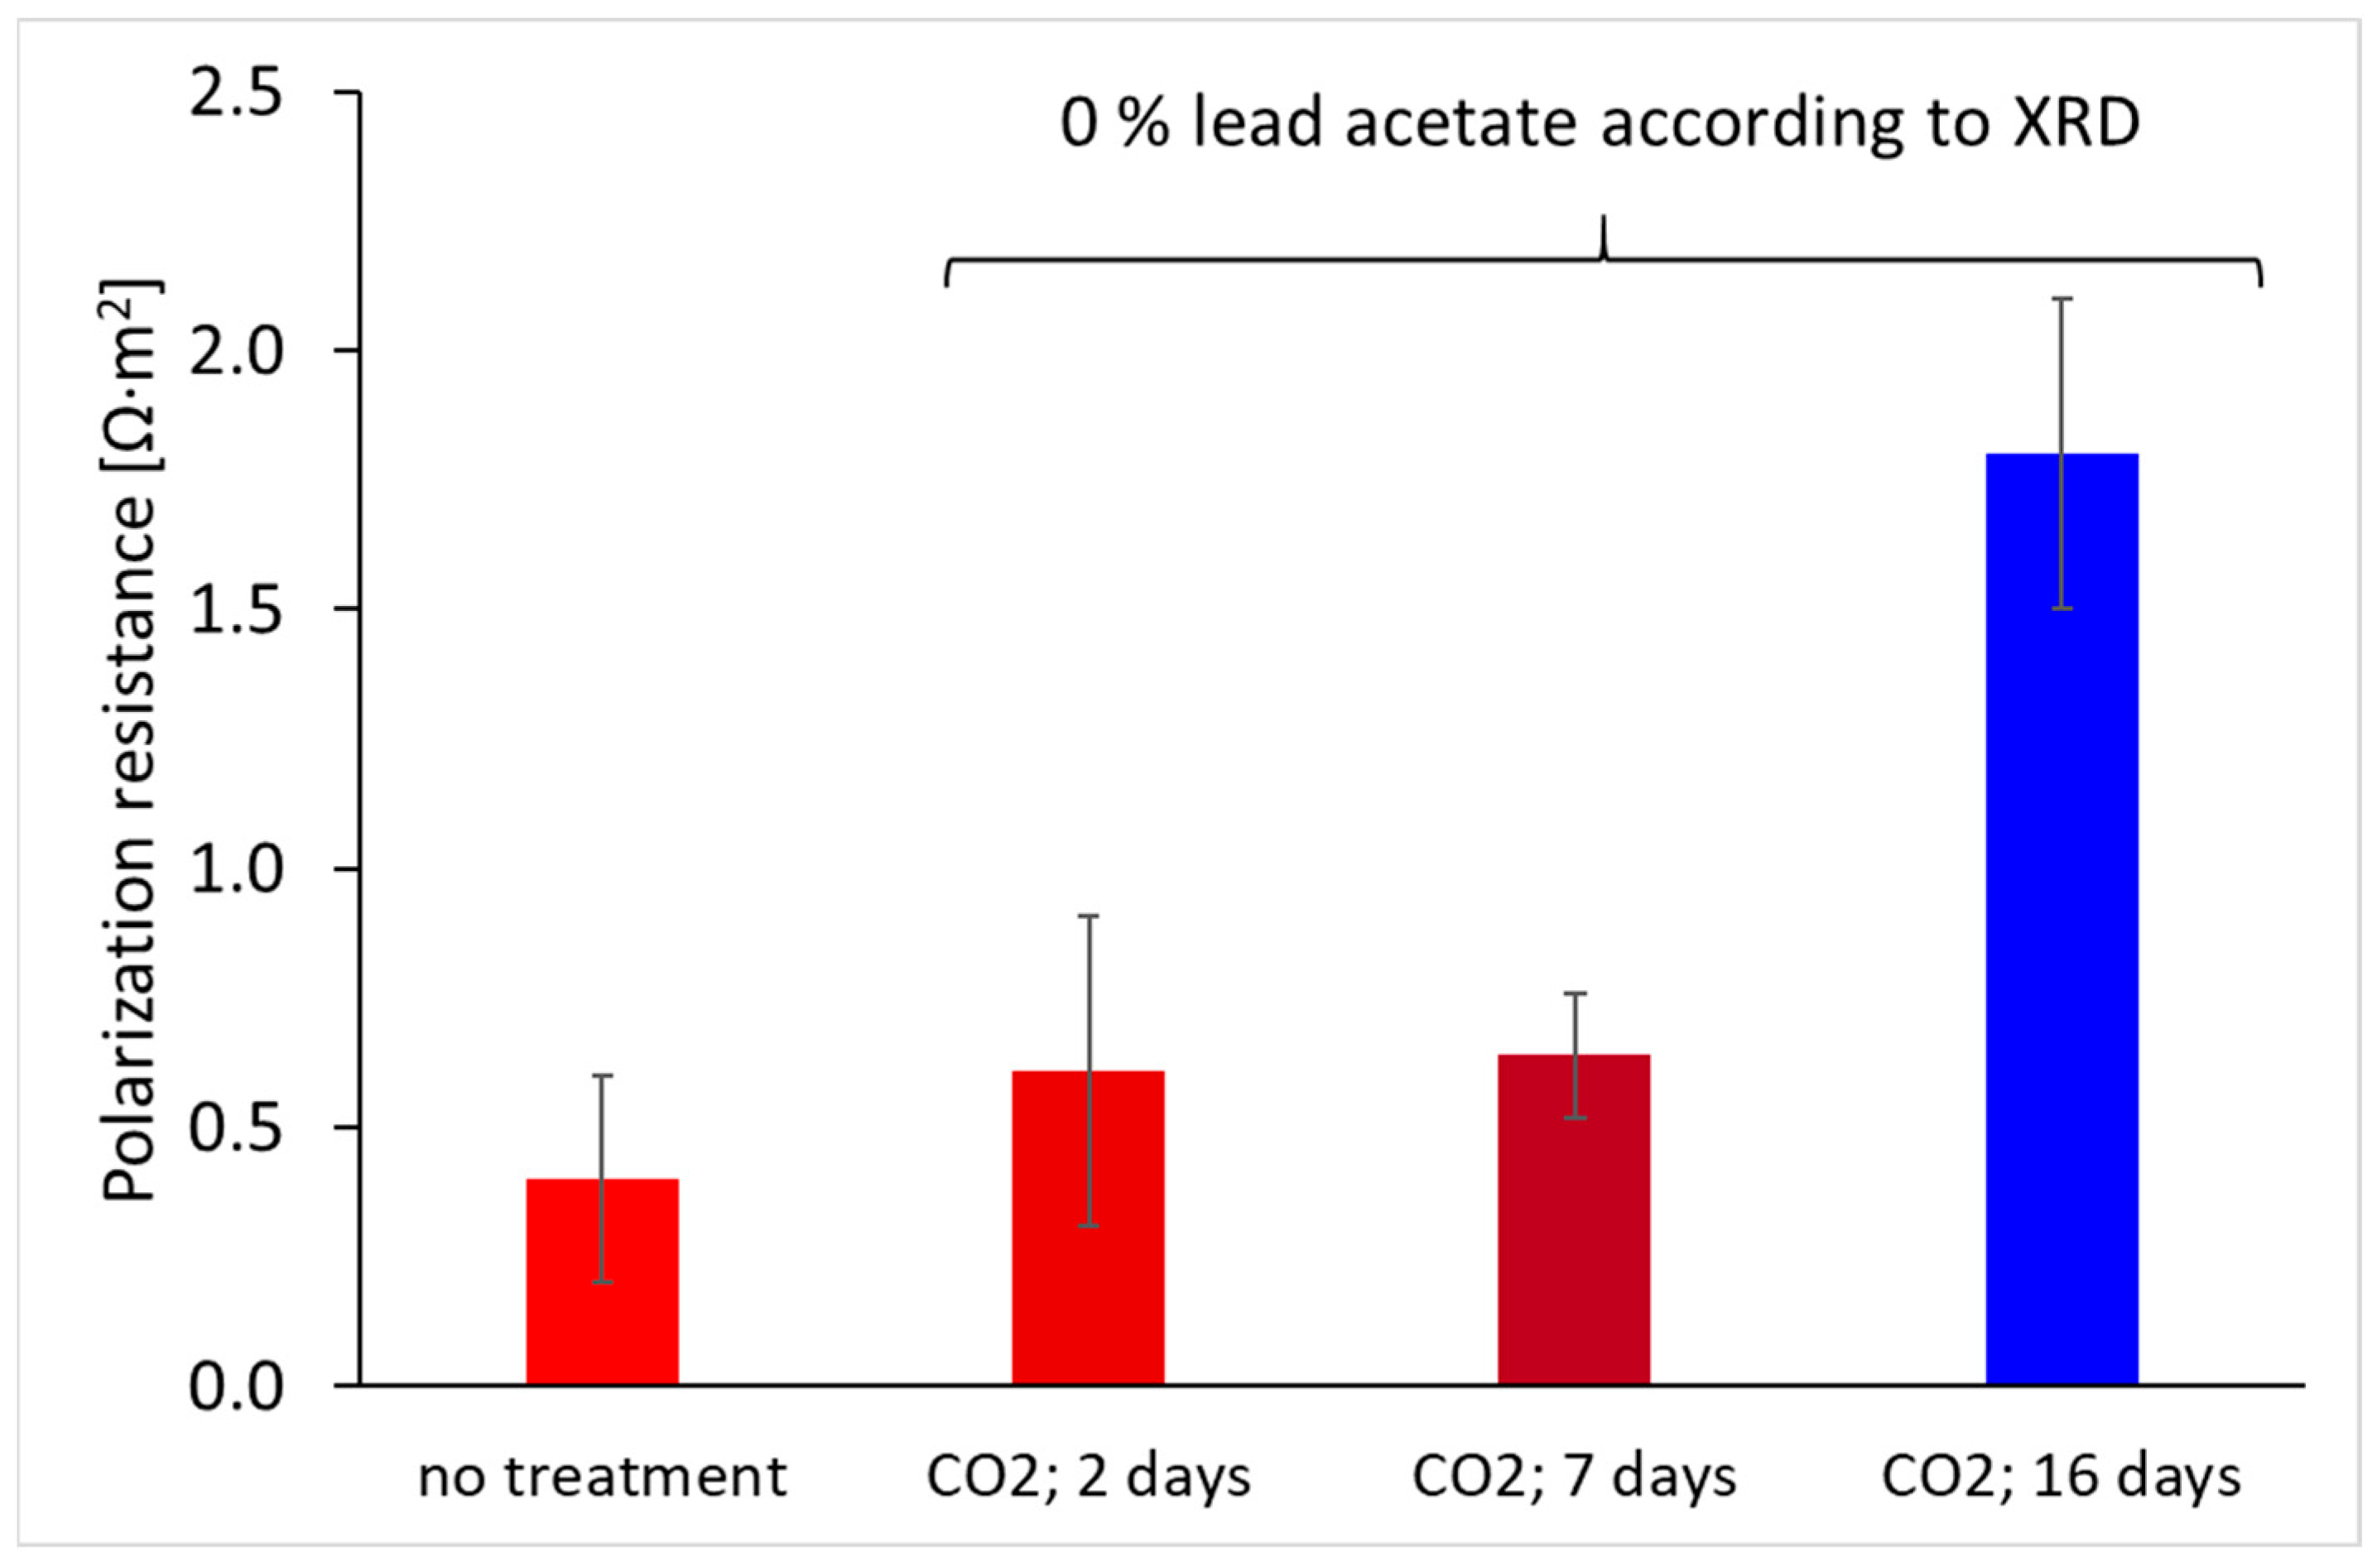
The stabilization of corrosion products caused by carbon dioxide is reflected in an increase in polarization resistance in tap water and thus a reduction in the corrosion rate of lead under the layer of corrosion products. In samples treated with carbon dioxide for 16 days, we observed an increase in polarization resistance from values in the tenths of Ω·m2 range to values close to 2 Ω·m2 (Figure 9). Discrepancies were observed between the results of the XRD analysis and the polarization resistance measurements in the samples treated for 2 and 7 days. Although the phase analysis did not detect any traces of the original acetate, the polarization resistance remained at a low value corresponding to a corrosion-unstable state and increased corrosion rate. Therefore, it is clear that polarization resistance measurements in a non-aggressive tap water environment can reveal the corrosion state of corroded lead with greater sensitivity than phase analysis of corrosion products.

3.3.3. Corrosion Rate of Lead During Stabilization of Lead Corrosion Products with Carbon Dioxide

Monitoring corrosion loss and corrosion rate of metal under a layer of corrosion products during exposure to atmospheric conditions cannot be based on electrochemical methods such as polarization resistance because during measurement, the monitored metal must be immersed in an ion-conductive environment—an electrolyte. Under atmospheric conditions, a suitable corrosion monitoring method is the resistometric method based on measuring metal corrosion loss through changes in the electrical resistance of the thin layer of the metal in question. A resistometric lead sensor was used to monitor the corrosion loss of lead throughout the process of artificial formation of corrosion products and their subsequent stabilization in carbon dioxide.
Steps for exposing the resistometric sensor:
  • Until the 21st hour of recording, exposure in the laboratory atmosphere.
  • From the 21st hour to the 187th hour, exposure in air above a 10 mM acetic acid solution.
  • From hour 187 to hour 238, exposure in air above pure water without a source of acetic acid.
  • From hour 238 to hour 292, exposure in air above a saturated NaCl solution.
  • From hour 292 to hour 458, exposure in a CO2 atmosphere above a NaCl solution.
  • From hour 458 to hour 508, exposure in air above a NaCl solution.
  • From hour 508 to hour 644, exposure in a CO2 atmosphere above clean water.
  • From hour 644 to hour 700, exposure in air above clean water.
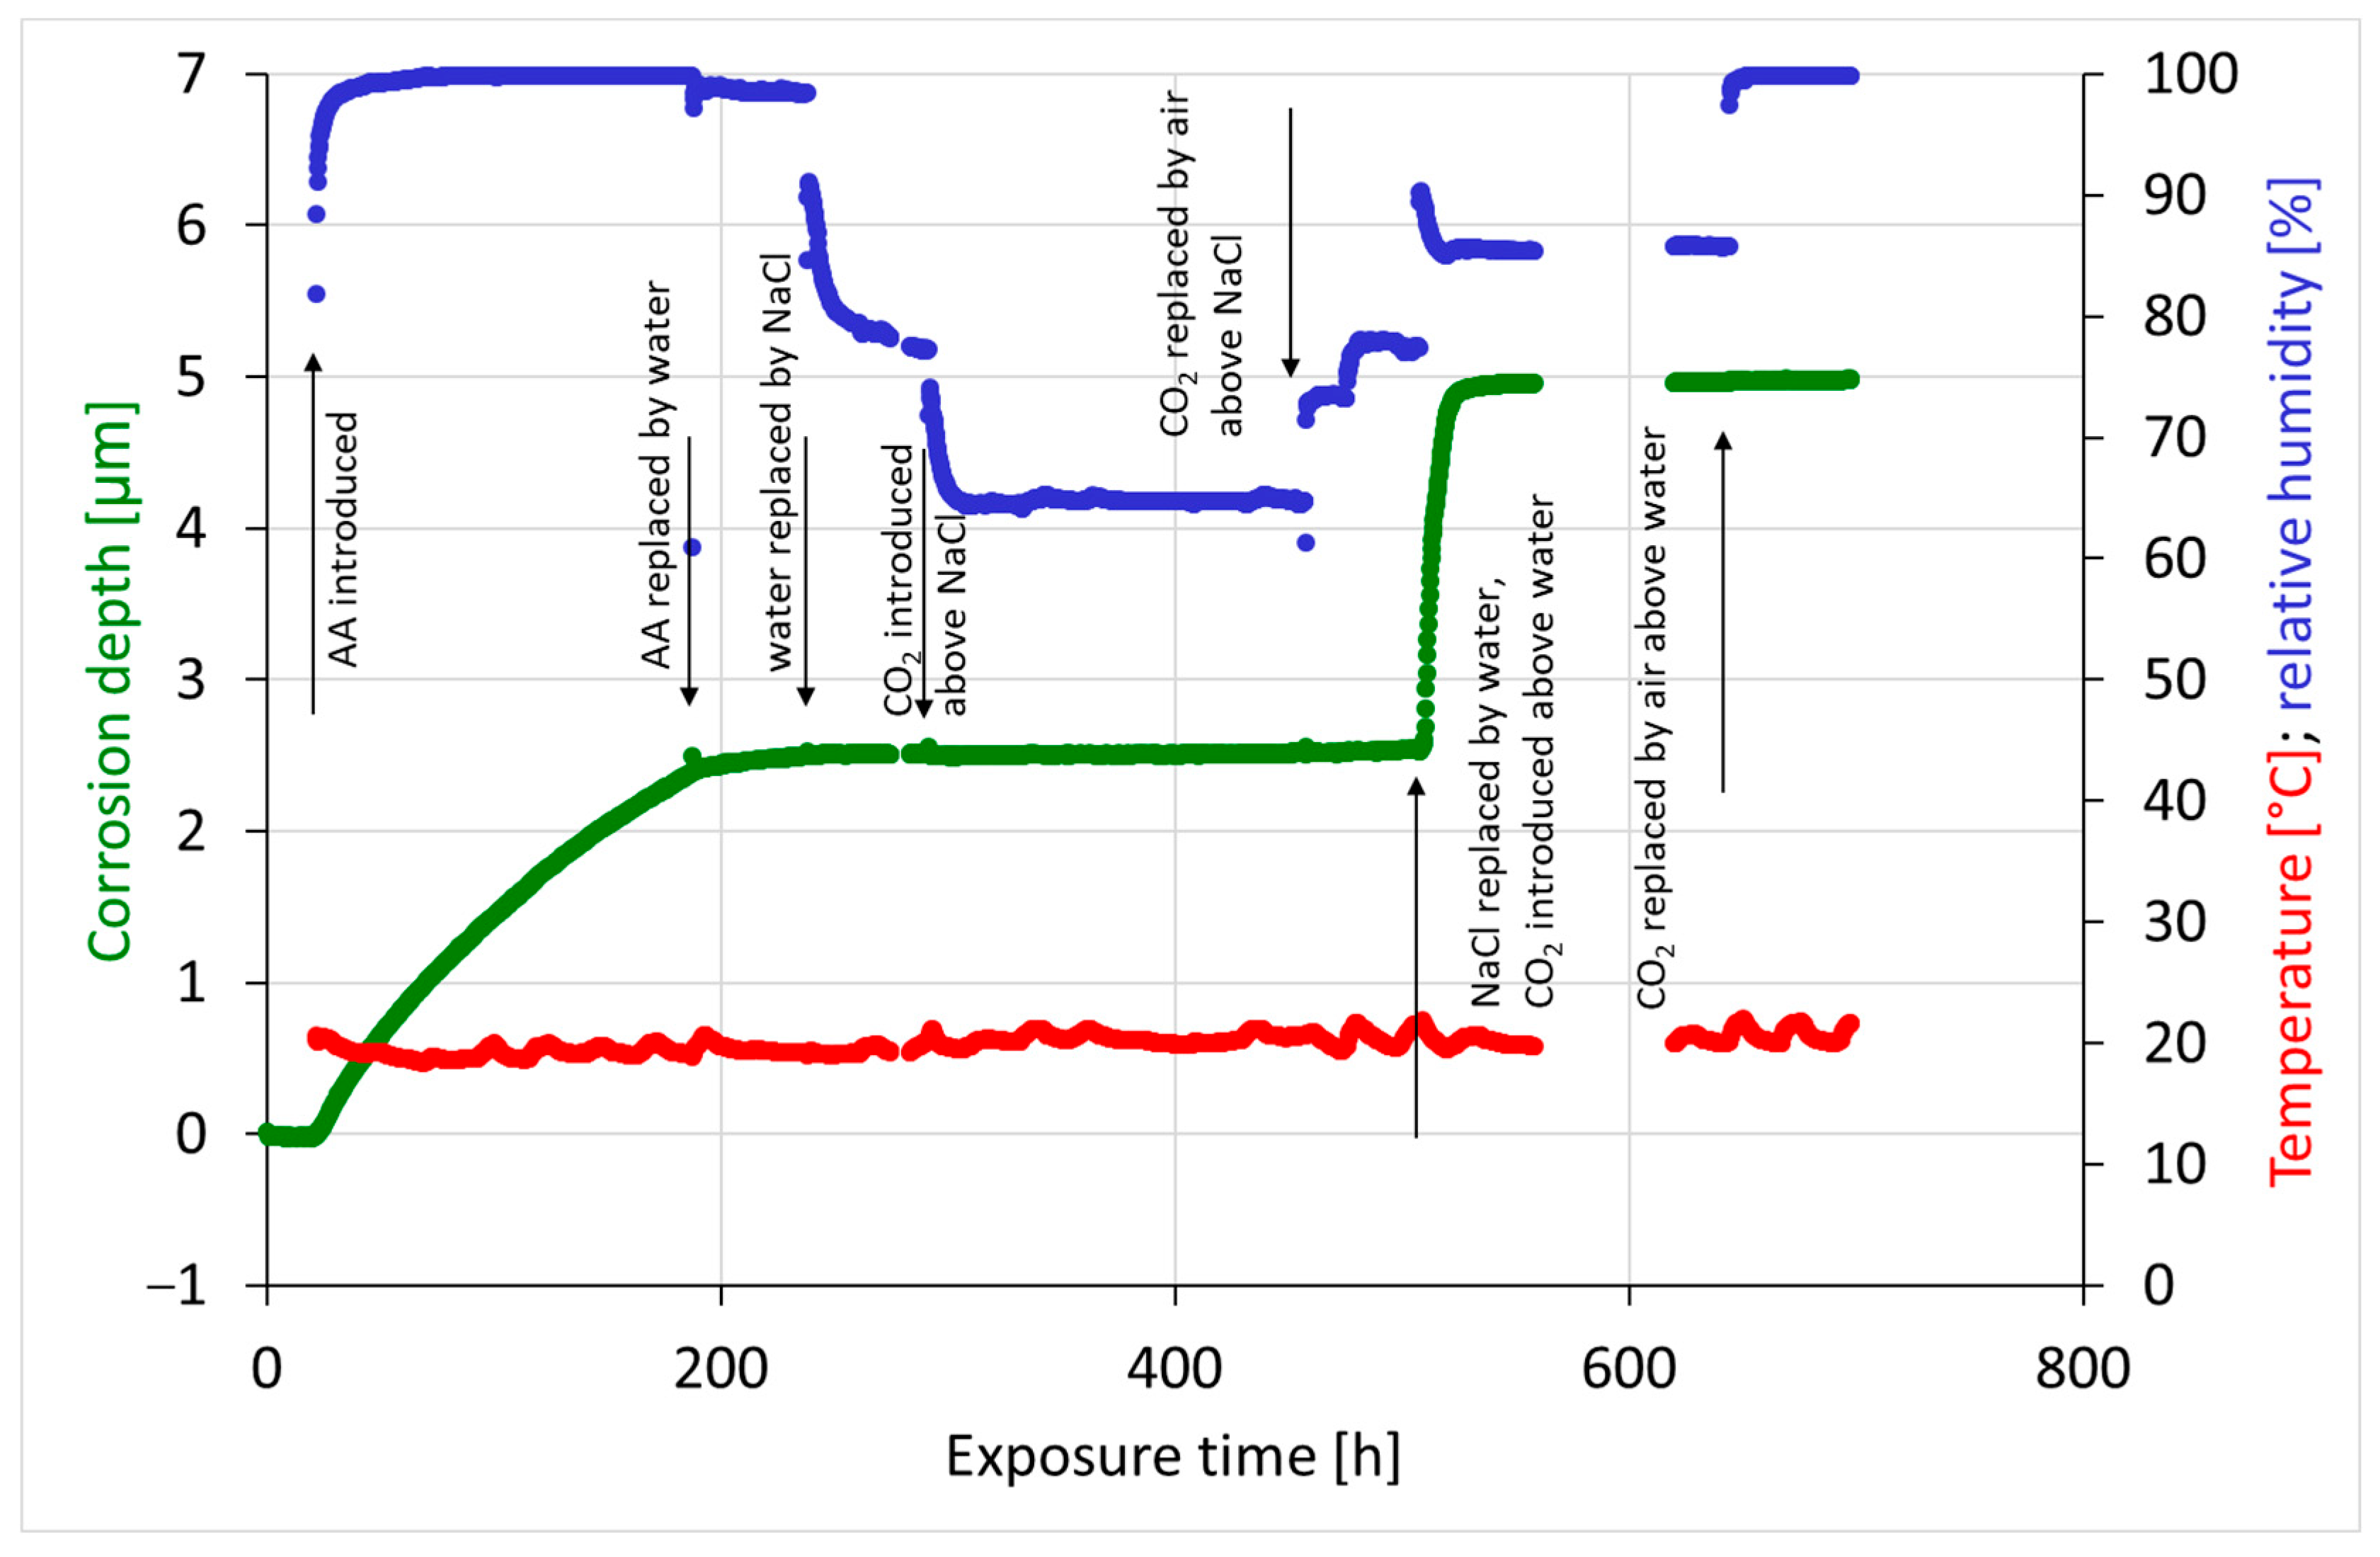
The complete corrosion depth of the resistometric lead sensor is shown in Figure 10. The record can be divided into eight phases corresponding to the individual steps of exposure. Some phases are characterized by a high corrosion rate, where the trend slope is high, and in some phases the corrosion rate is low to negligible, where the trend slope is low. Phase 7 is special, where the corrosion rate is high at first, but after a short time the corrosion almost stops. The corrosion rates in the individual phases, evaluated as the slope of the linear regression of the given section, are shown in Table 6 together with the values of the free corrosion potential and polarization resistance of the corrosion samples in tap water exposed in parallel with the resistometric sensor under the same conditions and removed at the end of each phase. The record in Figure 10 is supplemented by the temperature and relative humidity values recorded during exposure.
In the first step, the lead sensor shows no corrosion loss, because the laboratory atmosphere is not sufficiently aggressive toward the lead sensor. The polarization resistance measured in tap water on a lead sample without visible corrosion products is 1.9 Ω·m2, which corresponds to a corrosion-stable state.
In the second step, after adding acetic acid (10 mM) to the exposure chamber, the relative humidity immediately increases to a value close to saturation, and acetic acid vapors are released into the atmosphere of the chamber. This triggers an immediate reaction of the lead resistometric sensor, whose thickness rapidly decreases until the end of step 2, when the acetic acid source is replaced with pure water. The average corrosion rate of lead during step 2 is 14 nm·h−1. Both the corrosion sample and the sensor are covered with an even layer of corrosion products. The polarization resistance measured on the lead sample removed at the end of the second phase is 0.2 Ω·m2, which corresponds to an unstable and corrosion-active state.
Although the source of acetic acid was removed for the third step, the corrosion rate of the resistometric sensor remains measurable and is approximately 2 nm·h−1. Relative humidity in this phase remains high, almost 100%, due to the presence of water. According to the polarization resistance value (0.3 Ω·m2), the corrosion sample also remains in a corrosion-active state, although the exposure chamber no longer contained acetic acid vapors.
In the fourth step, a beaker with a saturated sodium chloride solution with an excess of undissolved NaCl crystals was present in the exposure chamber. The purpose of this system was to reduce the relative humidity within the chamber to a level close to equilibrium, that is, 75%. The relative humidity in the fourth phase gradually decreased and reached the desired value. The corrosion rate of the lead sensor was negligible in this phase (0.2 nm·h−1), which was due to lower humidity of the exposure atmosphere. However, the corrosion activity of the lead sample remains high, as evidenced by the low polarization resistance measured in tap water (0.4 Ω·m2).
In the fifth step, the corrosion products of lead were stabilized with carbon dioxide at reduced relative humidity. In this phase, humidified carbon dioxide was introduced into the chamber, but the relative humidity inside the chamber was regulated by a saturated sodium chloride solution with NaCl crystals. The resulting relative humidity ranged from 64 to 65% as recorded by the digital capacitive RH meter. During this phase, almost no corrosion loss of the sensor was observed. The almost-zero corrosion rate (0.1 nm·h−1) may be the result of both the stabilization of corrosion products and the relatively low humidity or the absence of oxygen in the exposure chamber. However, the polarization resistance of the parallel exposed lead sample indicates that the corrosion products did not stabilize, since the polarization resistance remained at the level of tenths of Ω·m2 (0.4 Ω·m2).
The fact that the low corrosion rate of the sensor in the fifth step was due to the absence of oxygen in the exposure chamber is evidenced by the corrosion rate of the sensor in the sixth step, in which air was introduced into the chamber instead of CO2. The corrosion rate increased to 0.5 nm·h−1, which is still a very low value, but several times higher than in a carbon dioxide atmosphere. However, at the same time, relative humidity increased to 77%, so an increase in relative humidity in insufficiently stabilized lead may be the cause of a slightly increased corrosion rate in an atmosphere without acetic acid vapors. The persistent corrosion activity of lead under corrosion products even after the sixth phase is confirmed by the low polarization resistance of 0.3 Ω·m2.
If the lead sensor and samples have not yet undergone complete corrosion stabilization and conversion of lead acetates to stable carbonates, a possible cause of this insufficient stabilization is a lack of moisture in the exposure atmosphere. Therefore, in the next step, humidified carbon dioxide was introduced into the reaction chamber, and the relative humidity inside the chamber was not additionally limited by a saturated NaCl solution. Instead, a beaker of clean water was placed in the chamber to maintain maximum relative humidity. The relative humidity gradually stabilized at 85%. Immediately after CO2 was introduced into the chamber, the lead sensor began to corrode rapidly. During the first 10 h, almost 2.3 µm of lead was lost, which corresponds to a corrosion rate of 187 nm per hour. This high rate is a manifestation of lead corrosion directly in the humid CO2 atmosphere or the interaction of lead with acetic acid released in large quantities by the effective transformation of lead acetate to carbonate. After this short 10 h episode, the corrosion rate of lead drops dramatically and is negligible (0.1 nm·h−1) in the following phase of exposure to humid carbon dioxide. The corrosion rate remains immeasurably low even in the final stage of exposure, when the chamber is filled with humid air. Although the resulting relative humidity is almost 100% and oxygen is present, the corrosion rate is still 0.1 nm·h−1, which indicates an effective stabilization process by previous exposure to humid carbon dioxide. The successful transformation to a stable state is also confirmed by the polarization resistance values of the lead samples in tap water, which were as high as 23 and 15 Ω·m2, respectively, at the end of the seventh and eighth steps. The qualitative change in the corrosion behavior of lead is also confirmed by the values of the free corrosion potential, which were close to −500 mV (SCE) before stabilization treatment or insufficient treatment, while after treatment in carbon dioxide with high humidity (steps 7 and 8), the free potential was significantly more positive, at −200 and −300 mV (SCE), respectively.

3.4. Identification of the Corrosion State of Historical Lead Objects by Measuring Polarization Resistance with a Local Electrode

The measurement of the corrosion rate of lead using the polarization resistance in tap water is, obviously, only feasible on a more-or-less smooth and horizontal surface of lead. Real historical objects usually have a relief surface due to minting or the shape of the casting mold, and the position of the surface may not always be completely horizontal. In such cases, it is advantageous to use a combined electrode containing, in addition to the necessary components, a counter electrode and a reference electrode, a solid electrolyte instead of a cell with tap water. The shell of the combined electrode was a glass tube, the mouth of which was closed with a paper tampon. During measurement, the tampon was soaked with water and able to adapt to the shape of the relief surface of the object. A saturated calomel electrode was inserted into the glass tube as the reference electrode, and a platinum wire served as a counter electrode. The assembly was then filled with a liquid cooling solution of agar in tap water, which, after solidification, acts as a non-aggressive electrolyte, maintaining the necessary moisture of the paper tampon pressed against the surface of the object under investigation, without causing the electrolyte to leak from the combined electrode onto the surface of the object.
The combined electrode prepared in this way was used to measure the polarization resistance of lead samples with an artificially created layer of corrosion products by exposure to a 10 mM acetic acid solution, thereby verifying the response in the combined electrode arrangement compared to the measurement results previously reported in tap water. Figure 11 shows that the combined electrode recorded almost the same results as direct exposure in tap water (Figure 6). The corrosion-active state is manifested by a polarization resistance in the order of tenths of Ω·m2, while the corrosion-stable state is characterized by values that are several times higher, exceeding 2 Ω·m2.
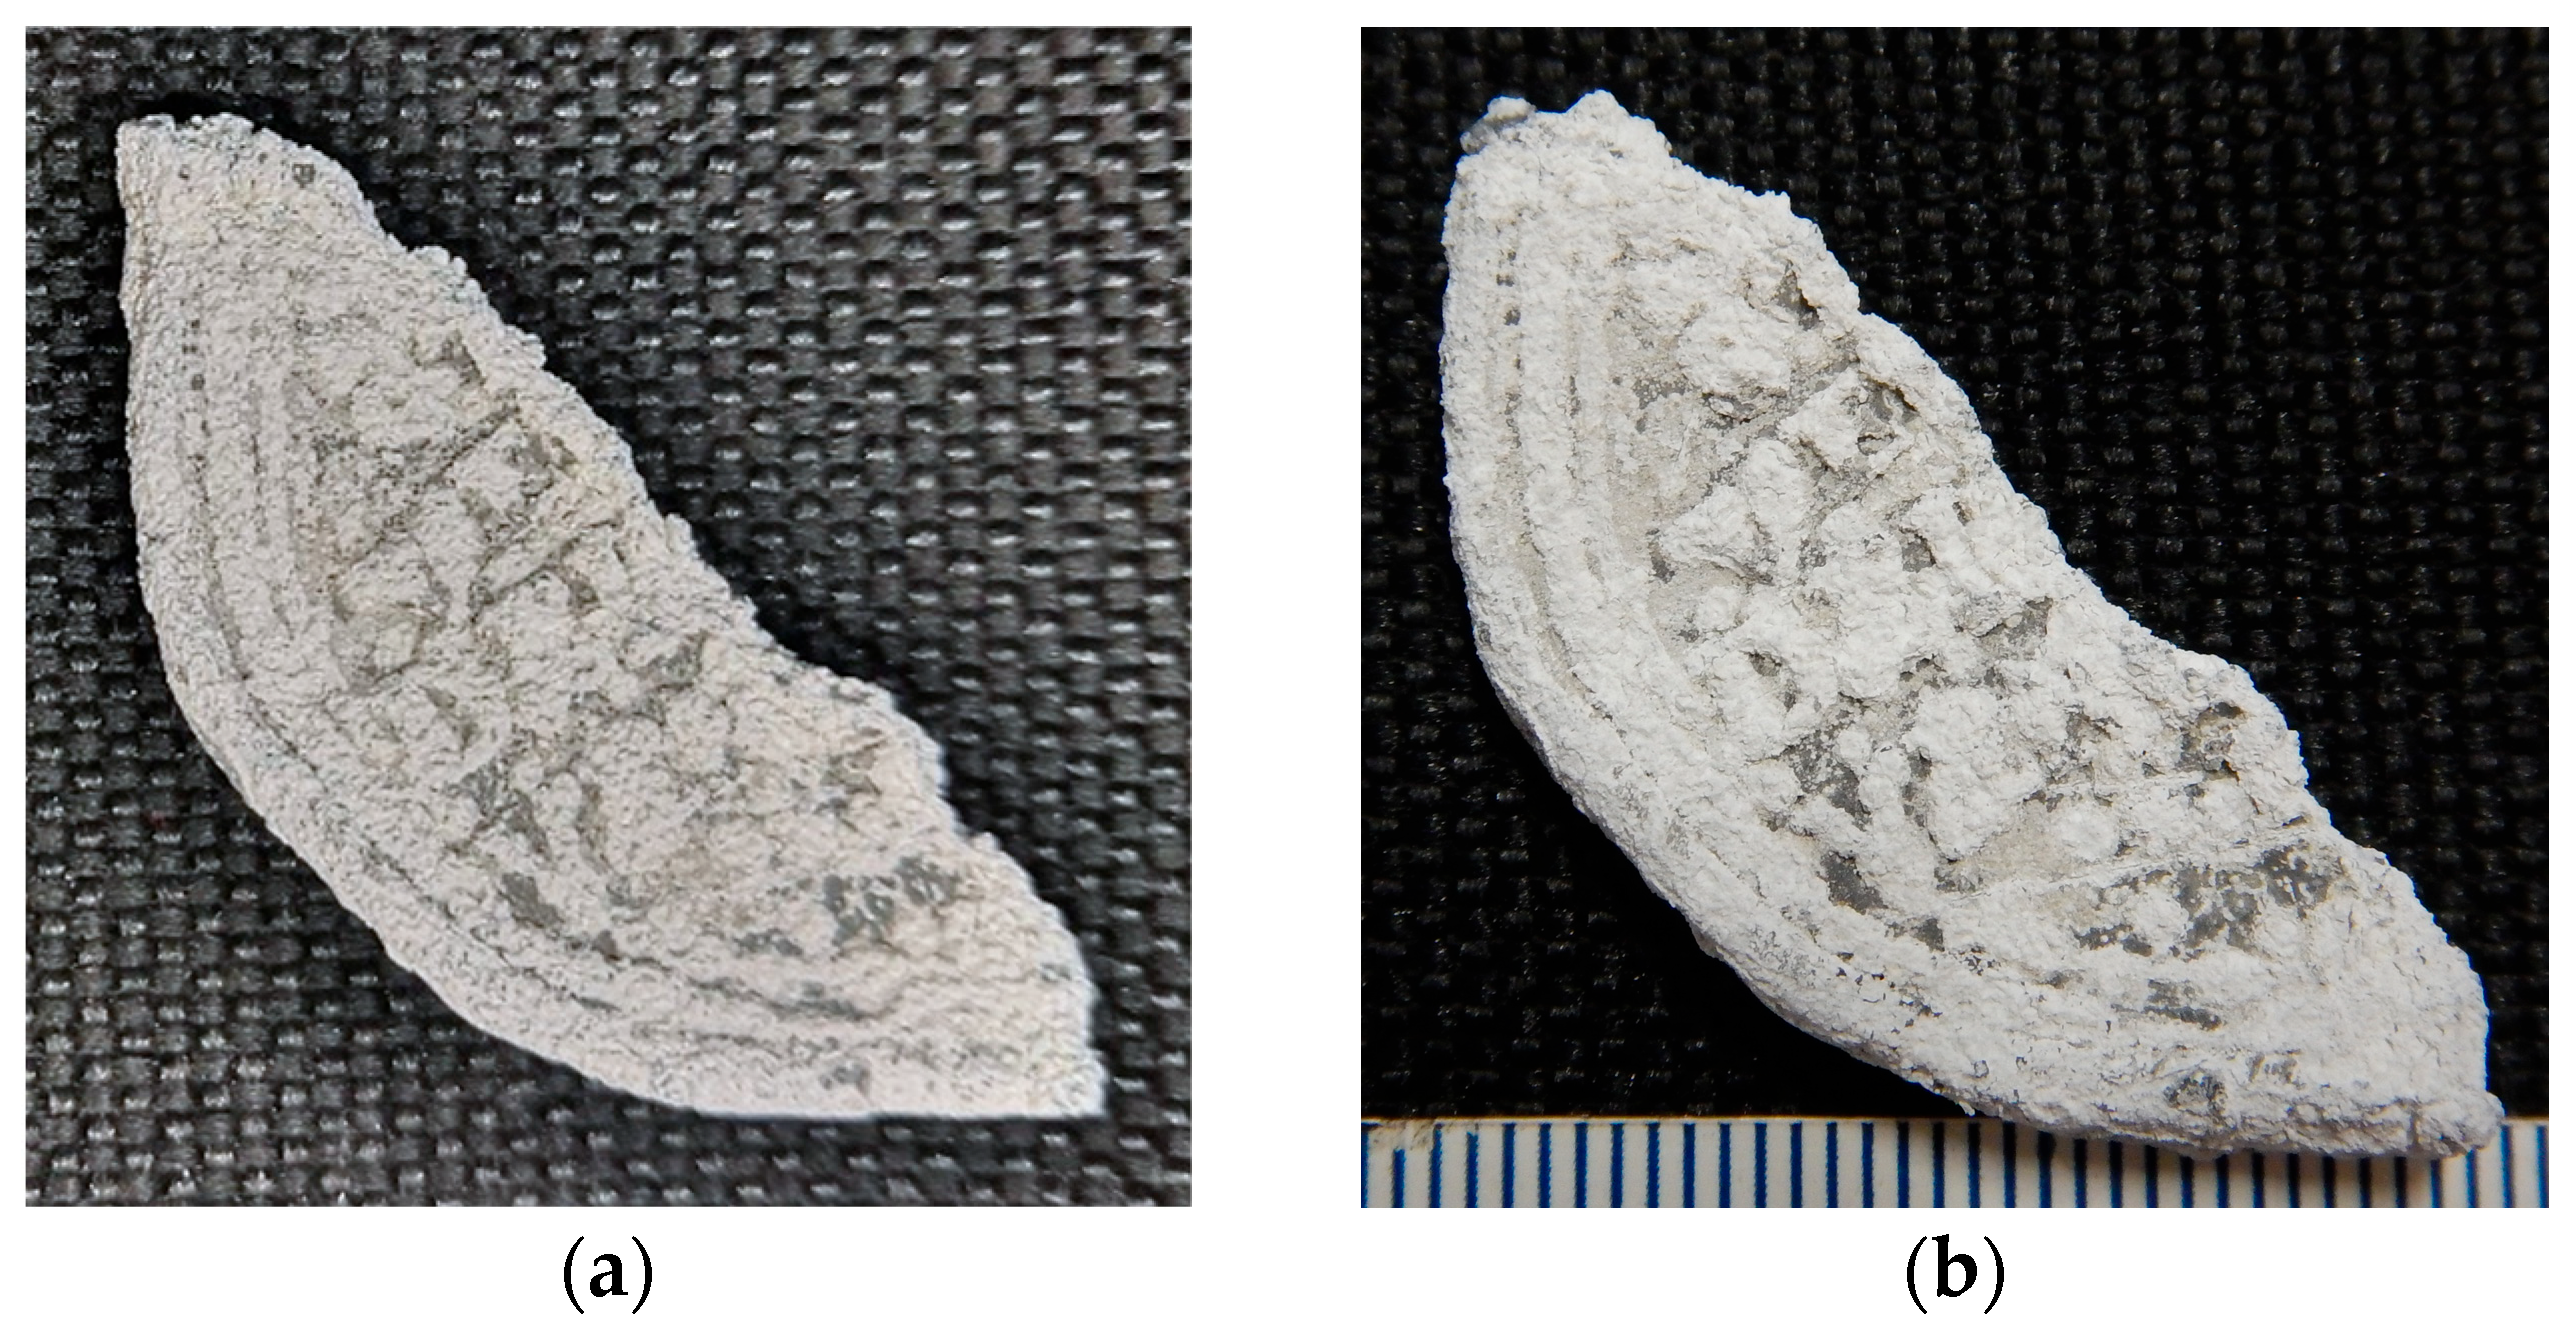
A combined electrode was used to determine the corrosion status of small historical lead objects. Three lead tokens and a fragment of a lead seal served as representatives of such objects (Figure 12). The history of these objects is unknown. The lead tokens were purchased on the Aukro.cz portal without further information, and the seal fragment (Figure 13a) was kept in an archive without historical documentation. The objects were mounted in a laboratory holder in the condition in which they were delivered. Conductive contact was ensured to connect the object as a working electrode by a needle that passed through the corrosion product layer to the metal core of the object. Additional microscopic examination revealed that the needle left a tiny impact with a diameter of 0.2 mm in the corrosion products.
In the case of lead tokens, the polarization resistance was always in the order of units Ω·m2 (3.7, 4.3, 2.3, respectively). It can be assumed that the lead tokens were excavated as an archeological finding and were probably not exposed to volatile organic compounds, as is often the case with archival materials. This explains the relatively high polarization resistance value and the resulting assessment that the lead under the layer of corrosion products is in a corrosion-stable state. The fragment of the lead seal shows a polarization resistance of 0.35 Ω·m2, which indicates the corrosion-active state of the treasure lead.
The seal fragment was stabilized in moistened carbon dioxide together with a resistometric sensor and lead samples. The seal fragment was subjected to steps 5, 6, and 7. After step 7, the fragment was removed from the exposure chamber and its polarization resistance was measured using the local combined electrode. The value of 2.5 Ω·m2 indicates the successful transformation of corrosion products and the corrosion stabilization of the lead core of the seal. The stabilization process did not affect the appearance of the seal fragment in any way (Figure 13b).

4. Discussion

4.1. The Applicability of Polarization Resistance for Determining the Corrosion Activity of Lead Under a Layer of Corrosion Products

Historical lead objects are usually covered with a layer of corrosion products of varying thickness, which has formed on their surface over the course of their long history. Exposure conditions have probably changed throughout their history. Lead seals, for example, are currently mostly stored in archives with carefully controlled atmospheric conditions. However, exposure conditions that are currently non-aggressive to lead do not automatically guarantee a negligible corrosion rate of lead. The aggressiveness inside unsuitable packaging may be higher than in the controlled atmosphere, but even in non-aggressive conditions, a cyclic catalytic process of lead corrosion can take place with the participation of acetic acid periodically released during the reaction of previously formed lead acetate with carbon dioxide in the air. On the other hand, the presence of a layer of corrosion products on the surface of a historical lead object does not automatically indicate the high corrosion activity of lead under the corrosion products. If the corrosion products are stable in the sense that the transformation of acetate into stable carbonates has been completed and the released acetic acid is no longer present in the corrosion products, the corrosion of lead beneath the corrosion products does not continue, and the corrosion rate of lead is negligible.
Visual assessment of the corrosion condition of such a lead object is difficult. The appearance of an actively corroding lead object and an object covered with corrosion products, but without ongoing intensive corrosion, is usually the same. The presence of unstable corrosion products that can promote ongoing corrosion, lead acetates, can be detected analytically; however, as the above results show, the corrosion products must be removed destructively for analysis. It must also be kept in mind that XRD has a limited detection limit and is capable of detecting only crystalline phases. This study, which did not employ other analytical methods to identify corrosion products, can serve as a starting point for further follow-up studies utilizing other techniques such as Raman spectroscopy or ion chromatography. The corrosion state of lead under a layer of corrosion products can be reliably detected by direct measurement of the corrosion rate of lead.
Polarization resistance is a quantity that directly indicates the instantaneous corrosion rate. However, to measure it, it is necessary to gently polarize the object or sample under observation in the vicinity of the free corrosion potential using alternating or direct current. Alternating current excitation is used in electrochemical impedance spectroscopy, which is relatively demanding in terms of instrumentation and interpretation. An indisputable advantage, however, is that the result of determining the corrosion rate is purified from the electrical resistance of the layer of corrosion products, which in the case of a thick layer can introduce a certain error into the determination of the corrosion rate if a direct current technique is used for the measurement. This is primarily linear polarization, which allows polarization resistance to be measured with significantly simpler instrumentation, and is therefore more accessible for routine work in the field of monument preservation. An inevitable condition for measuring polarization resistance is the presence of an electrolyte in a three-electrode arrangement including a lead object as the working electrode, a reference electrode, and a counter electrode. Tap water was chosen as a non-aggressive and natural electrolyte for working with historical lead. It is an electrolyte that is sufficiently conductive for measurement and is non-aggressive toward lead itself and towards lead covered with stable corrosion products, as verified by the above experiments. The presence of unstable corrosion products at the metal–corrosion product interface in tap water manifests itself in increased corrosion rates, which are detected by low polarization resistance values.

4.2. Transformation of Acetate-Based Corrosion Products into Carbonates During Stabilization Treatment with Carbon Dioxide

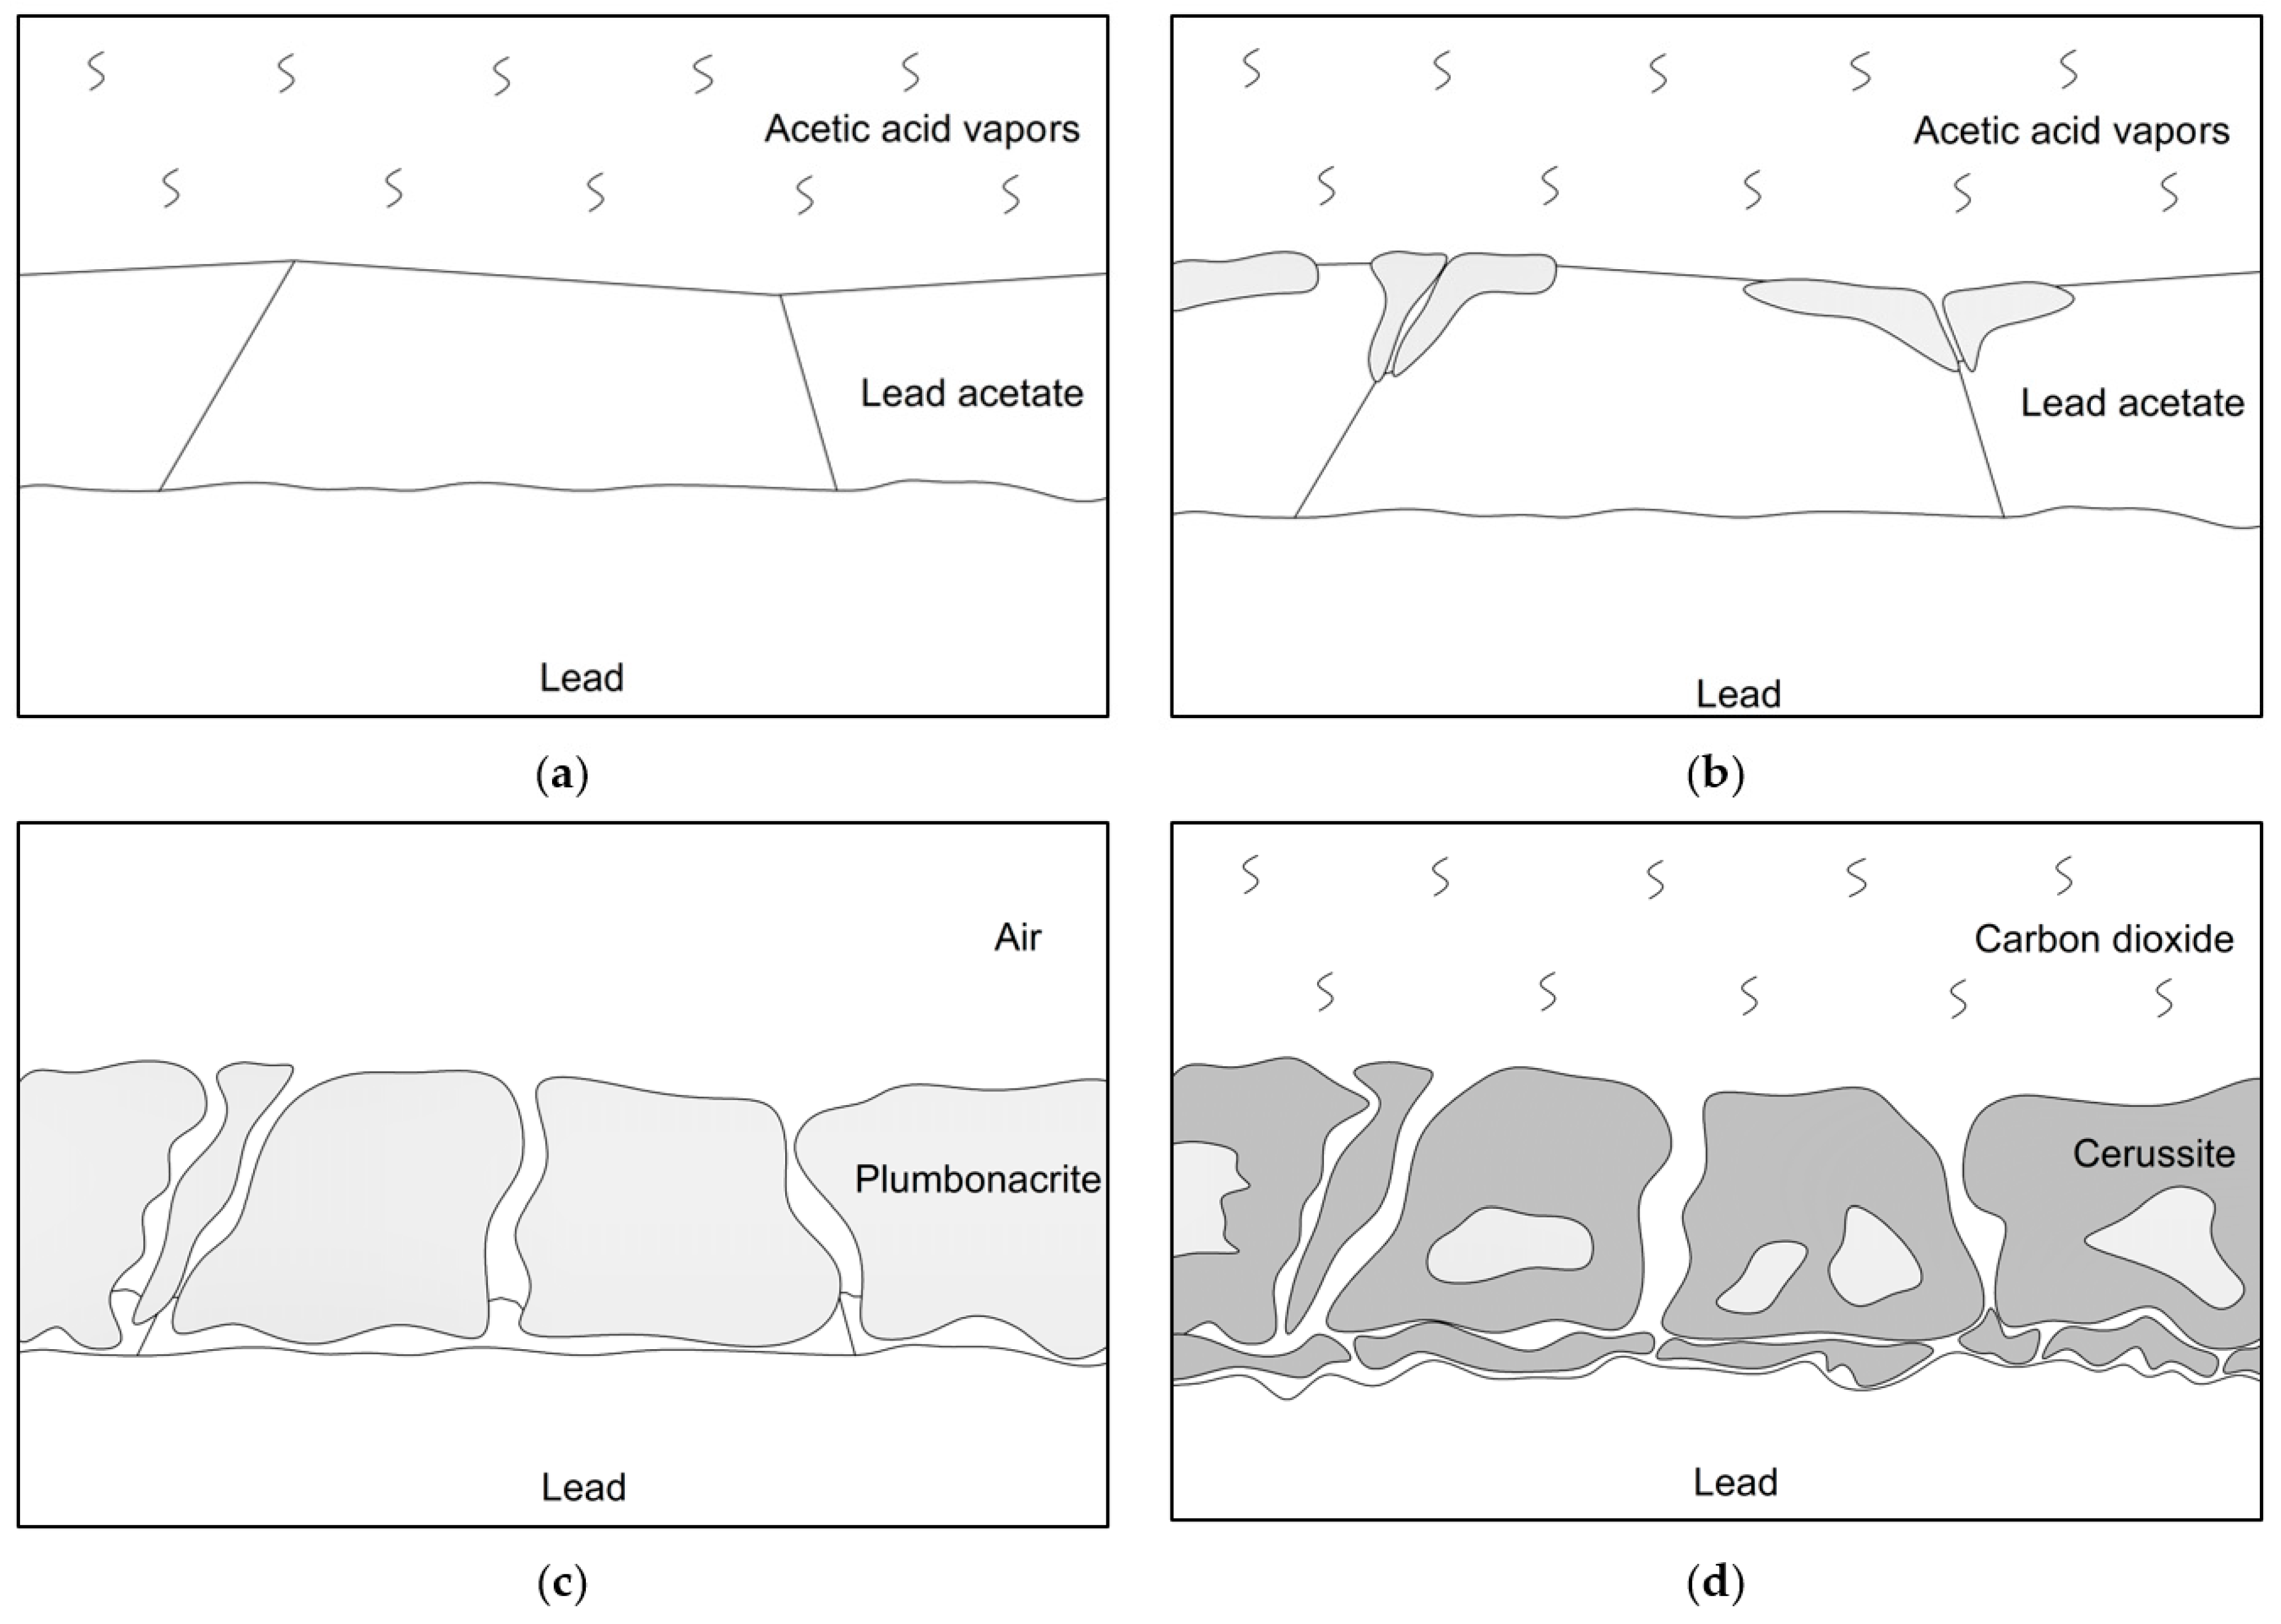
The above results of corrosion rate of corroded lead in tap water confirm that the exposure of lead with unstable acetate-based corrosion products, which maintain aggressive conditions for lead on the surface of the lead beneath the layer of such corrosion products, to humid carbon dioxide transforms acetates into stable carbonates. The released acetic acid escapes from the layer of corrosion products and is carried away with the flow of the treating gas. The transformation process is illustrated by the following diagrams.
The initial state is a layer of acetate corrosion products on the surface of lead formed in an environment with a source of acetic acid (Figure 14a). Since the atmosphere with acetic acid vapors naturally contains oxygen and carbon dioxide, the corrosion process continues with the formation of lead acetate, accompanied by the natural transformation of lead acetate into a carbonate-based corrosion product, plumbonacrite or hydrocerrusite (Figure 14b). The transformation probably occurs preferentially at the interface between the acetate and the surrounding atmosphere; i.e., the carbonate first forms on the surface of the acetate layer and in its defects. The transition from acetate to carbonate continues until carbonate almost completely replaces the original acetate (Figure 14c). If the source of acetic acid is removed from the surrounding atmosphere, the acetate layer no longer grows. However, the acetate does not completely disappear. At the interface between the metal and the layer of corrosion products, some of the acetate remains untransformed, and some new acetate is formed by the reaction of lead with the acetic acid released during the transformation. Because this transformation requires the presence of moisture, the corrosion process is unlikely to continue in a dry atmosphere, but because of the presence of unstable acetate, the lead remains in a corrosion-unstable state and the corrosion rate increases again when the relative humidity increases, despite the absence of an external source of acetic acid. This is a potentially dangerous corrosion situation for historical lead objects.
To eliminate this uncontrolled corrosion hazard, it is desirable to stabilize the corrosion products and transform them into a form that will not release corrosive acetic acid when the lead object is stored subsequently. This can be done by exposure to a carbon dioxide atmosphere, which may also be part of ethoxene disinfection treatment [38,39]. However, it is necessary to maintain high humidity in the treatment atmosphere, as water is essential for the reaction mechanism (2). The acetate layer then reacts with carbon dioxide to form cerussite, and the released acetic acid flows into the treatment atmosphere and is carried away with the gas stream. Some of the acetic acid may also react with the crust surface, causing corrosion loss. This is likely at the beginning of treatment if there is residual oxygen in the chamber. From a practical point of view, it is therefore more advantageous to first fill the chamber with non-humidified carbon dioxide, or only slightly humidified carbon dioxide, to prevent the drying of any organic materials attached to the lead object, to vent the air with oxygen originally contained in the chamber, and only then to increase the humidity of the treatment gas. The naturally occurring carbonate corrosion products formed by plumbonacrite or hydrocerussite are also gradually converted to cerussite (3). Thus, corrosion products may contain residues of partly carbonated product—plumbonacrite (Figure 14d). After complete conversion of all corrosion products, only stable cerussite remains in the layer.

5. Conclusions

This work has shown that even in the case of corroded lead, polarization resistance is a reliable, demonstrable, and reproducible characteristic for detecting corrosion conditions in metal under a layer of corrosion products. If unstable acetate-based compounds are present in the layer of corrosion products, which convert to stable carbonates upon contact with the normal atmosphere, releasing an aggressive acetic acid to lead, their presence manifests itself after immersion in otherwise non-aggressive tap water by an increased corrosion rate of lead, i.e., reduced polarization resistance. Corrosion-unstable conditions correspond to values in the order of tenths of Ω·m2, while corrosion-unstable and -active conditions correspond to polarization resistance values exceeding 1 Ω·m2. The linear polarization resistance method can also be performed using a local combined electrode, which allows for quick, nondestructive, and instrumentally undemanding analysis of the corrosion state of real historical lead objects with corroded and relief surfaces.
Measurement of polarization resistance and the resulting assessment of the corrosion state of lead under a layer of corrosion products were used to evaluate the stabilizing effect of preservation methods based on both the thermal treatment of lead acetate and its accelerated transformation into cerussite by exposure to a humidified carbon dioxide atmosphere. While thermal treatment was not completely effective even at a temperature of 70 °C, humidified carbon dioxide quickly stabilized the corrosion products, as demonstrated not only by XRD phase analysis of the resulting corrosion products, but also by polarization resistance corresponding to a corrosion-stable state and low corrosion rate in tap water.

Author Contributions

Conceptualization, A.K. and M.K.; methodology, M.K. and K.C.S.; validation, A.K. and M.R.; investigation, A.K. and K.C.S.; data curation, A.K. and K.C.S.; writing—original draft preparation, K.C.S. and M.K.; writing—review and editing, K.C.S.; project administration, M.K. All authors have read and agreed to the published version of the manuscript.

Funding

This work was supported by a grant from Specific university research—grant No A1_FCHT_2026_005.

Data Availability Statement

Data are available upon reasonable request from the corresponding author.

Acknowledgments

The authors are grateful for technical support of the Central Laboratories of the University of Chemistry and Technology, Prague. Special thanks are given to Martina Kohoutková.

Conflicts of Interest

The authors declare no conflicts of interest.

Abbreviations

The following abbreviations are used in this manuscript:
XRDX-ray diffraction
LPRLinear polarization resistance
EISElectrochemical impedance spectroscopy
RpPolarization resistance
EocOpen circuit potential or free corrosion potential
SCESaturated calomel electrode
WEWorking electrode
REReference electrode
CECounter electrode
AAAcetic acid

References

  1. Degrigny, C. Use of electrochemical techniques for the conservation of metal artefacts: A review. J. Solid State Electrochem. 2010, 14, 353–361. [Google Scholar] [CrossRef]
  2. Spotorno, R.; Piccardo, P. Development and application of an electrochemical probe for localized corrosion measurements on cultural heritage artifacts. npj Herit. Sci. 2025, 13, 10. [Google Scholar] [CrossRef]
  3. Petiti, C.; Gulotta, D.; Mariani, B.; Toniolo, L.; Goidanich, S. Optimisation of the setup of LPR and EIS measurements for the onsite, non-invasive study of metallic artefacts. J. Solid State Electrochem. 2020, 24, 3257–3267. [Google Scholar] [CrossRef]
  4. Abate, F.; Daniele, S.; Musiani, M.; Verlato, E.; Amati, M.; De Boni, F.; Milosz, Z.; Moglianetti, M.; Zanini, R.; Traviglia, A. Novel methods for the non-invasive study of archaeological coins with electrochemical impedance spectroscopy. J. Electroanal. Chem. 2025, 994, 119261. [Google Scholar] [CrossRef]
  5. Mikić, D.; Ćurković, H.; Kosec, T.; Peko, N. An Electrochemical and Spectroscopic Study of Surfaces on Bronze Sculptures Exposed to Urban Environment. Materials 2021, 14, 2063. [Google Scholar] [CrossRef]
  6. Ramirez, B.; Crespo, A.; García, E.; Díaz, S.; Cano, E. An EIS study of the conservation treatment of the bronze sphinxes at the Museo Arqueológico Nacional (Madrid). J. Cult. Herit. 2016, 24, 93–99. [Google Scholar] [CrossRef]
  7. Ramirez, B.; Cano, E.; Letardi, P. Advances in the design of a gel-cell electrochemical sensor for corrosion measurements on metallic cultural heritage. Sens. Actuators B Chem. 2018, 261, 572–580. [Google Scholar] [CrossRef]
  8. Ramirez, B.; Cano, E. In situ electrochemical impedance spectroscopy measurements and their interpretation for the diagnostic of metallic cultural heritage: A review. ChemElectroChem 2018, 5, 2698–2716. [Google Scholar] [CrossRef]
  9. Carullo, A.; Ferraris, F.; Parvis, M.; Vallan, A.; Angelini, E.; Spinelli, P. Low-cost electrochemical impedance spectroscopy system for corrosion monitoring of metallic antiquities and works of art. Instrum. Meas. IEEE Trans. 2000, 49, 371–375. [Google Scholar] [CrossRef]
  10. Jia, M.; Hu, P.; Hu, G. An easy-to-assemble probe for in situ corrosion testing of archaeological metal. Electrochem. Commun. 2023, 147, 107427. [Google Scholar] [CrossRef]
  11. Jia, M.; Xu, H.; Hu, P.; Hu, G. Microstructures and electrochemical corrosion behaviors of bronze mirror. npj Herit. Sci. 2025, 13, 405. [Google Scholar] [CrossRef]
  12. Šoić, I.; Šoljić, I.; Eškinja, M.; Mujezinović, A.; Martinez, S. The novel paste electrolyte measuring cell for EIS testing of the commonly used surface protection on bronze. Prog. Org. Coat. 2023, 177, 107442. [Google Scholar] [CrossRef]
  13. Martínez-Lázaro, I.; Doménech-Carbó, A.; Doménech-Carbó, M.T.; Pastor-Valls, M.T.; Amigó-Borrás, V. Electrochemical criteria for evaluating conservative treatments applied to contemporary metallic sculpture. A case study. J. Solid State Electrochem. 2009, 14, 437–447. [Google Scholar] [CrossRef]
  14. Boháčková, T.; Kouřil, M.; Strachotová, K.C.; Kreislová, K.; Fialová, P.; Švadlena, J.; Prošek, T. Color Measurement in the Corrosivity Assessment of Museums, Archives, and Churches. Materials 2022, 16, 226. [Google Scholar] [CrossRef] [PubMed]
  15. Ramirez, B.; Cano, E. The use of agar gelled electrolyte for in situ electrochemical measurements on metallic cultural heritage. Electrochim. Acta 2015, 182, 751–762. [Google Scholar] [CrossRef]
  16. Monrrabal, G.; Guzmán, S.; Hamilton, I.; Bautista, A.; Velasco, F. Design of gel electrolytes for electrochemical studies on metal surfaces with complex geometry. Electrochim. Acta 2016, 220, 20–28. [Google Scholar] [CrossRef]
  17. Kouřil, M.; Boháčková, T.; Strachotová, K.C.; Švadlena, J.; Prošek, T.; Kreislová, K.; Fialová, P. Lead Corrosion and Corrosivity Classification in Archives, Museums, and Churches. Materials 2022, 15, 639. [Google Scholar] [CrossRef] [PubMed]
  18. Schotte, B.; Adriaens, A. Treatments of Corroded Lead Artefacts: An Overview. Stud. Conserv. 2006, 51, 297–304. [Google Scholar] [CrossRef]
  19. Towarek, A.; Mistewicz, A.; Pilecka-Pietrusińska, E.; Zdunek, J.; Mizera, J. Corrosion degradation of archaeological lead: A review and case study. J. Archaeol. Sci. Rep. 2022, 45, 103611. [Google Scholar] [CrossRef]
  20. Abu-Baker, A.; Al Sekhaneh, W.; Shiyab, A.; Dellith, J.; Scheffel, A.; Alebrahim, M.A.; Popp, J. Analytical investigation of five Roman Pb-based scale weights (Qasr Ar-Rabbah, Jordan): A case study. Mediterr. Archaeol. Archaeom. 2014, 14, 181–190. [Google Scholar]
  21. Costa, V.; Urban, F. Lead and its alloys: Metallurgy, deterioration and conservation. Stud. Conserv. 2005, 50, 48–62. [Google Scholar] [CrossRef]
  22. Garcia-Heras, M.; Villegas, M.; Caen, J.; Domingo, C.; García-Ramos, J. Patination of Historical Stained Windows Lead Cames From Different European Locations. Microchem. J. 2006, 83, 81–90. [Google Scholar] [CrossRef]
  23. Rocca, E.; Mirambet, F.; Steinmetz, J. Study of ancient lead materials: A gallo-roman sarcophagus—Contribution of the electrolytic treatment to its restoration. J. Mater. Sci. 2004, 39, 2767–2774. [Google Scholar] [CrossRef]
  24. Švadlena, J.; Prošek, T.; Boháčková, T.; Kouril, M. Protective ability of lead corrosion products in indoor atmosphere with acetic acid vapours. Koroze Ochr. Mater. 2021, 65, 1–6. [Google Scholar] [CrossRef]
  25. Strachotová, K.; Kouril, M. Effect of the presence of corrosion products on the corrosion rate of lead during the exposition with paper packaging materials. Koroze Ochr. Mater. 2018, 62, 87–96. [Google Scholar] [CrossRef]
  26. Strachotová, K.; Kouril, M.; Msallamová, Š. Corrosion of Metals of Organ Pipes in Volatile Organic Compounds Environment. In Proceedings of the Metal 2023, Brno, Czechia, 17–19 May 2023. [Google Scholar]
  27. ISO 6588-1:2021; Paper, Board and Pulps—Determination of pH of Aqueous Extracts. Part 1: Cold Extraction. International Organization for Standardization: Geneva, Switzerland, 2021.
  28. Pražské Vodovody a Kanalizace. Available online: https://www.pvk.cz/o-spolecnosti/opendata-pvk-pvs/ (accessed on 30 April 2026).
  29. Kouril, M.; Prosek, T.; Scheffel, B.; Dubois, F. High sensitivity electrical resistance sensors for indoor corrosion monitoring. Corros. Eng. Sci. Technol. 2013, 48, 282–288. [Google Scholar] [CrossRef]
  30. Niklasson, A.; Johansson, L.; Svensson, J. The influence of relative humidity and temperature on the acetic acid vapour-induced atmospheric corrosion of lead. Corros. Sci. 2008, 50, 3031–3037. [Google Scholar] [CrossRef]
  31. Ryhl-Svendsen, M. Corrosivity measurements of indoor museum environments using lead coupons as dosimeters. J. Cult. Herit. 2008, 9, 285–293. [Google Scholar] [CrossRef]
  32. Henry’s Law Constants. Available online: https://henrys-law.org/henry/casrn/64-19-7 (accessed on 30 April 2026).
  33. Tétreault, J.; Cano, E.; van Bommel, M.; Scott, D.; Dennis, M.; Barthés-Labrousse, M.-G.; Minel, L.; Robbiola, L. Corrosion of Copper and Lead by Formaldehyde, Formic and Acetic Acid Vapours. Stud. Conserv. 2003, 48, 237–250. [Google Scholar] [CrossRef]
  34. Mauck, C.M.; van den Heuvel, T.W.; Hull, M.M.; Zeller, M.; Oertel, C.M. Synthesis and Structures of Pb3O2(CH3COO)2·0.5H2O and Pb2O(HCOO)2: Two Corrosion Products Revisited. Inorg. Chem. 2010, 49, 10736–10743. [Google Scholar] [CrossRef] [PubMed]
  35. Tétreault, J. Control of Pollutants in Museums and Archives. Technical Bulletin 37; Canadian Conservation Institute (CCI) Technical Bulletins: Ottawa, ON, Canada, 2021; p. 64. [Google Scholar]
  36. Švadlena, J.; Strachotová, C.S.; Prošek, T.; Kouřil, M. Evaluation of corrosivity of indoor museum atmospheres using lead specimens. In Proceedings of the METAL 2020, Brno, Czech Republic, 20–22 May 2020. [Google Scholar]
  37. A Technical Guide to the Historical Synthesis of Lead White Pigment. Available online: https://www.benchchem.com/product/B072859/docs#a-technical-guide-to-the-historical-synthesis-of-lead-white-pigment (accessed on 30 April 2026).
  38. Tomšová, K.; Ďurovič, M. Influence of disinfection methods on the stability of black and whitesilver gelatin prints. J. Cult. Herit. 2017, 24, 78–85. [Google Scholar] [CrossRef]
  39. Zajac, I.; Szuls, J.; Gutarowska, B. The effect of ethylene oxide and silver nanoparticles on photographic models in the context of disinfection of photo albums. J. Cult. Herit. 2021, 51, 59–70. [Google Scholar] [CrossRef]
  40. Martínez-Casado, F.J. Unraveling the Decomposition Process of Lead(II) Acetate: Anhydrous Polymorphs, Hydrates, and Byproducts and Room Temperature Phosphorescence. Inorg. Chem. 2016, 55, 8576−8586. [Google Scholar] [CrossRef] [PubMed]
Figure 1. A scheme of the compression cell for polarization resistance measurement of model lead samples (the blue color in the schematic denotes the electrolyte).
Heritage 09 00219 g001
Figure 2. A scheme of the local electrode arrangement for polarization resistance measurement of real lead samples.
Heritage 09 00219 g002
Figure 3. Examples of raw polarization curves obtained for lead samples exposed to an electrolyte of various aggressivity (blue—tap water, black—1 mM acetic acid solution, green—10 mM acetic acid solution, red—100 mM acetic acid solution).
Heritage 09 00219 g003
Figure 4. Polarization resistance of bare lead in solutions of varying aggressiveness (AA—acetic acid; error bars show the confidence interval).
Heritage 09 00219 g004
Figure 5. Lead samples with a layer of corrosion products after (a) 2 days, (b) 7 days and (c) 16 days of exposure in acetic acid vapors (above 10 mM acetic acid solution).
Heritage 09 00219 g005
Figure 6. Polarization resistance of bare lead and lead samples exposed above 10 mM acetic acid solution for 2, 7 and 16 days.
Heritage 09 00219 g006
Figure 7. Polarization resistance of bare lead and of lead samples exposed above 10 mM acetic acid solution for 2 days and treated with hot air for 15 min.
Heritage 09 00219 g007
Figure 8. Examples of diffraction patterns of lead samples exposed above 10 mM acetic acid solution for 16 days and treated with CO2 for 2, 7, and 16 days (L—lead, C—cerussite, HC—hydrocerussite, P—plumbonacrite, H—basic lead acetate hemihydrate).
Heritage 09 00219 g008
Figure 9. Polarization resistance of bare lead and of lead samples exposed above 10 mM acetic acid solution for 16 days and treated with CO2 for 2, 7, and 16 days.
Heritage 09 00219 g009
Figure 10. Corrosion depth of lead resistometric sensor, temperature and relative humidity record during exposure in acetic acid (AA) vapors and stabilization treatment with CO2.
Heritage 09 00219 g010
Figure 11. Polarization resistance of bare lead and lead samples exposed above 10 mM acetic acid solution for 2, 7 and 16 days measured by means of local electrode.
Heritage 09 00219 g011
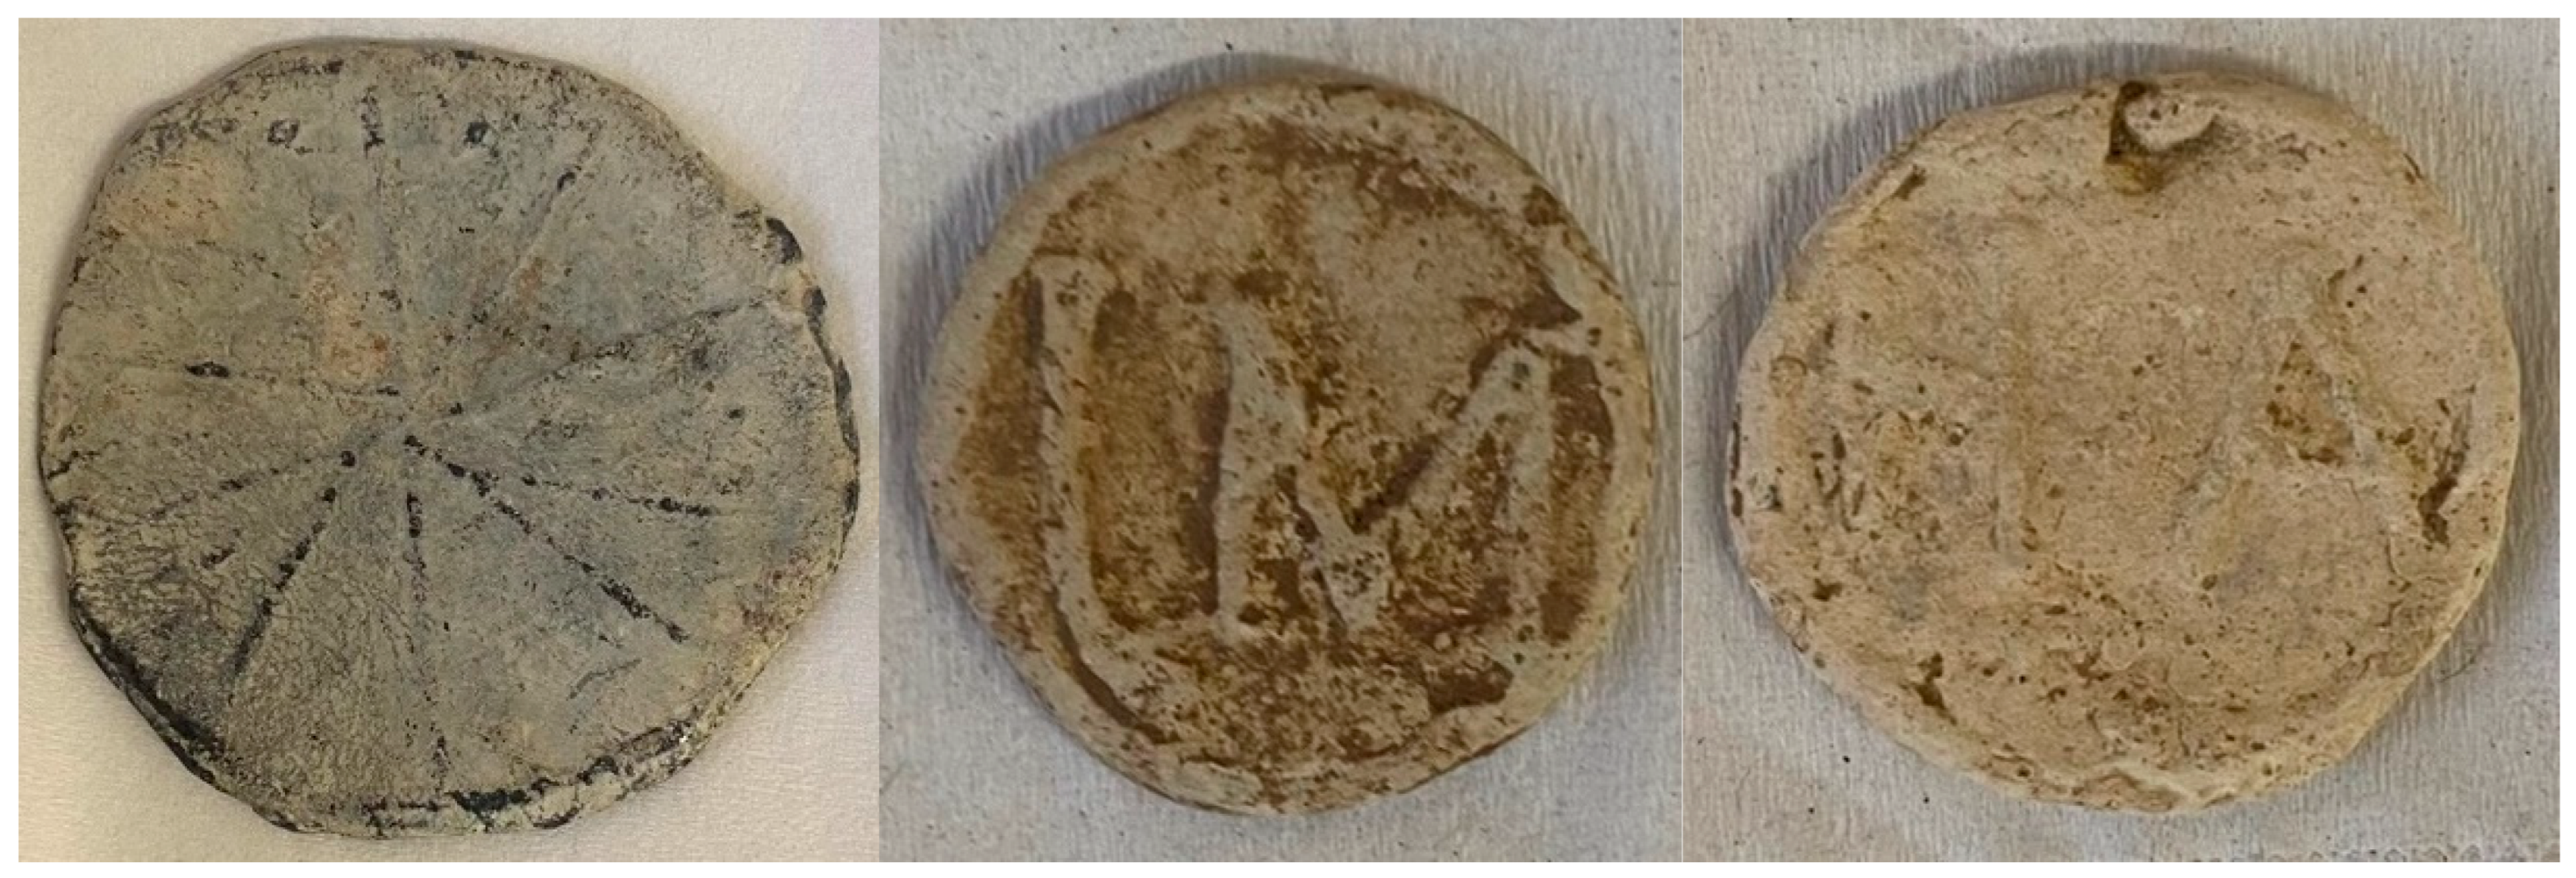
Figure 12. Lead tokens involved in measurement of polarization resistance by means of local electrode.
Heritage 09 00219 g012
Figure 13. A fragment of a lead seal involved in measurement of polarization resistance by means of local electrode: (a) original state, (b) after stabilization treatment by CO2.
Heritage 09 00219 g013
Figure 14. Schematic presentation of acetate-based corrosion products’ transformation into carbonates during stabilization treatment with carbon dioxide: (a) formation of acetate corrosion products on the surface of lead exposed to acetic acid vapors, (b) partial transformation of lead acetate into a carbonate-based corrosion product as a result of reaction with naturally occurring CO2 in air containing acetic acid vapors, (c) continuous but incomplete transformation of lead acetate into plumbonacrite in absence of acetic acid vapors, (d) accelerated transformation of lead acetate into cerussite in CO2 atmosphere. White fields in the layer of corrosion products correspond to lead acetate, light gray fields to plumbonacrite, and dark gray fields to cerussite.
Heritage 09 00219 g014
Table 1. Composition and conductivity of tap water in 2025 [28].
ComponentAverageStandard Deviation
NO323.5 mg·L−14.4 mg·L−1
NO20.013 mg·L−10.005 mg·L−1
Cl22.5 mg·L−13.3 mg·L−1
SO42−51 mg·L−112 mg·L−1
Cl20.18 mg·L−10.09 mg·L−1
Ca2+41 mg·L−120 mg·L−1
Mg2+7.6 mg·L−10.4 mg·L−1
hardness1.3 mmol·L−10.5 mmol·L−1
TOC2.7 mg·L−10.7 mg·L−1
pH7.70.2
conductivity36.5 mS·m−18.5 mS·m −1
Table 2. X-ray diffraction phase analysis and its semi-quantitative evaluation of lead samples exposed above 10 mM acetic acid solution for 2, 7 and 16 days.
Exposure2 Days7 Days16 Days
LeadPb40%20%10%
Basic lead acetate hemihydratePb3O2(CH3COO)2·1/2H2O25%20%20%
PlumbonacritePb5(CO3)3O(OH)235%60%70%
Table 3. X-ray diffraction phase analysis and its semi-quantitative evaluation of a lead sample exposed in a closed atmosphere influenced by cardboard for 153 days.
Exposure153 Days
LeadPb55%
Basic lead acetate hemihydratePb3O2(CH3COO)2·1/2H2O5%
PlumbonacritePb5(CO3)3O(OH)230%
HydrocerussitePb3(CO3)2(OH)210%
Table 4. X-ray diffraction phase analysis and its semi-quantitative evaluation of lead samples exposed above 10 mM acetic acid solution for 2 days and treated with hot air for 15 min.
ExposureNo Hot Air40 °C70 °C
LeadPb40%surface: 53%
scrape-off: 20%
surface: 57%
scrape-off: 29%
Basic lead acetate hemihydratePb3O2(CH3COO)2·1/2H2O25%surface: 0%
scrape-off: 24%
surface: 0%
scrape-off: 5%
PlumbonacritePb5(CO3)3O(OH)235%surface: 33%
scrape-off: 50%
surface: 43%
scrape-off: 57%
CerussitePbCO30%surface: 0%
scrape-off: 3%
surface: 0%
scrape-off: 0%
Table 5. X-ray diffraction phase analysis and its semi-quantitative evaluation of corrosion products scraped from lead samples exposed above 10 mM acetic acid solution for 16 days and treated with CO2 for 2, 7, and 16 days.
ExposureNo CO2 Treatment2 Days7 Days16 Days
LeadPb10%2%1%2%
Basic lead acetate hemihydratePb3O2(CH3COO)2·1/2H2O20%0%0%0%
PlumbonacritePb5(CO3)3O(OH)270%0%0%0%
CerussitePbCO30%98%99%98%
HydrocerussitePb3(CO3)2(OH)20%0%traces0%
Table 6. Corrosion rate of lead resistometric sensor in individual steps of exposure in acetic acid vapors and stabilization treatment with CO2; polarization resistance and free corrosion potential as obtained for lead corrosion coupons retrieved from the exposure chamber after each exposure step.
Exposure StepCorrosion Rate
[nm·h−1]
Rp
[Ω·m2]
Eoc
[mV (SCE)]
State
10.01.90−499stable
213.90.21−501active
31.80.34−486
40.20.36−508
50.10.40−496
60.50.33−524
7a (hour 510–520)187.1--
7b (hour 550–644)0.123.2−197stable
80.115.5−311
Disclaimer/Publisher’s Note: The statements, opinions and data contained in all publications are solely those of the individual author(s) and contributor(s) and not of MDPI and/or the editor(s). MDPI and/or the editor(s) disclaim responsibility for any injury to people or property resulting from any ideas, methods, instructions or products referred to in the content.