
A Multi-Analytical Study of Egyptian Funerary Artifacts from Three Portuguese Museum Collections

 ,
, 
 , ,
, ,  and
and
Abstract
1. Introduction
1.1. Egyptian Artifacts in Portugal
1.2. The Egyptian Palette
2. Materials and Methods
2.1. Sampling
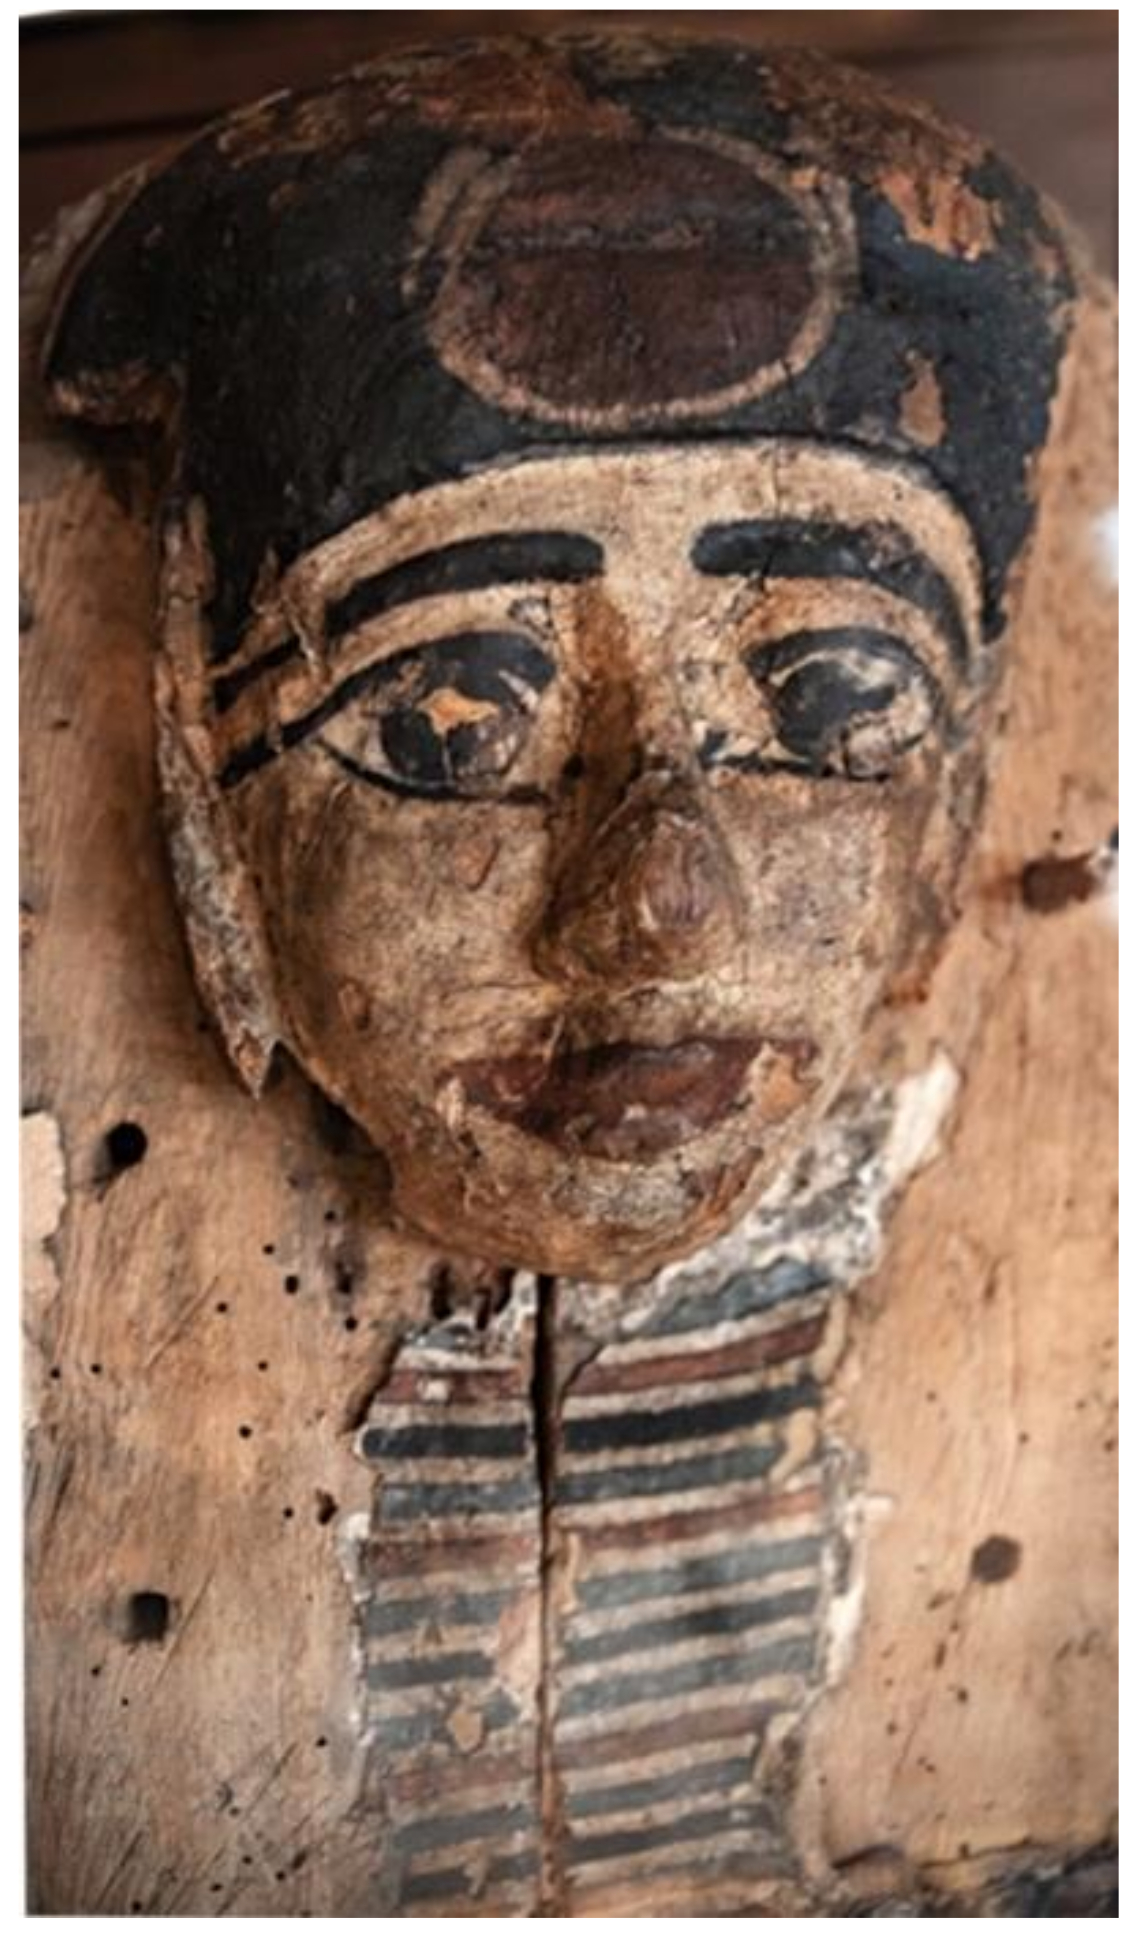
2.1.1. Mask #1 (Archive Ref. LJF 1-80)
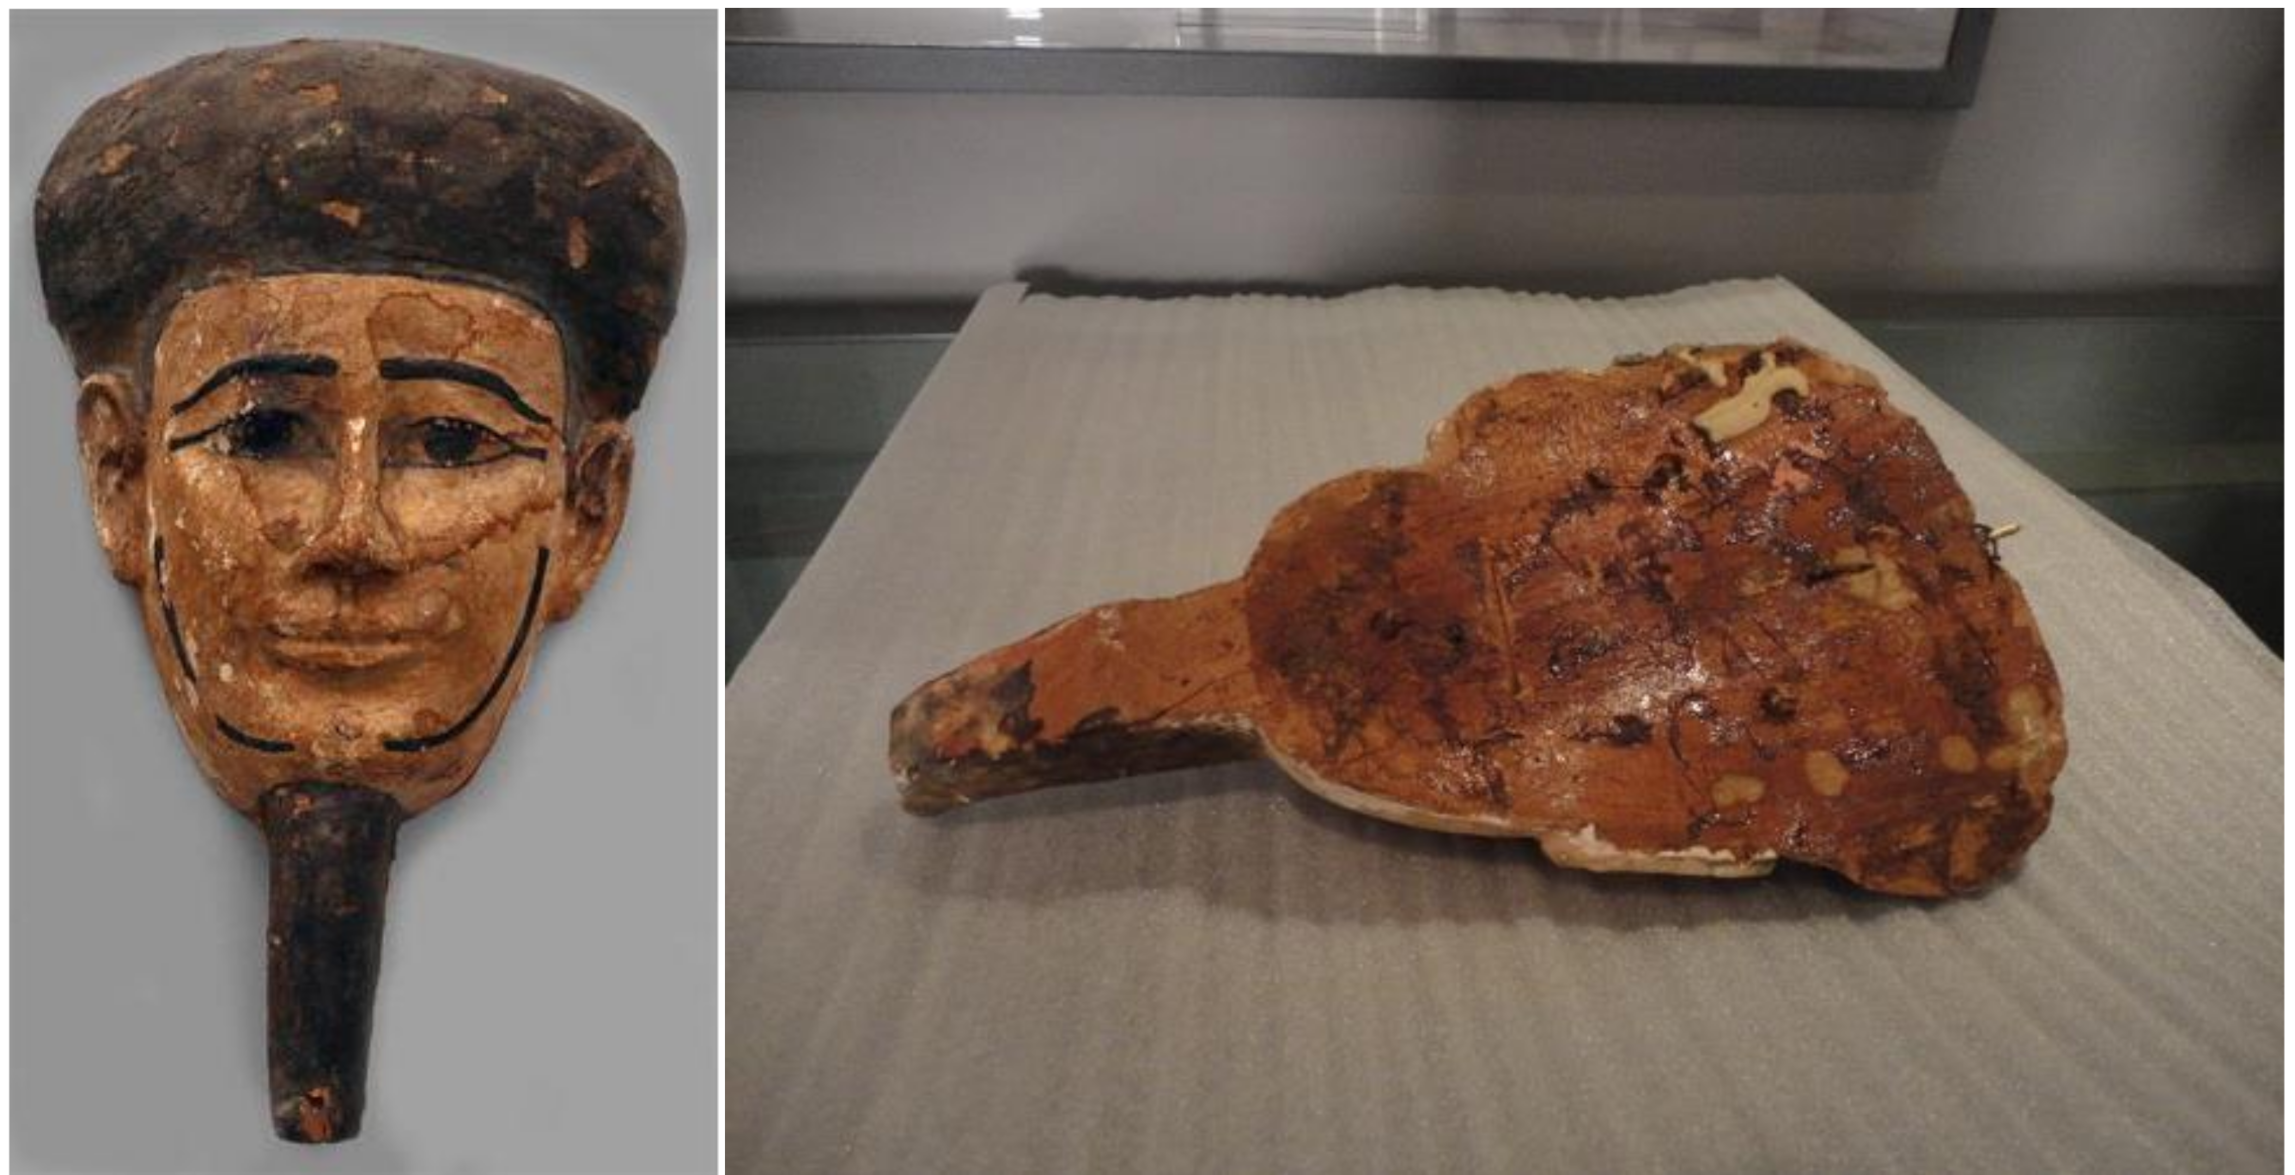
2.1.2. Mask #2 (Archive Ref. MNA 228)
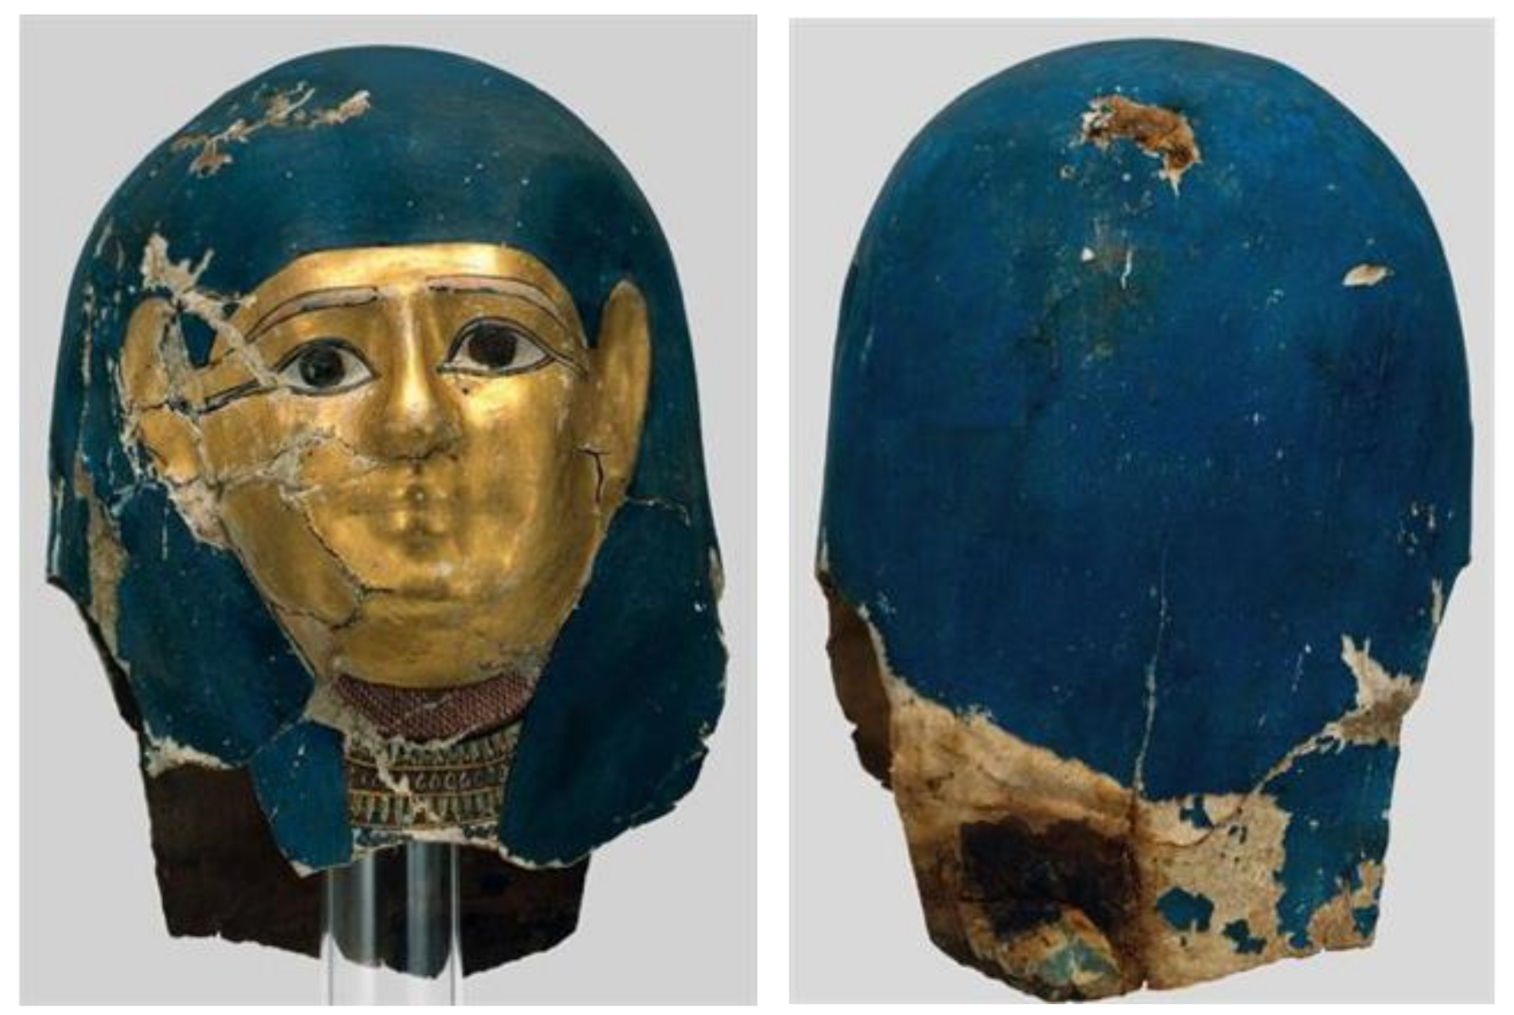
2.1.3. Mask #3 (Archive Ref. MNA 226)
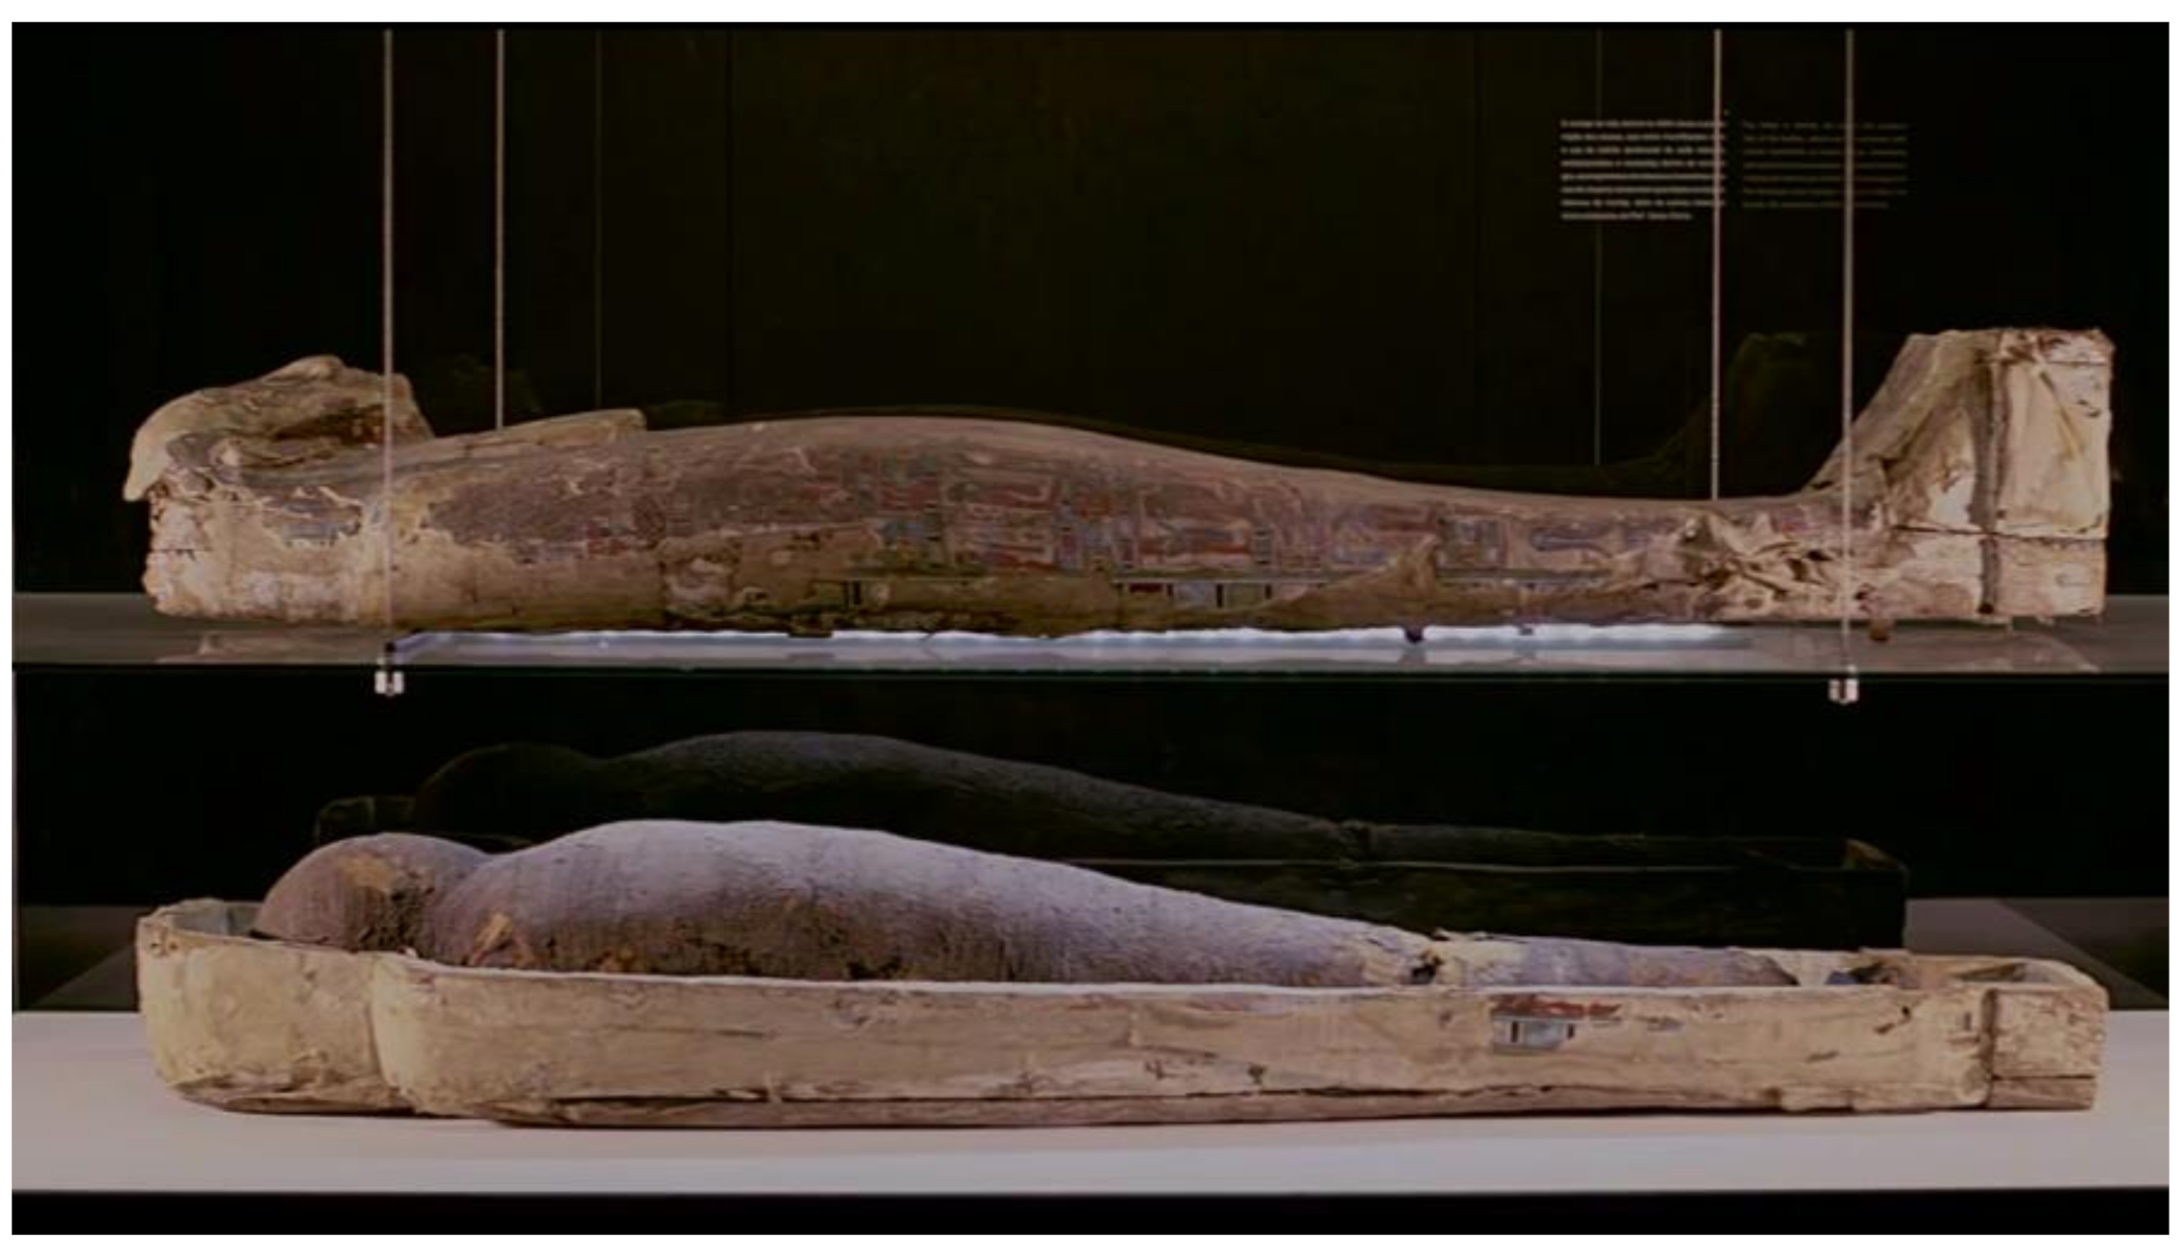
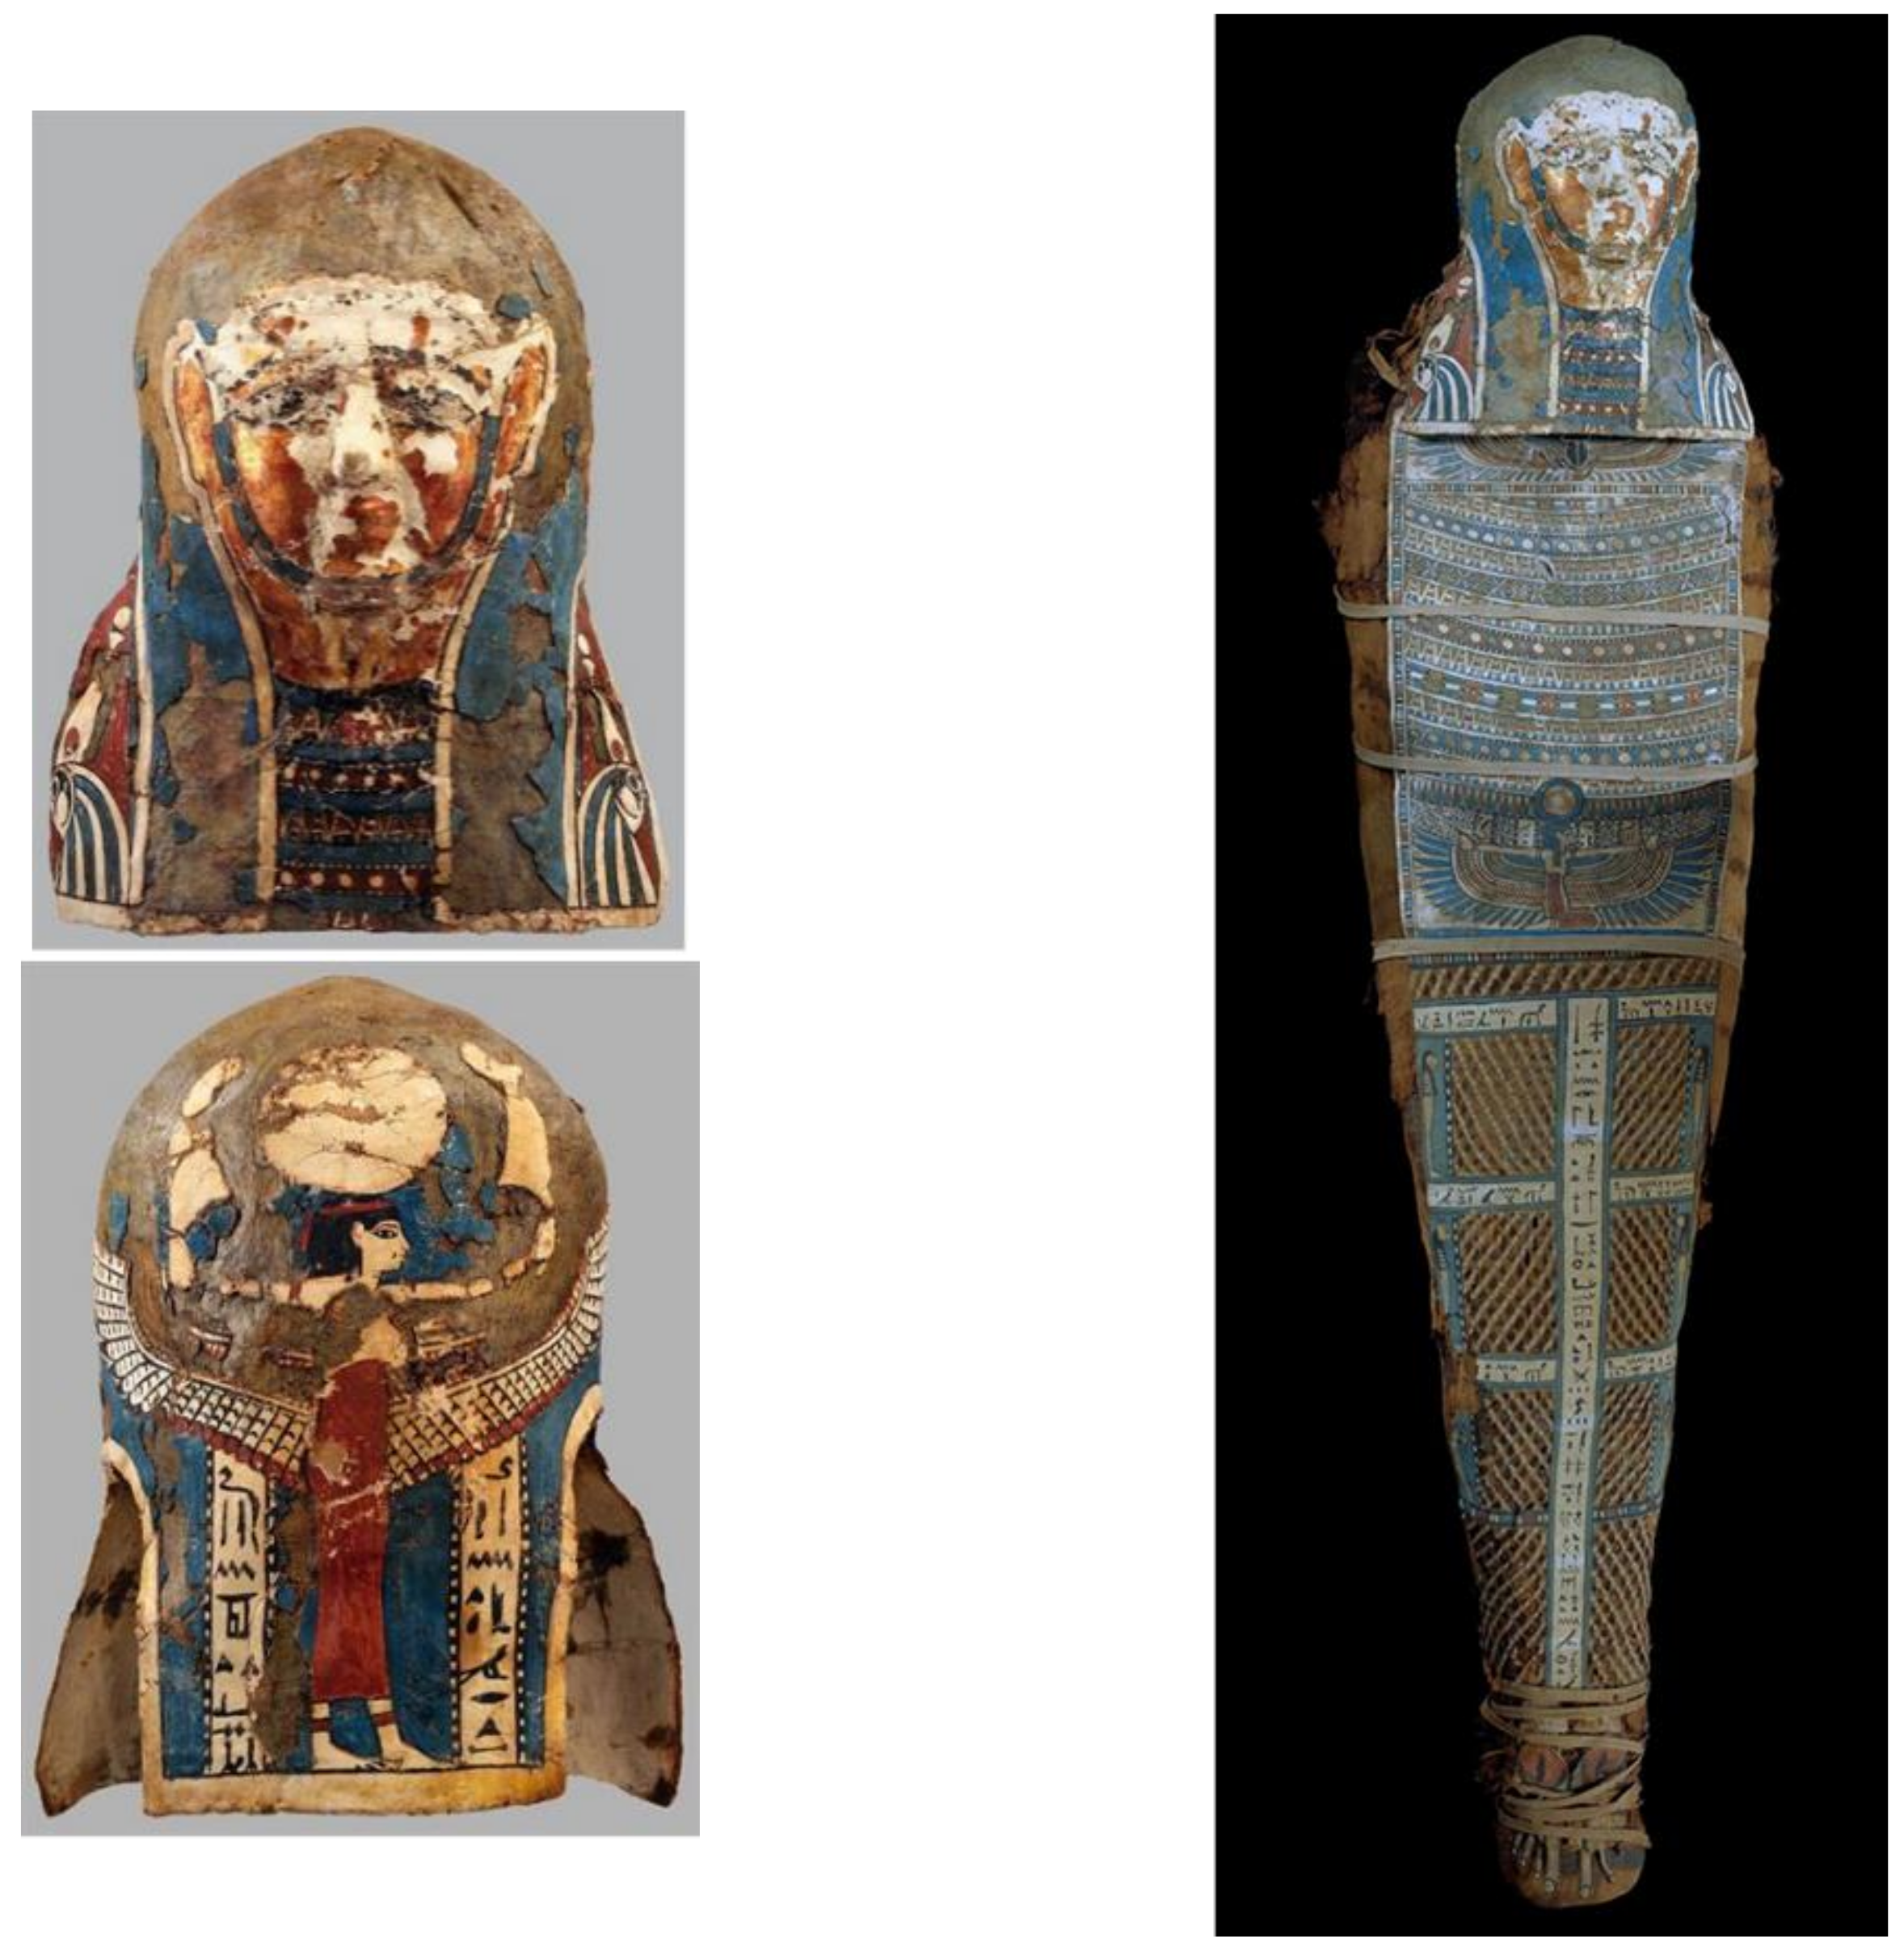
2.1.4. Sarcophagus #1 (Archive Ref. LJF 1-89)
2.1.5. Sarcophagus #2 (Archive Ref. MNA 216)
2.2. Analytical Methodology
3. Results and Discussions
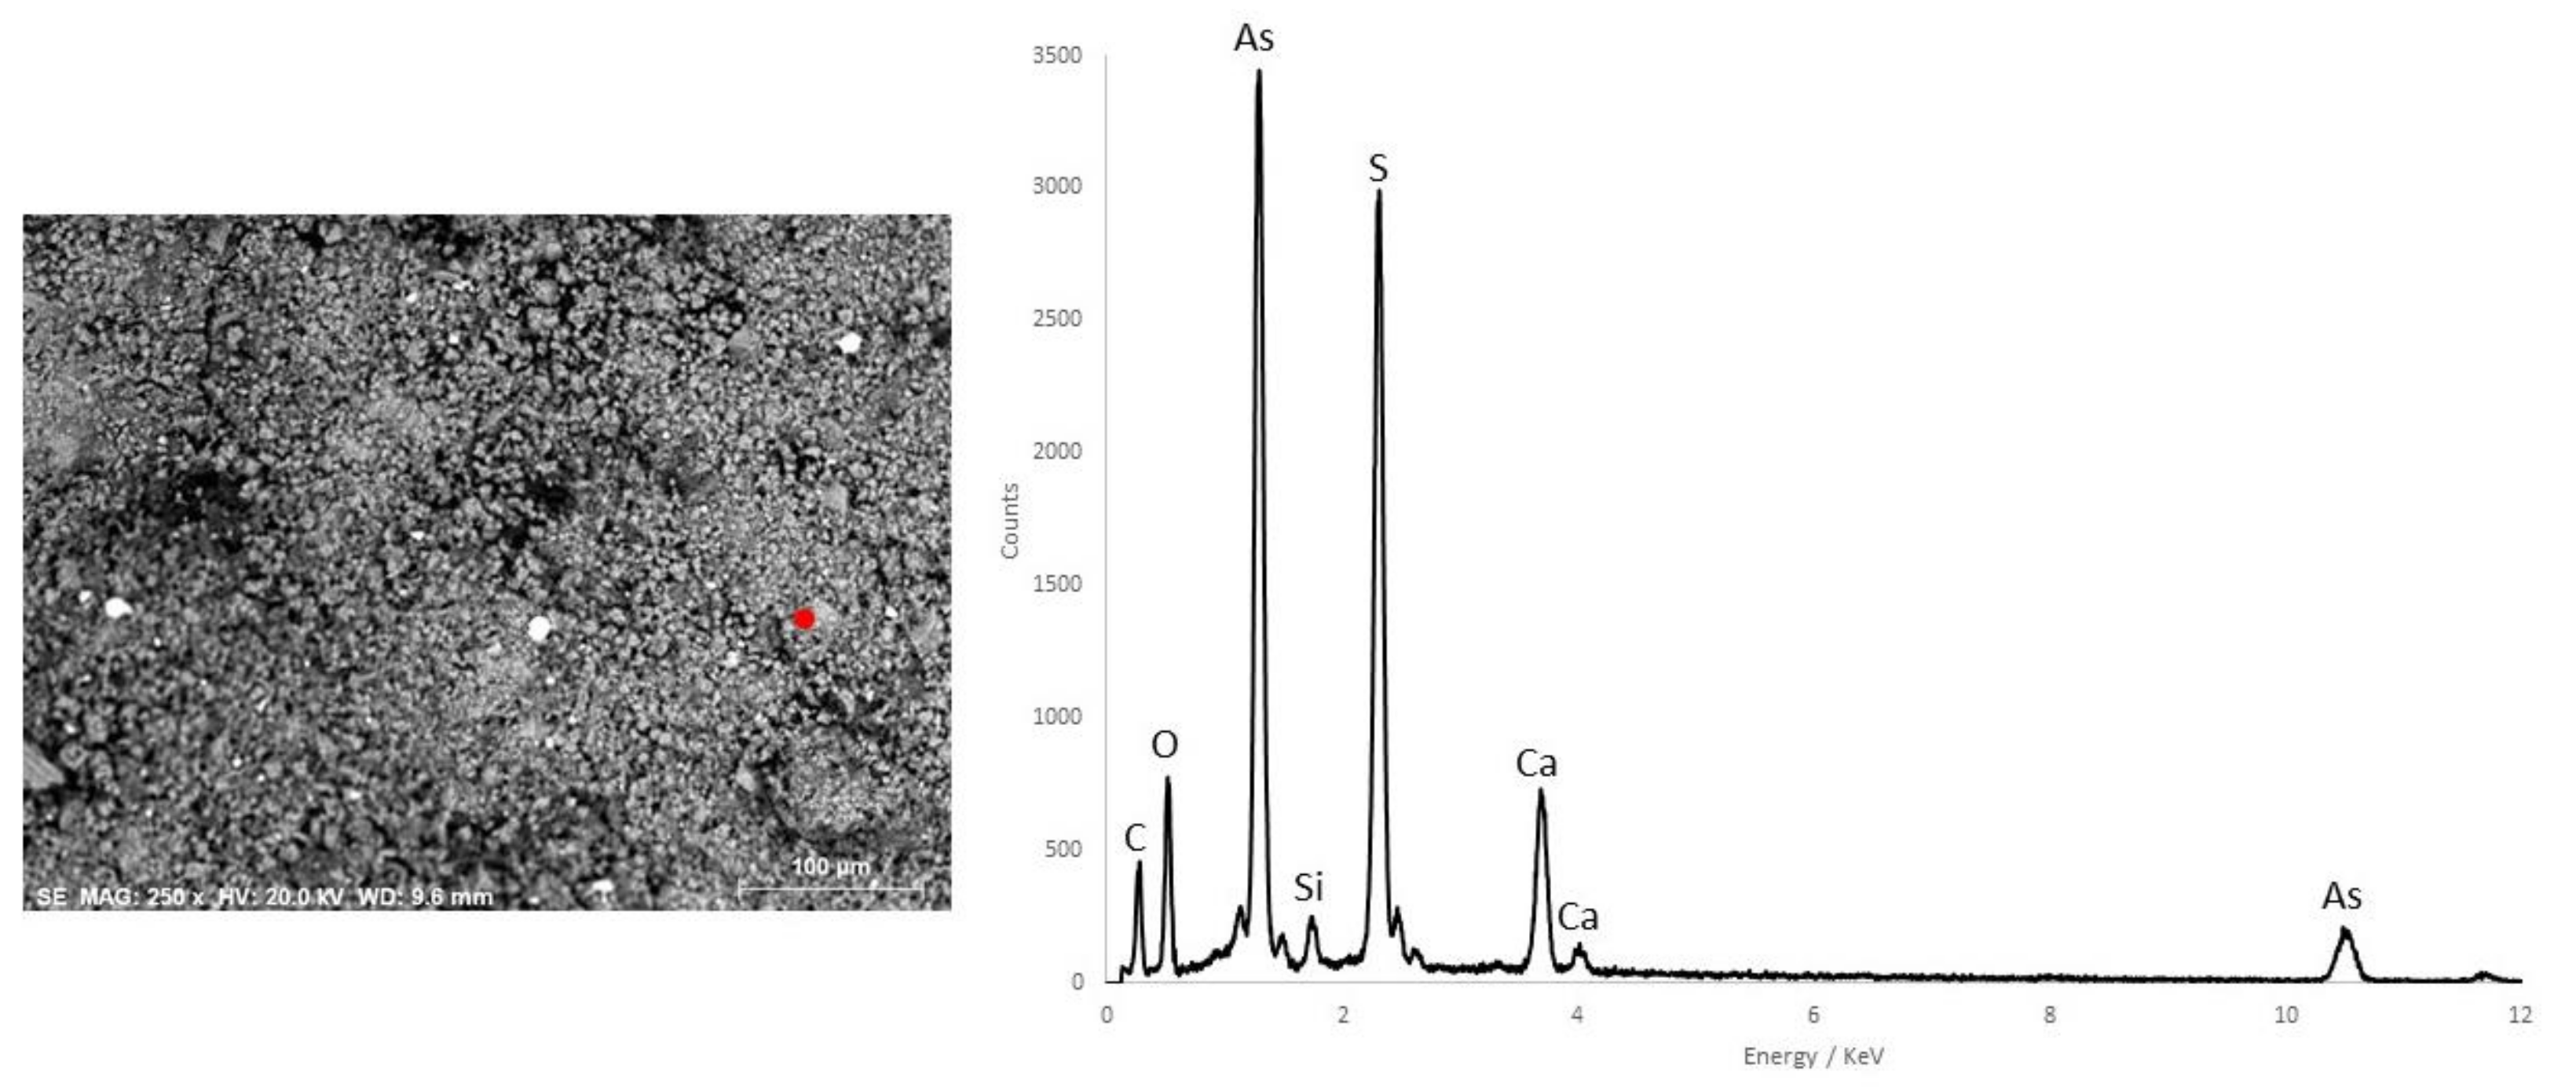
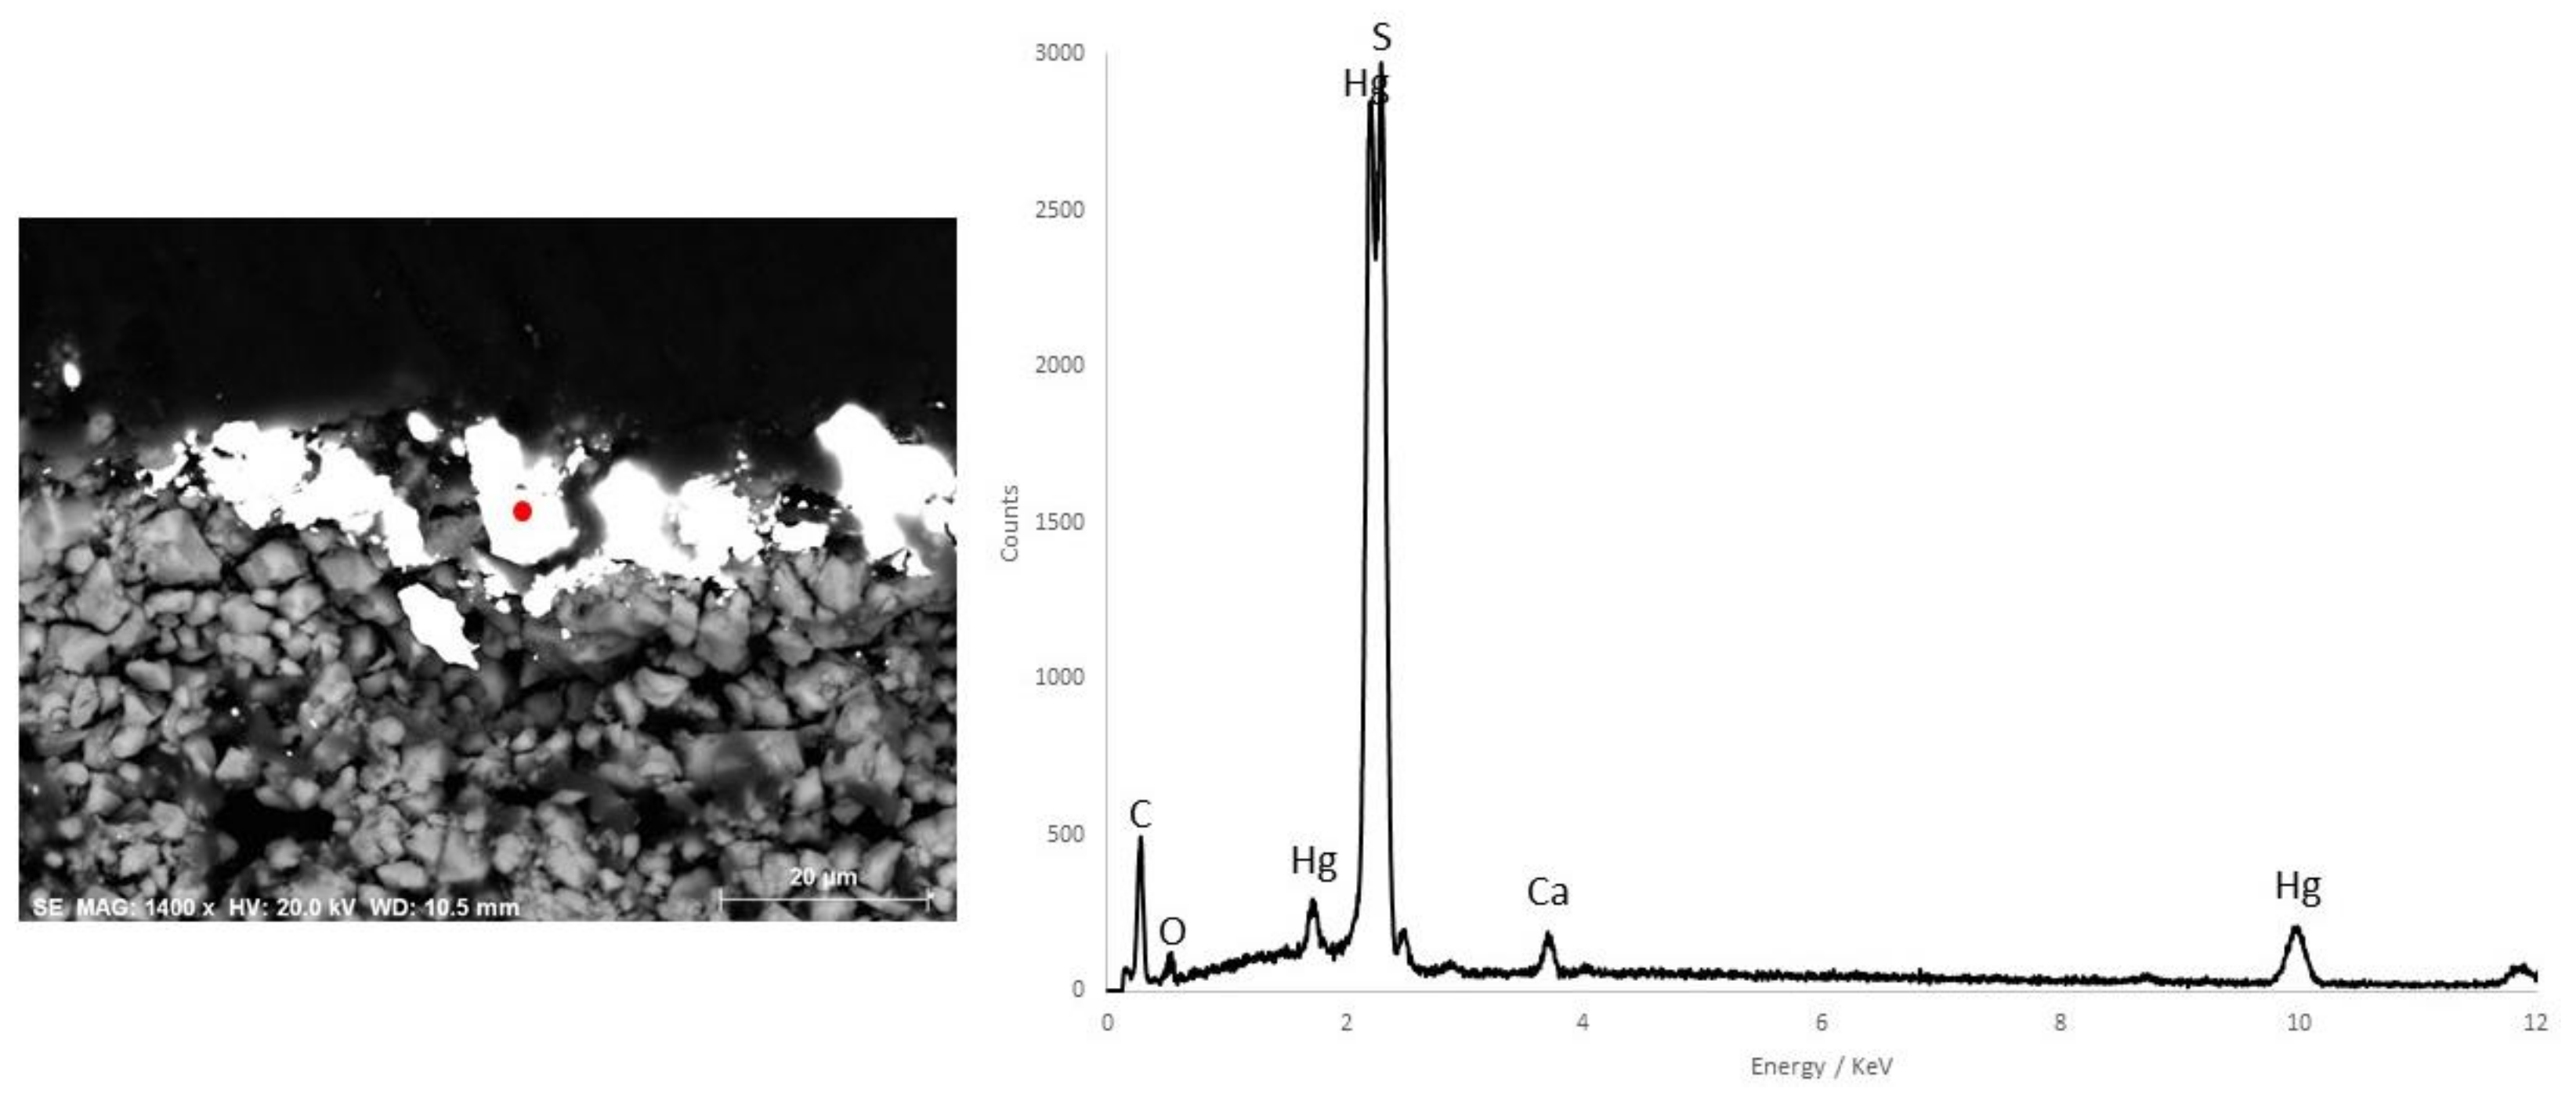
3.1. Red and Yellow Pigments
3.2. Pink Pigments
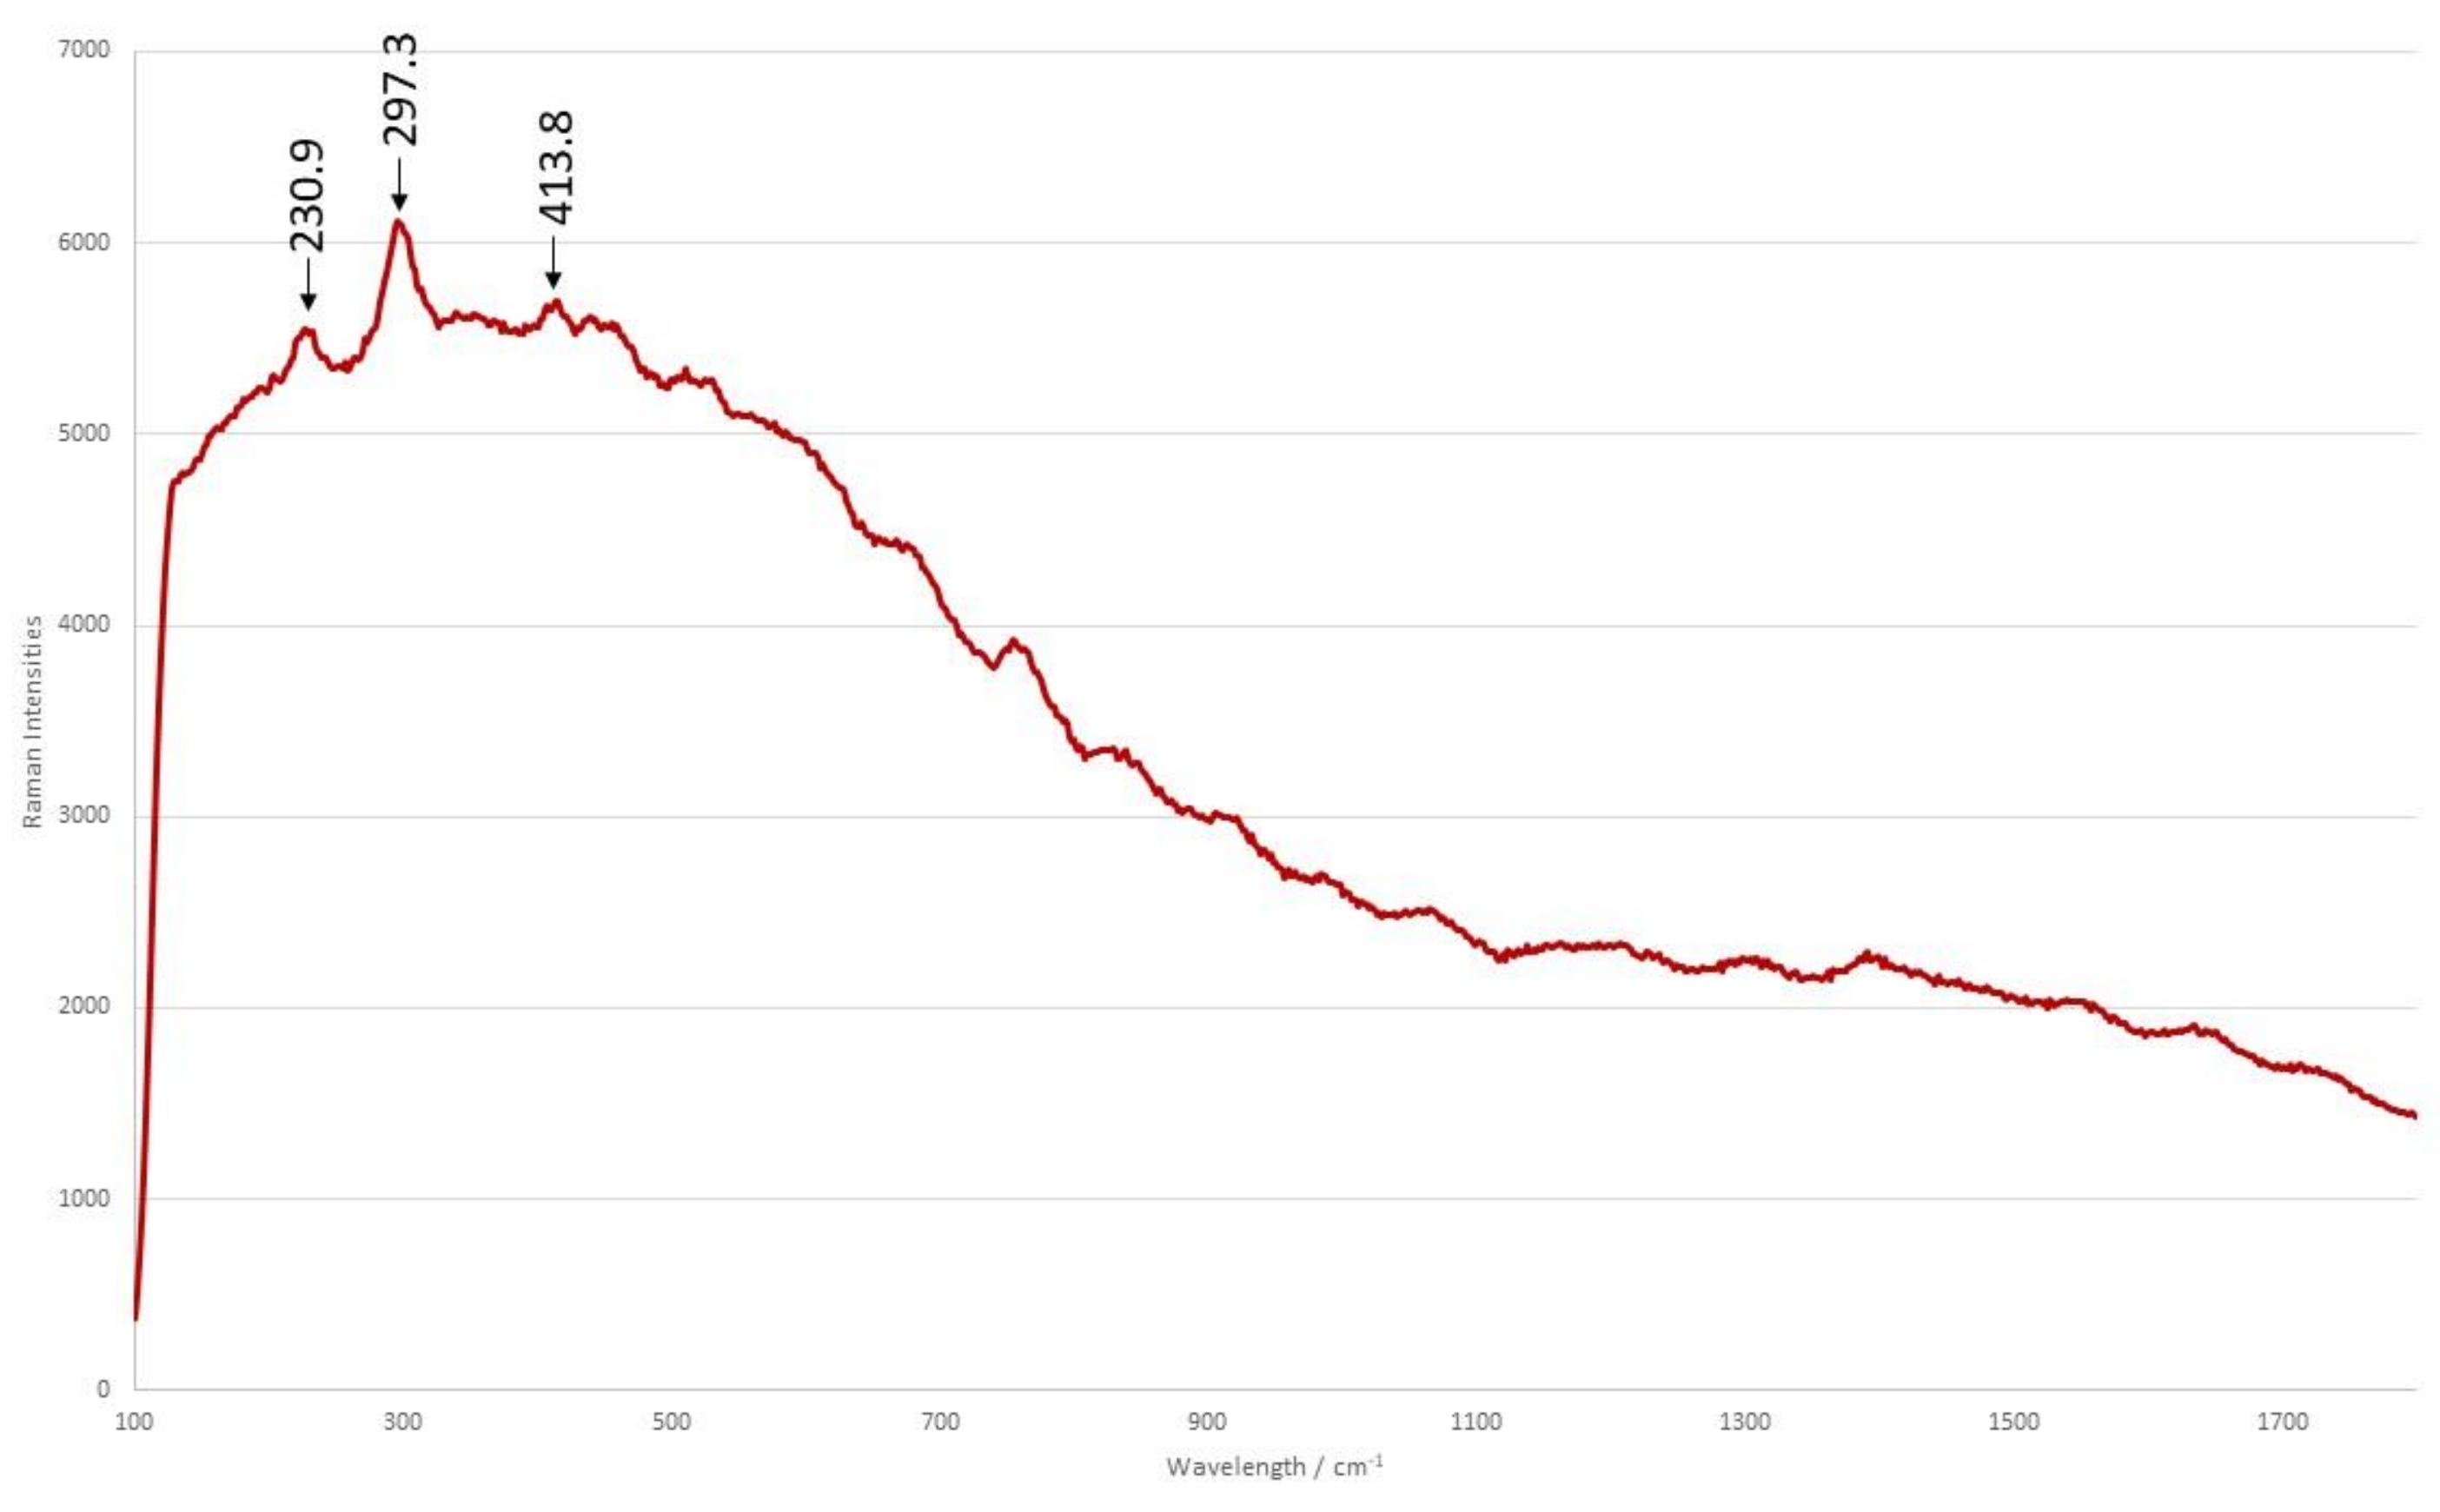
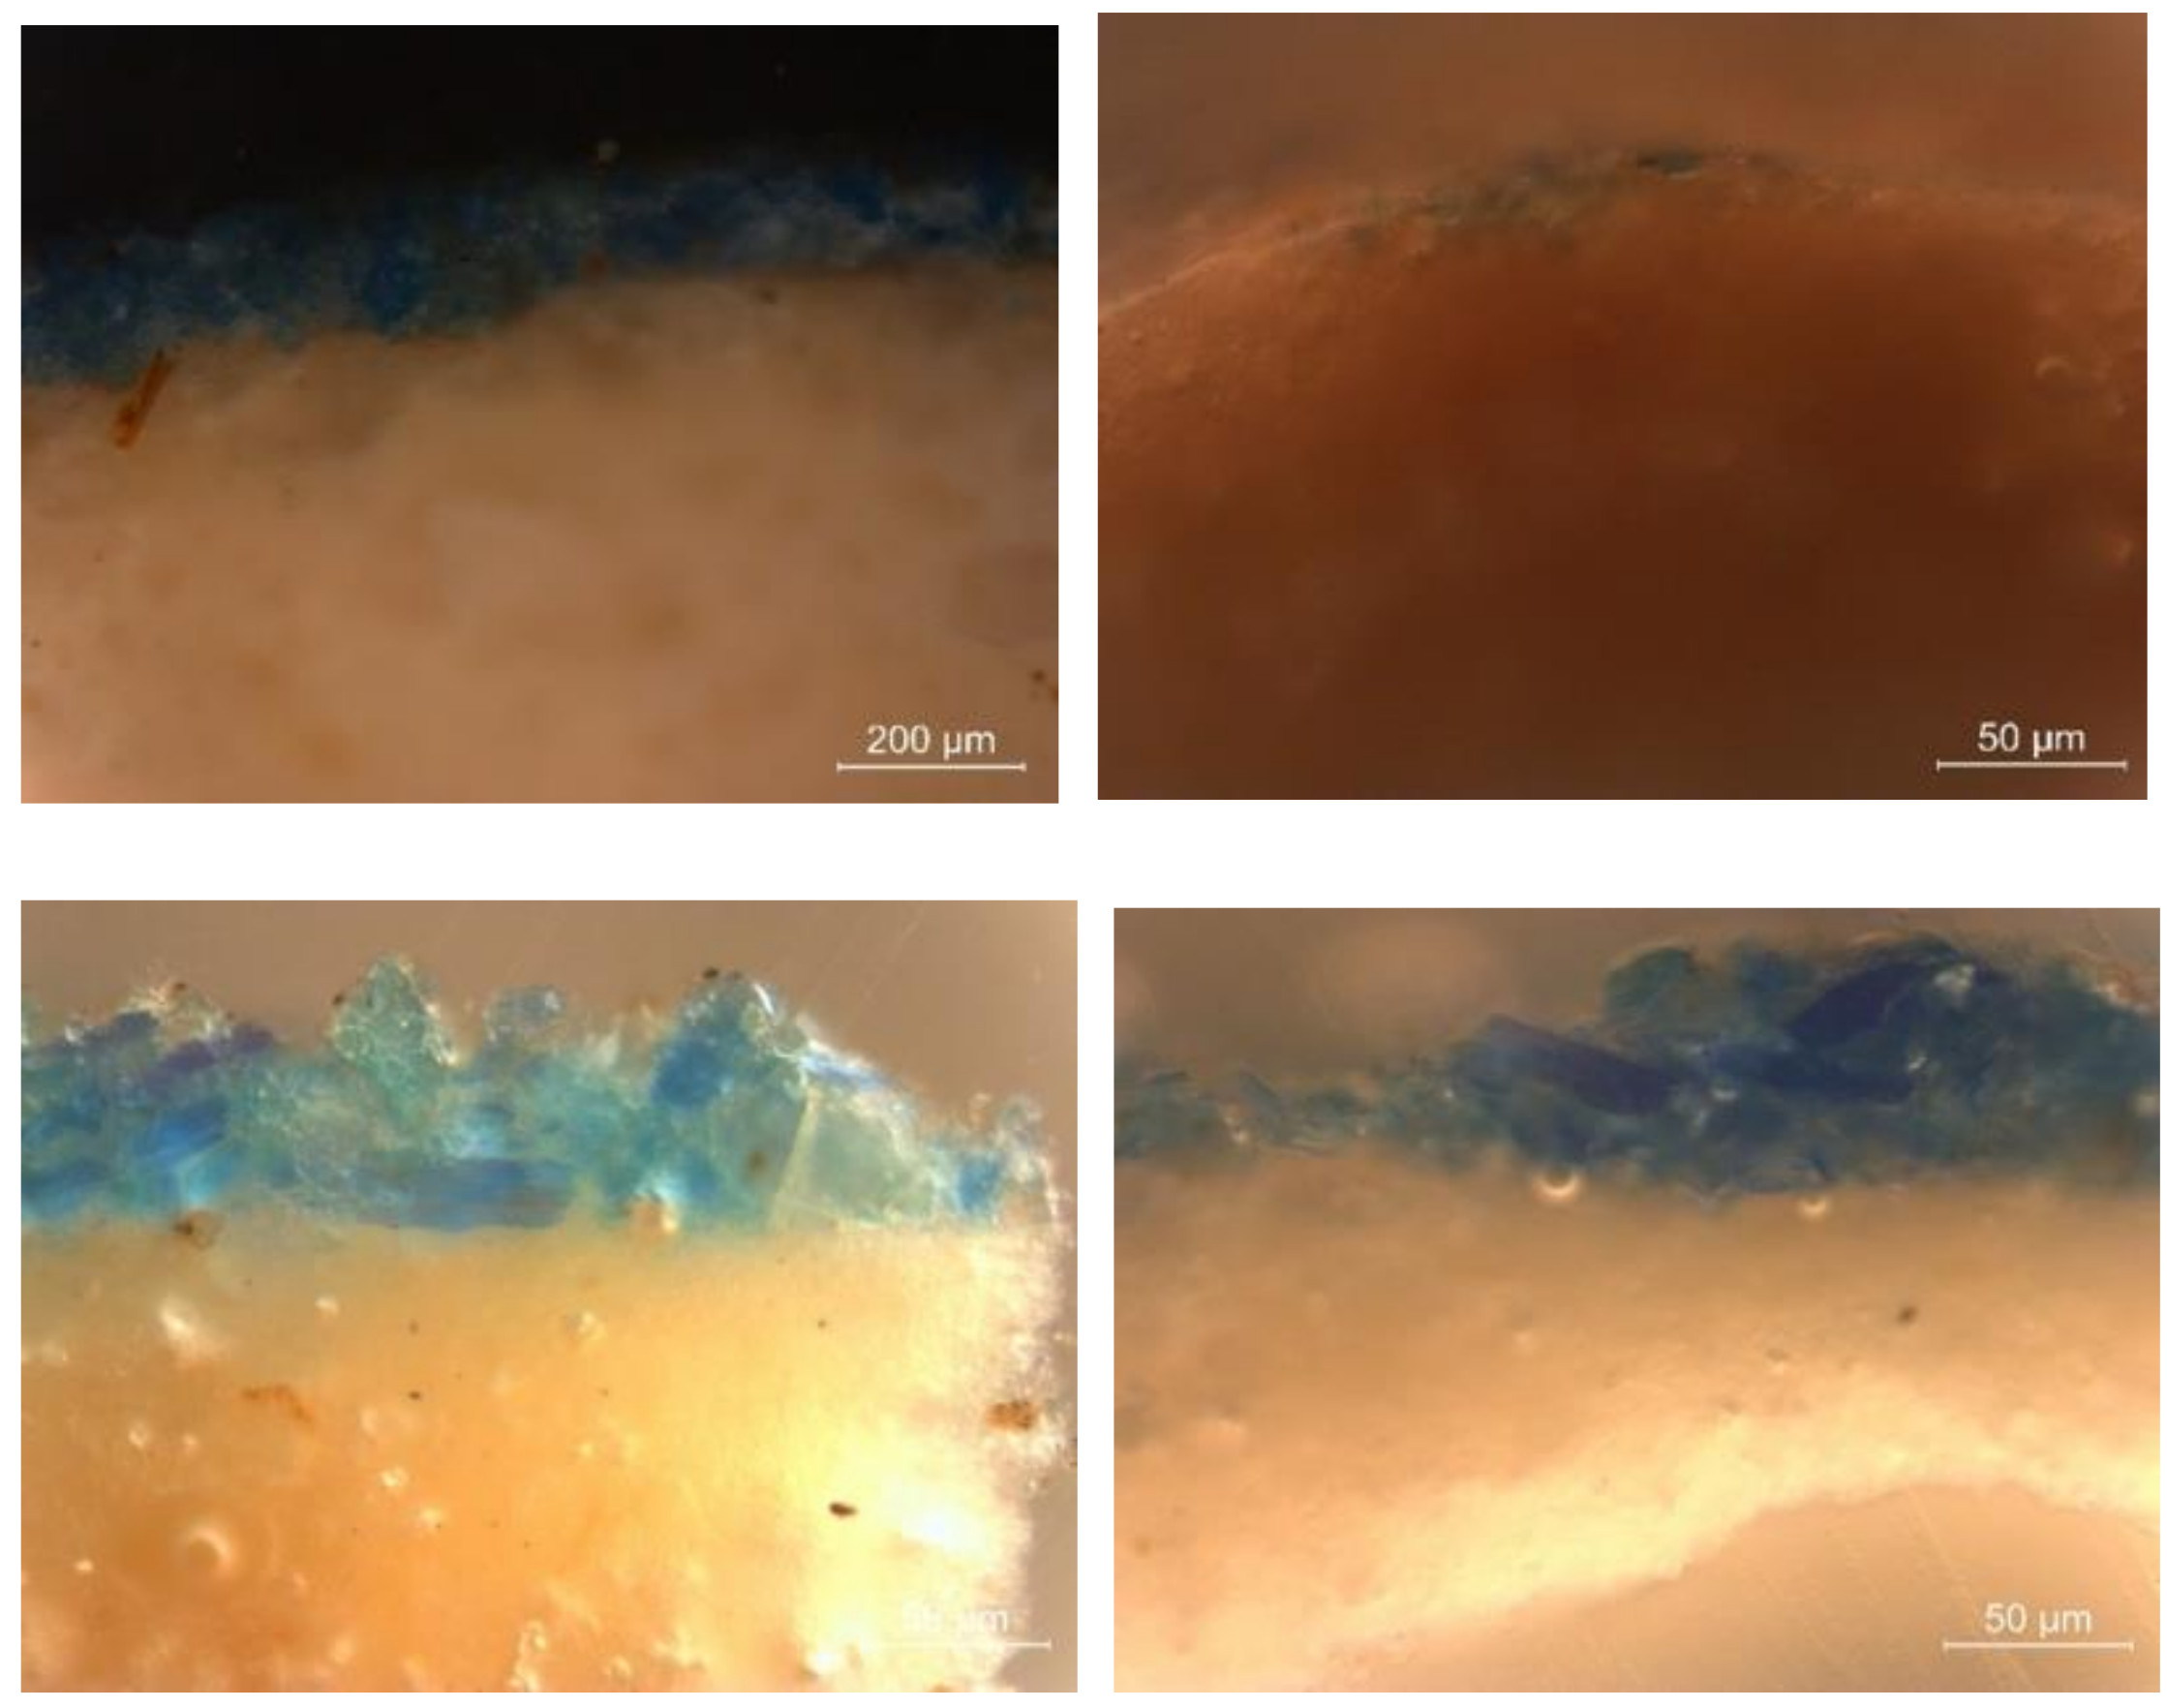
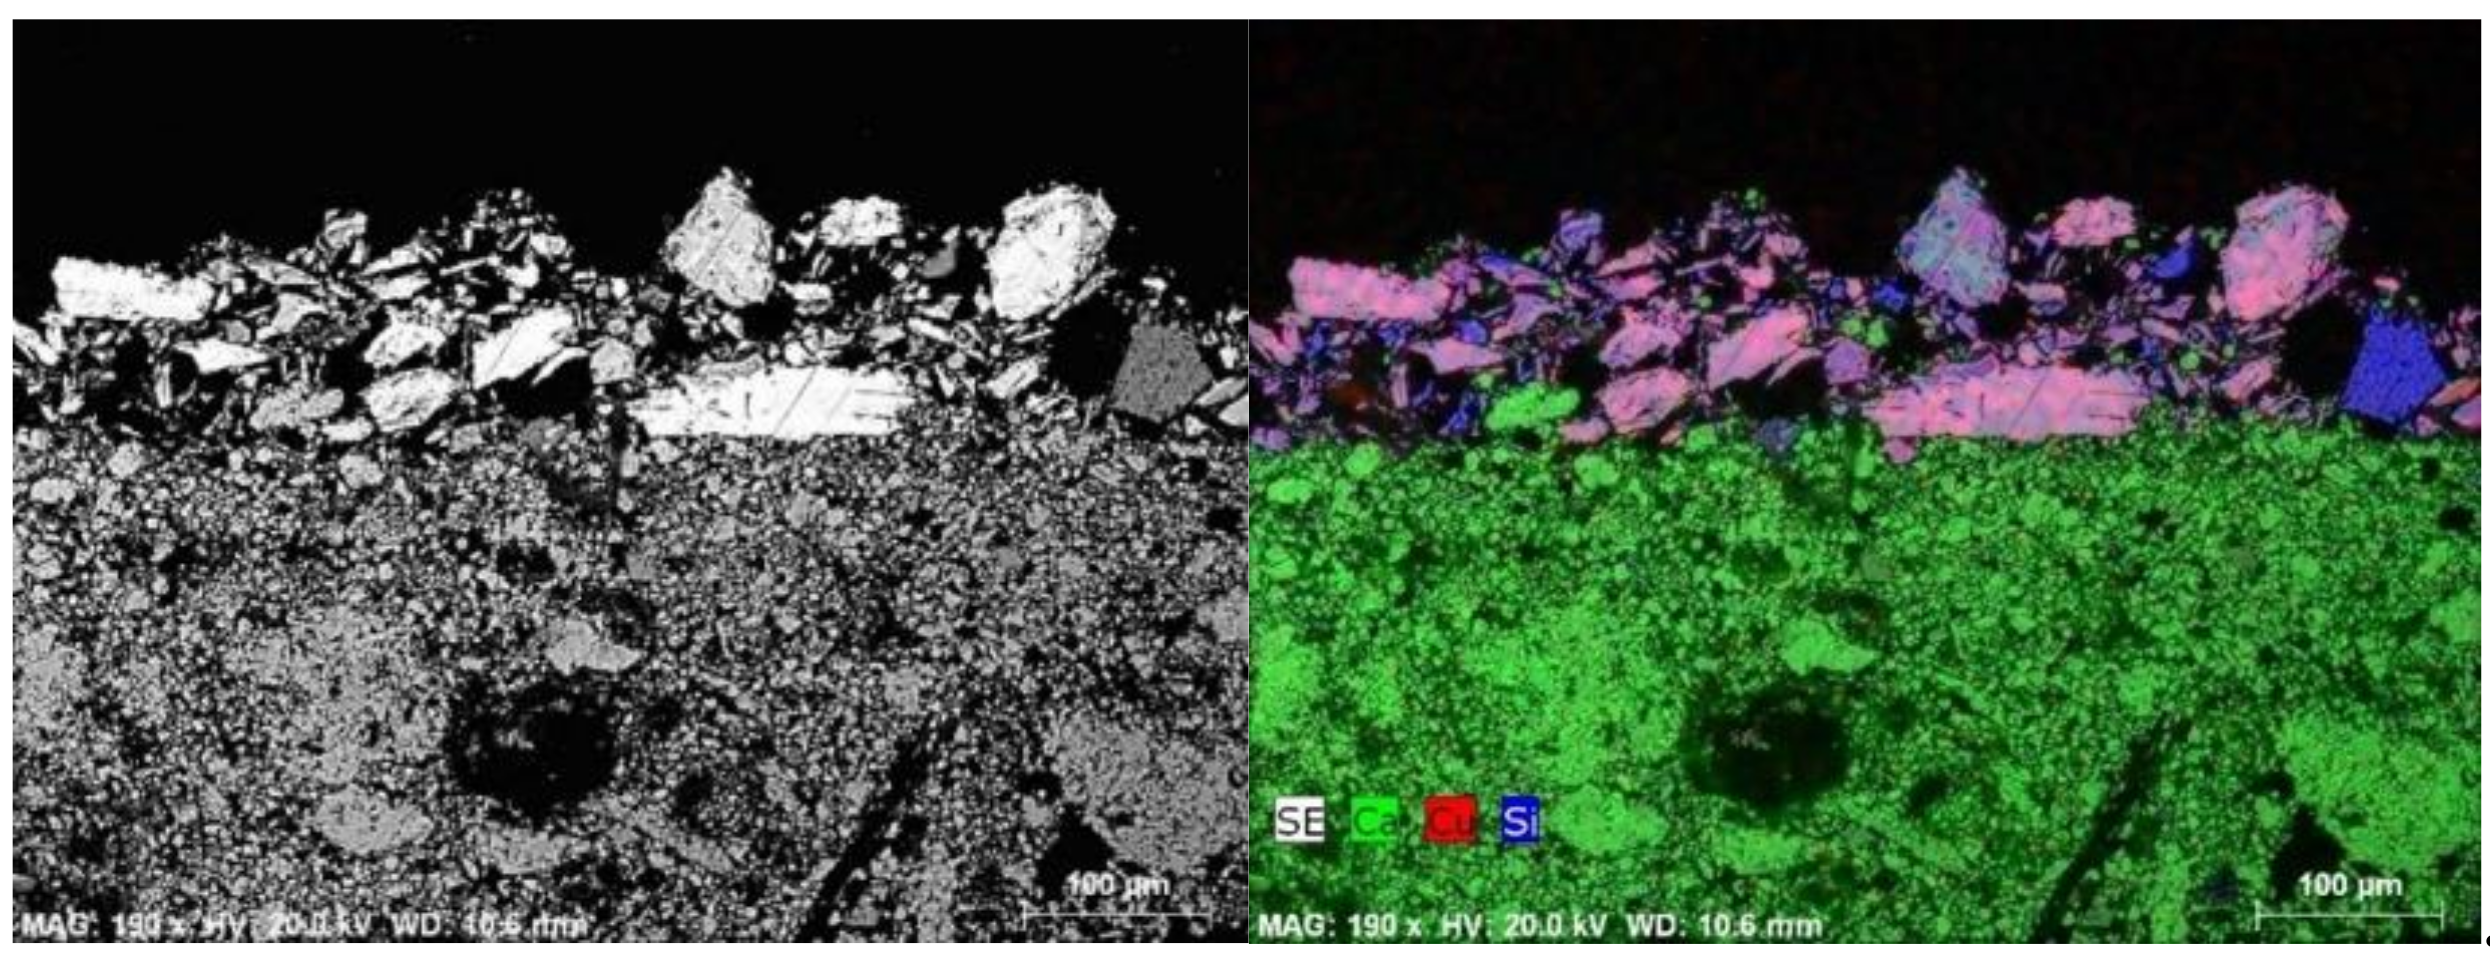
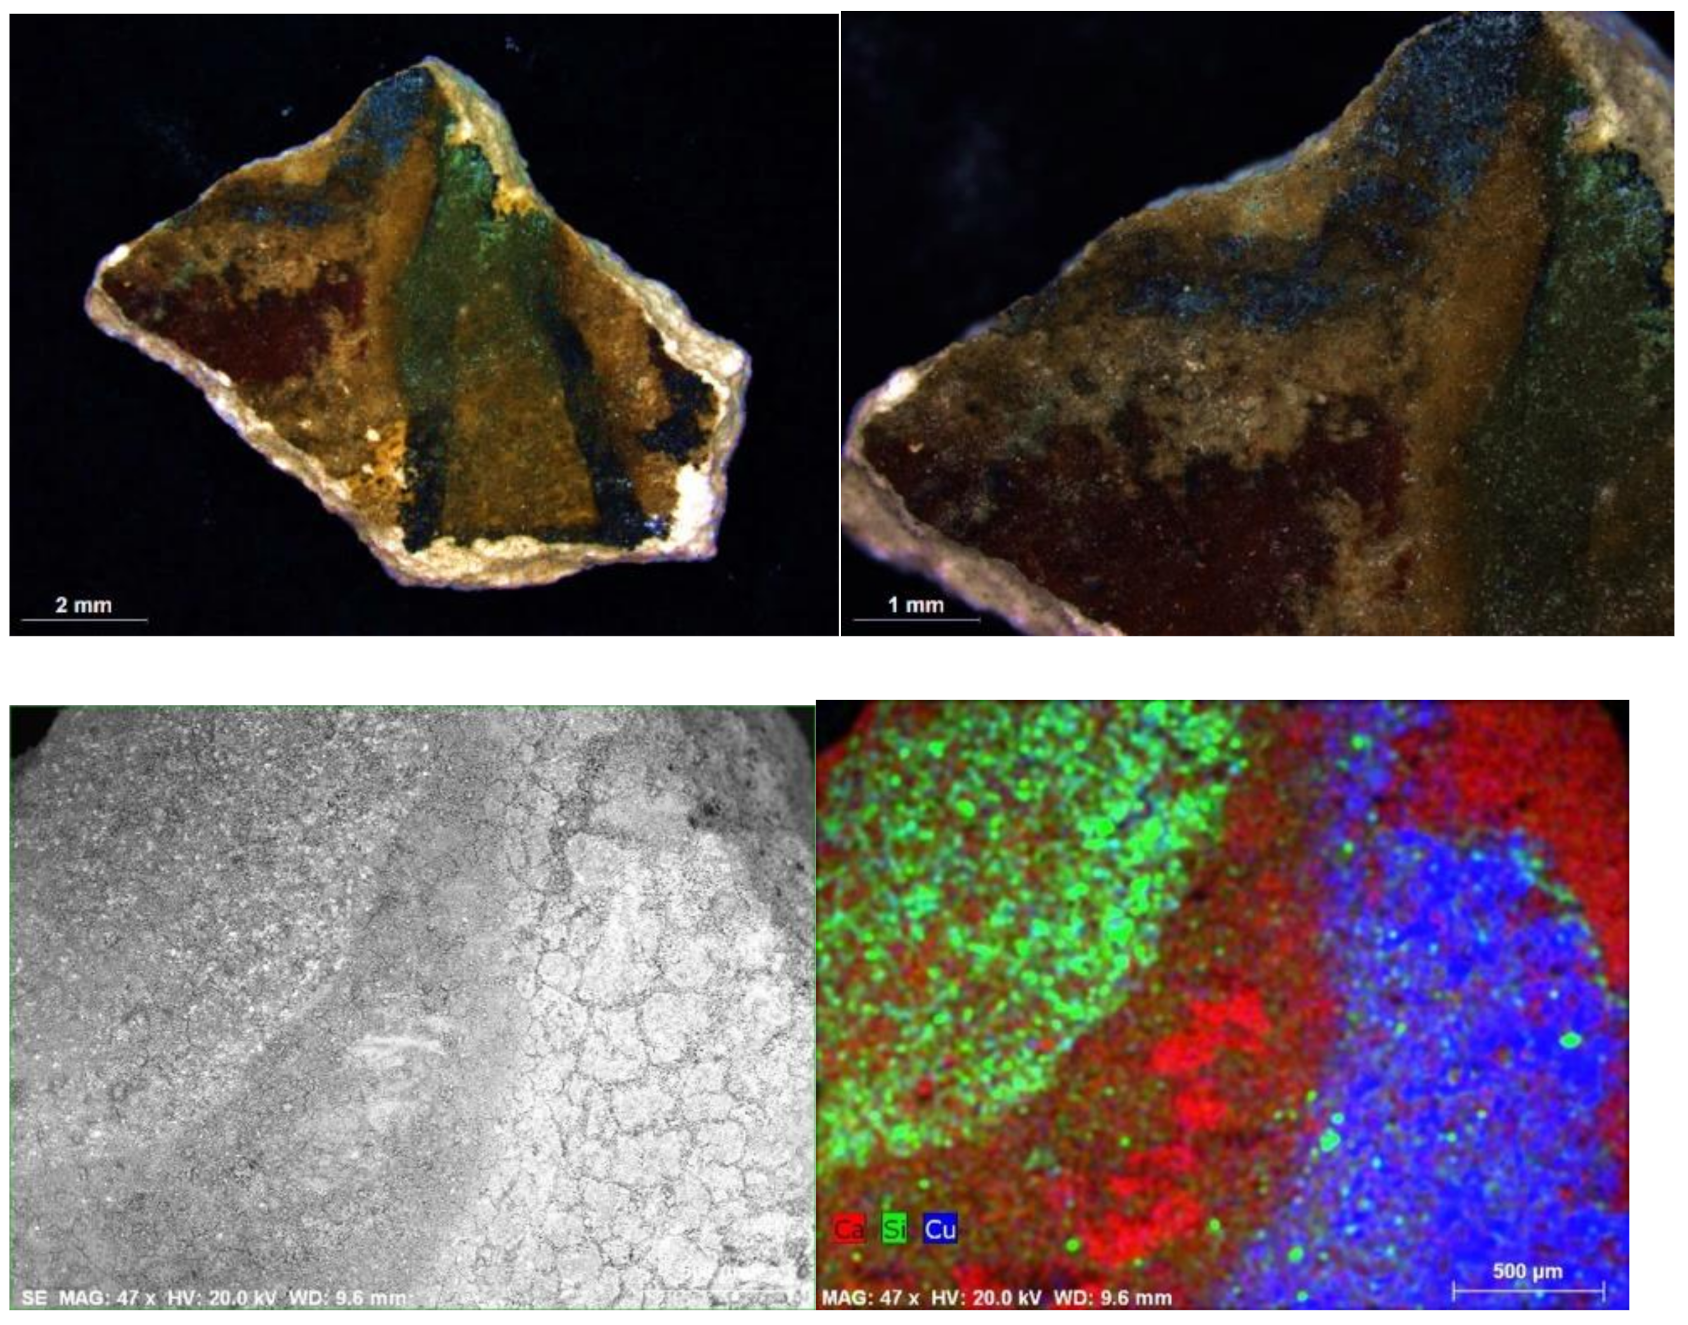
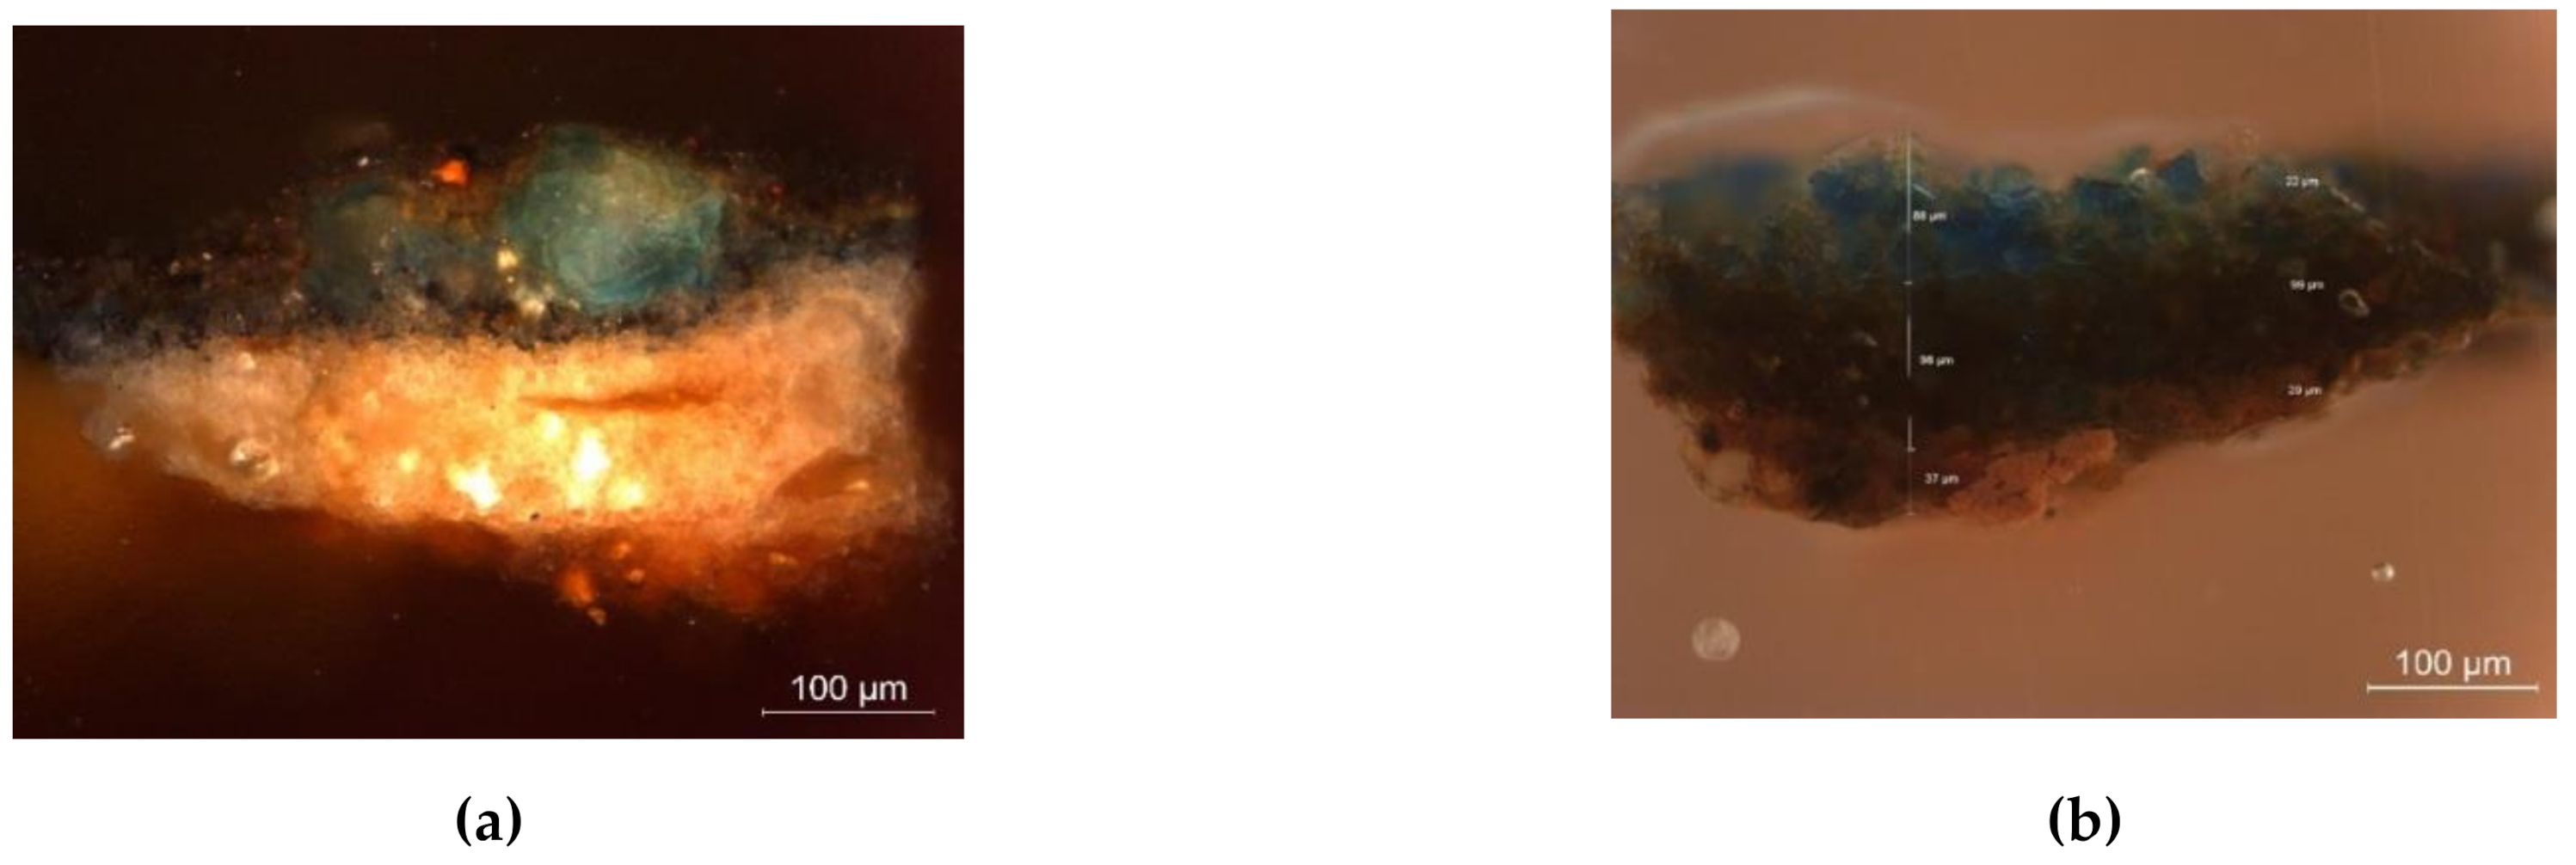
3.3. Blue Pigments
3.4. Green Pigments
3.5. Purple Pigments vs. Black Pigments
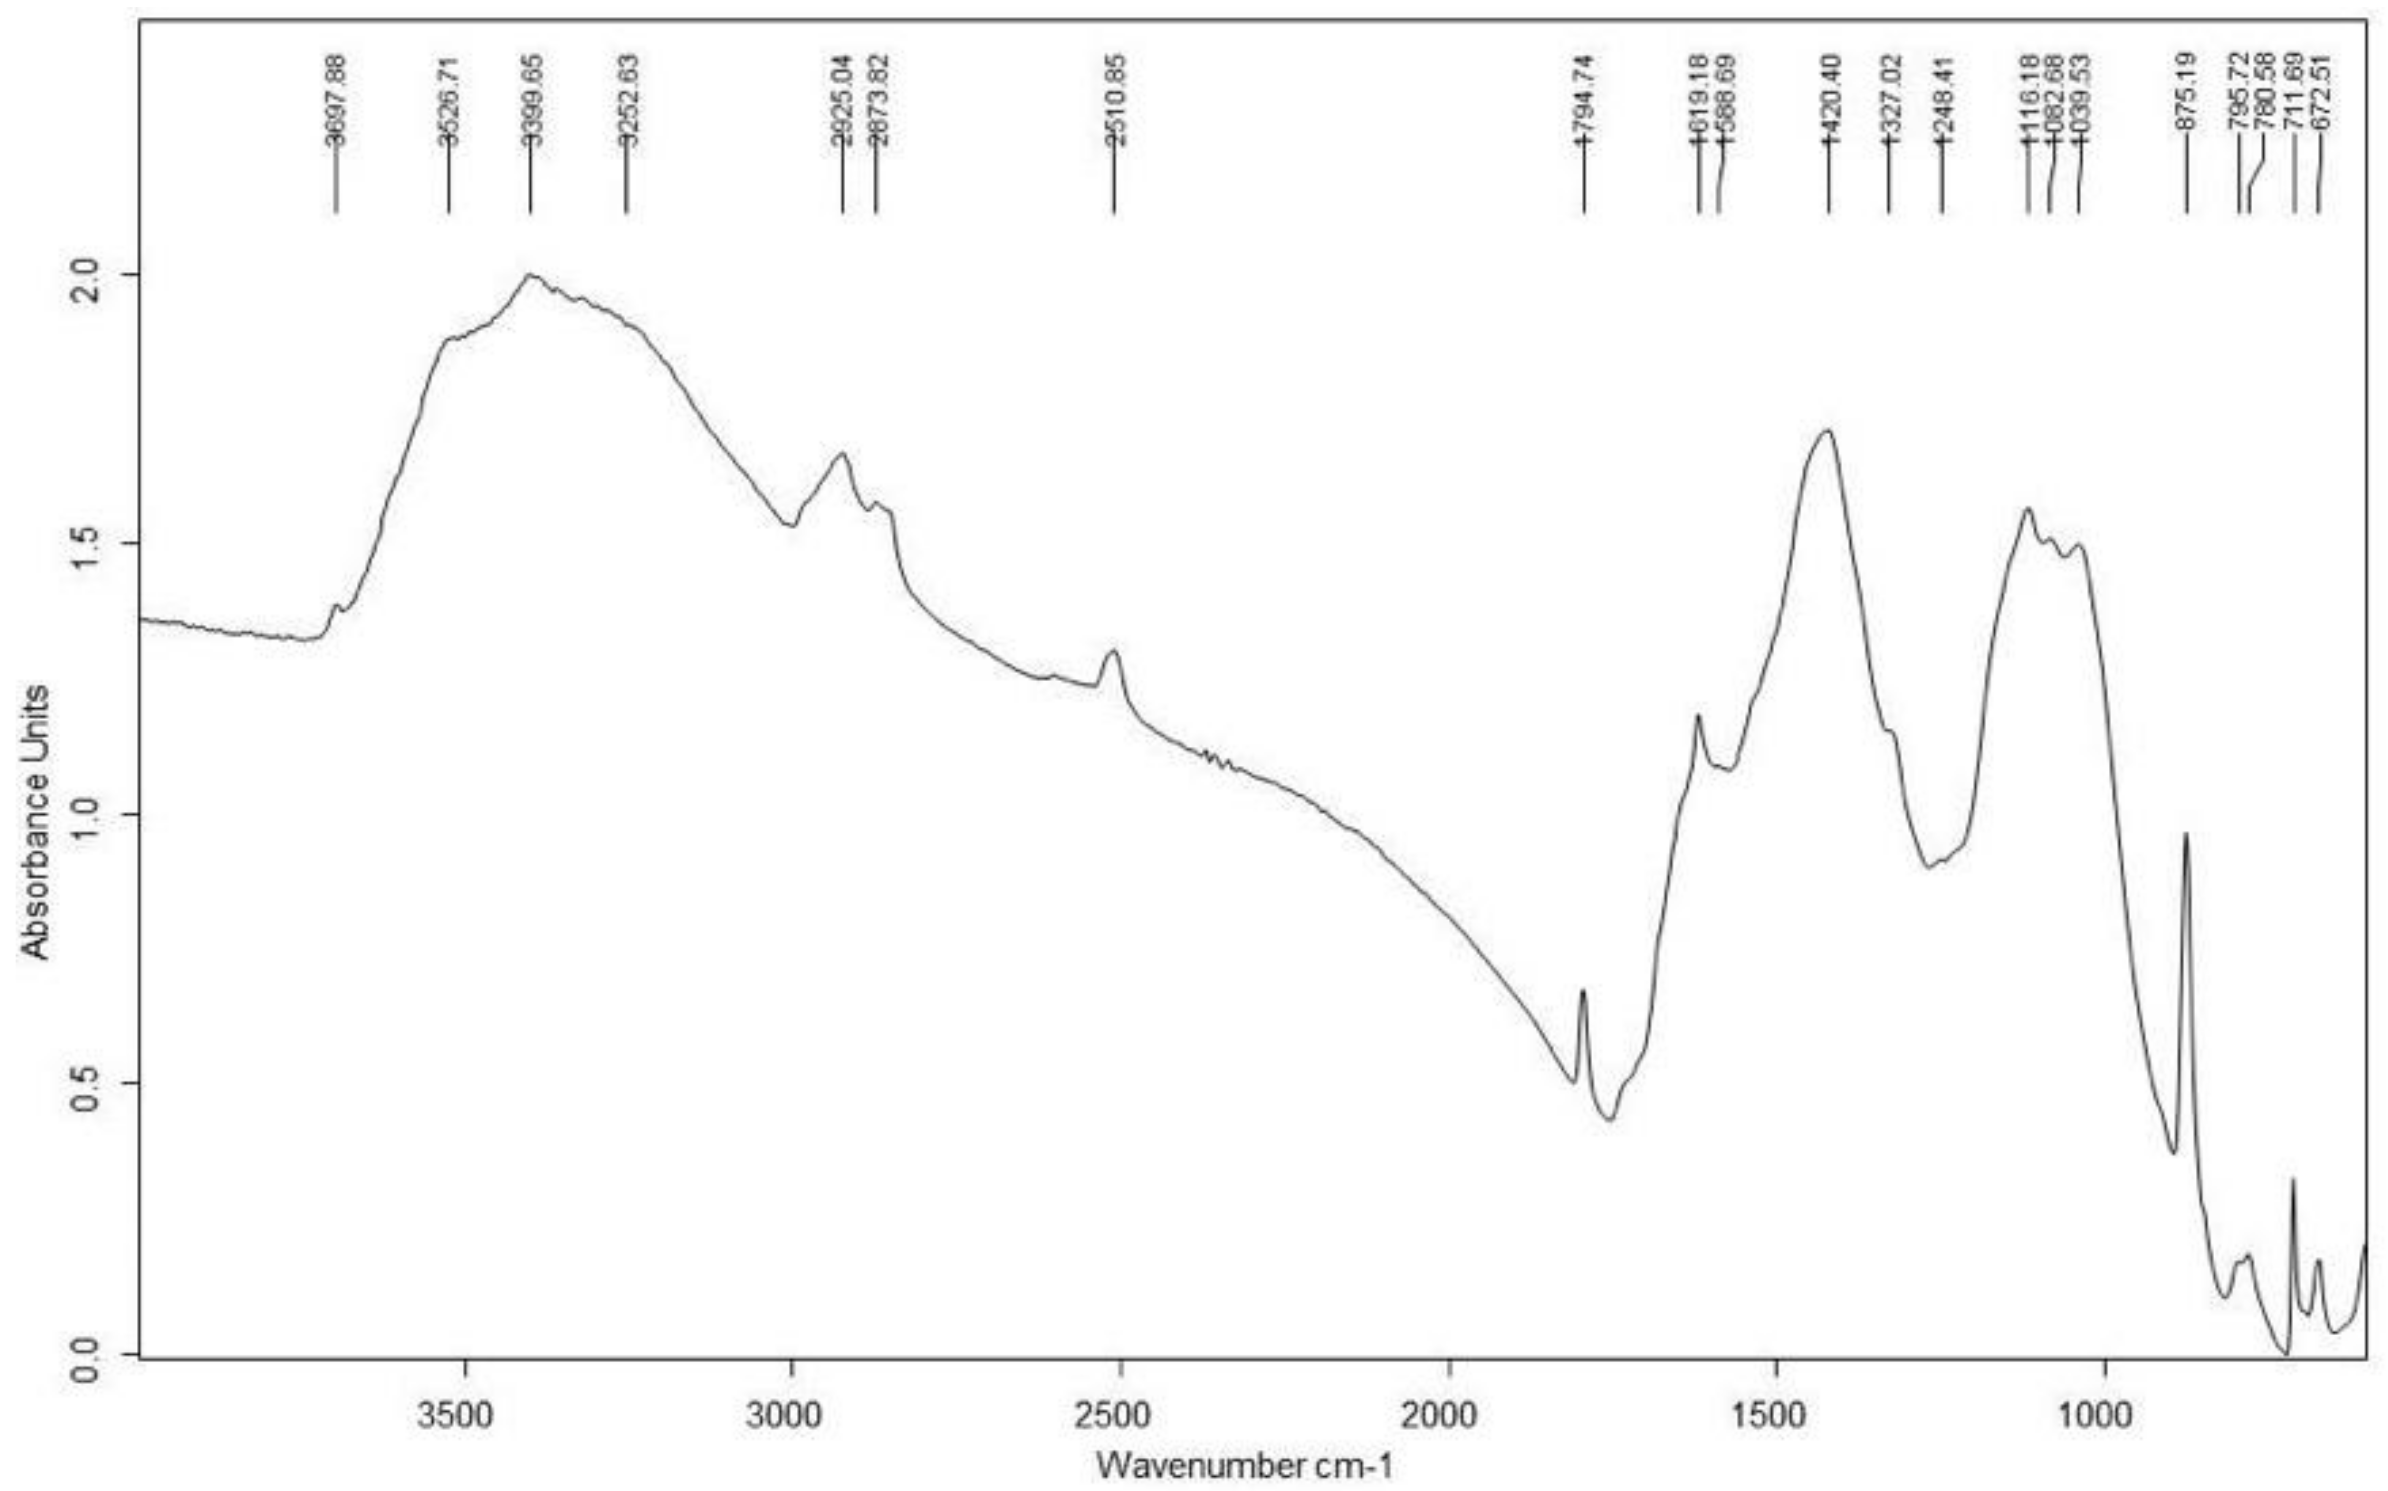
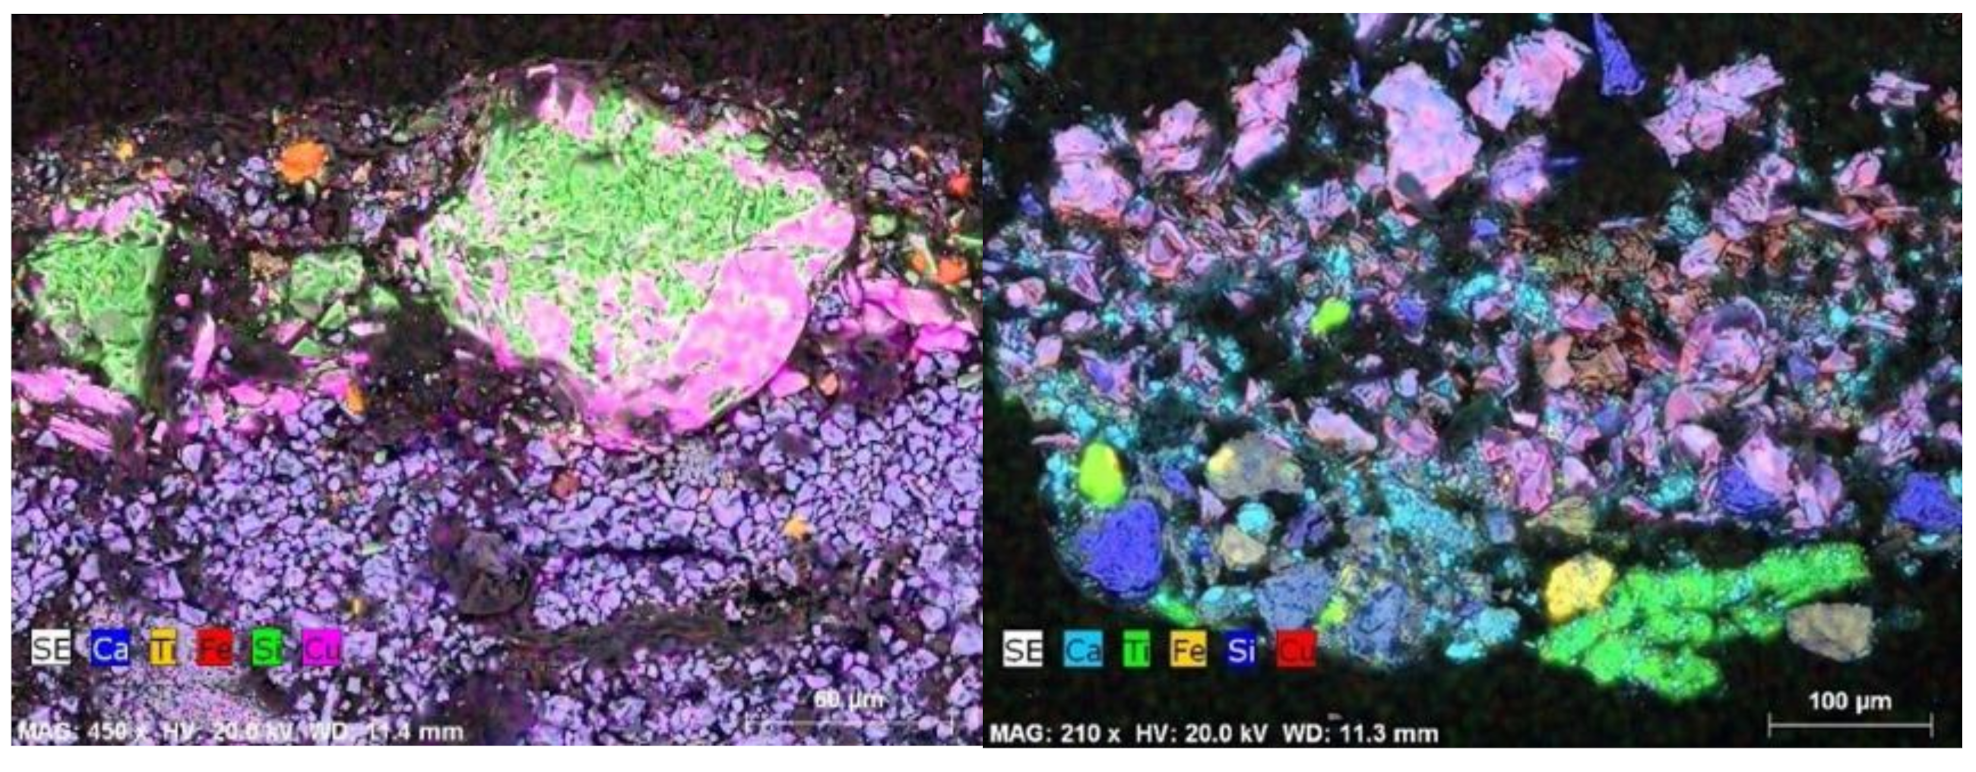
3.6. Preparatory Layer
3.7. Binders
4. Conclusions
Author Contributions
Funding
Conflicts of Interest
References
- Araújo, L.M.D. A Coleção Egípcia do Museu de História Natural da Universidade do Porto; Universidade do Porto: Porto, Portugal, 2011; p. 272. [Google Scholar]
- Figueiredo, A. The Lisbon Mummy Project: The employment of Non-Destructive Methods in Mummy Studies. 2011. Available online: http://www.mnarqueologia-ipmuseus.pt/documentos) (accessed on 8 September 2017).
- Prates, C.; Oliveira, C.; Sousa, S.; Ikram, S. A kidney’s ingenious path to trimillenar preservation: Renal Tuburculosis in an Egyptian mummy? Int. J. Paleopathol. 2015, 11, 7–11. [Google Scholar] [CrossRef] [PubMed]
- Veiga, P. A Rescue from Oblivion. In Collections at Risk: New Challenges in a New Environment; Derriks, C., Ed.; Lockwood Press: Atlanta, GA, USA, 2017; pp. 131–137. [Google Scholar]
- Afonso, M.G. A Coleção Egípcia da Universidade Do Porto—Histórias da sua Aquisição. 2015. Available online: https://www.academia.edu/22550552/A_COLEÇÃO_EGÍPCIA_DA_UNIVERSIDADE_DO_PORTO_HISTÓRIAS_DA_SUA_AQUISIÇÃO) (accessed on 8 September 2017).
- Lucas, A.; Harris, J.R. Ancient Egyptian Materials and Industries, 4th ed.; Edward Arnold: London, UK, 2012. [Google Scholar]
- Marey Mahmoud, H.H. Microanalysis of blue pigments from a Ptolemaic temple of Hathor (Thebes), Upper Egypt: A case study. Surf. Interface Anal. 2012, 44, 1271–1278. [Google Scholar] [CrossRef]
- Elias, M.; Chartier, C.; Prévot, G.; Garay, H.; Vigaud, C. The colour of ochres explained by their composition. Mat. Sci. Eng. 2006, B127, 70–80. [Google Scholar] [CrossRef]
- Scott, D.; Dennis, M.; Khandekar, N.; Keeney, J.; Carson, D.; Swartz Todd, L. An Egyptian cartonnage of the Graeco-Roman period. Stud. Conserv. 2003, 48, 41–56. [Google Scholar] [CrossRef]
- Uda, M.; Sassa, S.; Yoshimura, S.; Kondo, J.; Nakamura, M.; Ban, Y.; Adachi, H. Yellow, red and blue pigments from ancient Egyptian palace painted walls. Nucl. Instrum. Methods Phys. Res. B 2000, 163, 758–761. [Google Scholar] [CrossRef]
- Di Stefano, L.M.; Fuchs, R. Characterisation of pigments from Ptolemaic Egpytian Book of the Dead papyrus. Archaeol. Anthr. Sci. 2011, 3, 229–244. [Google Scholar] [CrossRef]
- Mazzocchin, G.A.; Rudello, D.; Bragato, C.; Agnoli, F. A short note on Egyptian blue. J. Cult. Herit. 2004, 5, 129–133. [Google Scholar] [CrossRef]
- Barnett, J.R.; Miller, S.; Pearce, E. Colour and art: A brief history of pigments. Opt. Laser Technol. 2006, 38, 445–453. [Google Scholar] [CrossRef]
- Berke, H. Chemistry in Ancient Times: The Development of Blue and Purple Pigments. Angew. Chem. Int. Ed. 2002, 41, 2483–2487. [Google Scholar] [CrossRef]
- Scott, D.; Warmlander, S.; Mazurek, J.; Quirke, S. Examination of some pigments, grounds and media from Egyptian cartonnage fragments in the Petrie Museum, University College London. J. Archaeol. Sci. 2009, 36, 923–932. [Google Scholar] [CrossRef]
- Duce, C.; Ghezzi, L.; Onor, M.; Bonaduce, I.; Colombini, M.P.; Tine, M.R.; Bramanti, E. Physico-chemical characterization of protein-pigment interactions in tempera pain reconstructions: Casein/cinnabar and albumin/cinnabar. Anal. Bioanal. Chem. 2012, 402, 2183–2193. [Google Scholar] [CrossRef]
- Granzotto, C.; Arslanoglu, J. Revealing the binding medium of the Roman Egyptian painted mummy shroud. J. Cult. Herit. 2017, 27, 170–174. [Google Scholar] [CrossRef]
- Scott, D. A review of ancient Egyptian pigments and cosmetics. Stud. Conserv. 2016, 61, 185–202. [Google Scholar] [CrossRef]
- Festa, G.; Saladino, M.L.; Mollica Nardo, V.; Armetta, F.; Renda, V.; Nasillo, G.; Pitonzo, R.; Spinella, A.; Borla, M.; Ferraris, E.; et al. Identifying the Unknown Content of an Ancient Egyptian Sealed Alabaster Vase from Kha and Merit’s Tomb Using Multiple Techniques and Multicomponent Sample Analysis in an Interdisciplinary Applied Chemistry Course. J. Chem. Educ. 2021, 98, 461–468. [Google Scholar] [CrossRef]
- Ribeiro, I.; Esteves, L. LJF 1-80 Unpublished Report; José de Figueiredo Laboratory: Lisbon, Portugal, 1980. [Google Scholar]
- Ribeiro, I.; Esteves, L. LJF 1-89 Unpublished Report; José de Figueiredo Laboratory: Lisbon, Portugal, 1989. [Google Scholar]
- Araújo, L.M.D. Antiguidades Egípcias; Museu Nacional de Arqueologia: Lisboa, Portugal; Instituto Português de Museus: Lisboa, Portugal, 1993; Volume 1, p. 406. [Google Scholar]
- Figueiredo, A.; Owens, L.S.; Oswald, R. Egyptian mummies at the Museu Nacional de Arquelogia, Lisbon: A proposed program of study. Pap. Inst. Archaeol. 2011, 13, 101–105. [Google Scholar] [CrossRef]
- Bracci, S.; Caruso, O.; Galeotti, M.; Iannaccone, R.; Magrini, D.; Picchi, D.; Pinna, D.; Porcinai, S. Multidisciplinary approach for the study of an Egyptian coffin (late 22nd/early 25th dynasty): Combining imaging and spectroscopic techniques. Spectrochim. Acta Part A Mol. Biomol. Spectrosc. 2015, 145, 511–522. [Google Scholar] [CrossRef] [PubMed]
- Genestar, C.; Pons, C. Earth pigments in paintings: Characterisation and differentiation by means of FTIR spectroscopy and SEM-EDS microanalysis. Anal. Bioanal. Chem. 2005, 382, 269–274. [Google Scholar] [CrossRef] [PubMed]
- Franquelo, M.L.; Duran, A.; Herrera, L.K.; Jimenez de Haro, M.C.; Perez-Rodriguez, J.L. Comparison between micro-Raman and micro-FTIR spectroscopy techniques for the characterization of pigments from Southern Spain Cultural Heritage. J. Mol. Struct. 2009, 924, 404–412. [Google Scholar] [CrossRef]
- Miliani, C.; Rosi, F.; Daveri, A.; Brunetti, B.G. Reflection infrared spectroscopy for the non-invasive in situ study of artists’ pigments. Appl. Phys. A Mater. Sci. Process. 2012, 106, 295–307. [Google Scholar] [CrossRef]
- Bell, I.M.; Clark, R.J.H.; Gibbs, P.J. Raman spectroscopic library of natural and synthetic pigments (pre- ~1850 AD). Spectrochim. Acta Part A 1997, 53, 2159–2179. [Google Scholar] [CrossRef]
- Ambers, J. Raman analysis of pigments from the Egyptian Old Kingdom. J. Raman Spectrosc. 2004, 35, 768–773. [Google Scholar] [CrossRef]
- Edwards, H.G.M.; Jorge Villar, S.E.; David, A.R.; de Faria, D.L.A. Nondestructive analysis of ancient Egyptian funerary relics by Raman spectroscopic techniques. Anal. Chim. Acta 2004, 503, 223–233. [Google Scholar] [CrossRef]
- Lee, L.; Quirke, S. Painting Materials. In Ancient Egyptian Materials and Technology; Nicholson, P.T., Shaw, I., Eds.; Cambridge University Press: Cambridge, UK, 2000; pp. 104–120. [Google Scholar]
- Bianchetti, P.; Talarico, F.; Vigliano, M.G.; Fuad Ali, M. Production and characterization of Egyptian blue and Egyptian green frit. J. Cult. Herit. 2000, 1, 179–188. [Google Scholar] [CrossRef]
- Scott, D.; Swartz Dodd, L.; Furihata, J.; Tanimoto, S.; Keeney, J.; Schilling, M.R.; Cowan, E. An ancient Egyptian cartonnage broad collar—Technical examination of pigments and binding media. Stud. Conserv. 2004, 49, 177–192. [Google Scholar]
- Kendrick, E.; Dann, K.S.E. Structure and colour properties in the Egyptian blue family, M1−xM’xCuSi4O10, as a function of M, M’ where M, M’ = Ca, Sr and Ba. Dyes Pigment. 2007, 73, 13–18. [Google Scholar] [CrossRef]
- Lau, D.; Kappen, P.; Strohschnieder, M.; Brack, N.; Pigram, P.J. Characterization of green copper phase pigments in Egyptian artifacts with X-ray absorption spectroscopy and principal component analysis. Spectrochim. Acta Part B 2008, 63, 1283–1289. [Google Scholar] [CrossRef]
- Jaksch, H.; Seipel, W.; Weiner, K.L.; El Goresy, A. Egyptian blue—Cuprovarite a window into ancient Egyptian technology. Die Nat. 1983, 70, 525–535. [Google Scholar] [CrossRef]
- Mirti, P.; Appolonia, L.; Casoli, A.; Ferrari, R.P.; Laurenti, E. Spectrochemical and structural studies on a Roman sample of Egyptian blue. Spectrochim. Acta 1995, 51, 437–446. [Google Scholar] [CrossRef]
- Giménez, J.; Espriu-Gascon, A.; Bastos-Arrieta, J.; Joande, P. Effect of NaCl on the fabrication of the Egyptian blue pigment. J. Archaeol. Sci. Rep. 2017, 14, 174–180. [Google Scholar] [CrossRef]
- Schiegl, S.; Weiner, K.L.; El Goresy, A. Composition and provenance of blue and green Cu-pigments in Ancient Egyptian wall paintings: A key to the accurate chronology of bronze technology of in Ancient Egypt. Erzmetall 1990, 43, 265–272. [Google Scholar]
- Hatton, G.D.; Shortland, A.J.; Tite, M.S. The production technology of Egyptian blue and green frits from second millennium BC Egypt and Mesopotamia. J. Archaeol. Sci. 2008, 35, 1591–1604. [Google Scholar] [CrossRef]
- Pagès-Camagna, S.; Colinart, S.; Coupry, S. Fabrication process of archaeological Egyptian blue and green pigments enlightened by Raman Microscopy and Scanning Electron Microscopy. J. Raman Spectrosc. 1999, 30, 313–317. [Google Scholar] [CrossRef]
- Colinart, S.; Pagès-Camagna, S. Egyptian Polychromy: Pigments of the pharaonic palette. In The Polychromy of Ancient Sculptures and Terracott ARmy of the First Chinese Emperor; Yongqi, Ed.; Arbeitshefte des Bayerischen Landesamt fur Denkmalplege: Munchen, Germany, 2001; pp. 85–88. [Google Scholar]
- Bonizzoni, L.; Bruni, S.; Guglielmi, V.; Milazzo, M.; Neri, O. Field and laboratory multi-technique analysis of pigments and organic paint media from an Egyptian coffin (26th Dynasty). Archaeometry 2011, 53, 1212–1230. [Google Scholar] [CrossRef]
- Chiari, G.; Scott, D. Pigments analysis: Potentialities and problems. Period. Mineral. 2004, 73, 227–237. [Google Scholar]
- Daniels, V.; Stacey, R.; Middleton, A. The blackening of paint containing Egyptian blue. Stud. Conserv. 2004, 49, 217–230. [Google Scholar]
- Felder-Casagrande, S.; Wiedemann, H.G.; Reller, A. The calcination of limestone—The past, the presence and the future of a crucial industrial process. J. Therm. Anal. 1997, 49, 971–978. [Google Scholar] [CrossRef]
- Mazzeo, R.; Prati, R.; Quarante, M.; Joseph, E.; Kendix, E.; Galeotti, M. Attenuated reflection micro FTIR characterization of pigment-binder interaction in reconstructed paint films. Anal. Bioanal. Chem. 2008, 392, 65–76. [Google Scholar] [CrossRef]
- Ménager, M.; Azémard, C.; Viellescazes, C. Study of Egyptian mummification balms by FT-IR spectroscopy and GC-MS. Microchem. J. 2014, 114, 32–41. [Google Scholar] [CrossRef]
- Sotiropoulou, S.; Papliaka, Z.E.; Vaccari, L. Micro FTIR imaging for the investigation ofdeteriorated organic binders in wall painting stratigraphy of different techniques and periods. Microchem. J. 2016, 124, 559–567. [Google Scholar] [CrossRef]
- Ribechini, E.; Orsini, S.; Silvano, F.; Colombini, M.P. Py-GC/MS, GC/MS, and FTIR investigations on LATE Roman-Egyptian adhesives from opus sectile: New insights into ancient recipes and technologies. Anal. Chim. Acta 2009, 638, 79–87. [Google Scholar] [CrossRef]
- Pironzo, R.; Armetta, F.; Saladino, M.L.; Caponetti, E.; Oliveri, F.; Tusa, S. Application of Gas Chromatography coupled with Mass Spectroscopy (GC/MS) to the analysis of archeological ceramic amphorae belonging to the Carthaginian fleet that was defeated in the Egadi battle (241 B.C.). Acta IMEKO 2017, 6, 67–68. [Google Scholar] [CrossRef][Green Version]
- Lucejko, A.J.J.; Colombini, M.P.; Ribechini, E. Chemical alteration patterns of ancient Egyptian papyri studied by Pyrolysis-GC/MS with in situ silylation. J. Anal. Appl. Pyrolysis 2020, 152, 104967. [Google Scholar] [CrossRef]
- van Keulen, H.; Schilling, M. AMDIS & EXCEL: A Powerful Combination for Evaluating THM-Py-GC/MS Results from European Lacquers. Stud. Conserv. 2019, 64, S74–S80. [Google Scholar]


| Funerary Artifact | Sample Code | Colour | XRF | µFTIR | µRaman | SEM-EDS | Pigments | Preparatory Layer |
|---|---|---|---|---|---|---|---|---|
| Funerary Mask #1 Late Period | 4 | Red | - | Calcite, gypsum, quartz, kaolinite | Haematite | C, O, Fe, Ti, Ca, Si | Red Ochre | Chalk |
| 5 | Beige | - | Calcite, gypsum, quartz, kaolinite | - | C, O, Fe, Ti, Ca, Si, Al, K, Mg | Red Ochre + Calcite | ||
| 7 | Black | - | EB, calcite, gypsum, calcium oxalate | - | C, O, Si, Ca, Cu (EB) | Egyptian Blue + Red Ochre | ||
| Sarcophagus #1 Late Period–Roman Period | D3 | Green | - | - | - | Chalk | ||
| D4 | Blue | - | EB, calcite, gypsum, calcium oxalate | - | O, C, Si, Ca, Sn, Na, Cu, Cl (EB) | Egyptian Blue | ||
| Pink | - | Calcite, gypsum, quartz, kaolinite, calcium oxalate | - | O, C, S, As, Ca, Si, Fe | Red Ochre + Realgar + Calcite + Gypsum | |||
| D8 | Red | - | Calcite, gypsum, quartz, kaolinite, calcium oxalate | - | O, C, S, As, Ca, Si, Fe | Red Ochre + Realgar | ||
| Blue | - | EB, calcite, gypsum, calcium oxalate | - | O, C, Si, Ca, Sn, Na, Cu, Cl (EB) | Egyptian Blue | |||
| Green | - | - | - | - | Egyptian Green | |||
| Yellow | - | - | - | - | Yellow Ochre | |||
| Funerary Mask #2 Late Period | M1-1 | Black | - | - | - | - | Egyptian Blue + Red Ochre | Chalk |
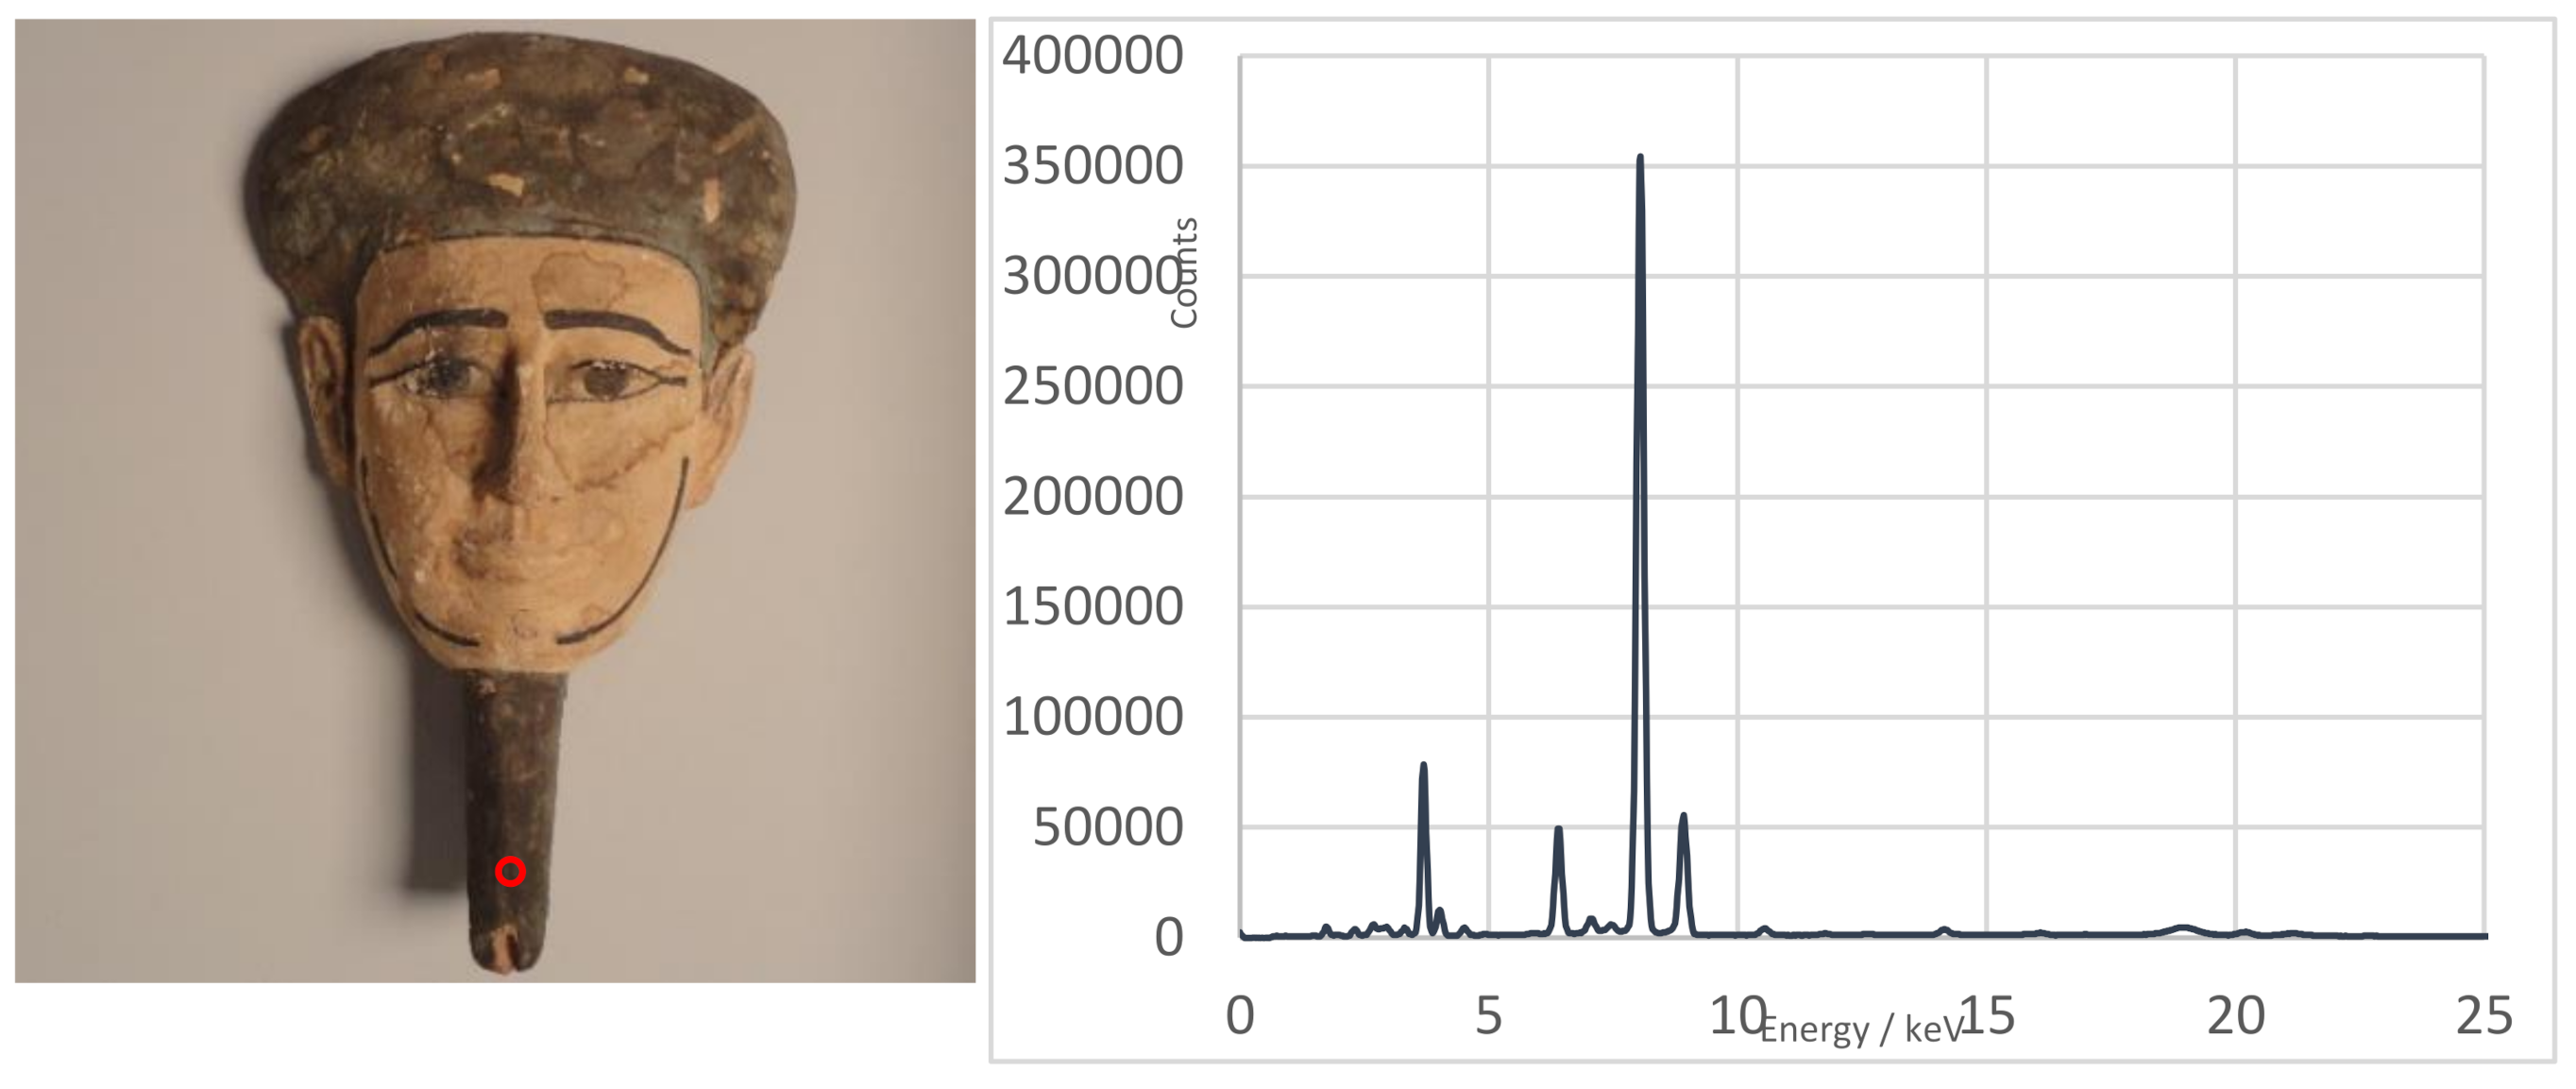
| M1-3 | Blue | Cu, Ca, Fe | EB, calcite, gypsum | - | C, O, Si, Ca, Cu (EB) | Egyptian Blue | ||
| Sarcophagus #2 Ptolemaic Period | M2-2 | Blue | - | - | - | C, O, Si, Ca, Cu (EB) | Egyptian Blue | Chalk |
| M2-3 | Red | - | Calcite, gypsum | Cinnabar | - | Cinnabar + Red Ochre | ||
| Funerary Mask #1 Ptolemaic Period | M3-1 | Blue | Cu, Ca, Fe | EB, calcite, gypsum | - | - | Egyptian Blue | Chalk |
| M3-3 | Red | Hg, Ca, Fe | Calcite, gypsum | Cinnabar | - | Cinnabar + Red Ochre |
Publisher’s Note: MDPI stays neutral with regard to jurisdictional claims in published maps and institutional affiliations. |
© 2021 by the authors. Licensee MDPI, Basel, Switzerland. This article is an open access article distributed under the terms and conditions of the Creative Commons Attribution (CC BY) license (https://creativecommons.org/licenses/by/4.0/).
Share and Cite
Schiavon, N.; Panganiban, P.; Valadas, S.; Bottaini, C.; Barrocas Dias, C.; Manhita, A.; Candeias, A. A Multi-Analytical Study of Egyptian Funerary Artifacts from Three Portuguese Museum Collections. Heritage 2021, 4, 2973-2995. https://doi.org/10.3390/heritage4040166
Schiavon N, Panganiban P, Valadas S, Bottaini C, Barrocas Dias C, Manhita A, Candeias A. A Multi-Analytical Study of Egyptian Funerary Artifacts from Three Portuguese Museum Collections. Heritage. 2021; 4(4):2973-2995. https://doi.org/10.3390/heritage4040166
Chicago/Turabian StyleSchiavon, Nick, Patricia Panganiban, Sara Valadas, Carlo Bottaini, Cristina Barrocas Dias, Ana Manhita, and Antonio Candeias. 2021. "A Multi-Analytical Study of Egyptian Funerary Artifacts from Three Portuguese Museum Collections" Heritage 4, no. 4: 2973-2995. https://doi.org/10.3390/heritage4040166
APA StyleSchiavon, N., Panganiban, P., Valadas, S., Bottaini, C., Barrocas Dias, C., Manhita, A., & Candeias, A. (2021). A Multi-Analytical Study of Egyptian Funerary Artifacts from Three Portuguese Museum Collections. Heritage, 4(4), 2973-2995. https://doi.org/10.3390/heritage4040166