Article

Characterizing Color Quality, Damage to Artwork, and Light Intensity of Multi-Primary LEDs for Museums

Department of Architectural Engineering, Pennsylvania State University, University Park, PA 16802, USA
Heritage 2021, 4(1), 188-197; https://doi.org/10.3390/heritage4010011
Submission received: 30 December 2020 / Revised: 10 January 2021 / Accepted: 15 January 2021 / Published: 17 January 2021
(This article belongs to the Special Issue Optical Technologies Applied to Cultural Heritage)

Abstract

:
Light causes damage when it is absorbed by sensitive artwork, such as oil paintings. However, light is needed to initiate vision and display artwork. The dilemma between visibility and damage, coupled with the inverse relationship between color quality and energy efficiency, poses a challenge for curators, conservators, and lighting designers in identifying optimal light sources. Multi-primary LEDs can provide great flexibility in terms of color quality, damage reduction, and energy efficiency for artwork illumination. However, there are no established metrics that quantify the output variability or highlight the trade-offs between different metrics. Here, various metrics related to museum lighting (damage, the color quality of paintings, illuminance, luminous efficacy of radiation) are analyzed using a voxelated 3-D volume. The continuous data in each dimension of the 3-D volume are converted to discrete data by identifying a significant minimum value (unit voxel). Resulting discretized 3-D volumes display the trade-offs between selected measures. It is possible to quantify the volume of the graph by summing unique voxels, which enables comparison of the performance of different light sources. The proposed representation model can be used for individual pigments or paintings with numerous pigments. The proposed method can be the foundation of a damage appearance model (DAM).

Graphical Abstract

1. Introduction

Optical radiation is electromagnetic energy that dissipates through space. Light, the visible part of optical radiation, upon reaching the surface of an object is either reflected, transmitted (if the object is transparent or translucent), or absorbed. Reflected light initiates vision when it is detected by the human visual system. Light absorbed by the object turns into heat and is considered wasted for illumination purposes. The absorbed light (energy) may cause a chemical change in the molecules due to photochemical reactions, and if the object is light-sensitive, such as a painting, it may cause irreversible damage (e.g., color fading) [1,2]. The dilemma between visibility and damage is a crucial aspect of lighting design for museums and galleries.
Characterizing the properties of the absorbed light can enable estimating and preventing further damage to sensitive works of art. Past studies suggest that there are four primary parameters that influence the optical damage to artwork: light intensity, exposure duration, spectral power distribution (SPD) of the light source, and spectral sensitivity of light sources [2,3]. An increase in light intensity and exposure duration increases damage to artwork, although the relationship is likely not linear. The spectral power distribution and spectral sensitivity of the pigments interact in a more complex manner.
Early models of damage were based on the Einstein–Planck law, which states that energy in lower wavelengths (i.e., ultraviolet radiation) may cause more damage than energy in longer wavelengths [4]. However, several research studies showed that energy in long wavelengths, such as infrared radiation, and energy in the visible spectrum could also cause damage to artwork [5,6,7,8]. Another important factor is the selective influence of light source SPD on the magnitude of damage. Studies suggest that the spectral absorption of pigments may dictate the amount of damage to an artwork since only the light absorbed by a pigment causes photochemical action [9,10,11,12]. This understanding, coupled with the overall effect of lighting intensity, encouraged researchers to use spectral optimization algorithms to reduce damage caused by lighting [13,14,15,16,17,18,19]. Some of these optimization studies even considered the energy consumed by lighting to balance the end-users’ different needs [14,16,18,19]. Despite the increase in computational power and knowledge of materials’ response to light, there is still no universal damage model that can account for different types of pigments. Another unresolved issue is the holistic presentation of the trade-offs and complex relationships between the parameters, such as damage to artwork, the color appearance of the painting, illumination levels (both for damage and visibility), and energy consumption.
Although multi-primary LED (mpLED) systems can be optimized to generate tailor-made solutions for light-sensitive artwork, quantifying the complex relationships between target parameters using a single-dimensional model is not possible. Fortunately, the complex relationships between different aspects can be presented using a 3-D graph, and discretizing each continuous dimension of the graph (voxelating) can result in a discrete, measurable volume. The voxelization method has been previously applied to color rendition variability in mpLEDs [20]. Here, the voxelization method is applied to display the trade-offs between damage, the color appearance of artwork, illumination levels, and energy efficiency. The voxelization method is based on the idea that a large distribution of data points can be grouped into discrete packages or cubes called voxels, as shown in Figure 1. Converting a large dataset to voxels results in increased interpretability of the data, reduces visual cluster, and enables creating predictive models. The data points within each voxel are considered the “same” for classification purposes, and the “sameness” (uniqueness) of the data points within a voxel can be defined by identifying the borders of the voxel in each dimension. The voxelization in the context of museum lighting should contain the primary goals of illuminating artwork, such as preventing damage caused by lighting, optimizing the appearance of artwork (brightness and color), and improving the efficiency of the light sources.

2. Methods

Three-dimensional graphs are widely used in science communication to demonstrate the relationship between conflicting parameters. The proposed voxelization method goes a step further by discretizing the continuous data of each dimension to create unit voxels (analogous to pixels in 3-D shapes). The size of a voxel can be defined by identifying the acceptability or detectability of the minimum value for each dimension. The minimum identifiable value is often characterized as a just-noticeable difference (JND) in psychophysical studies. It is also possible to convert continuous data to discrete data by selecting arbitrary unit sizes when a JND cannot be identified. Once the dimensions of a unit voxel are identified, they can be plotted in a 3-D graph, as shown in Figure 1.
Key dimensions of the proposed demonstration method for museum studies are damage, light intensity, color quality, and energy efficiency. Damage to artwork can be quantified using the Berlin model [3] or the amount of light absorbed by the painting [19]. In the Berlin model, the damage caused by optical radiation is calculated as a function of effective radiant irradiance.
E d m = λ E e , λ × s ( λ ) d m , r e l × d λ
where Edm (unit: W/m2) is the effective irradiance that causes damage, Ee,λ is the spectral irradiance (unit: W/m2), s(λ)dm,rel is the relative spectral responsivity of a material normalized at 300 nm, so that s(λ)dm,rel = 1.0 for λ = 300 nm, and λ is wavelength (unit: nm) [3]. The alternative damage calculation method is the ratio of the light absorbed by the surfaces under a test light source to the light absorbed by the surfaces under a reference illuminant
A = λ E e , λ , t e s t ( λ ) × ( 1 R ( λ ) ) × d λ λ E e , λ , r e f ( λ ) × ( 1 R ( λ ) ) × d λ
where A is a unitless relative absorption value reported as a percentage, Ee,λ,test(λ) is the test light source irradiance, Ee,λ,ref(λ) is the reference source irradiance, and R(λ) is the reflectance factor of a pigment. The test light source Ee,λ,test(λ) should be rescaled so that the light reflected from the painting under the test and reference light sources are equal. Equalizing the reflected light from the painting under the test and reference light source ensures the luminance is the same in both conditions so that the comparison is not affected by luminance related color appearance phenomena, such as the Hunt Effect [21] and Bezold–Brücke hue shift [22].
Both the Berlin Model and relative absorption calculation method account for the Grotthuss–Draper law, which states that only light that is absorbed can cause photochemical activation. The difference between the two methods is that the relative absorption A offers an easy-to-interpret measure for damage, but it does not account for the Planck–Einstein relation (lower wavelength radiation has higher energy potential). On the other hand, the Berlin Model uses a damage curve (action spectra) normalized to 300 nm, which may undermine the Grotthuss–Draper law and can be hard to interpret.
In the proposed voxelization method, the light intensity can also be quantified by using appropriate metrics, such as illuminance (unit: lx) or irradiance (unit: W/m2). Although illuminance is relevant for the human visual system, irradiance can be used to account for the difference between spectral sensitivity of the materials and the spectral luminous efficiency function (visual system’s response to light). The color quality of the painting can be quantified using colorimetric tools, such as color rendition metrics, or more precise tools, such as color difference, chroma, and hue shift formulae. Color shift formulae can provide detailed and specific information about the magnitude and direction of color shifts between two lighting conditions. In the following voxelization example, the two lighting conditions will be a reference white illuminant (i.e., daylight and incandescent lamps are considered ideal in museums for color quality purposes) and a test light source (SPDs generated by a mpLED).
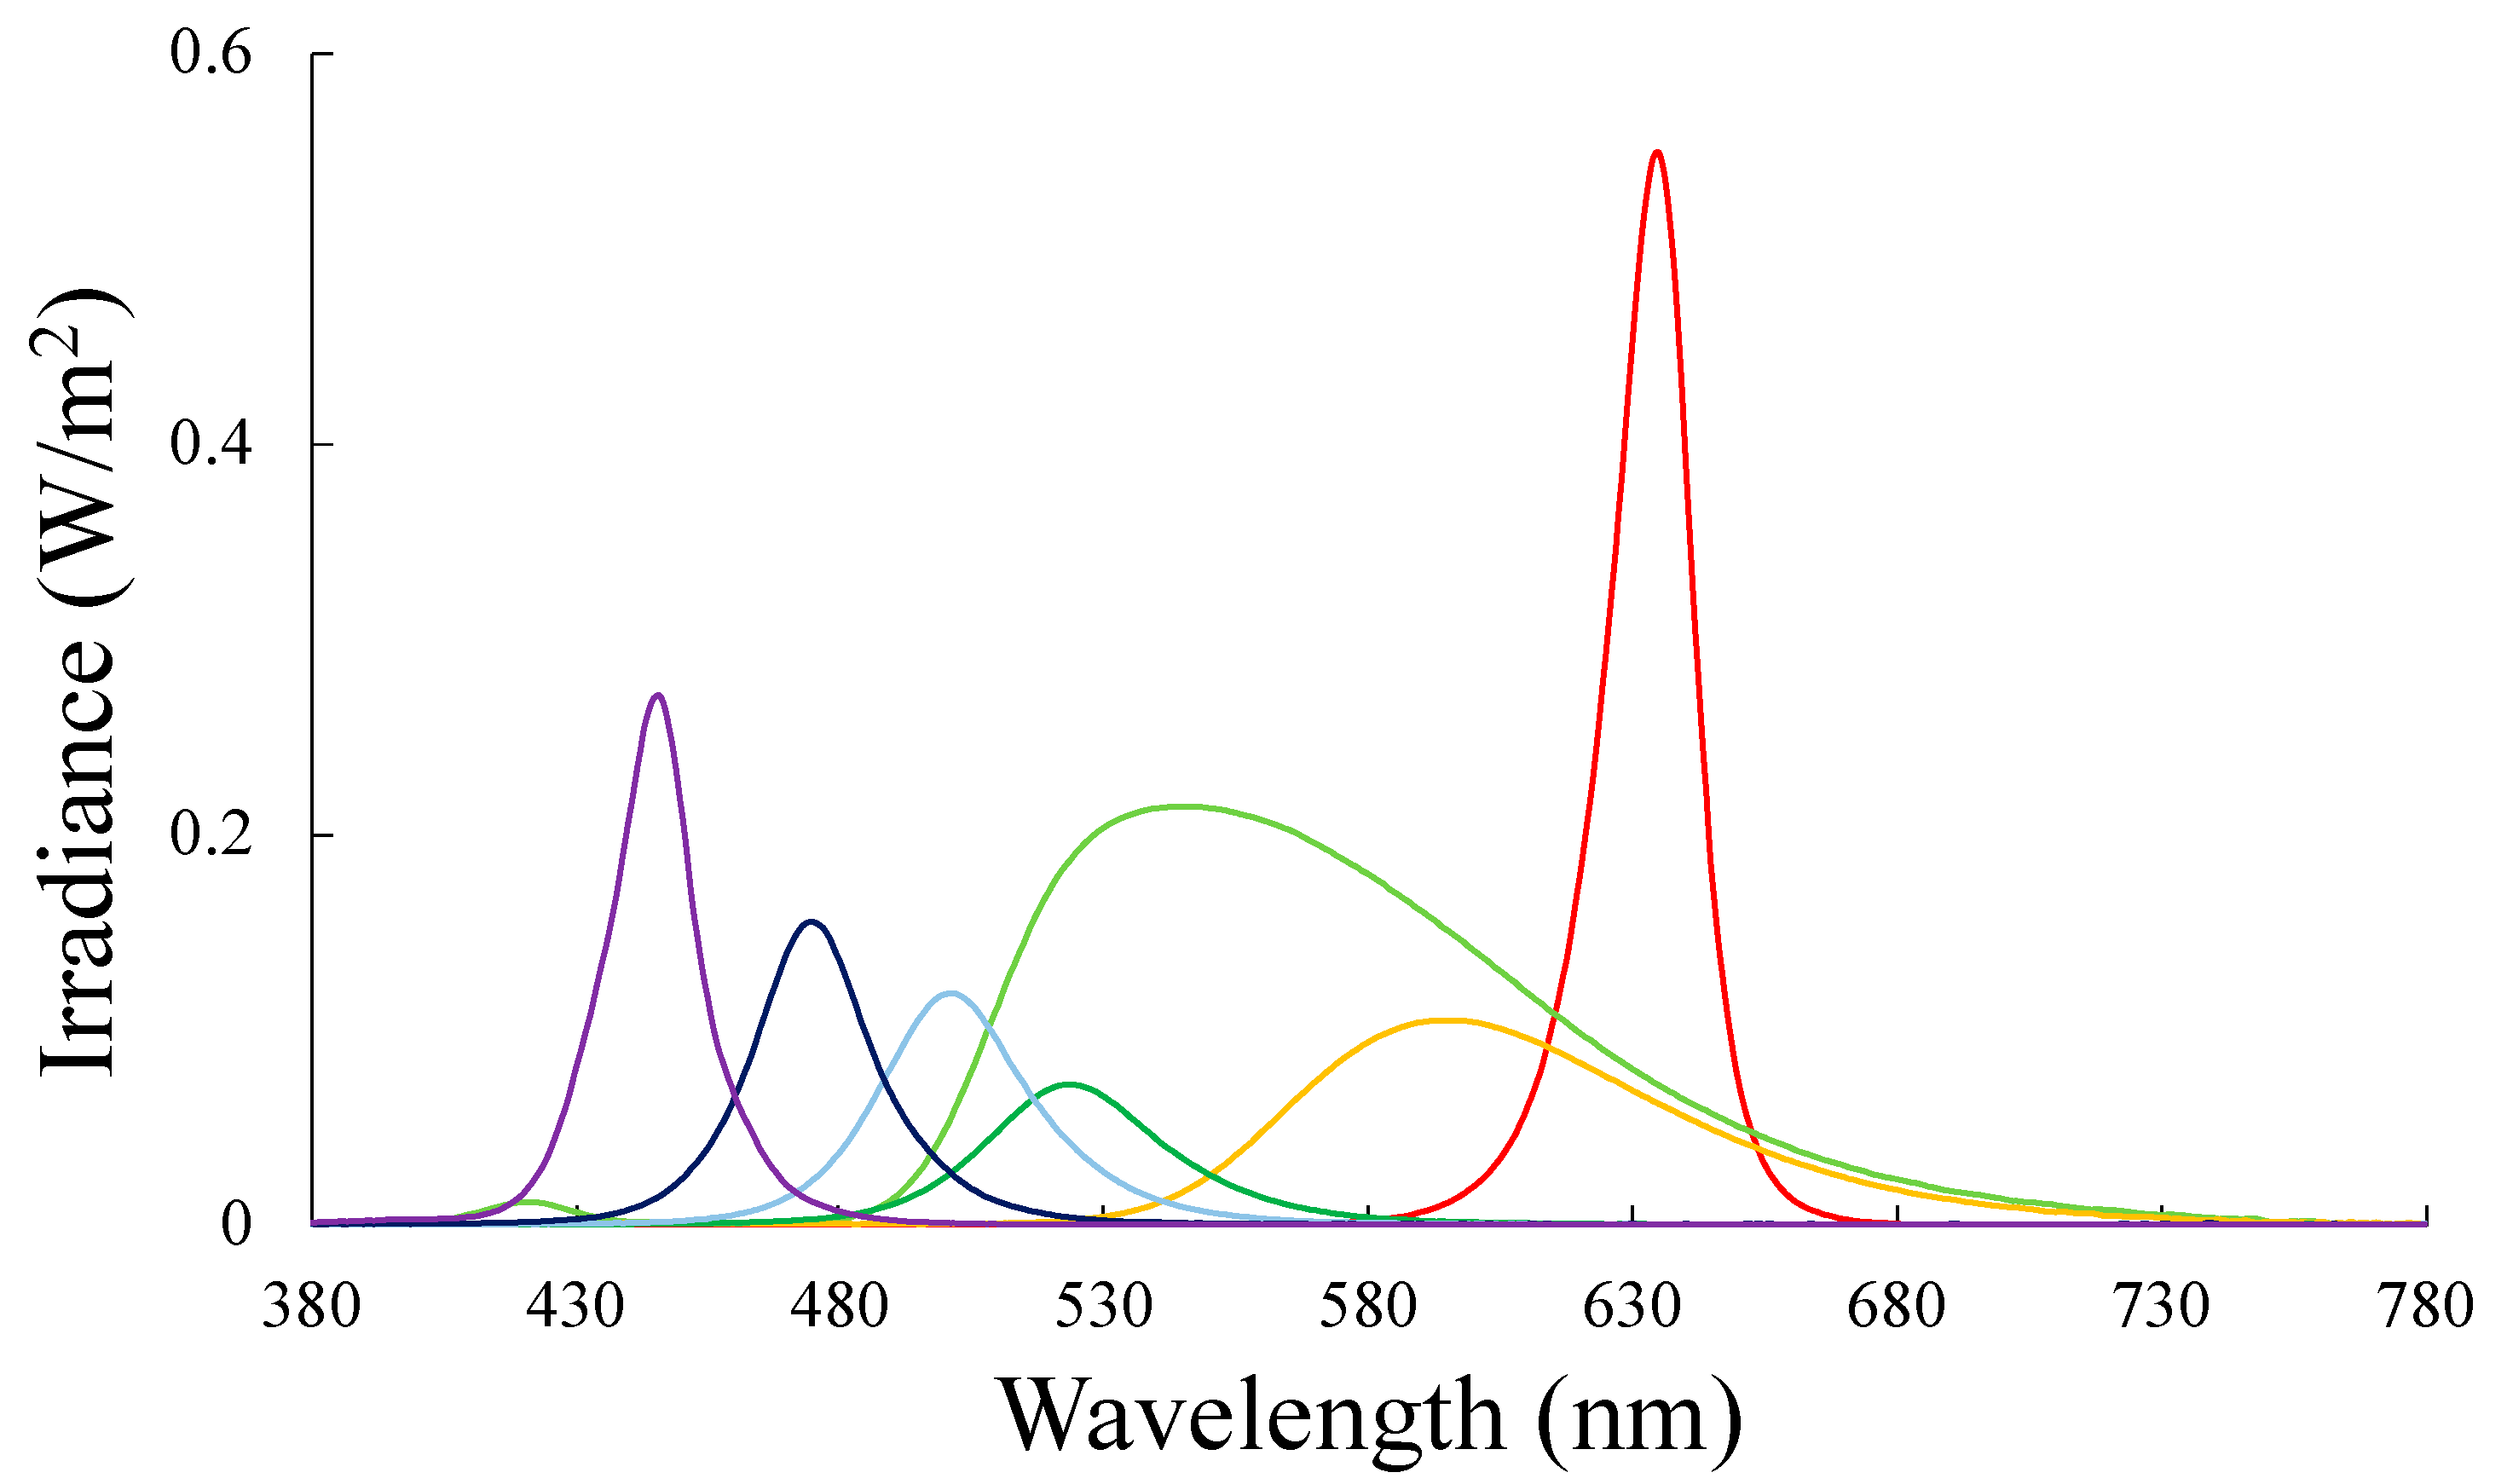
Test SPDs were generated by the linear optimization of a seven-channel mpLED lighting system. The spectrum of each channel, shown in Figure 2, were combined by iteratively mixing each channel at 20% dimming intervals, resulting in 279,936 (67) test SPD combinations. The color differences in the appearance of 24 Macbeth ColorChecker test samples [23] between each test SPD combination and reference incandescent halogen light source were calculated using CAM02-UCS [24]. The root mean square (RMS) of the 24 color difference values (ΔERMS) were calculated to get an average score of the color shifts.
An incandescent halogen light source spectrum was used as a reference since they are still widely used in museums [25]. Macbeth ColorChecker samples include a range of saturated, desaturated, chromatic, and achromatic samples, which can be representative of a wide range of artwork, and it is widely used in color and museum lighting research [26,27]. The color quality of every nominal white light was quantified using an ANSI/IES TM-30 fidelity index Rf, a gamut index Rg, and a local chroma shift in hue bin 1 (Rcs,h1) [28]. In addition, relative absorption A (light absorbed by a pigment under the test light source divided by the light absorbed by a pigment under the reference halogen light source), illuminance (Ev), irradiance (Ee), the luminous efficacy of radiation (LER), correlation color temperature (CCT), and the distance from the Planckian locus (Duv) [29] were calculated for each test SPD.

3. Results

The data generated by the linear optimization method have been sorted and analyzed for metric correlation. Since most of the LED combinations (236,502 out of 279,936) were not nominally white, color quality metrics that require a test light source to be close to the Planckian locus (i.e., Rf, Rg, CCT, Duv) were not used in the analysis. However, it is possible to filter out the non-white SPD combinations to utilize color quality metrics that are developed for white lights, with a caveat of reduced damage reduction for individual pigments.
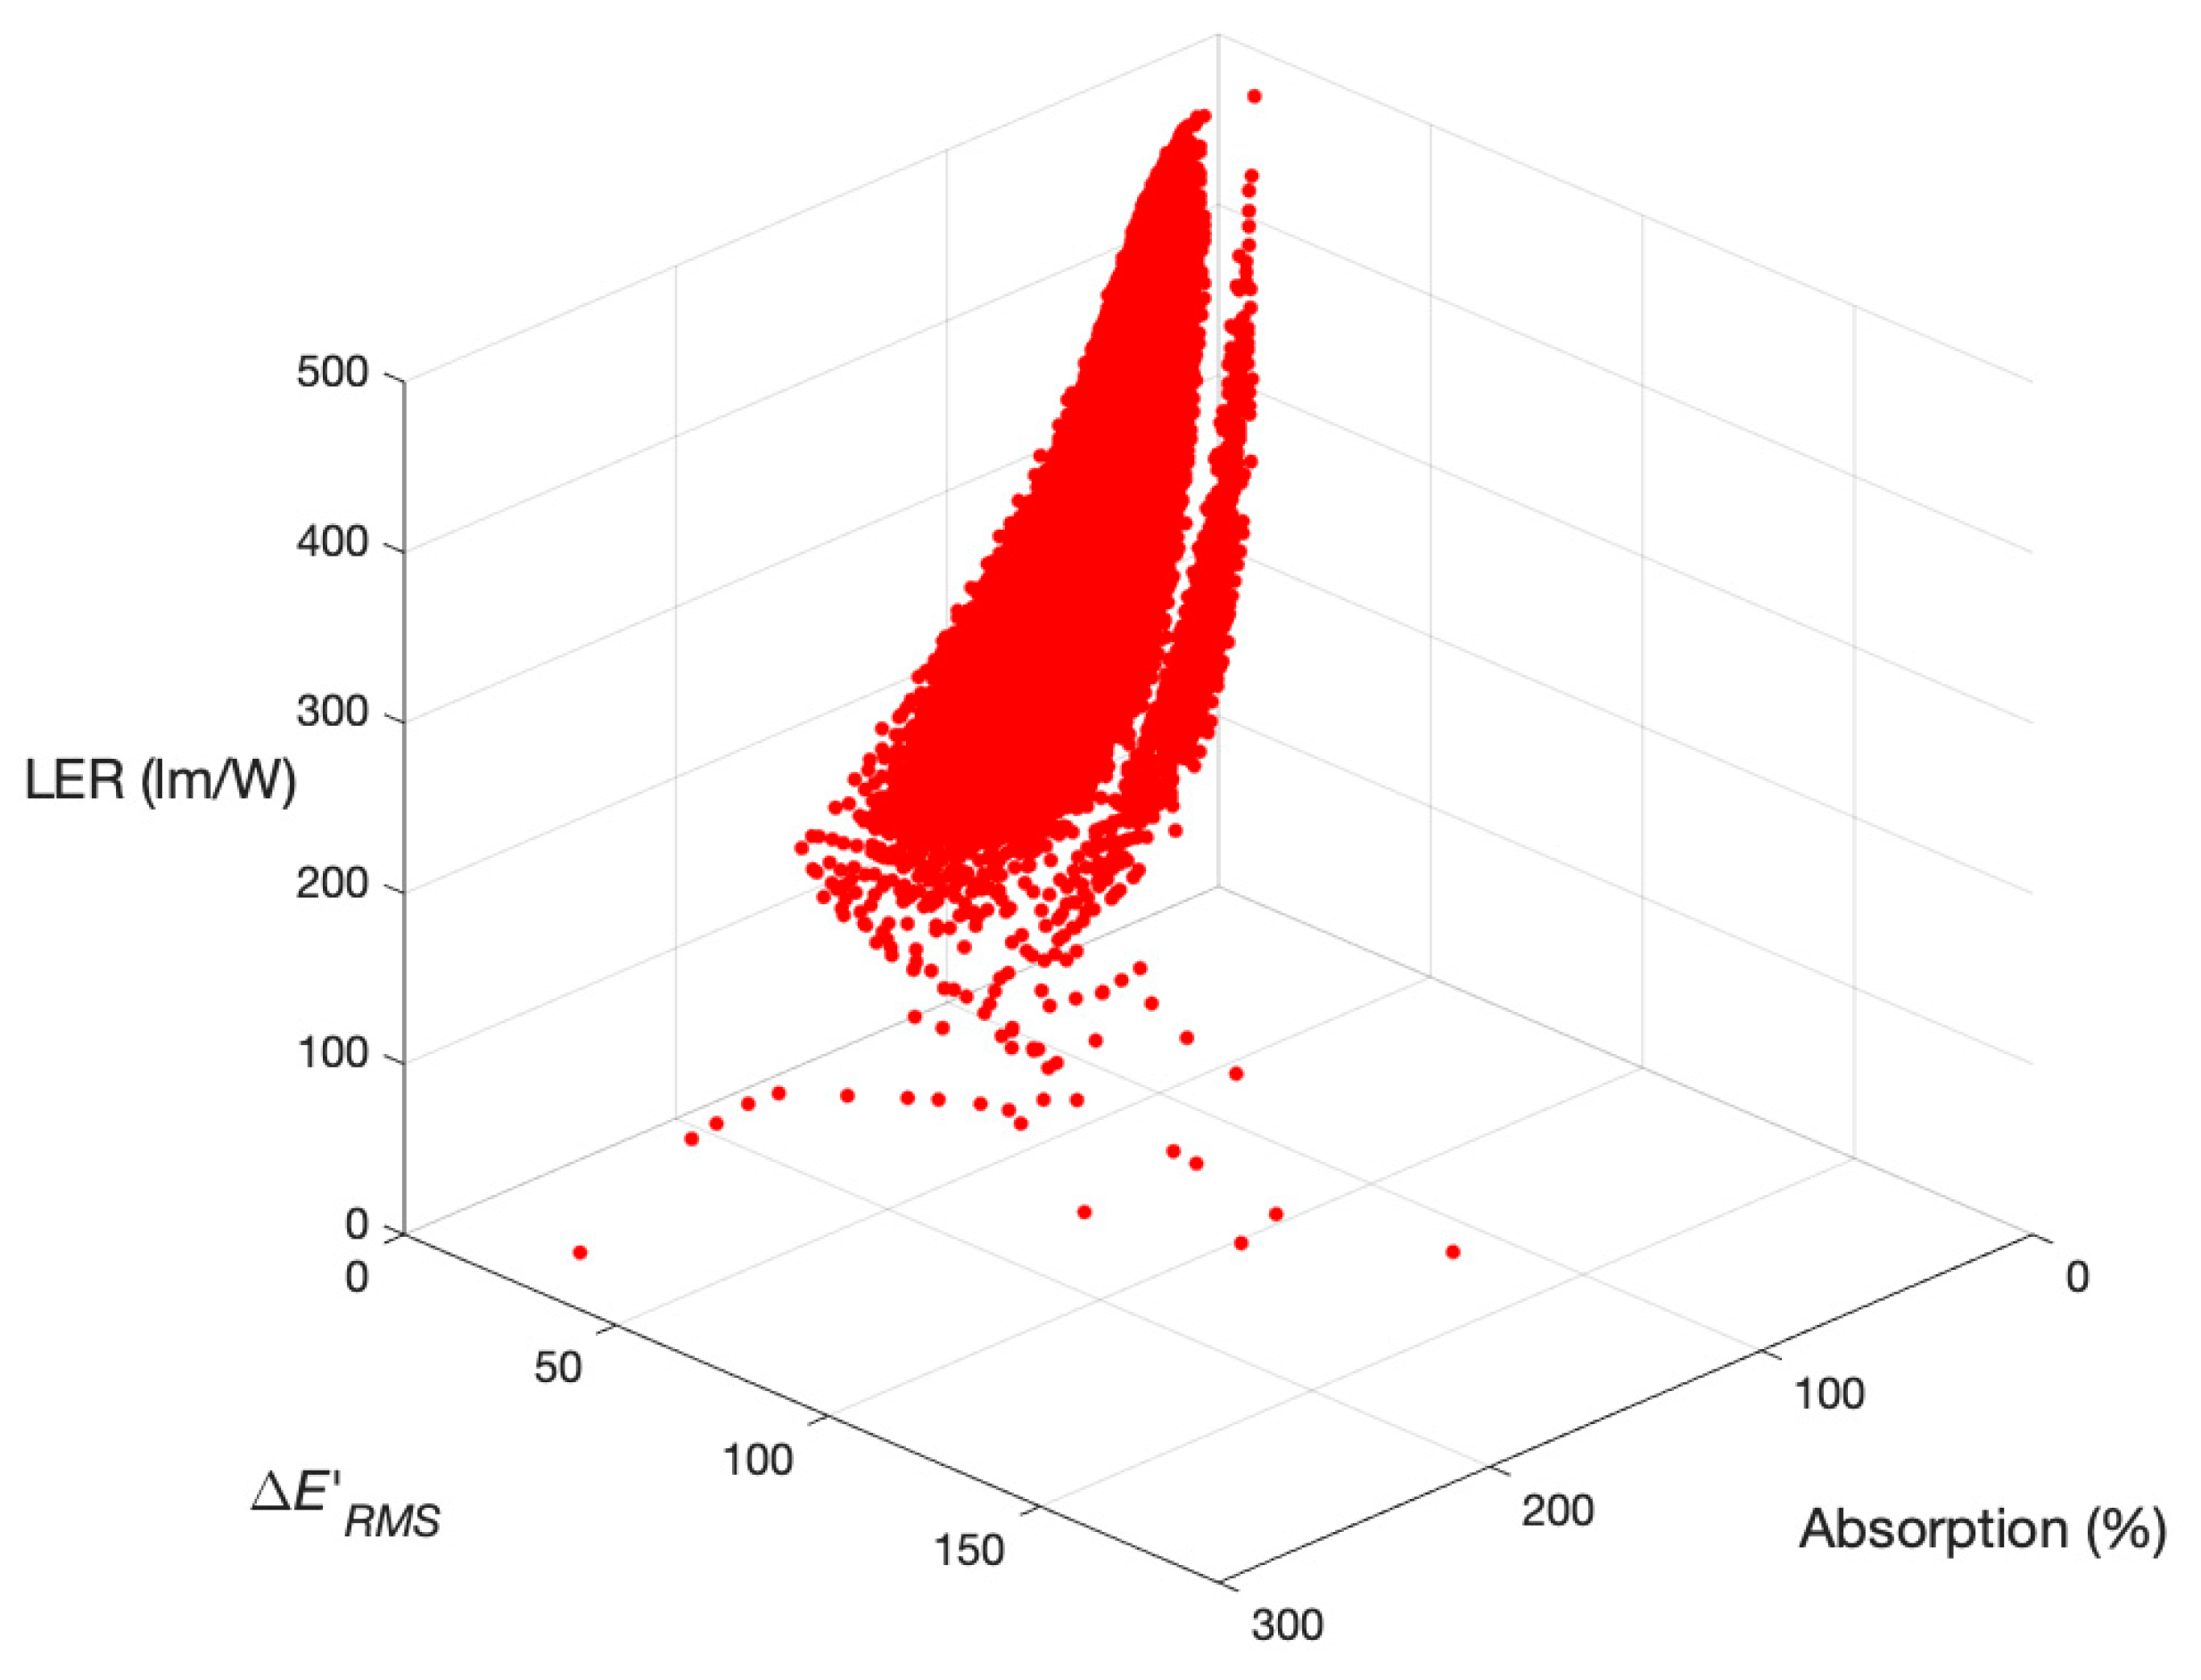
The data generated by the optimization method were voxelated using the most important measures for museum lighting: damage to artwork, color appearance, and energy efficiency. For example, a 3-D voxelated volume (VV1) was calculated using the relative absorption for a test color sample (Macbeth ColorChecker sample #24), the RMS color difference of 24 Macbeth ColorChecker samples ΔERMS, and the LER, as shown in Figure 3. Measures in each dimension were discretized by rounding values to a unit size of 1 (e.g., LER of 200.3 lm/W and 200.7 lm/W were rounded to 200 lm/W and 201 lm/W, respectively, and they fell into two different voxels). All the test SPD combinations that fell into the same voxel were considered identical. Therefore, the number of unique voxels (VV1 = 45,813) represents the number of unique SPD combinations that can be generated within the seven-channel mpLEDs. It is important to note that the uniqueness of each voxel depends on the voxel size criteria. For example, if the LER was voxelated using 5 lm/W as the unit voxel size, the number of voxels would drastically decrease. Therefore, the absolute magnitude of the volume does not have an inherent meaning.
The data departed from normality at the 0.05 significance level as tested by the Shapiro–Wilk test, and a non-parametric test (Spearman’s rank correlation coefficient) was used to analyze the correlation between the dimensions of the voxelated VV1 volume. While the correlation between absorption A and ΔERMS were low (ρ = 0.111), the LER was inversely correlated to absorption (ρ = −0.757) and ΔERMS (ρ = −0.427).
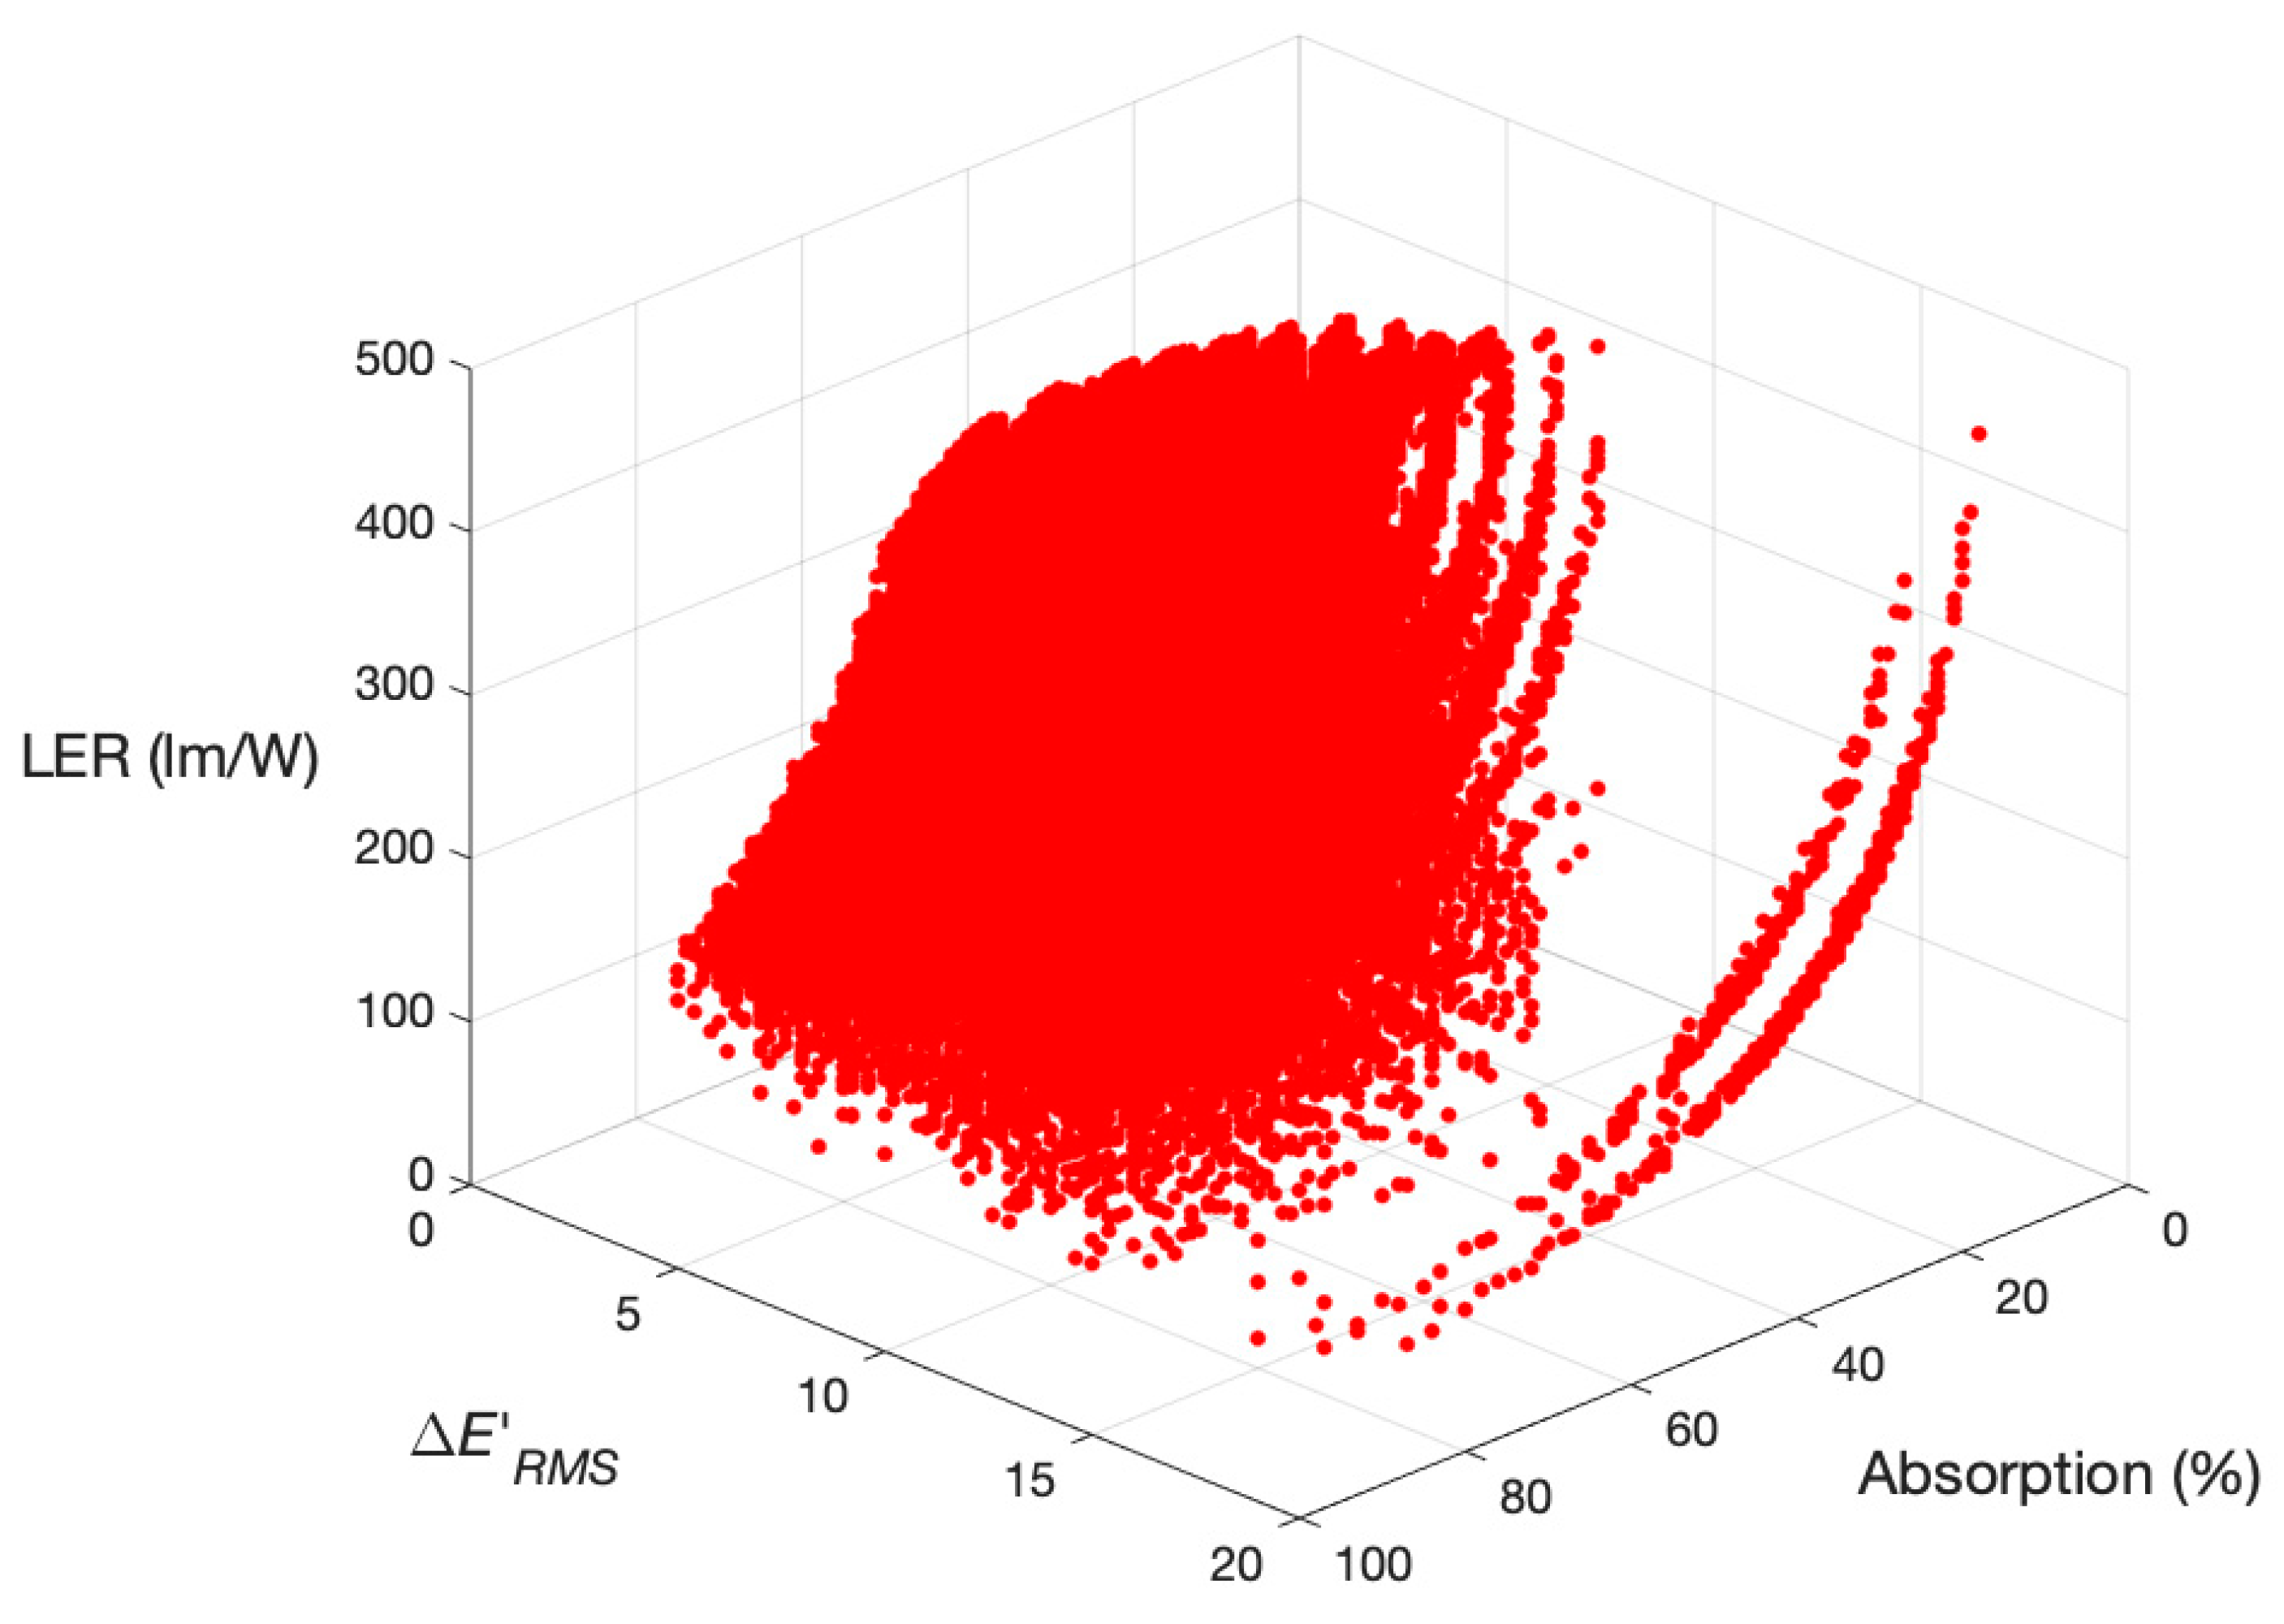
Figure 3 illustrates the relationship between color quality, damage, and energy efficiency, where the top far corner is the ideal condition (low absorption, small color shifts, and high efficacy). The visual illustration makes it clear that the ideal SPDs are increasingly scarce compared to other SPDs that perform worse in terms of either damage, color shifts, or energy efficiency. Since the relative absorption A > 100 denotes additional damage, and the large color differences are not desired, it is possible to zoom into the graph by limiting the x and y axes (relative absorption (A < 100) and color difference (ΔERMS < 20), respectively), as shown in Figure 4.
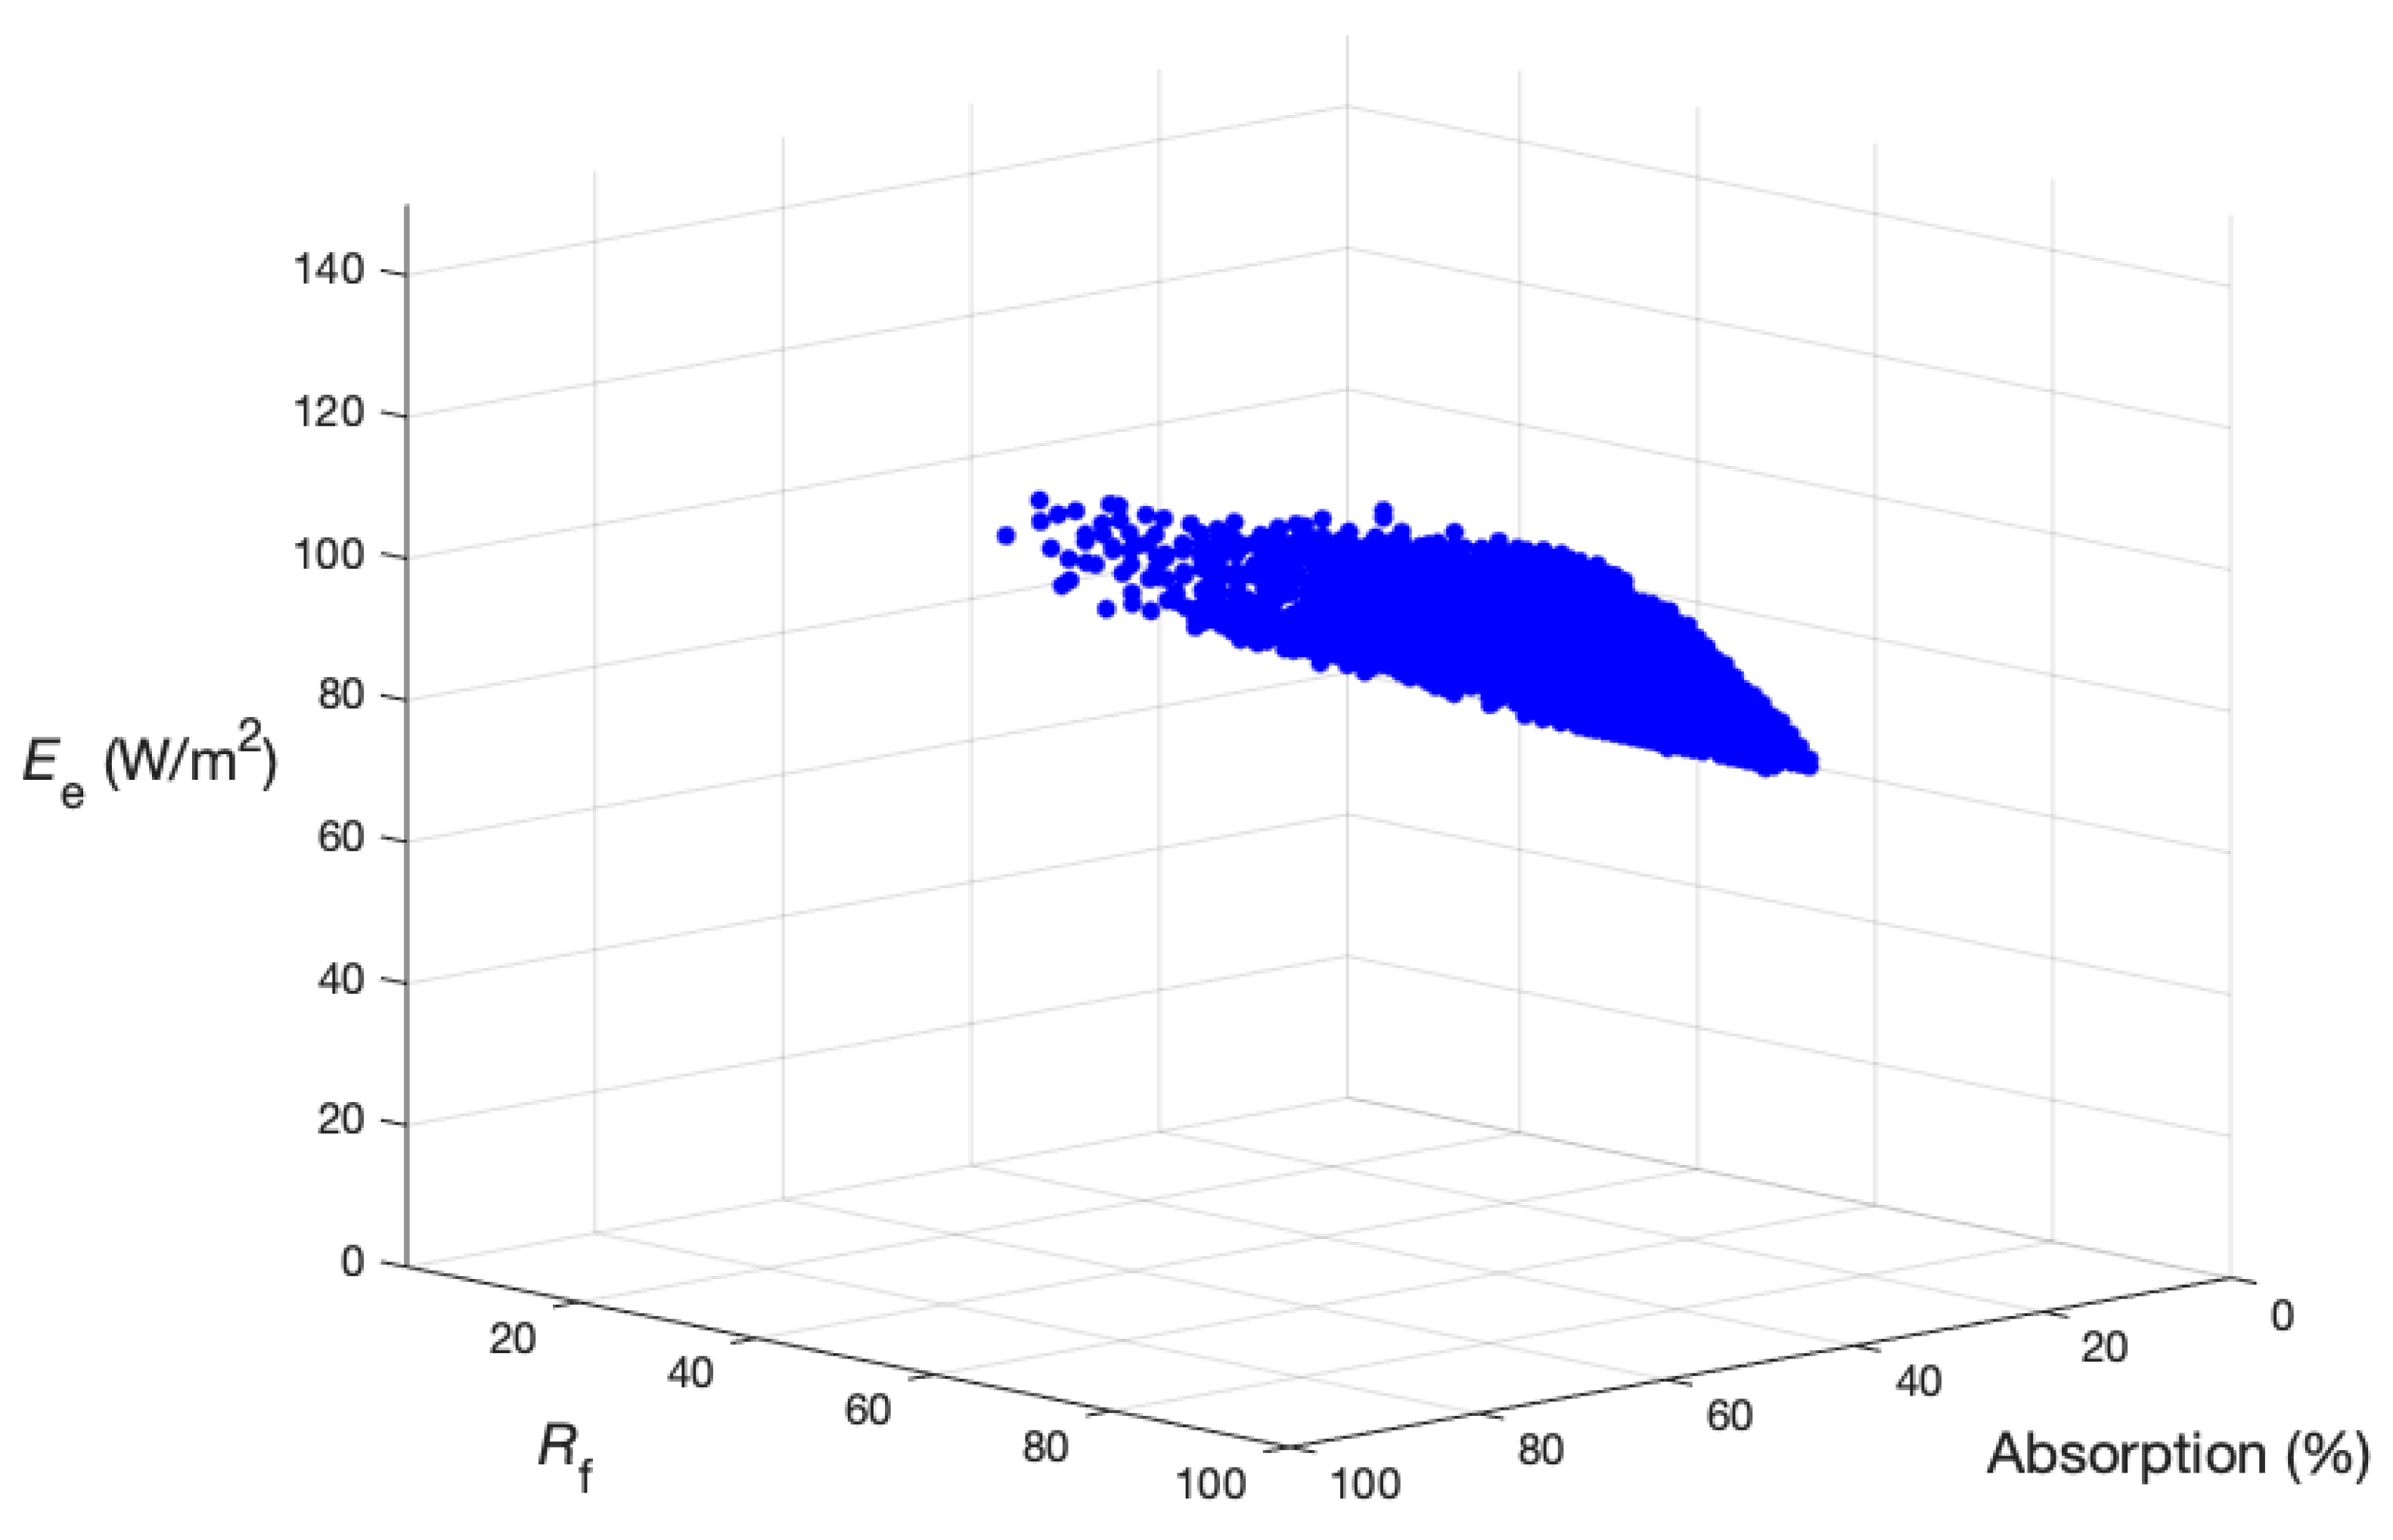
A second example (VV2) was calculated using relative absorption A for a test color sample (Macbeth ColorChecker sample #24), the TM-30 fidelity index Rf, and the irradiance Ee, as shown in Figure 5. In the second volume, which is the graphical representation of the same data, there were VV2 = 2,265 unique voxels. While the absolute volume size does not have an inherent meaning, comparing two or more light sources—using identical voxel dimension metrics—can provide more information about the performance of the light sources for a specific set of pigments (or the overall color quality of a painting).
Voxelated 3-D volume VV2 also shows the relationship between competing target parameters. The fidelity index Rf was not correlated with either relative absorption A (ρ = 0.010) or irradiance Ee (ρ = 0.017). However, irradiance Ee and relative absorption A were highly correlated (ρ = 0.996), which is not surprising since absorption increases with light intensity.
It should be noted that the graphical distributions were applied to a single pigment using relative absorption and to multi-pigments (e.g., a painting with numerous colors) using color quality metrics to demonstrate the different use cases of the proposed method. The proposed model can provide a more analogous analysis if all the dimensions are chosen at the individual pigment scale (e.g., absorption for a single color and color difference in the pigment under reference and test light sources). On the other hand, the proposed model can also be used to gain a holistic understanding of a painting by using a high-level approach (e.g., average absorption ratio by the pigments used in a painting, the average color difference of pigments in the painting under reference and test light sources). While the provided examples do not include the exposure time—an important dimension of damage to artwork—it is possible to incorporate the total radiant exposure as a metric to the voxelization method. The total exposure can be calculated by multiplying exposure time t (unit: hr) with irradiance (Ee × t, unit: W h/m2) or illuminance (Ev × t, unit: lx h). Alternatively, the radiant exposure can be quantified using the Berlin model (Hdm, unit: W h/m2) [3].

4. Discussion

The proposed voxelization method can help analyze and compare the performance of multi-primary LED systems. Since each SPD is represented as a single dot in a 3-D graph, the proposed method cannot be used to analyze a single static SPD light source. However, it is possible to analyze large datasets that include commercially available light sources in the proposed 3-D volume. Such large datasets can provide museum curators, conservators, and lighting designers with an opportunity to compare the performance of different lighting technologies. Large datasets of different lighting technologies can also be used to analyze a set of reference test samples collected in a museum or a painting (similar to the color rendition approach) to attain an approximate idea of the performance in a given space. The caveat in such an approach would be the consideration of object surface reflectance characteristics since it may be challenging to identify the action spectra of the pigments and dyes in every painting in a museum or a gallery.
Non-invasive scanning techniques, such as Fourier-transform infrared spectroscopy (FTIR), X-ray fluorescence (XRF), Raman imaging, hyperspectral imaging, scanning electron microscopy (SEM), and energy-dispersive X-ray spectroscopy (EDS) [30,31,32] are often used to obtain absorption spectra from materials. The analysis of organic and inorganic pigments can also lead to new horizons in tailor-made museum lighting. In the future, it may be possible to build a library of pigment and dye characteristics and their response to light spectra, which may ultimately lead to a universal damage calculation model.
Despite the challenges of facing a universal damage model today, studies investigating the sensitivity of different materials [33,34,35,36,37,38,39,40] can converge into a complex damage appearance model (DAM), similar to color appearance models (CAMs). Although the CIE 1976 L*a*b* (CIELAB) is the most widely used color space in conservation science, the proposed damage model is based on the CAM concept due to the multi-layered nature and better performance of CAMs. The CIELAB has well-documented limitations, such as abnormal hue angle shifts [41,42], poor performance in the [43], and blue regions (negative b* axis) [44]. Research suggests that color appearance models, such as CAM02-UCS [24], can outperform CIELAB, especially when color differences are small—which are crucial for conservation science [45,46]. In addition, conservation scientists often perform visual observations of the artwork under controlled environmental conditions (e.g., laboratory). Therefore, the additional input parameters required by CAMs (i.e., background and surround conditions, adapting luminance) can be accurately determined by the users. In short, the CAM provides a better basis both conceptually and mathematically for the proposed damage calculation models compared to a color space, such as CIELAB.
A DAM can have several inputs, such as light source spectrum, light intensity, exposure duration, pigment spectral reflectance/absorption, artwork type (e.g., oil, gauche, acrylic paint), and choice of a reference illuminant (i.e., daylight, incandescent). DAM would provide an output of damage caused by lighting and the color appearance of the resulting pigment under a specific light source, as shown in Figure 6. It should also be noted that color difference formulae are often used in conservation science as a proxy for damage, as illustrated by fading. However, not all types of chemical and structural damage are caused by lighting [47]. For example, viscometry and chromatography are used to measure the brittle effect (the breakdown of paper fibers) [48].
Although a rudimentary DAM can provide an estimation of damage to a single material at a given time, more advanced models can be built by integrating the results across different pigments and dyes (e.g., providing averages with standard deviation and error estimates, using multi-dimensional data analysis or machine learning algorithms). More complex DAMs can be used in adaptive lighting systems, where a sensor detects the spectral reflectance function of paintings, and a projection system emits spectrally and spatially optimized lighting to each colored part of the painting to reduce damage while maintaining the overall color quality of the painting, or even visually restore the faded colors of the artwork [18,49,50,51].

5. Conclusions

Museum conservators and curators often face the multi-faceted problem of identifying the optimal lighting conditions in museums. While light is needed to display art, it may also damage sensitive artwork over time. Museum conservators, curators, and lighting designers can use the properties of light sources (spectral distribution, intensity, and exposure duration) and materials (spectral absorption characteristics) to estimate the damage caused by optical radiation. Here, a three-dimensional representation of the conflicting parameters (e.g., color quality vs. damage) is provided to display the trade-offs between several measures. The continuous scale of each dimension of the 3-D graph is converted to discrete data using unit voxels. The discretization of continuous data can enable the quantification of the performance of multi-primary LEDs in the context of art conservation. Sample calculations demonstrated the use of the proposed method to highlight the most common trade-offs in museum lighting design: conflicts between the color quality of paintings (average color difference), damage caused by lighting (absorption percentage), illuminance, and luminous efficacy of the radiation. However, it is possible to adopt different metrics for each dimension, such as color discrimination or other color rendition metrics for color quality, the Berlin model [3] and irradiance for damage quantification, and CCT and Duv for color quality of the light source. In addition, new metrics that are relevant for museum lighting and perception of artwork (e.g., visual clarity [52,53] and visual complexity [54]) can be utilized in the proposed 3-D volume. Future work will investigate the quantification of the trade-offs between various damage, color quality, and visual perception metrics and validate their accuracy through visual evaluations.

Funding

This research received no external funding.

Institutional Review Board Statement

Not applicable.

Informed Consent Statement

Not applicable.

Data Availability Statement

The data that support the findings of this study are available from the corresponding author upon reasonable request.

Conflicts of Interest

The author declares no conflict of interest.

References

  1. Schaeffer, T.T. Effects of Light on Materials in Collections: Data on Photoflash and Related Sources; Getty Publications: Los Angeles, CA, USA, 2001. [Google Scholar]
  2. Cuttle, C. Damage to museum objects due to light exposure. Light. Res. Technol. 1996, 28, 1–9. [Google Scholar] [CrossRef]
  3. CIE. 157:2004 Control of Damage to Museum Objects by Optical Radiation; CIE: Vienna, Austria, 2004. [Google Scholar]
  4. Harrison, L.S. Report on the Deteriorating Effects of Modern Light Sources; Metropolitan Museum of Art: New York, NY, USA, 1953. [Google Scholar]
  5. Feller, R.L. Control of deteriorating effects of light on museum objects: Heating effects of illumination by incandescent lamps. Mus. News 1968, 46, 39–47. [Google Scholar]
  6. Beek, H.V.; Heertjes, P.M. Fading by light of organic dyes on textiles and other materials. Stud. Conserv. 1966, 11, 123–132. [Google Scholar] [CrossRef]
  7. Michalski, S. Time’s Effects on Paintings. In Shared Responsibility; National Gallery of Canada: Ottowa, ON, Canada, 1990; pp. 39–52. [Google Scholar]
  8. Gupta, D.; Gulrajani, M.L.; Kumari, S. Light fastness of naturally occurring anthraquinone dyes on nylon. Color Technol. 2004, 120, 205–212. [Google Scholar] [CrossRef]
  9. Saunders, D.; Kirby, J. Wavelength-dependent fading of artists’ pigments. Stud. Conserv. 1994, 39, 190–194. [Google Scholar] [CrossRef]
  10. Nakagoshi, K.; Yoshizumi, K. Degradation of Japanese Lacquer under Wavelength Sensitivity of Light Radiation. Mater. Sci. Appl. 2011, 2, 1507–1515. [Google Scholar] [CrossRef] [Green Version]
  11. Lerwill, A.; Brookes, A.; Townsend, J.H.; Hackney, S.; Liang, H. Micro-fading spectrometry: Investigating the wavelength specificity of fading. Appl. Phys. A 2014, 118, 457–463. [Google Scholar] [CrossRef] [Green Version]
  12. Villmann, B.; Weickhardt, C. Wavelength Dependence of Light Induced Changes in Reflectance Spectra of Selected Dyes and Pigments. Stud. Conserv. 2017, 63, 104–112. [Google Scholar] [CrossRef]
  13. Scuello, M.; Abramov, I.; Gordon, J.; Weintraub, S. Museum lighting: Optimizing the illuminant. Color Res. Appl. 2004, 29, 121–127. [Google Scholar] [CrossRef]
  14. Abdalla, D.; Duis, A.; Durmus, D.; Davis, W. Customisation of light source spectrum to minimise light absorbed by artwork. In Proceedings of the CIE Lighting Quality Energy Efficiency, Melbourne, Australia, 7–9 March 2016; pp. 22–31. [Google Scholar]
  15. Lunz, M.; Talgorn, E.; Baken, J.; Wagemans, W.; Veldman, D. Can LEDs help with art conservation? Impact of different light spectra on paint pigment degradation. Stud. Conserv. 2016, 62, 294–303. [Google Scholar] [CrossRef]
  16. Delgado, M.F.; Dirk, C.W.; Druzik, J.; WestFall, N. Lighting the world’s treasures: Approaches to safer museum lighting. Color Res. Appl. 2011, 36, 238–254. [Google Scholar] [CrossRef]
  17. Dang, R.; Wang, N.; Liu, G.; Yuan, Y.; Liu, J.; Tan, H. Illumination in Museums: Four-Primary White LEDs to Optimize the Protective Effect and Color Quality. IEEE Photon J. 2019, 11, 1–15. [Google Scholar] [CrossRef]
  18. Vázquez, D.; Fernández-Balbuena, A.; Canabal, H.; Muro, C.; Durmus, D.; Davis, W.; Benítez, A.J.; Mayorga, S. Energy optimization of a light projection system for buildings that virtually restores artworks. Digit. Appl. Archaeol. Cult. Herit. 2020, 16, e00128. [Google Scholar] [CrossRef]
  19. Durmus, D.; Abdalla, D.; Duis, A.; Davis, W. Spectral Optimization to Minimize Light Absorbed by Artwork. LEUKOS 2018, 16, 45–54. [Google Scholar] [CrossRef] [Green Version]
  20. Royer, M.P.; Durmus, D.; Baxter, D.J. Characterizing the color rendition performance of multi-primary LED lighting systems. In Proceeding of the IES Annual Conference, New Orleans, LA, USA, 6–8 August 2020. [Google Scholar]
  21. Hunt, R.W.G. Light and dark adaptation and the perception of color. JOSA 1952, 42, 190–199. [Google Scholar] [CrossRef]
  22. Smith, V.C.; Pokorny, J.; Cohen, J.; Perera, T. Luminance thresholds for the Bezold-Brücke hue shift. Percept. Psychophys. 1968, 3, 306–310. [Google Scholar] [CrossRef]
  23. Useful Color Data. Available online: https://www.rit.edu/cos/colorscience/rc_useful_data.php (accessed on 20 November 2020).
  24. Luo, M.R.; Li, C. CIECAM02 and Its Recent Developments. In Advanced Color Image Processing and Analysis; Springer Science and Business Media LLC: Berlin/Heidelberg, Germany, 2013; pp. 19–58. [Google Scholar]
  25. Perrin, T.E.; Druzik, J.R.; Miller, N.J. SSL Adoption by Museums: Survey Results, Analysis, and Recommendations; Office of Scientific and Technical Information (OSTI), Pacific Northwest National Laboratory: Richland, WA, USA, 2014. [Google Scholar]
  26. Durmus, D.; Davis, W. Appearance of Achromatic Colors under Optimized Light Source Spectrum. IEEE Photon J. 2018, 10, 1–11. [Google Scholar] [CrossRef]
  27. Liang, H.; Saunders, D.; Cupitt, J. A new multispectral imaging system for examining paintings. J. Imaging Sci. Technol. 2005, 49, 551–562. [Google Scholar]
  28. IES. ANSI/IES TM-30-20, IES Method for Evaluating Light Source Color Rendition; Illuminating Engineering Society: New York, NY, USA, 2020. [Google Scholar]
  29. Ohno, Y. Practical Use and Calculation of CCT and Duv. LEUKOS 2014, 10, 47–55. [Google Scholar] [CrossRef]
  30. Antunes, V.; Serrão, V.; Valadas, S.; Candeias, A.; Mirão, J.; Cardoso, A.; Manso, M.; Carvalho, M.L. A Painter in the Shadow: Unveiling Conservation, Materials and Techniques of the Unknown Luso-Flemish Master of Lourinhã. Heritage 2019, 2, 2725–2744. [Google Scholar] [CrossRef] [Green Version]
  31. Zalaffi, M.S.; Agostinelli, I.; Karimian, N.; Ugo, P. Ag-Nanostars for the Sensitive SERS Detection of Dyes in Artistic Cross-Sections—Madonna della Misericordia of the National Gallery of Parma: A Case Study. Heritage 2020, 3, 1344–1359. [Google Scholar] [CrossRef]
  32. Buse, J.; Otero, V.; Melo, M.J. New Insights into Synthetic Copper Greens: The Search for Specific Signatures by Raman and Infrared Spectroscopy for Their Characterization in Medieval Artworks. Heritage 2019, 2, 1614–1629. [Google Scholar] [CrossRef] [Green Version]
  33. Druzik, J.R. Evaluating the light sensitivity of paints in selected wall paintings at the Mogao Grottoes: Caves 217, 98, and 85. In Conservation of Ancient Sites on the Silk Road; Getty Conservation Institute: Los Angeles, CA, USA, 2010; pp. 457–463. [Google Scholar]
  34. Piccablotto, G.; Aghemo, C.; Pellegrino, A.; Iacomussi, P.; Radis, M. Study on Conservation Aspects Using LED Technology for Museum Lighting. Energy Procedia 2015, 78, 1347–1352. [Google Scholar] [CrossRef] [Green Version]
  35. Mayorga, S.; Vázquez, D.; Fernandez-Balbuena, A.A.; Muro, C.; Muñoz, J. Spectral damage model for lighted museum paintings: Oil, acrylic and gouache. J. Cult. Herit. 2016, 22, 931–939. [Google Scholar] [CrossRef] [Green Version]
  36. Farke, M.; Binetti, M.; Hahn, O. Light damage to selected organic materials in display cases: A study of different light sources. Stud. Conserv. 2016, 61, 83–93. [Google Scholar] [CrossRef] [Green Version]
  37. Degani, L.; Gulmini, M.; Piccablotto, G.; Iacomussi, P.; Gastaldi, D.; Bello, F.D.; Chiantore, O. Stability of natural dyes under light emitting diode lamps. J. Cult. Herit. 2017, 26, 12–21. [Google Scholar] [CrossRef]
  38. Luo, H.-W.; Chou, C.-J.; Chen, H.-S.; Luo, M.R. Museum lighting with LEDs: Evaluation of lighting damage to contemporary photographic materials. Light. Res. Technol. 2018, 51, 417–431. [Google Scholar] [CrossRef]
  39. Jo, S.; Ryu, S.R.; Jang, W.; Kwon, O.-S.; Rhee, B.; Lee, Y.E.; Kim, D.; Kim, J.; Shin, K. LED illumination-induced fading of traditional Korean pigments. J. Cult. Herit. 2019, 37, 129–136. [Google Scholar] [CrossRef]
  40. Dang, R.; Tan, H.; Wang, N.; Liu, G.; Zhang, F.; Song, X. Raman spectroscopy-based method for evaluating LED illumination-induced damage to pigments in high-light-sensitivity art. Appl. Opt. 2020, 59, 4599–4605. [Google Scholar] [CrossRef]
  41. Liu, Y.; Shigley, J.; Fritsch, E.; Hemphill, S. Abnormal Hue-Angle change of the gemstone tanzanite between CIE illuminants d65 and a in CIELAB color space. Color Res. Appl. 1995, 20, 245–250. [Google Scholar] [CrossRef]
  42. Durmus, D.; Davis, W. Evaluation OF Hue Shift Formulae in CIELAB and CAM02. In Proceedings of the 29th Quadrennial Session of the CIE, Washington, DC, USA, 14–22 June 2019; International Commission on Illumination: Vienna, Austria, 2019; pp. 888–895. [Google Scholar]
  43. Sharma, G.; Rodríguez-Pardo, C.E. The dark side of CIELAB. In Color Imaging XVII: Displaying, Processing, Hardcopy, and Applications; International Society for Optics and Photonics; International Society for Optics and Photonics: Burlingame, CA, USA, 2012; Volume 8292, p. 82920D. [Google Scholar]
  44. Moroney, N. A hypothesis regarding the poor blue constancy of CIELAB. Color Res. Appl. 2003, 28, 371–378. [Google Scholar] [CrossRef]
  45. Lian, Y.; Liao, N.; Wang, J.; Tan, B.; Liu, Z. Evaluating the uniformity of color spaces and performance of color difference formulae. LED Disp. Technol. 2010, 7852, 785205. [Google Scholar] [CrossRef]
  46. Shamey, R.; Cao, R.; Sawatwarakul, W.; Lin, J. Performance of various color difference models in challenging regions of CIELAB color space. In 22nd Color and Imaging Conference; Society for Imaging Science and Technology: Springfield, VA, USA, 2014; Volume 2014, pp. 200–206. [Google Scholar]
  47. Saunders, D. Museum Lighting: A Guide for Conservators and Curators; Getty Publications: Los Angeles, CA, USA, 2020. [Google Scholar]
  48. Area, M.C.; Ceradame, H. Paper aging and degradation: Recent findings and research methods. BioResources 2011, 6, 5307–5337. [Google Scholar]
  49. Durmus, D.; Davis, W. Optimising Light Source Spectrum for Object Reflectance. Light Energy Environ. 2014, 23, 456. [Google Scholar] [CrossRef]
  50. Vázquez, D.; Alvarez, A.; Canabal, H.; Garcia, A.; Mayorga, S.; Muro, C.; Galan, T. Point to point multispectral light projec-tion applied to cultural heritage. In Nonimaging Optics: Efficient Design for Illumination and Solar Concentration XIV. Int. Soc. Opt. Photonics 2017, 10379, 103790K. [Google Scholar]
  51. Gómez Manzanares, Á.; Benítez, A.J.; Martínez Antón, J.C. Virtual Restoration and Visualization Changes through Light: A Review. Heritage 2020, 3, 1373–1384. [Google Scholar] [CrossRef]
  52. Durmus, D.; Davis, W. Blur perception and visual clarity in light projection systems. Opt. Express 2019, 27, A216–A223. [Google Scholar] [CrossRef]
  53. Khanh, T.; Bodrogi, P.; Guo, X.; Phan, Q.A. Towards a user preference model for interior lighting. Part 2: Experimental results and modelling. Light. Res. Technol. 2018, 51, 1030–1043. [Google Scholar] [CrossRef]
  54. Durmus, D. Spatial Frequency and the Performance of Image-Based Visual Complexity Metrics. IEEE Access 2020, 8, 100111–100119. [Google Scholar] [CrossRef]
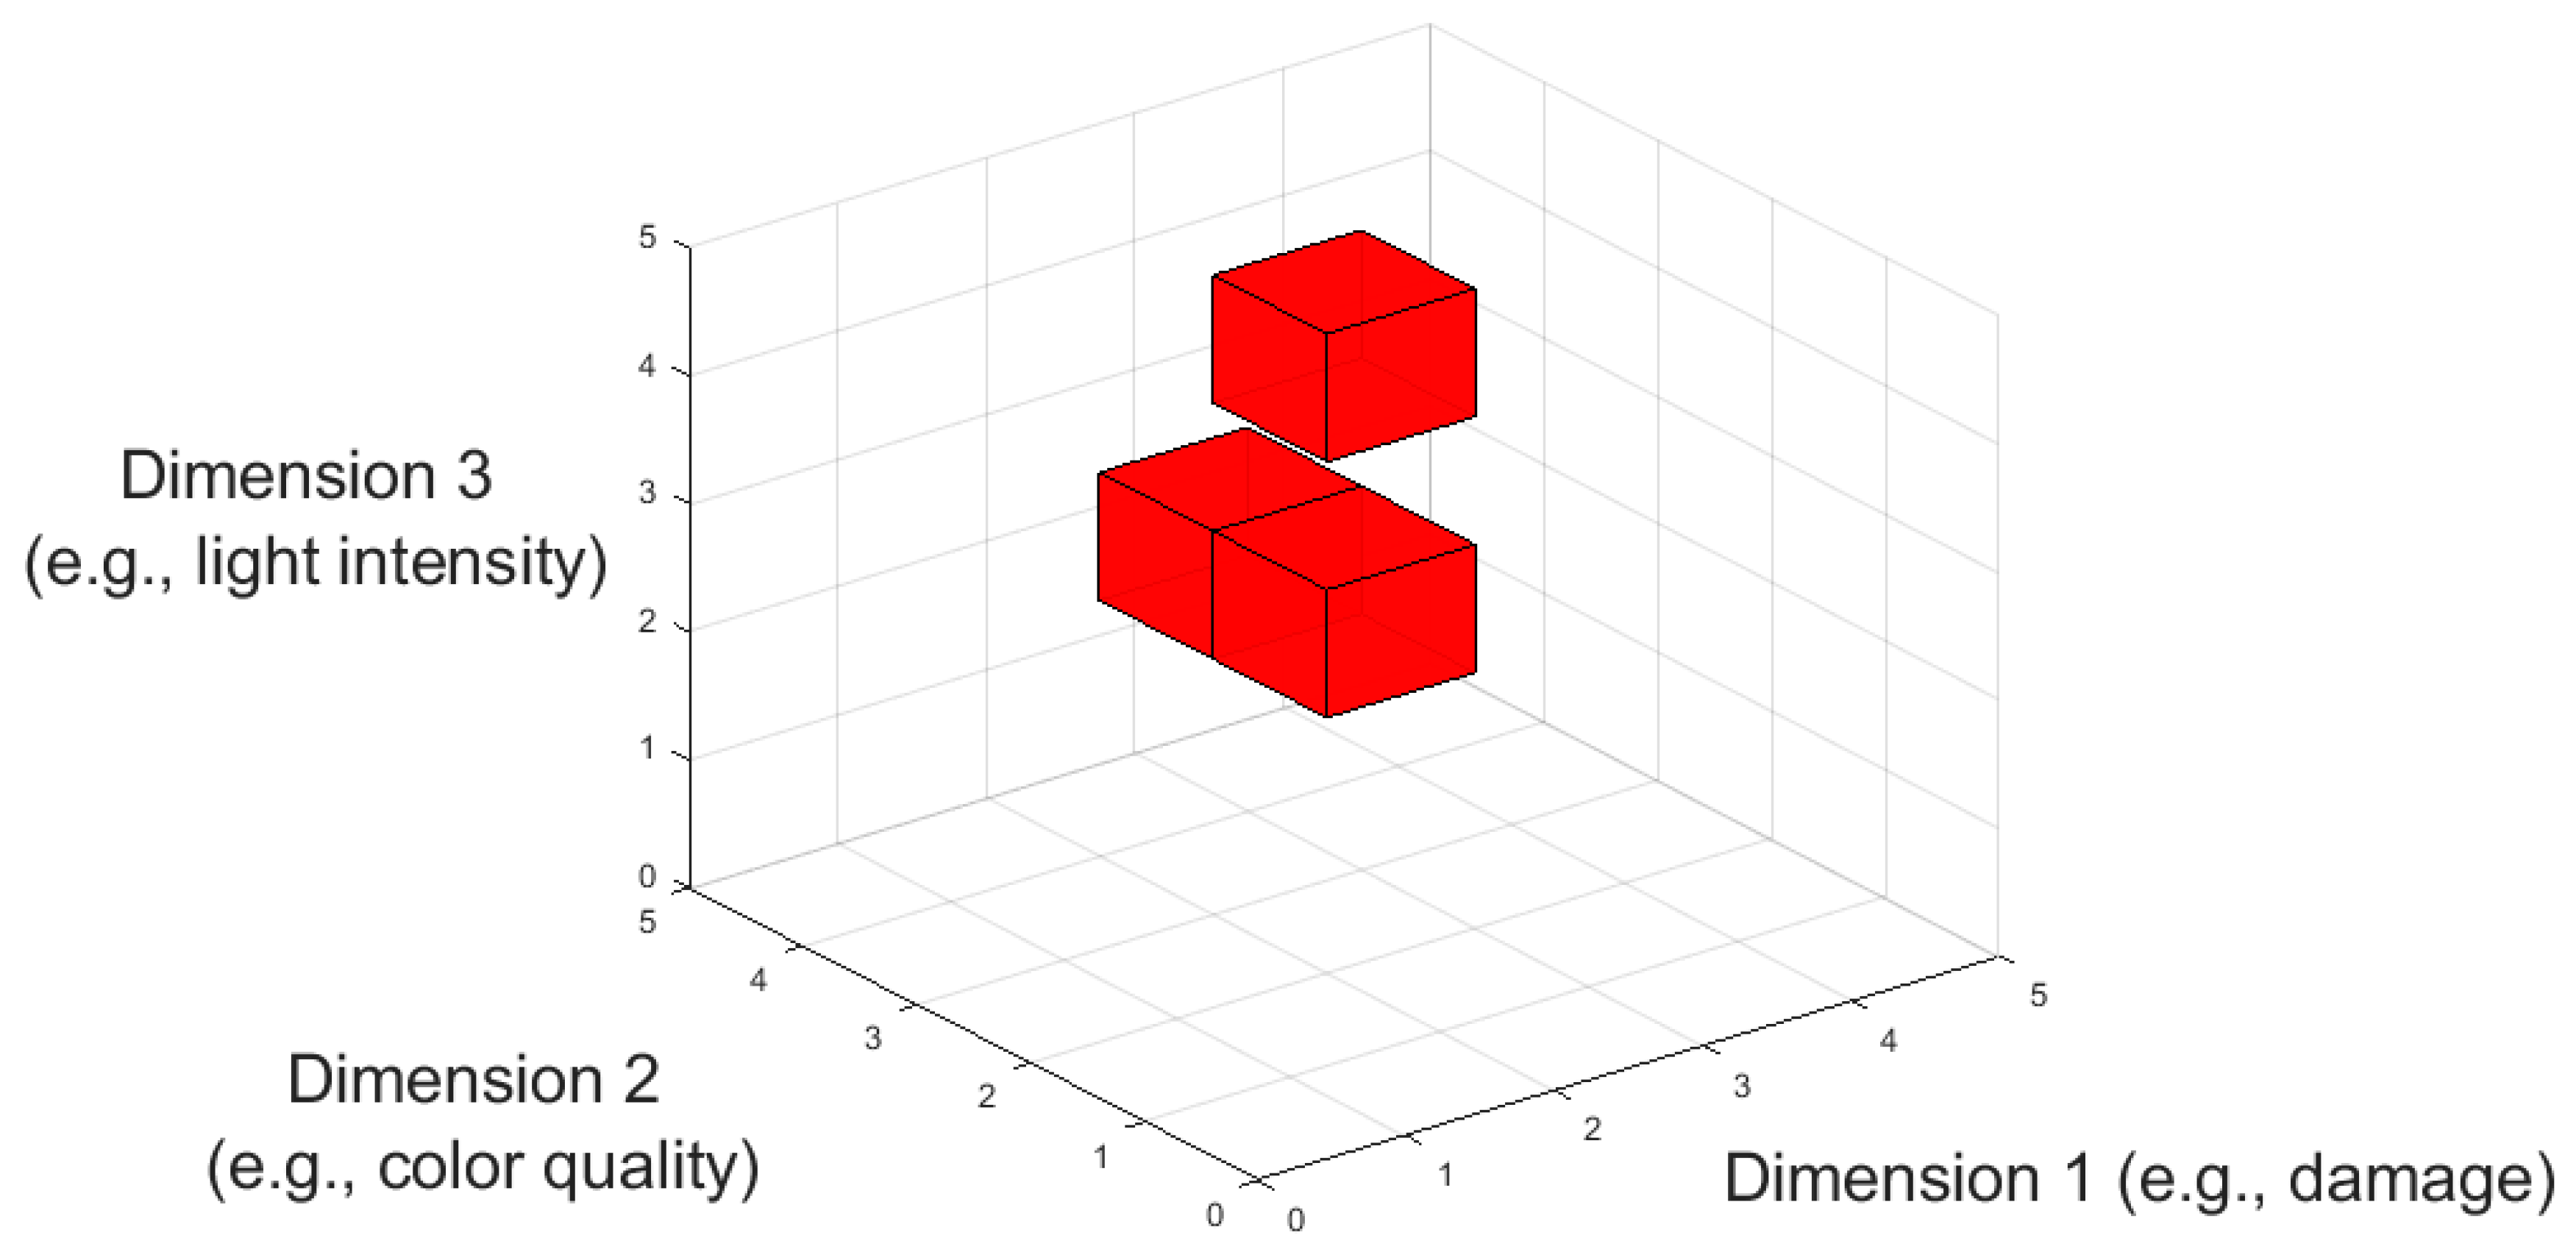
Figure 1. Converting continuous measures to discrete data enables the counting of unique voxels (red cubes), summing them to quantify the volume for a multi-primary LED lighting system. In this example, the size of each unit voxel is 1 for each dimension, and the magnitude of the voxelated volume is 3.
Heritage 04 00011 g001
Figure 2. The spectral power distribution of the seven-channel multi-primary LED system is used in the linear optimization to generate data that are analyzed for the proposed 3-D representation of metric trade-offs.
Heritage 04 00011 g002
Figure 3. The 3-D voxelated volume VV1 shows the trade-offs between damage to artwork (light absorption ratio of test light source to reference), color quality (shifts in the appearance of 24 Macbeth ColorChecker samples between test SPDs and the reference light source), and energy efficiency of the light source (luminous efficacy of radiation; unit: lm/W). Voxels are shown as circles for representation purposes only.
Heritage 04 00011 g003
Figure 4. Limiting the x and y axes of the voxelated 3-D volume VV1 can highlight areas of interest, such as low relative absorption (A < 100) and color difference (ΔERMS < 20). Voxels are shown as circles for representation purposes only.
Heritage 04 00011 g004
Figure 5. Another 3-D voxelated volume VV2 shows the trade-offs between damage to artwork (light absorption ratio of test light source to reference), color quality (ANSI/IES TM-30 fidelity index Rf), and illumination intensity (irradiance Ee). Voxels are shown as circles for representation purposes only.
Heritage 04 00011 g005
Figure 6. A damage appearance model (DAM) can be developed based on the research studies investigating the impact of different aspects of light on pigments. A computational model such as this can have inputs including spectral power distribution, intensity, exposure duration of the light source, action spectra of the light-receiving material, material (binder, pigment, dye) type, and choice of a reference illuminant (i.e., daylight, incandescent). The DAM outputs can be the color difference to quantify damage and the color appearance of the light-receiving material.
Heritage 04 00011 g006
Publisher’s Note: MDPI stays neutral with regard to jurisdictional claims in published maps and institutional affiliations.