Abstract
The Cardioid (C) distribution is one of the most important models for modeling circular data. Although some of its structural properties have been derived, this distribution is not appropriate for asymmetry and multimodal phenomena in the circle, and then extensions are required. There are various general methods that can be used to produce circular distributions. This paper proposes four extensions of the C distribution based on the beta, Kumaraswamy, gamma, and Marshall–Olkin generators. We obtain a unique linear representation of their densities and some mathematical properties. Inference procedures for the parameters are also investigated. We perform two applications on real data, where the new models are compared to the C distribution and one of its extensions.
1. Introduction
Fitting densities to data has a long history. Statistical distributions are very useful in describing and predicting real world phenomena. Hundreds of extended distributions have been developed by introducing one or more parameters to a baseline distribution over the past decades for modeling data in several disciplines, in particular in reliability engineering [1], survival analysis [2], demography [3], actuarial science [4], etc.
Adding parameters to a well-established distribution is a time honored device for obtaining more flexible new families of distributions. In fact, several classes of distributions have been introduced by adding one or more parameters to generate new distributions in the statistical literature. Recent developments address definitions of new families that extend well-known distributions and, at the same time, provide great flexibility in modeling real data. The well-known generators are the Marshall–Olkin-G [5], beta-G [6], gamma-G [7], Kumaraswamy-G (Kw-G) [8], exponentiated generalized (EG) [9], type I half-logistic-G [10], Burr X-G [11], and exponentiated Weibull-H [12], among others. The applications of these generators have been made in the context of linear data, i.e., on the support of a subset of .
Several phenomena in practice provide angles (expressed in degrees or radians) as outputs called circular data, such as in the analysis of phase features obtained from radar imagery [13], time series analysis of wind speeds and directions [14], etc. As one of the most used circular distributions, the two-parameter Cardioid (C) law was pioneered by Jeffreys [15] for describing directional spectra of ocean waves. This model has a cumulative distribution function (cdf), , and probability density function (pdf), , given by (for )
and
respectively, where is a location parameter, and represents a concentration index. Some known competing distributions to the C distribution are the wrapped normal, wrapped Cauchy, wrapped Lévy, and Wrapped Lindley. A novel circular distribution introduced by Wang and Shimizu [16] applied the Möbius transformation to the C model. The Papakonstantinou family studied by Abe et al. [17] also extended (1). However, these extensions present hard analytic formulas for their densities. Recently, Paula et al. [18] introduced a simple extended C distribution, called the exponentiated Cardioid (EC), derived from the exponentiated G (exp-G) generator—after adapting the mapping linear to circular—that can describe asymmetric and some bimodal cases beyond those of the C model. The models mentioned and those that will be presented in this work are also classified as trigonometric distributions. In recent years, many trigonometric models have been proposed, such as the transformed Sin-G family [19] and Cos-G Class [20], thus highlighting their importance.
In this work, we derive four extensions of the C model through the adapted -G, Kw-G, -G, and MO-G generators, which extend the exp-G family. We propose four new circular distributions called the beta Cardioid (C), Kumaraswamy Cardioid (KwC), gamma Cardioid (C), and Marshall–Olkin Cardioid (MOC). Their densities are expressed in a unique linear representation, which is the result of weighting the term in Equation (2). Circular data phenomena often demand the proposal of tailored clustering structures. Abraham et al. [21] presented a discussion on an unsupervised clustering algorithm in circular data obtained from X-ray beam projectors. Based on mixtures of one-dimensional Langevin distributions, Qiu and Wu [22] derived a new information criterion to cluster circular data. We understand that these works motivate our proposals as the potential inputs for future clustering structures. Furthermore, some mathematical properties of the new models are derived, such as extensions and trigonometric moments [23]. A brief discussion about likelihood-based estimation procedures is provided. Finally, two applications to real data are performed to illustrate the flexibility of our proposals.
The remainder of this paper is organized as follows. New circular distributions are defined in Section 2. Section 3 provides some of their properties, and an estimation procedure is addressed in Section 4. Subsequently, two applications to real data are performed in Section 5, and some conclusions are offered in Section 6.
2. Generalized Cardioid Models
We provide some three- and four-parameter distributions by transforming the C distribution according to four well-known generators.
Let be the cdf of a baseline distribution with p parameters:
- (a)
- The -G cdf defined by Eugene et al. [6] iswhere are two additional parameters, is the incomplete beta function ratio evaluated at , and is the complete beta function;
- (b)
- The Kw-G cdf pioneered by Cordeiro and Castro [8] iswhere are two additional parameters;
- (c)
- The -G cdf reported by Zografos and Balakrishnan [7] iswhere , is the gamma function, and is the incomplete gamma function;
- (d)
- The MO-G cdf defined by Marshal and Olkin [5] iswhere is a shape parameter.
For the first two generators, given a p-parameter baseline cdf as input, one has new -parameter models, whereas for the remaining generators, -parameter distributions are furnished.
Let , where is the remainder after x is divided by y. In what follows, we will do an adaptation to the generators (3)–(6) in order to propose generalized Cardioid models with cdf and pdf that satisfy the conditions
- ;
- .
The conditions are required for circular data studies (see Mardia and Sutton [24]). The new models present discontinuity in . This pattern also holds for other circular models in the literature such as wrapped exponential [25].
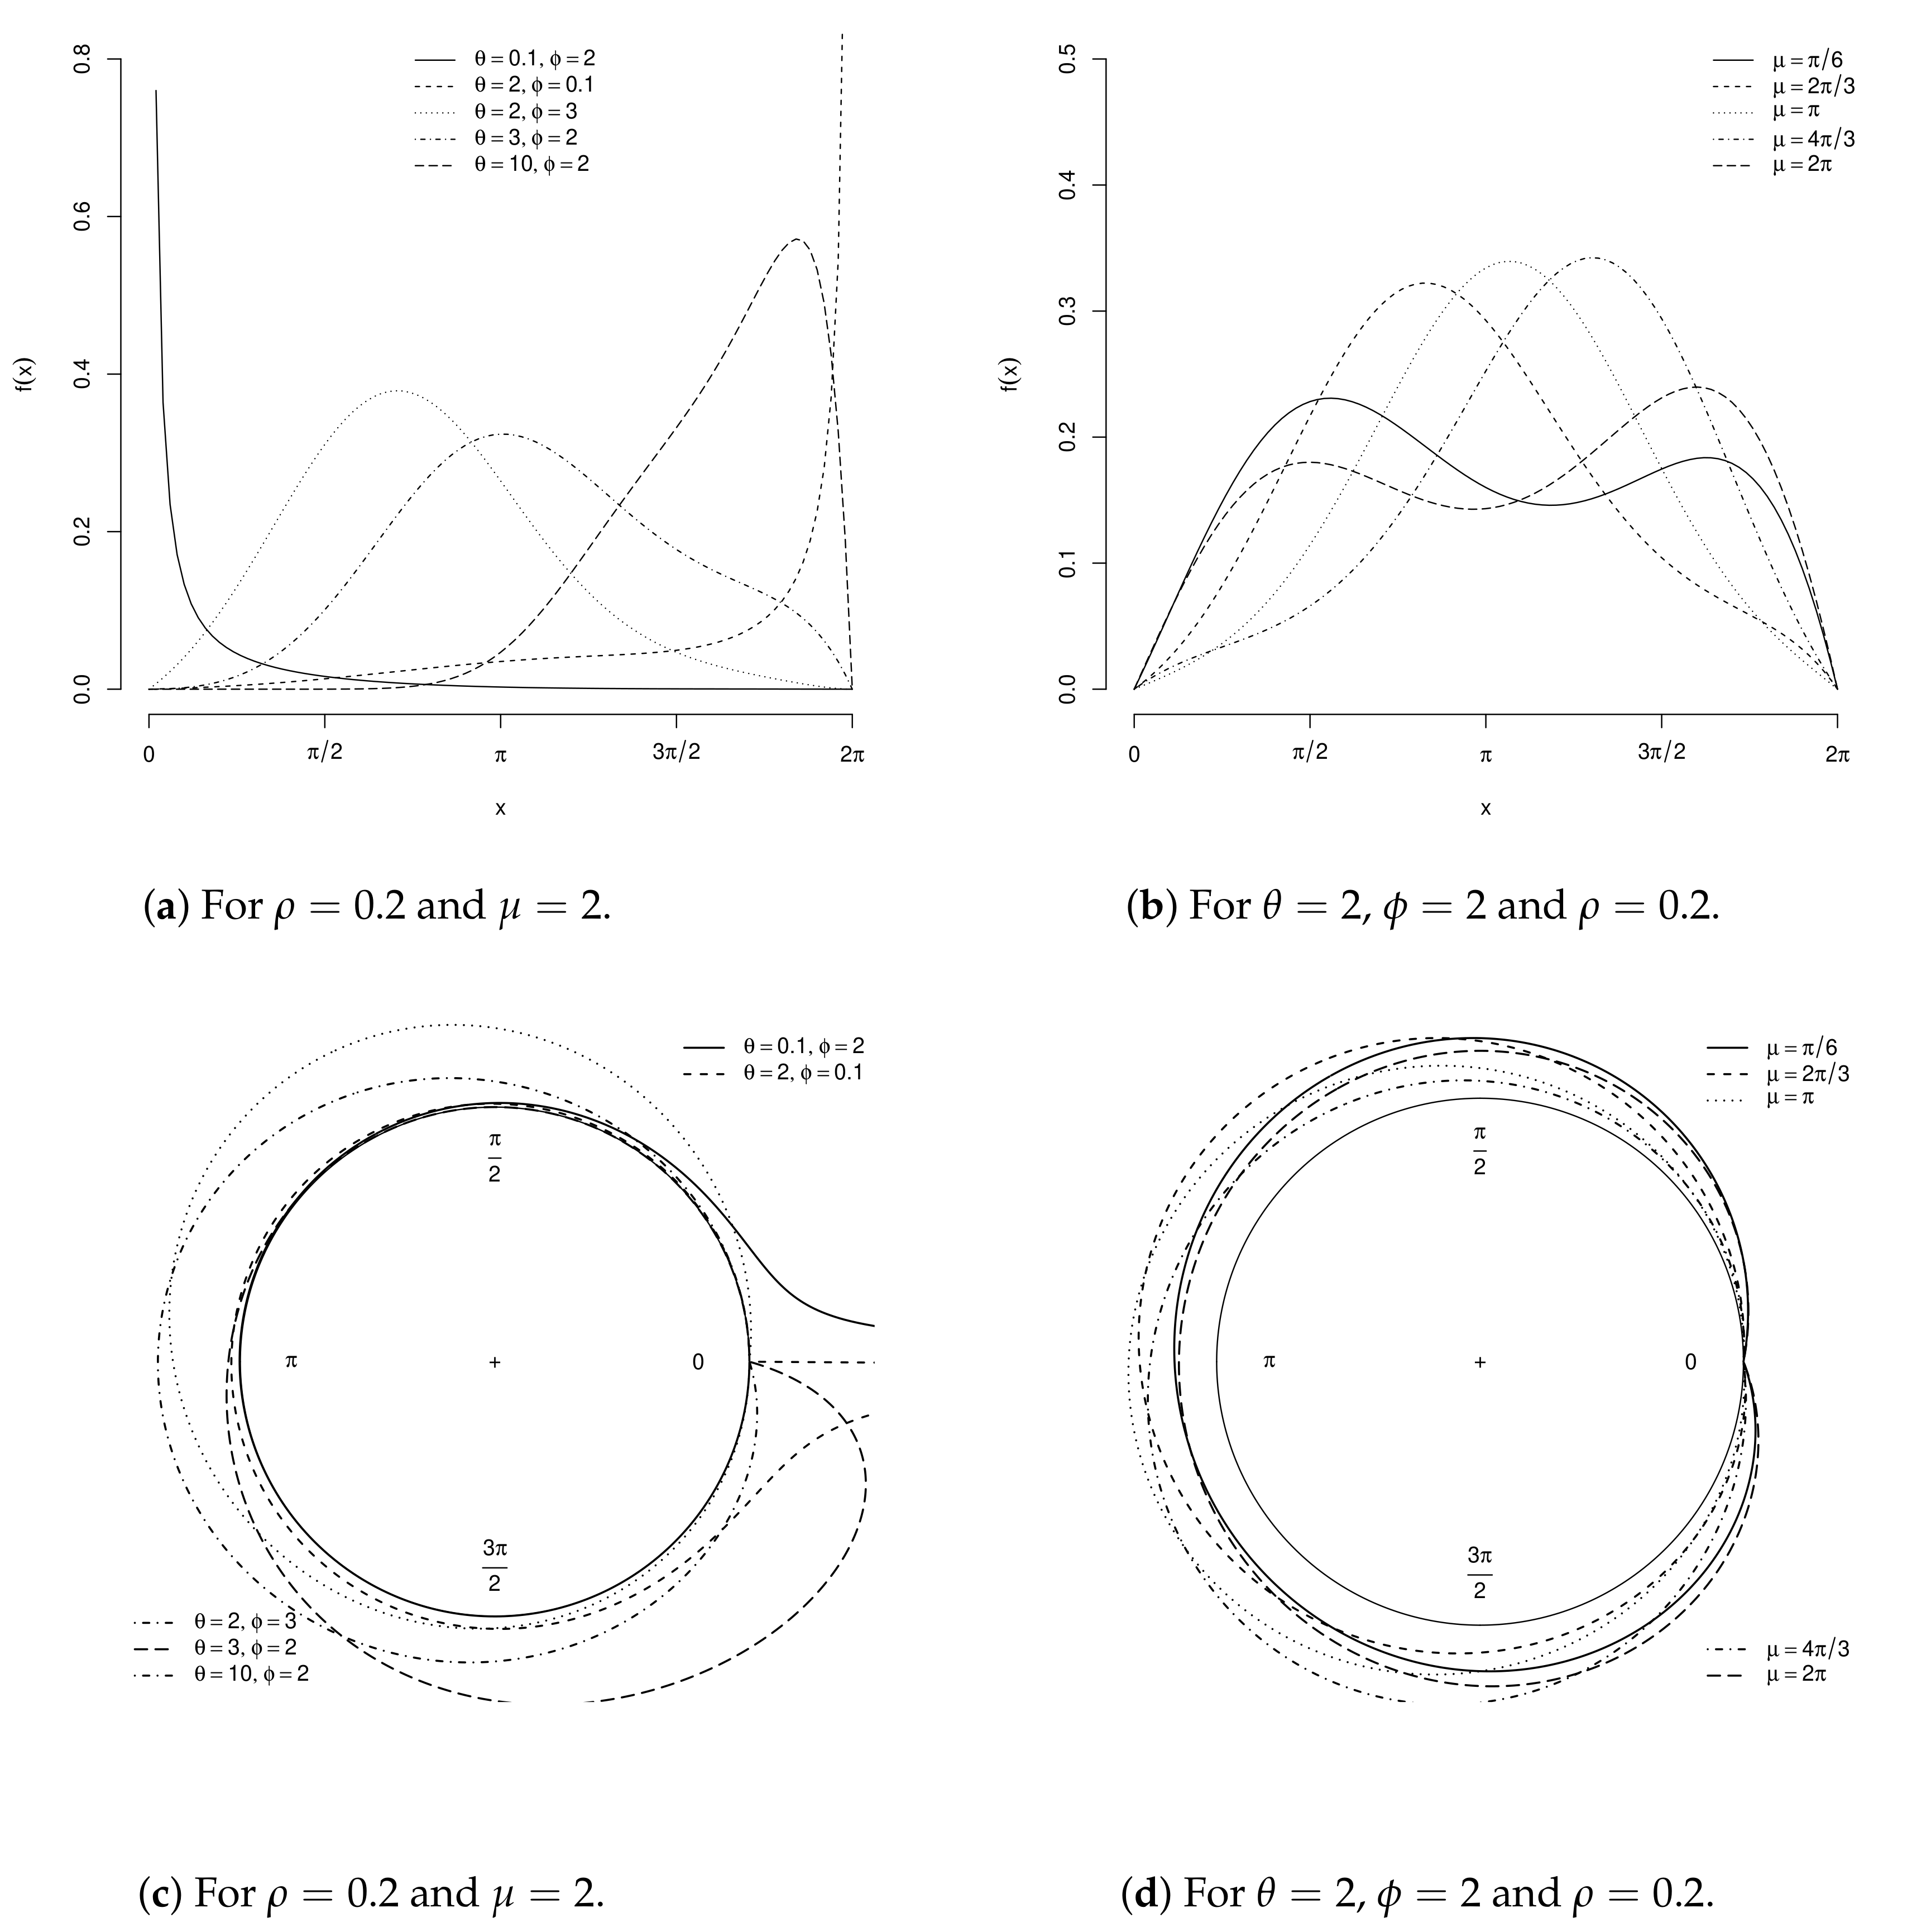
2.1. Beta Cardioid
By applying (1) to Equation (3), the cdf of the C distribution is
for . This case is denoted by . By differentiating the last equation, the C pdf, say , has the form
where and
For , the C model reduces to the EC distribution discussed by Paula et al. (2020).
Figure 1a–d display C densities for some parametric points.
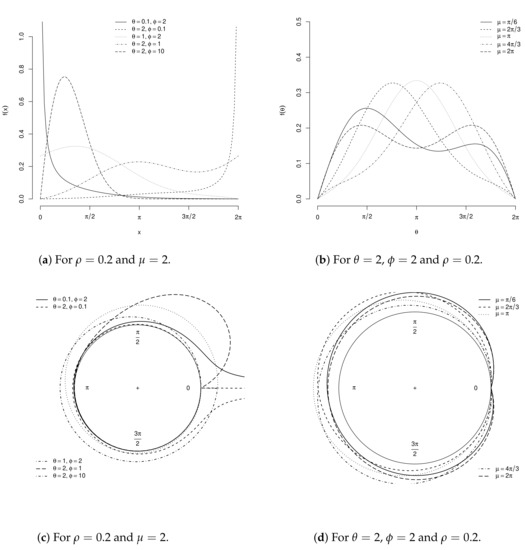
Figure 1.
Cartesian and circular C densities for some parametric points.
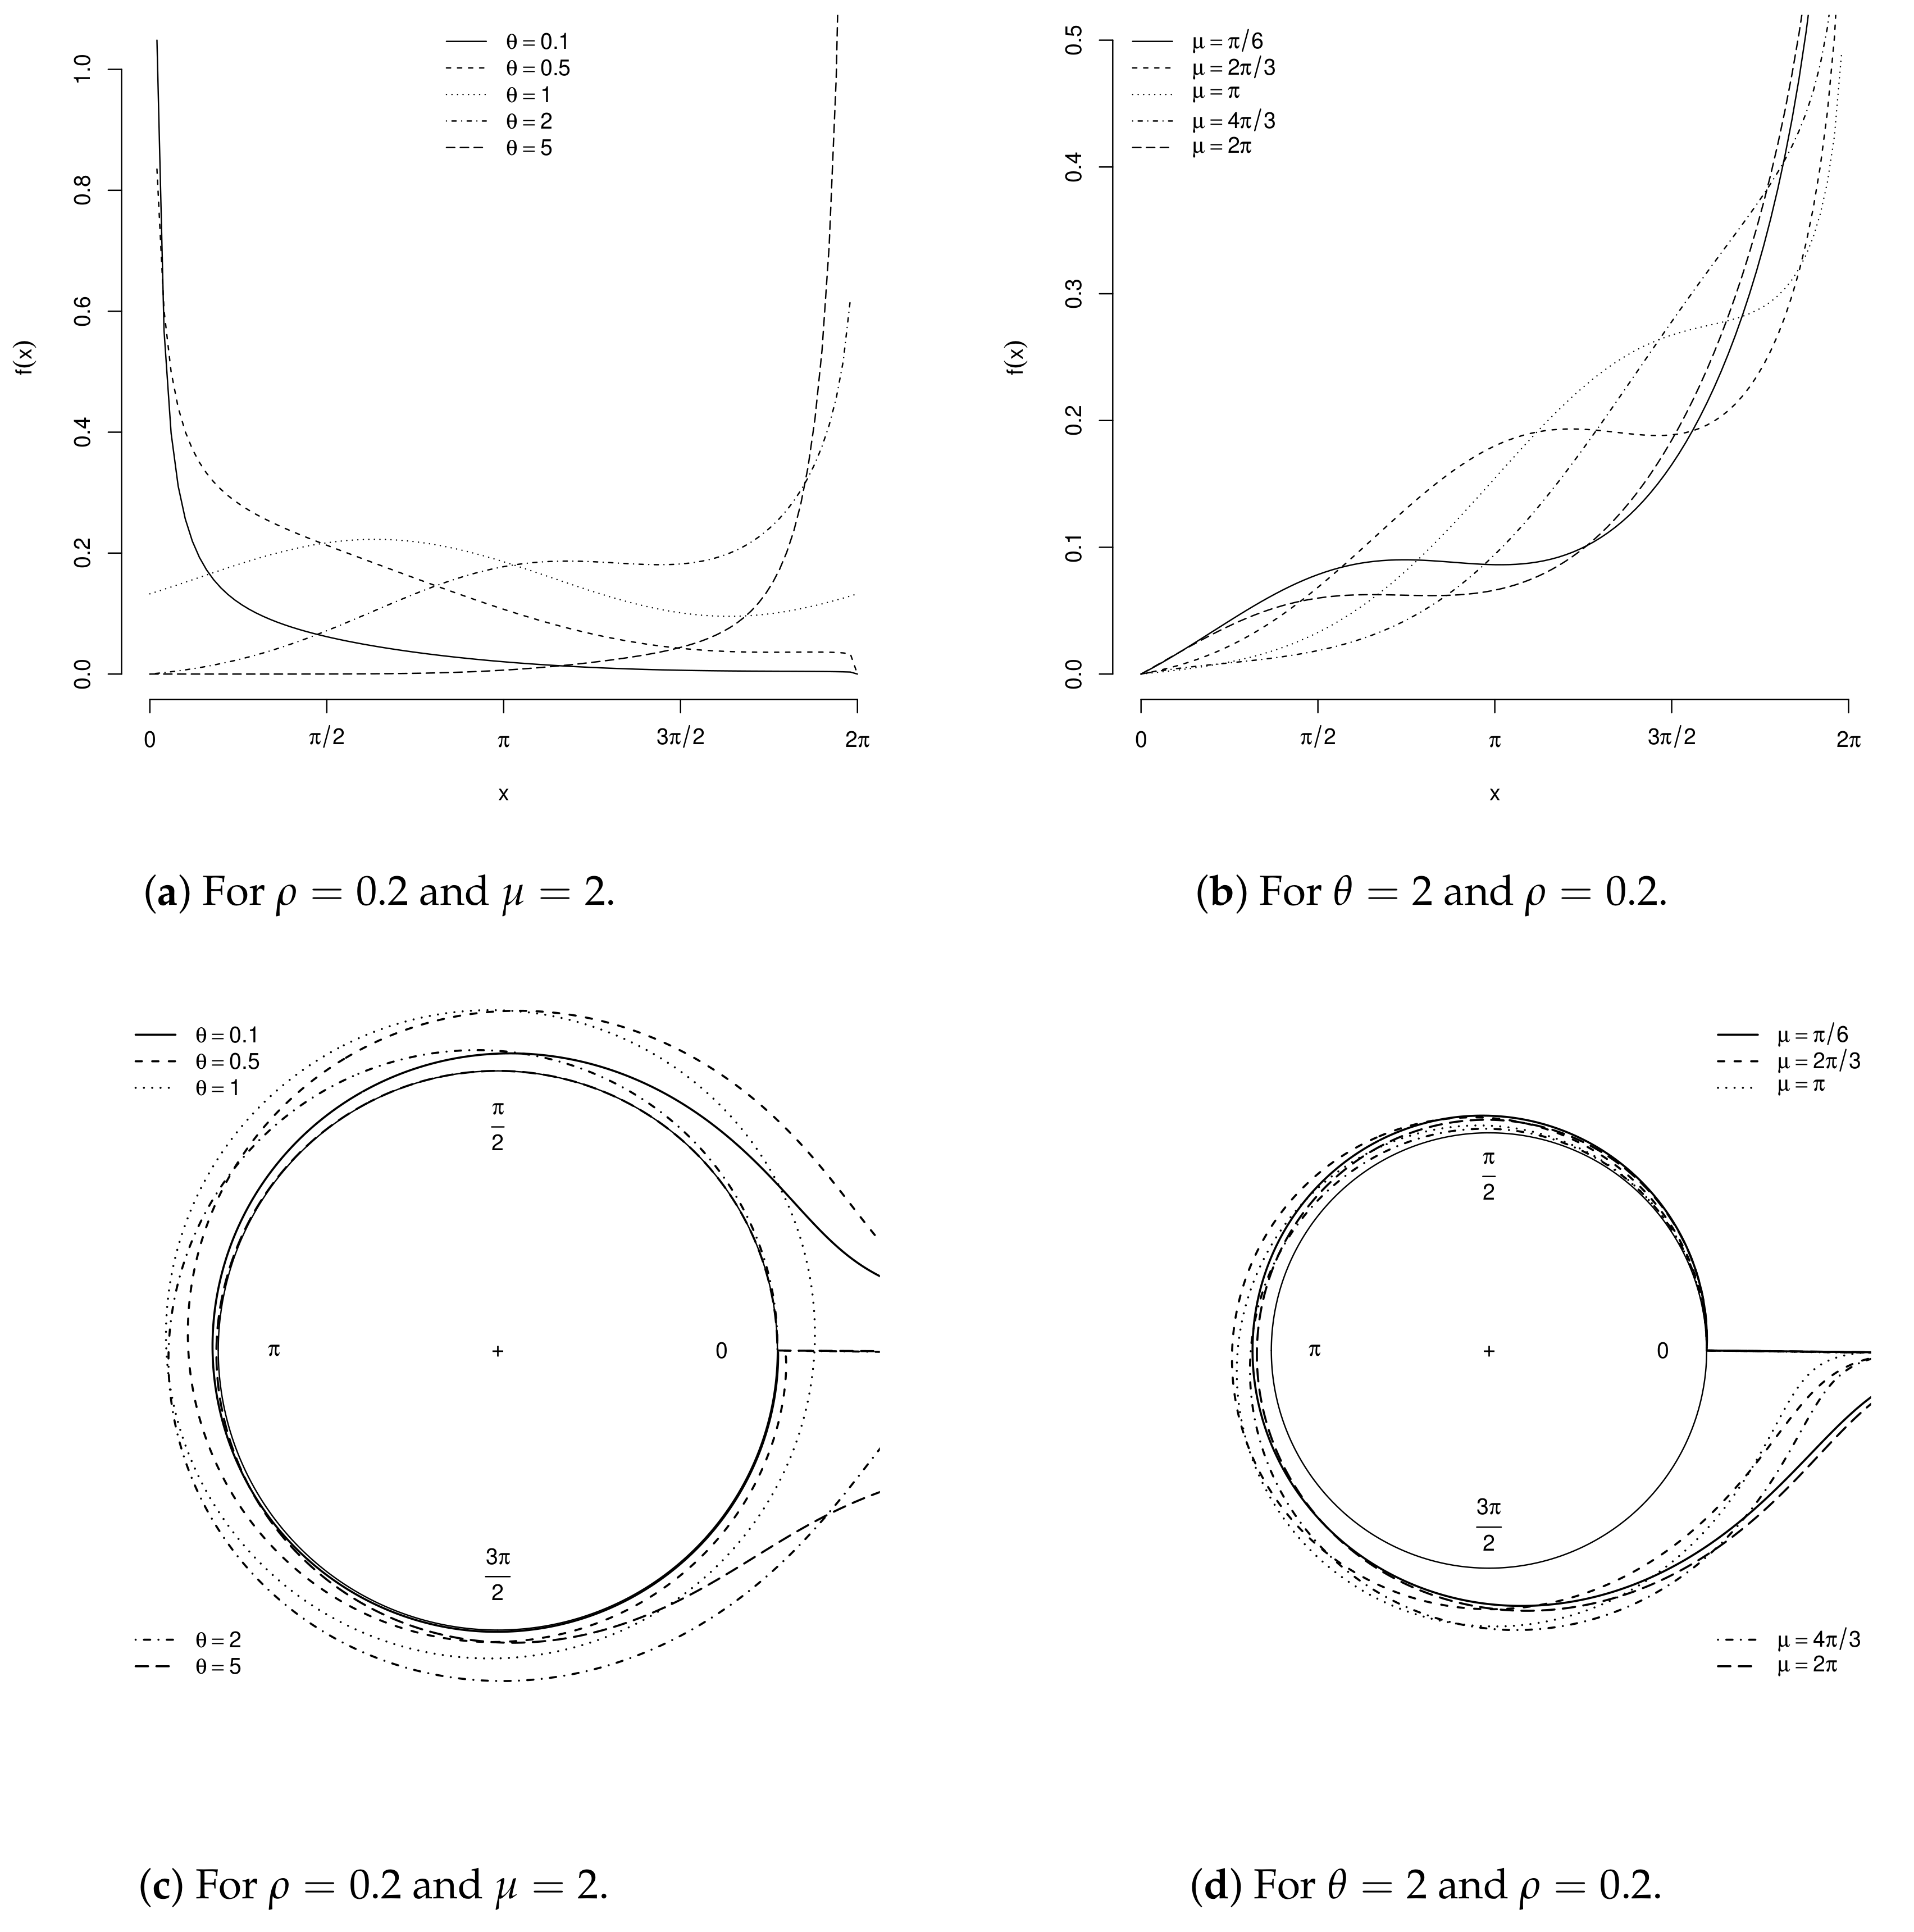
2.2. Kumaraswamy Cardioid
By inserting (1) in Equation (4), the Kw-C cdf, say , can be expressed as
for . This case is denoted by . The KwC pdf, , can be reduced to
where and
Figure 2a–d display KwC densities for some parametric points.
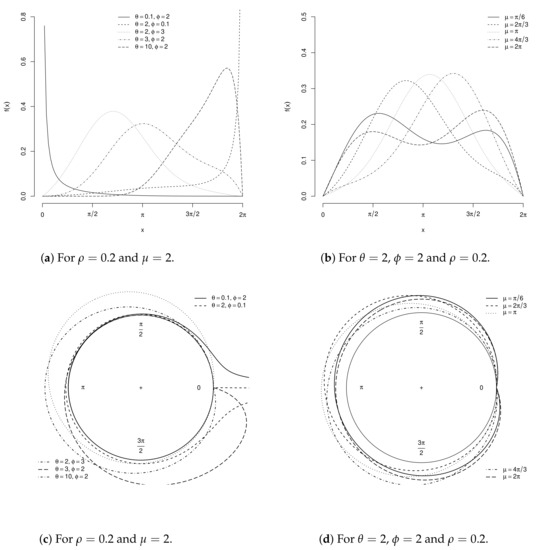
Figure 2.
Cartesian and circular KwC densities for some parametric points.
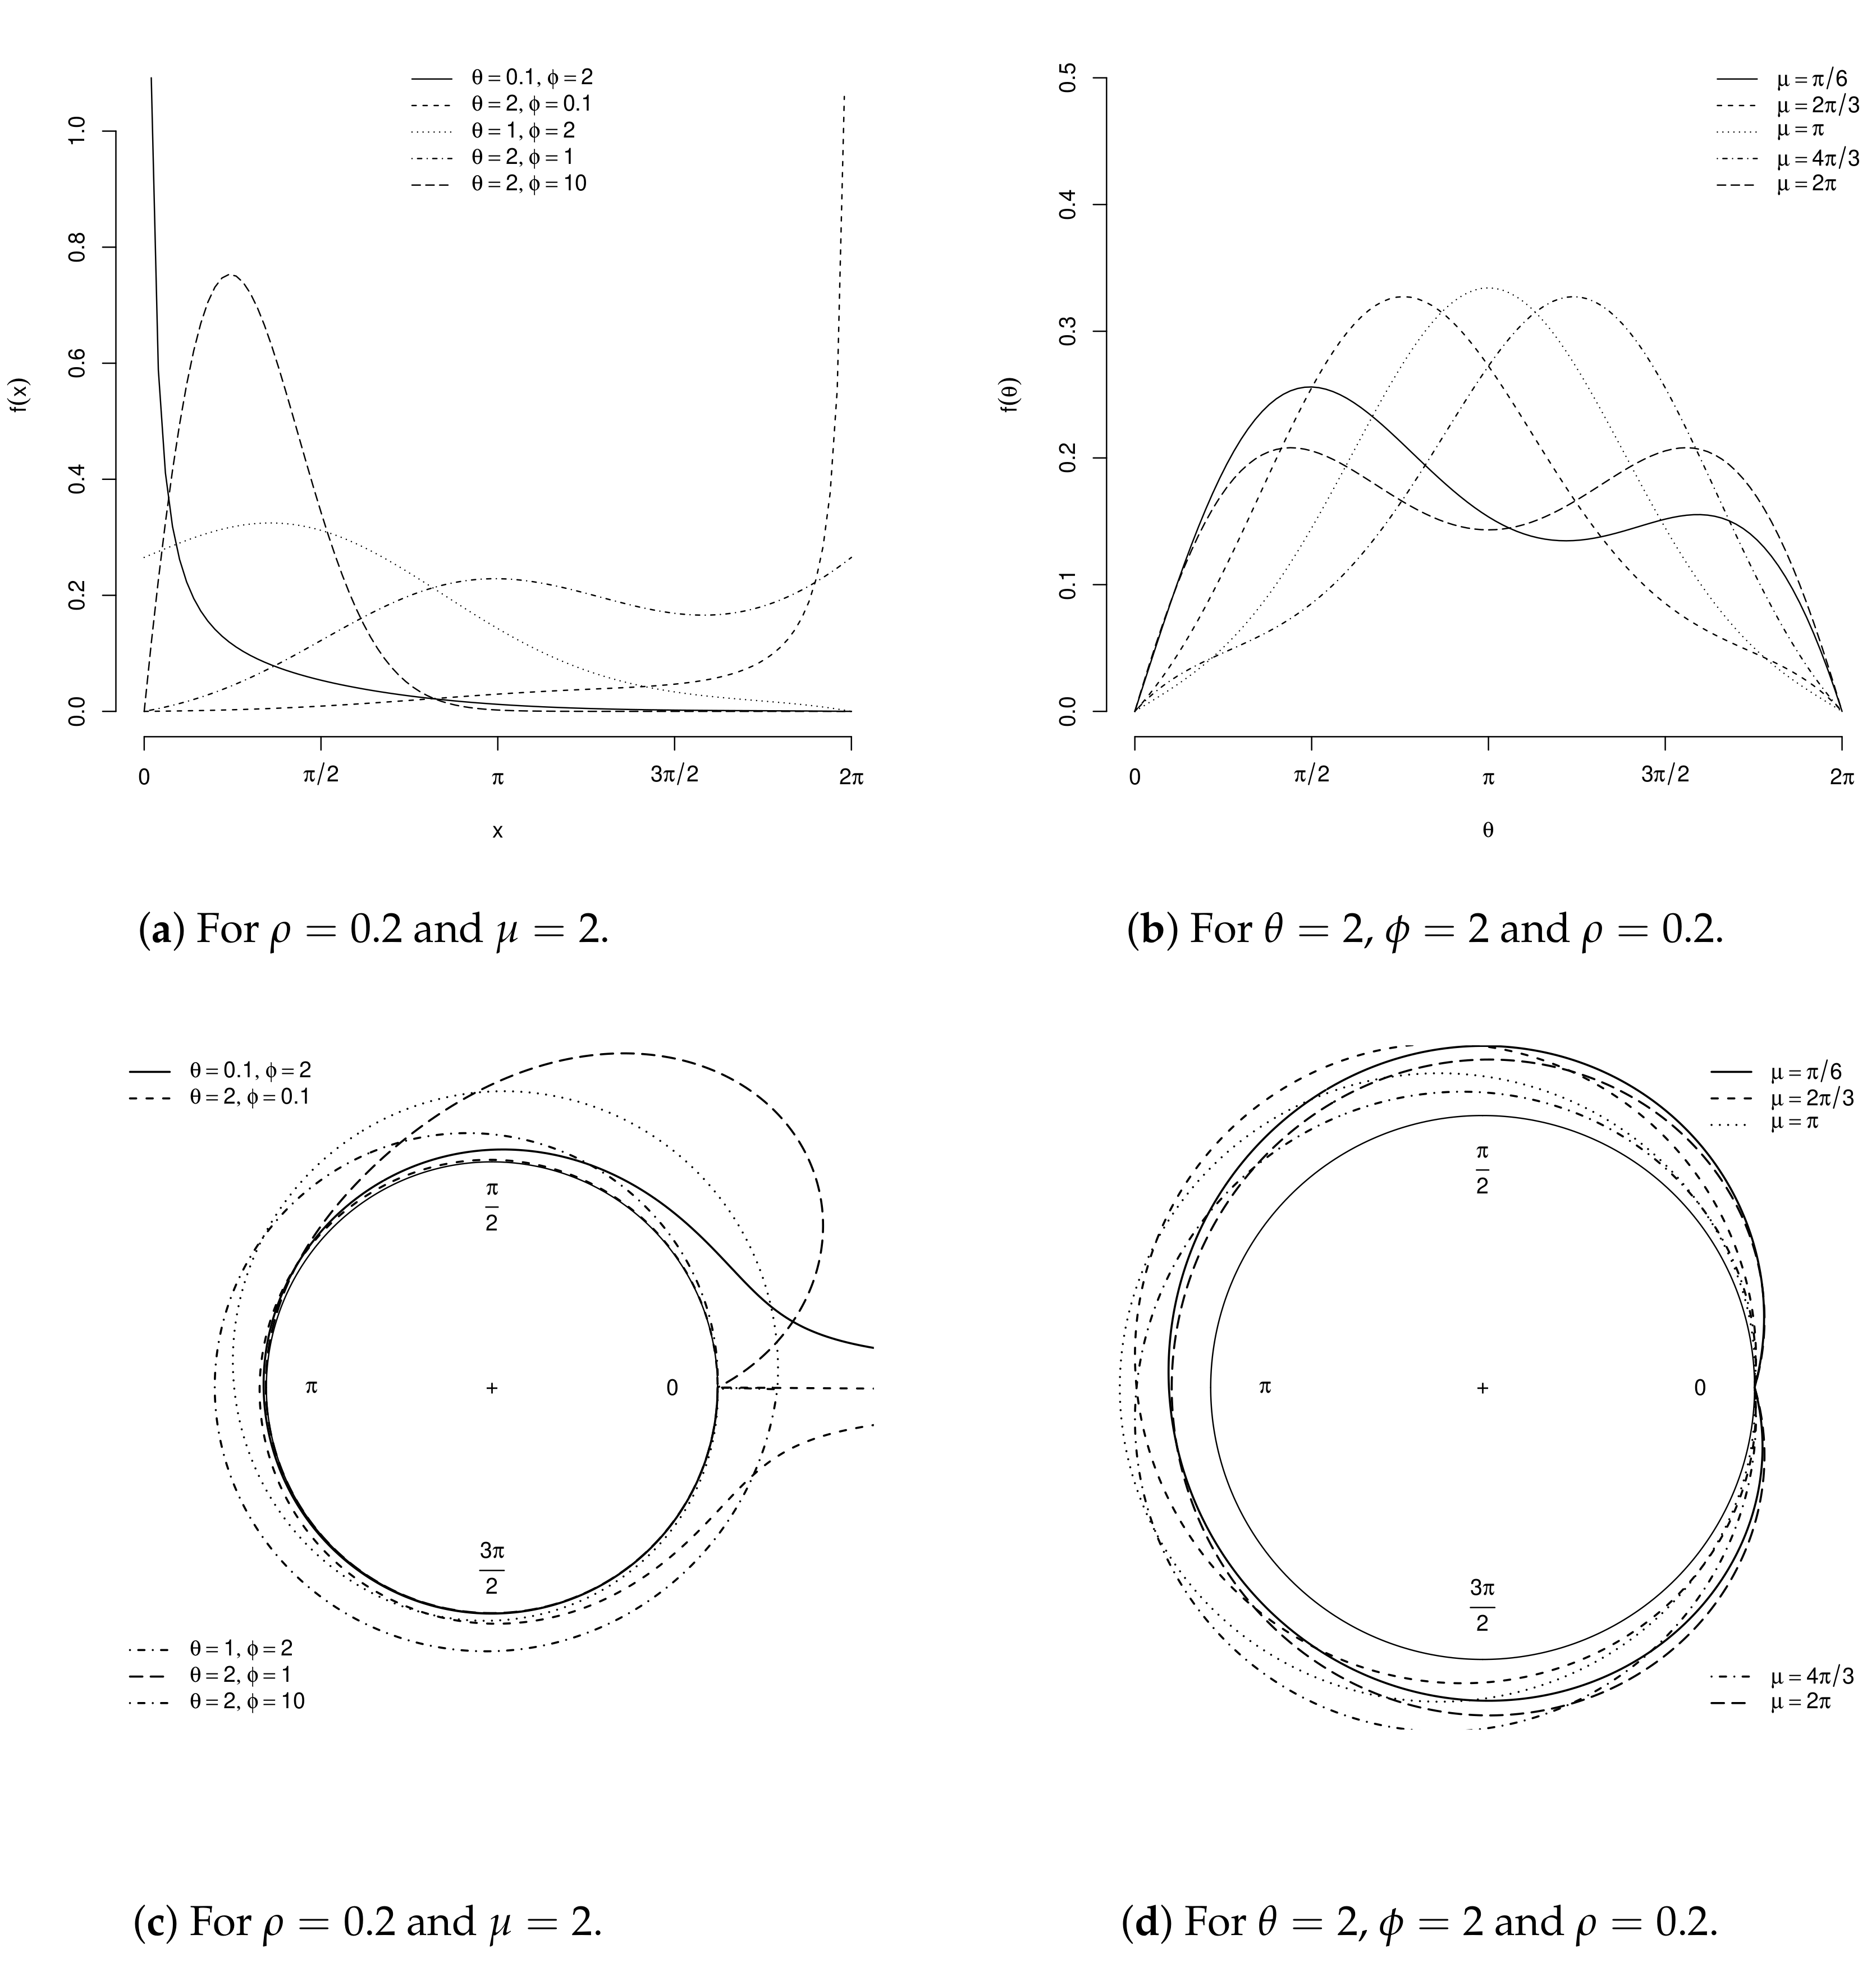
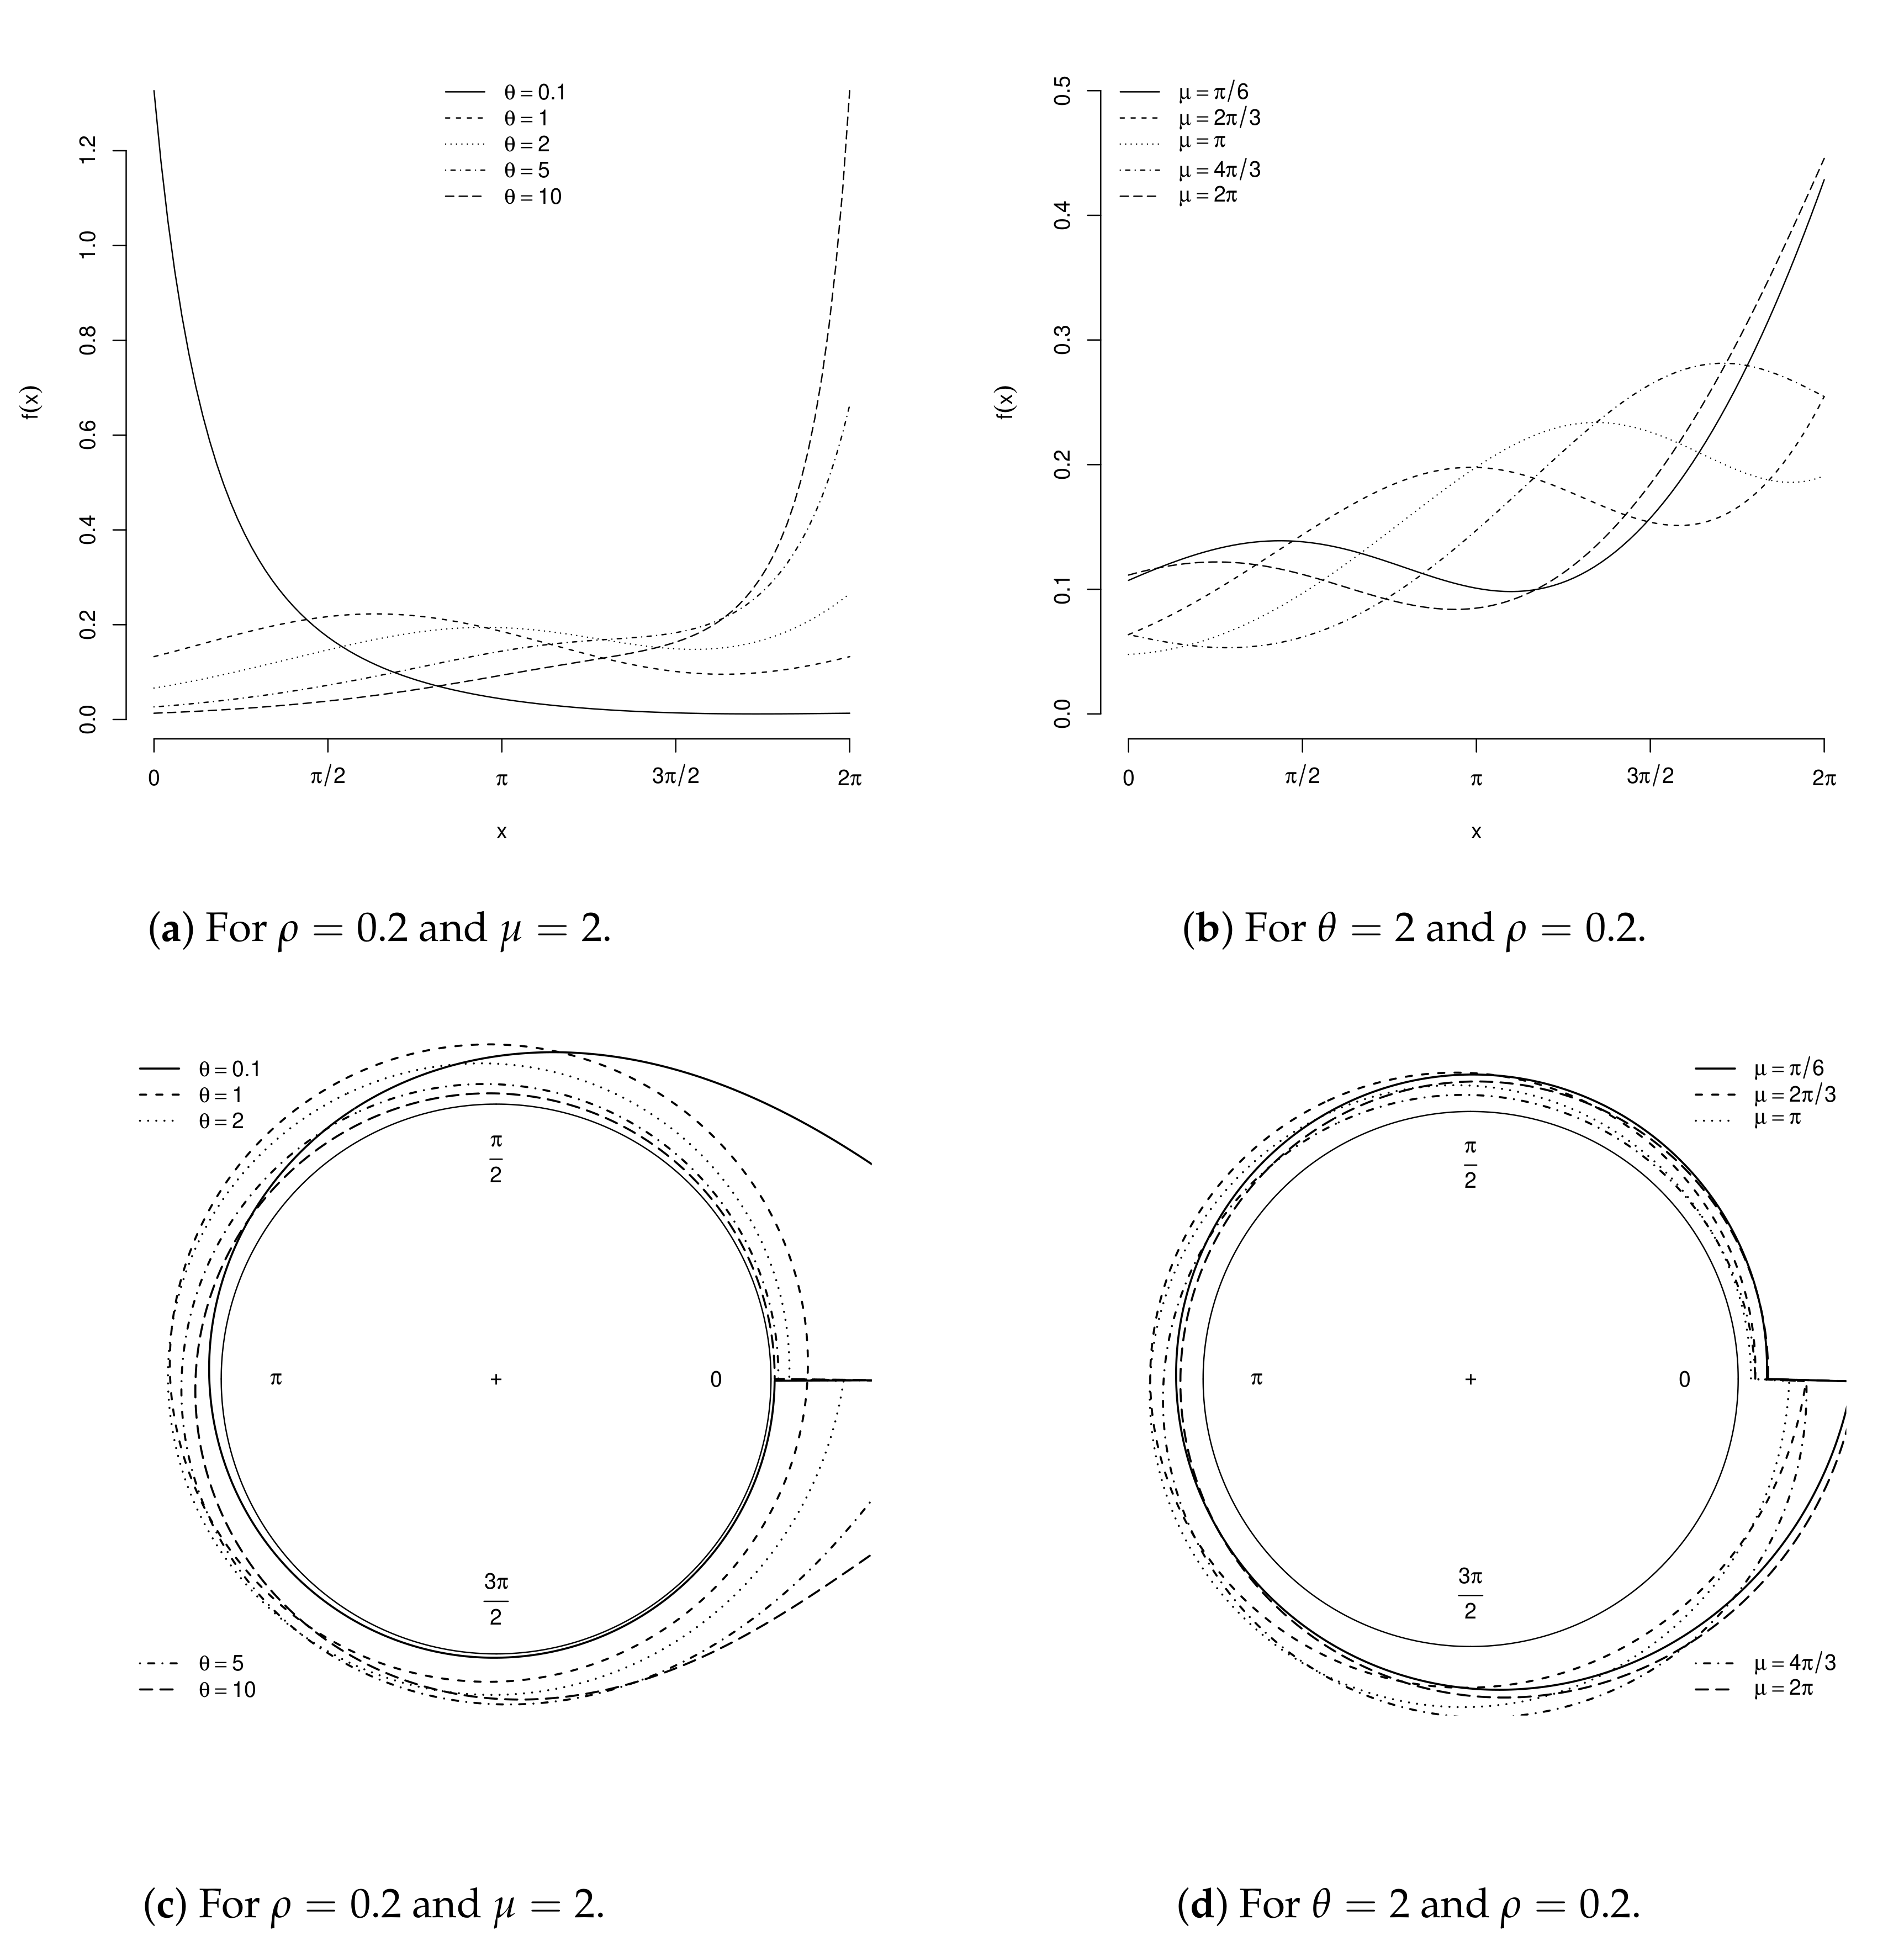
2.3. Gamma Cardioid
By applying (1) in Equation (5), the C cdf, , has the form
for . This case is denoted by . By differentiating the last equation, the C pdf, , reduces to
where and
Figure 3a–d display C densities for some parametric points.

Figure 3.
Cartesian and circular C densities for some parametric points.
2.4. Marshall–Olkin Cardioid
By inserting (1) in Equation (6), the MOC cdf, , is given by
for . This case is denoted by . Thus, the MOC pdf, , becomes
where and
Figure 4a–d display MOC densities for some parametric points.

Figure 4.
Cartesian and circular MOC densities for some parametric points.
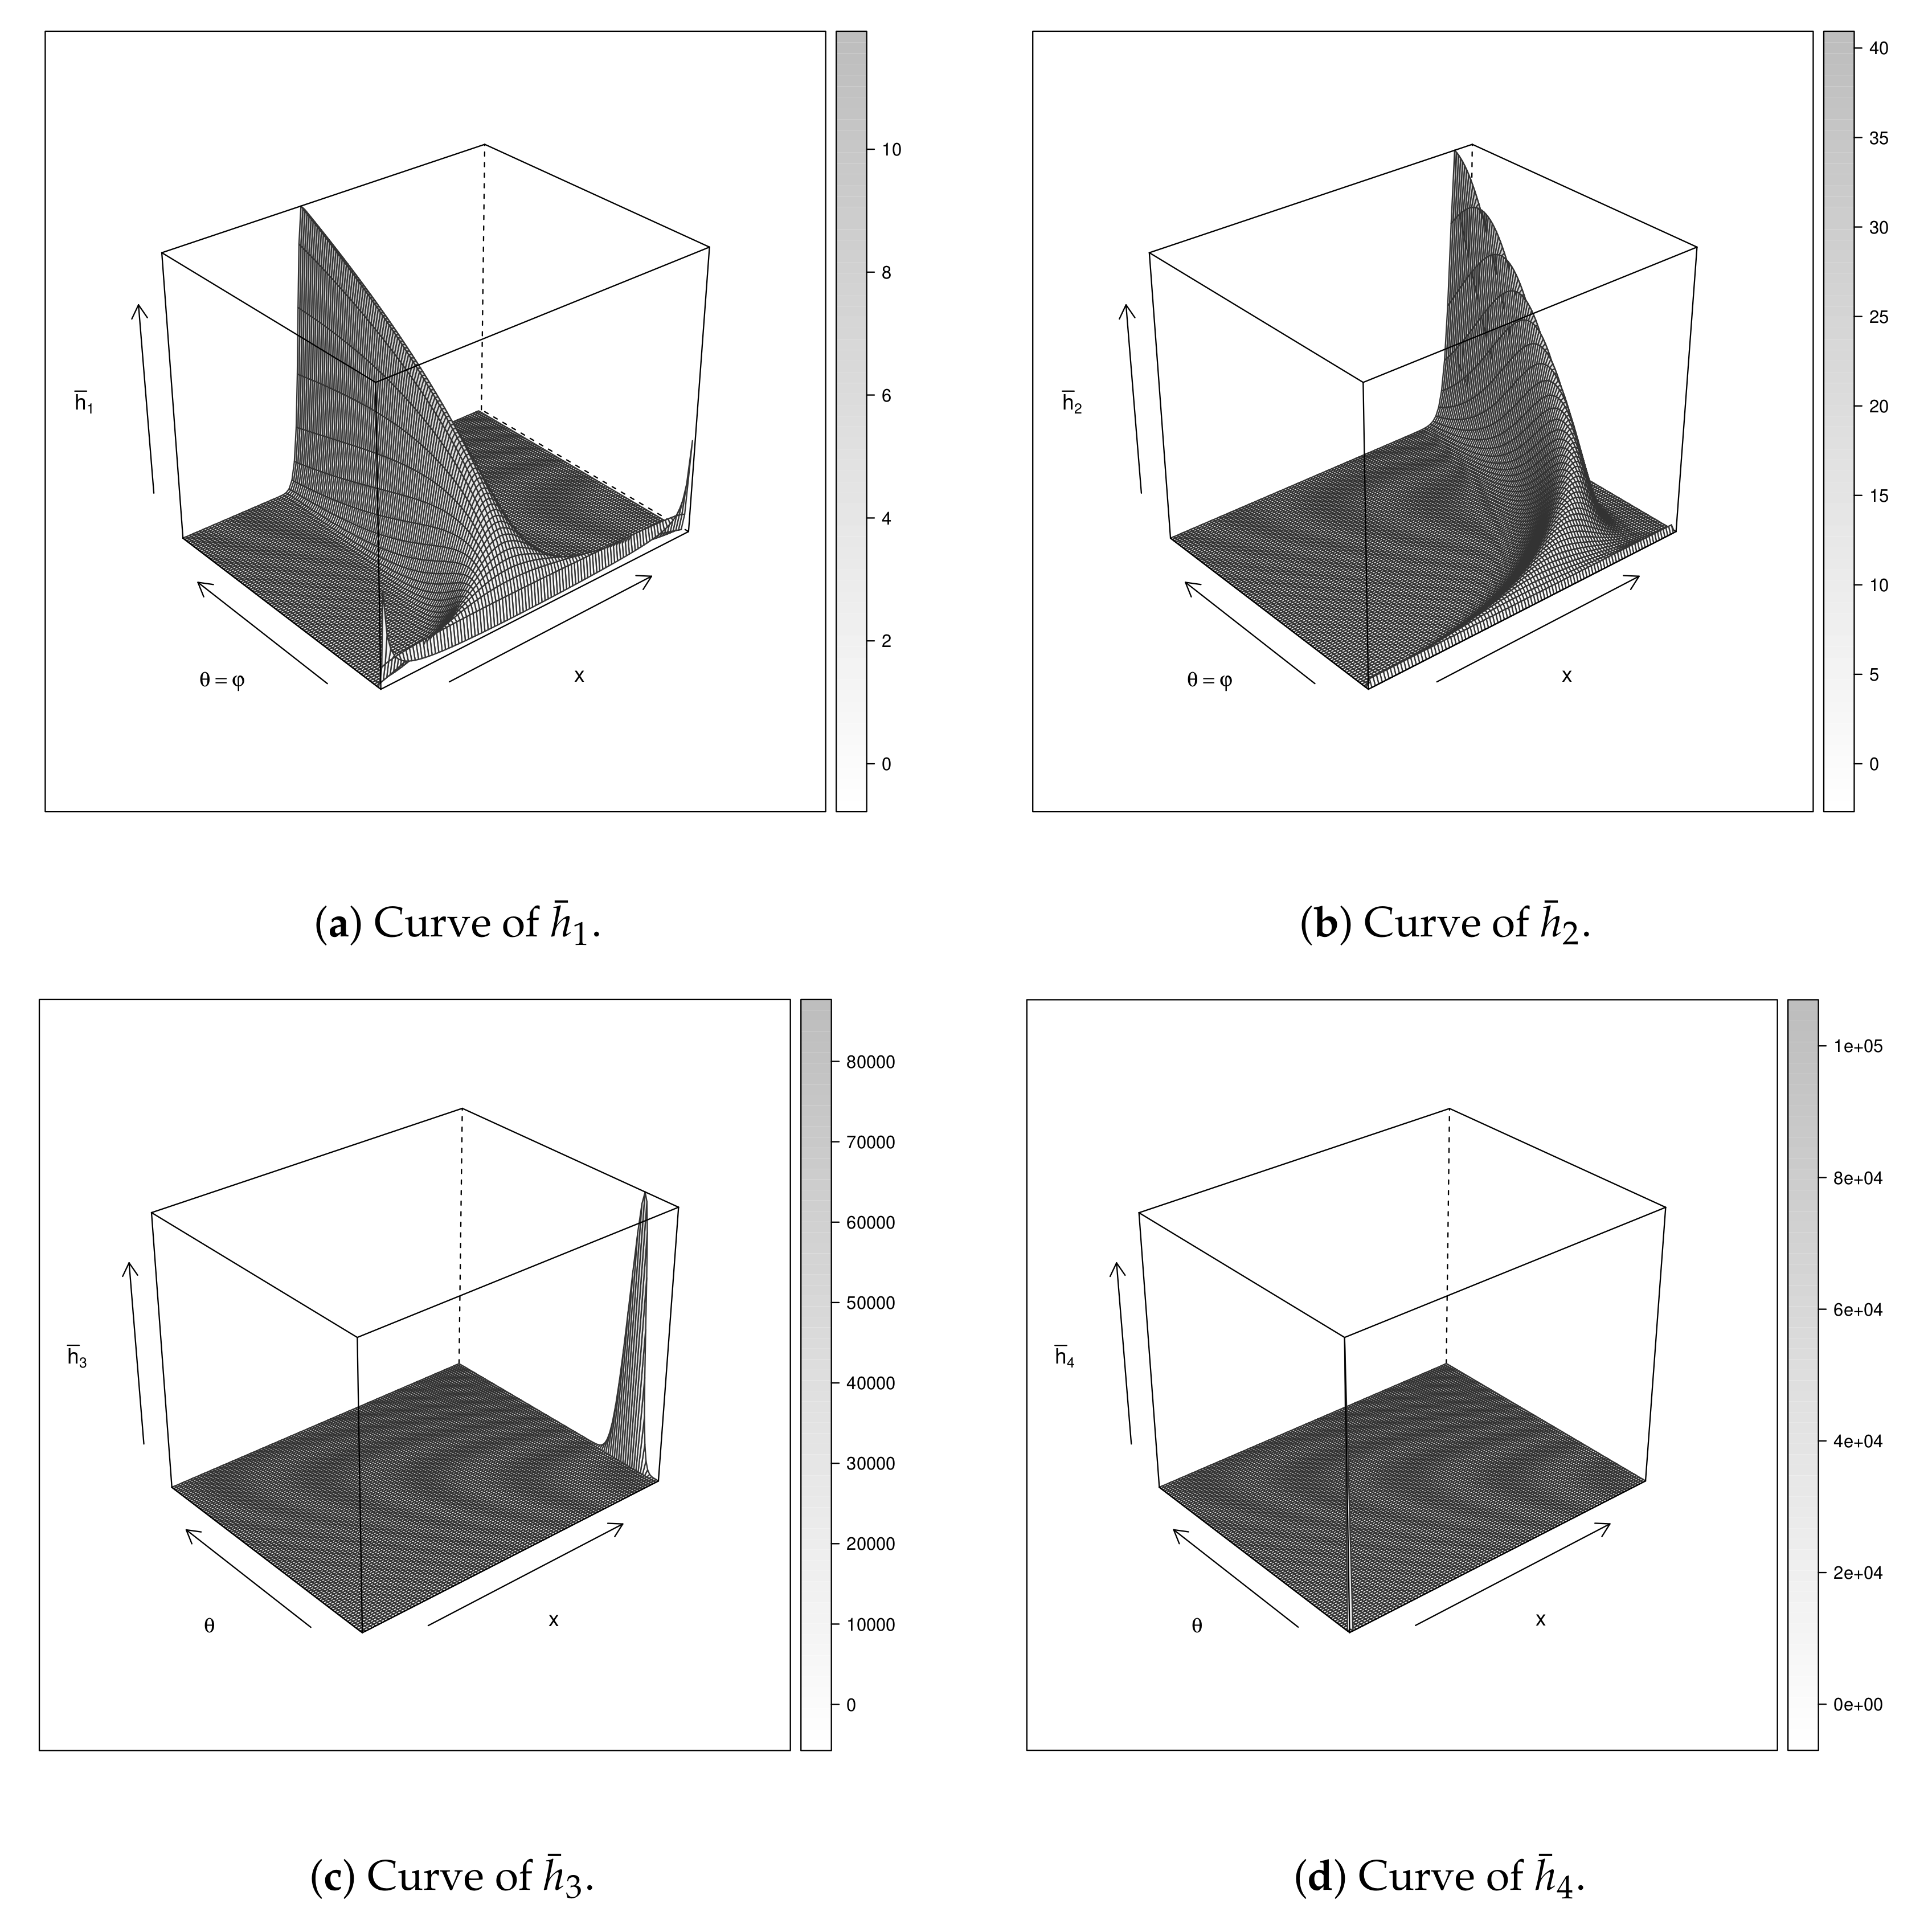
2.5. A General Formula
All four extensions have the same support, and their densities can be expressed as
where is defined in Table 1.

Table 1.
The weighted multipliers for the proposed models.
The new densities can be interpreted as weighted multipliers for the baseline pdf kernel . Thus, the behavior of in (11) has an important task for studying the flexibility of the new models. Figure 5 displays the weighted functions . For these plots, we set and consider and . Note that although and have the highest values, and present larger domain regions, which lead to more flexible scenarios. Thus, we conclude that the C and KwC can be more flexible among these models.

Figure 5.
Weighted curves of .
3. Mathematical Properties
In this section, we obtain the trigonometric moments for the new models. First, we recall some concepts in the area of circular distributions. We follow the notation of Pewsey et al. [26].
Analogously as over the real line, a circular distribution can also be described by its characteristic function (cf). However, as random variables X considered in this paper are periodic, we can write
where , which implies or ; i.e., the cf should be defined only at integer values.
The cf evaluated at an integer p is called the pth trigonometric moment of X defined by
The quantity is the mean resultant vector in the complex plane of length and direction
where is the norm of a complex argument. The quantities and are fundamental measures of concentration and location, respectively. The polar representation of is
Furthermore, the pth central trigonometric moment of a circular distribution is
where and are its real and imaginary parts. The polar representation of is given by
Here, we are interested in finding expressions for .
In what follows, refers to the parameter discussed previously in the models, while is the mean direction.
Furthermore, we derive expansions for by means of the following results. First, consider a baseline distribution having cdf and pdf . The exp-G family with power parameter has cdf and pdf given by
respectively. Expansions for densities obtained from Equations (3)–(6) have often been given in terms of the last two functions:
- From Nadarajah et al. [27]:
- From Cordeiro and de Castro [8]:
- From Castellares and Lemonte [28]:whereand are the Stirling polynomials given in Castellares and Lemonte [28].
- From Cordeiro et al. [29]:where the coefficients are given by ()and .
- From Paula et al. [18]:Let . The cdf of is (Paula et al., 2020)By simple differentiation, we can writewhere ,After some algebraic manipulations, the pth central circular trigonometric moment of , say , with mean direction , follows aswhere and . The functions and are easily handled both numerically and analytically.For example, Table 2 displays some special quantities using the symbolic computation software wxmaxima.
Table 2. Some expressions for and .
By applying (17) to Equations (13)–(16), we obtain linear representations for (11), which hold for the four generalized C distributions.
Theorem 1.
Equation (19) can be used to derive some mathematical properties (having intractable analytical forms) of (for ). Furthermore, as a consequence, we have expansions for the weights (which have complex forms) as linear combinations of . Proposing criteria for choosing the best based on these expansions may be a promising research branch. In particular, we obtain expressions for the central trigonometric moments of distributions with pdf (11).
Corollary 1.
Let be the pth central trigonometric moment of the model . We obtain
where
and is given in Theorem 1.
4. Estimation
This section tackles a brief discussion about maximum likelihood estimation of the parameters of the pdf family (11). Several approaches for estimating the parameters have been proposed in the literature, but the maximum likelihood method is the most commonly employed. The maximum likelihood estimates (MLEs) present desirable properties for constructing confidence intervals for the parameters. They are easily computed by using well-known platforms such as the R (optim function), SAS (PROC NLMIXED), and Ox program (MaxBFGS sub-routine)..
Let be an observed sample from a random variable having pdf (11). Thus, the associated log-likelihood function for can be expressed as (for )
The score vector follows from as
whose components are
and
Thus, the MLE of is where is the parametric space or, equivalently, the solution of the system of nonlinear equations . The compactness of the parameter space and the continuity of the log-likelihood function on are sufficient for the existence of the MLE.
The partitioned observed information matrix for the model takes the form (for )
whose elements are
for , where
and
For interval estimation of the parameters in , we obtain the Fisher information matrix (FIM) under standard regularity conditions.
For n sufficiently large, from a result in Casella and Berger [30], where is the unit FIM, “” denotes the k-dimensional multivariate normal distribution with parameters and , and “” means convergence in distribution.
However, the FIM is seldom tractable. As a solution, we can adopt instead of . This last strategy will be used in the numerical results. In the next section, the last asymptotic result will be used to determine the standard errors associated with MLEs.
5. Applications
In this section, we provide two applications to illustrate the potentiality of the proposed models. The first dataset consists of 21 wind directions obtained by a Milwaukee weather station at 6:00 a.m. on consecutive days (see [31]). The second one corresponds to the directions taken by 76 turtles after treatment addressed by Stephens [32].
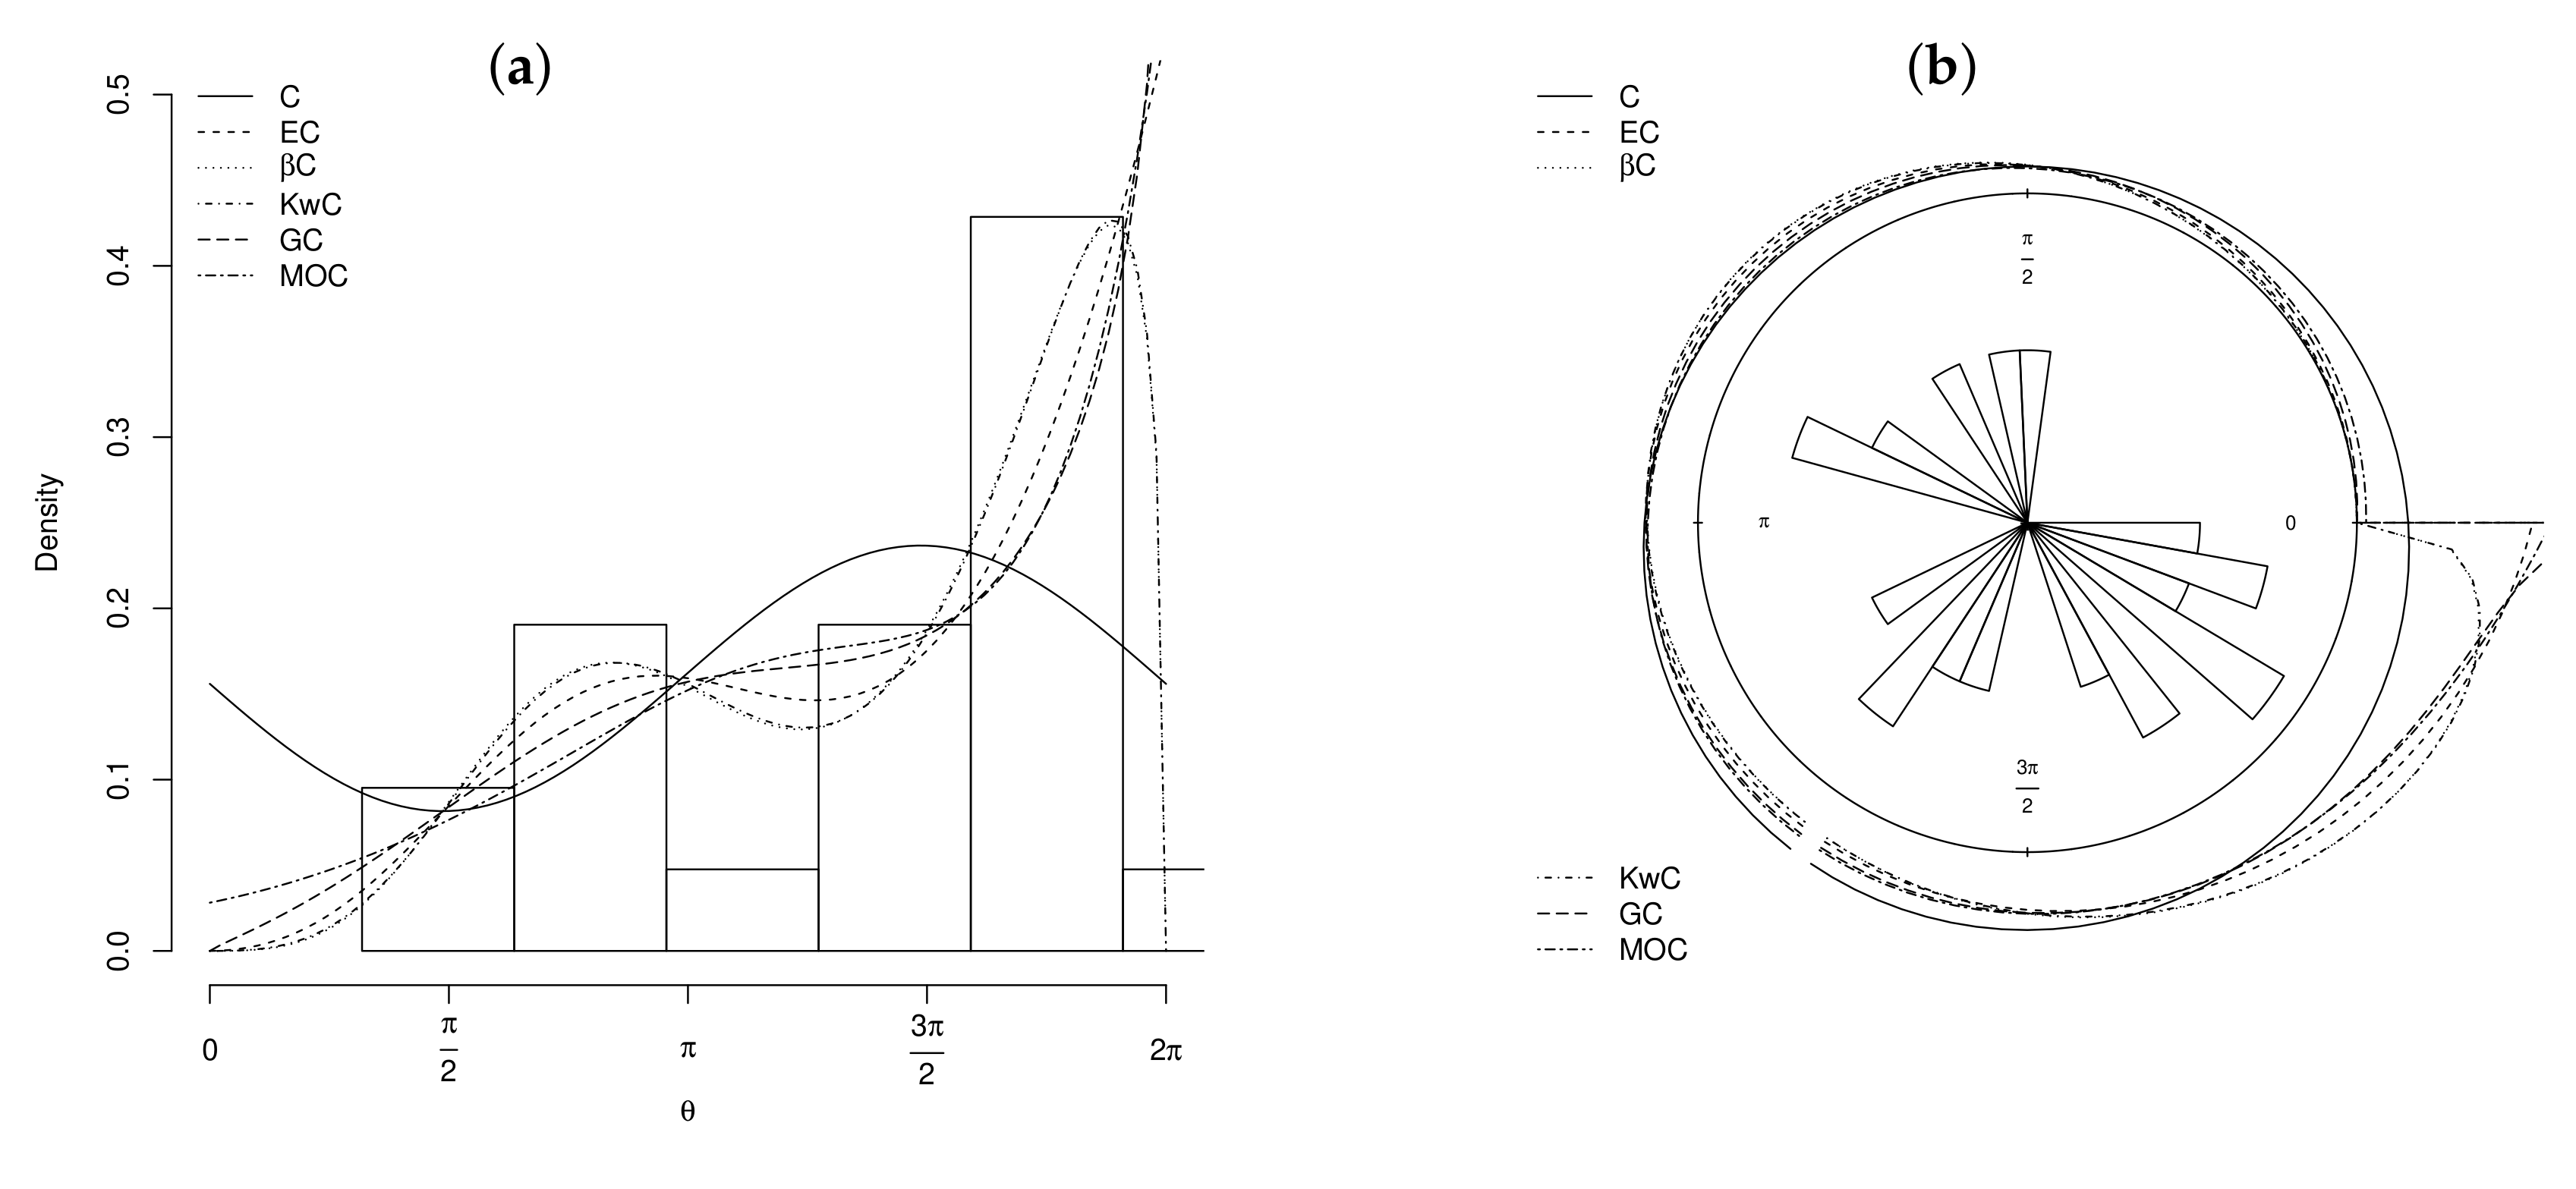
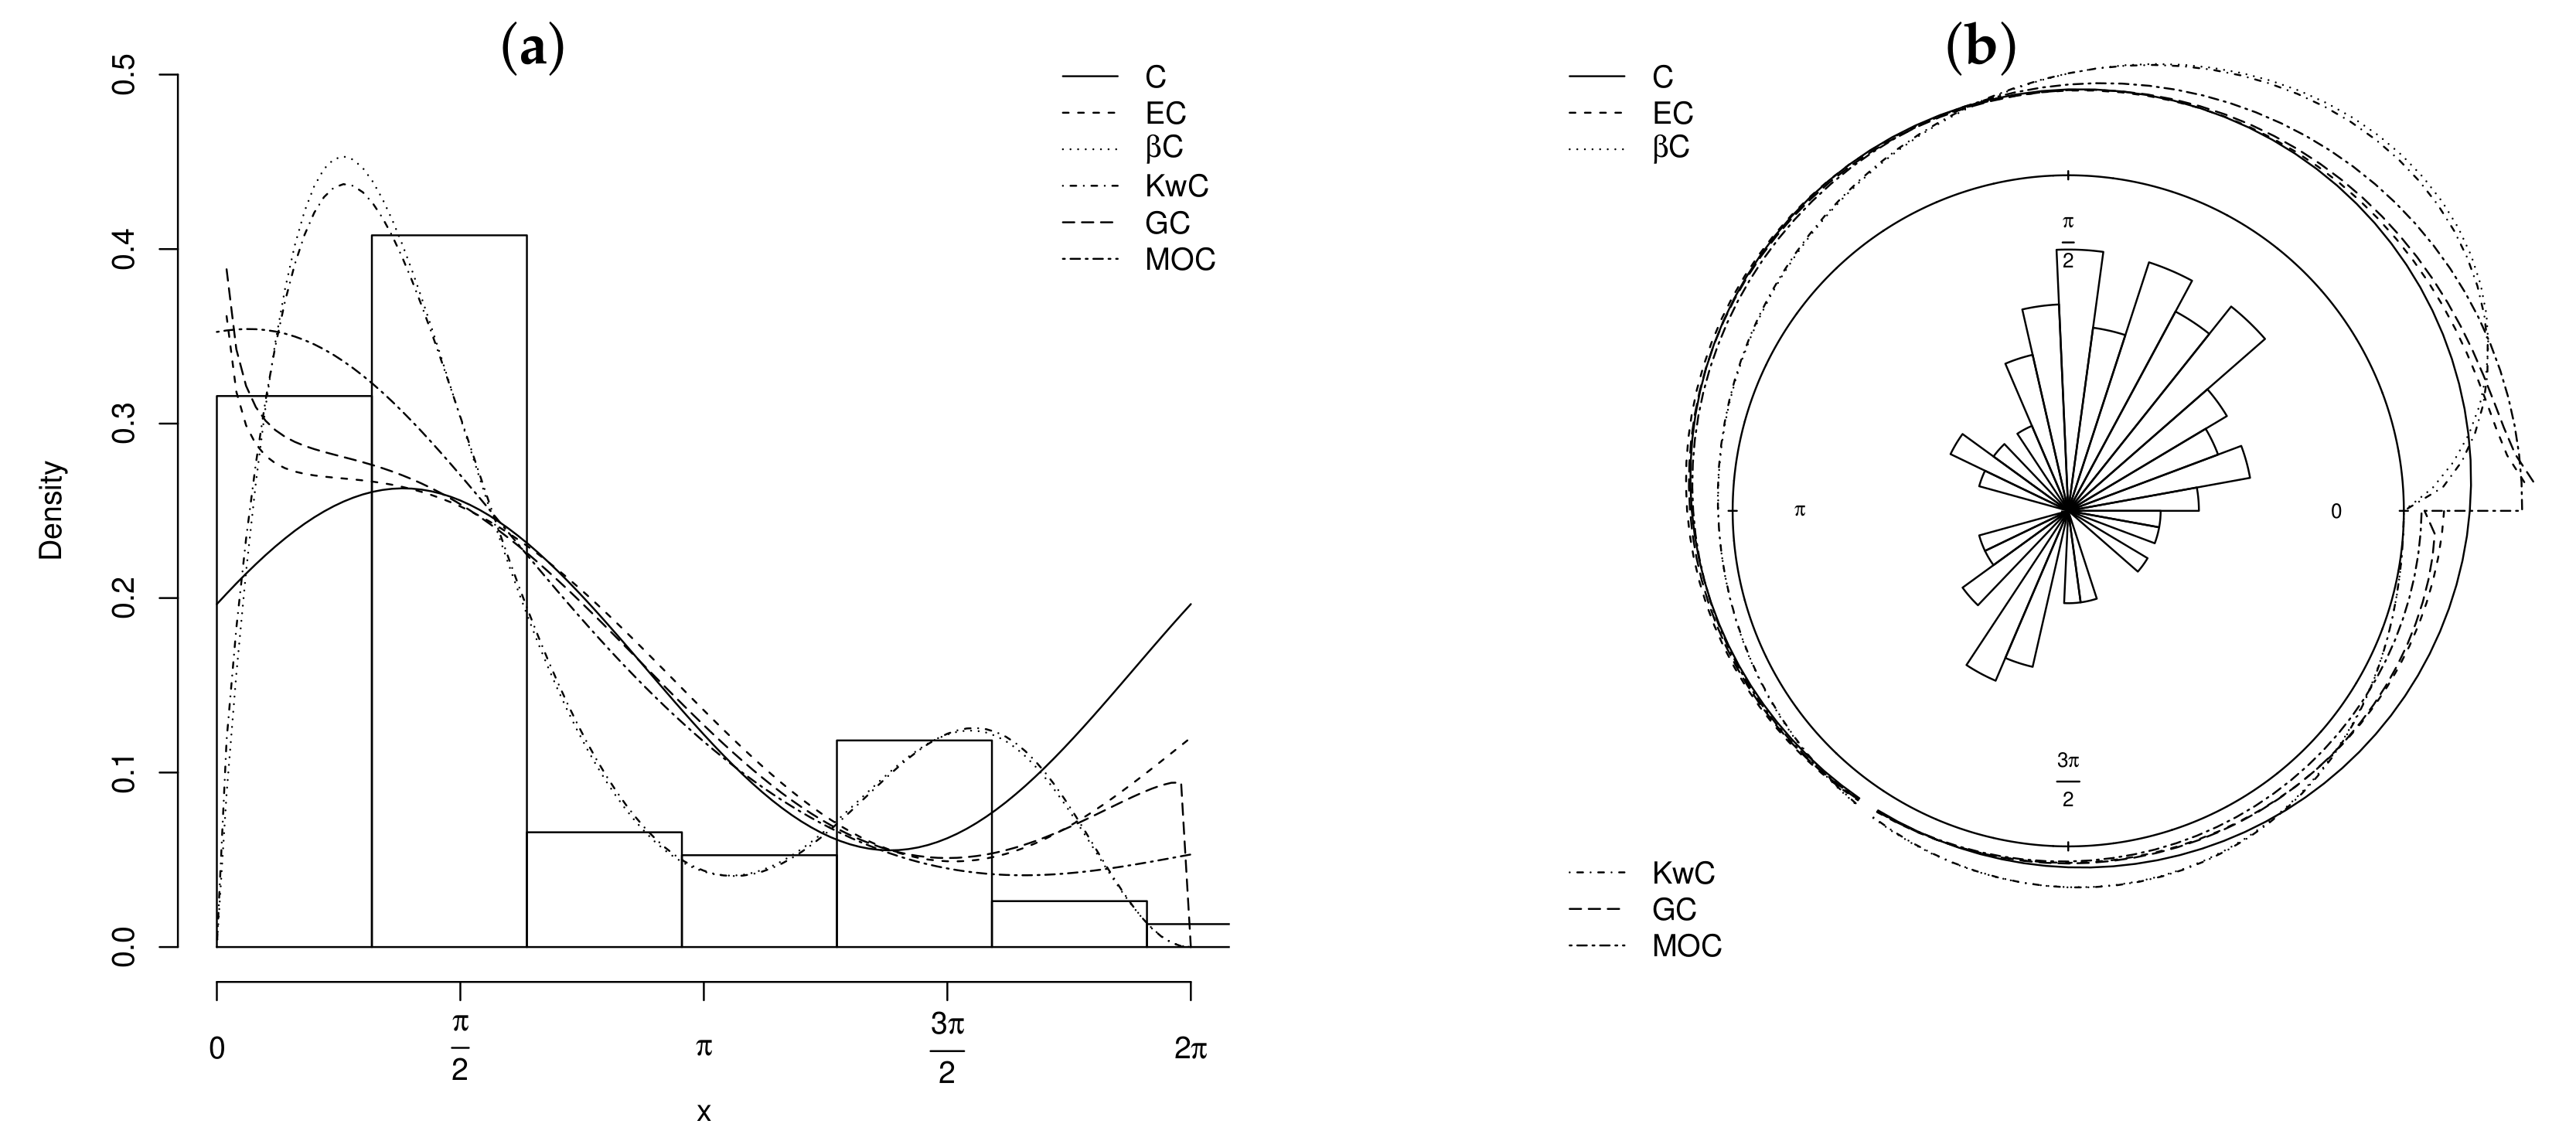
The Cartesian histograms of first and second datasets in Figure 6a and Figure 7a indicate positive () and negative () skewness, respectively. Furthermore, these datasets have bimodal shapes.
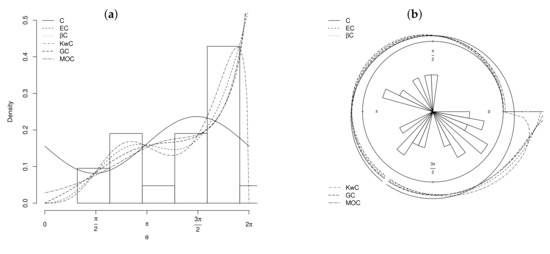
Figure 6.
Fitted densities of the C, EC, C, KwC, C, and MOC models to the first dataset. (a) histogram and (b) rose diagram.

Figure 7.
Fitted densities of the C, EC, C, KwC, C, and MOC models to the second dataset. (a) histogram and (b) rose diagram.
First, the MLEs and their SEs (given in parentheses) are evaluated and, subsequently, the values of the Kuiper (K), Watson (W), Akaike information criterion (AIC), and Bayesian information criterion (BIC) statistics. The first two adherence measures are used in the context of circular statistics and can be found in Jammalamadaka and Sengupta [23]. All computations were performed using function maxLik of the R statistical software (see [33]).
The results for the first and second datasets are reported in Table 3 and Table 4, respectively. We note that all generalized models fit both datasets better than the Cardioid model according to these statistics. For the first dataset, the EC distribution stands out according to the K, AIC, and BIC measures, while the C model yields the best fit to the dataset according to the W statistic. The C model outperforms the other models for the second dataset.
Table 3.
MLEs of the parameters for the first dataset, their standard errors (given in parentheses), and the Kuiper, Watson, AIC, and BIC statistics.
Table 4.
MLEs of the parameters for the second dataset, their standard errors (given in parentheses), and the Kuiper, Watson, AIC, and BIC statistics.
6. Conclusions
We propose four new distributions with supports on the circle. These extensions of the Cardioid (C) distribution follow by inserting this distribution in the beta-G, gamma-G, Kumaraswamy-G (Kw-G), and Marshall–Olkin-G generators, considering a specific adaptation. We derive expansions for the densities and trigonometric moments of the new models. We also discuss the maximum likelihood estimation for their parameters. Two applications illustrate the flexibility of the proposed models to fit real data.
Author Contributions
All authors discussed the results and contributed to all sections. All authors have read and agreed to the published version of the manuscript.
Funding
This research received funding from Federal University of Pernambuco, FACEPE and CNPq.
Institutional Review Board Statement
Not applicable.
Informed Consent Statement
Not applicable.
Data Availability Statement
[31,32].
Conflicts of Interest
The authors declare no conflict of interest.
References
- Astfalck, L.C.; Cripps, E.J.; Gosling, J.P.; Hodkiewicz, M.R.; Milne, I.A. Expert elicitation of directional metocean parameters. Ocean Eng. 2018, 161, 268–276. [Google Scholar] [CrossRef]
- Broly, P.; Deneubourg, J.-L. Behavioural contagion explains group cohesion in a social crustacean. PLoS Comput. Biol. 2015, 11, e1004290. [Google Scholar] [CrossRef]
- García-González, A.; Damon, A.; River, F.B.; Gosling, J.P. Circular distribution of three species of epiphytic orchids in shade coffee plantations, in Soconusco, Chiapas, Mexico. Plant Ecol. Evol. 2016, 149, 189–198. [Google Scholar] [CrossRef]
- Gatto, R. Saddlepoint approximations to tail probabilities and quantiles of inhomogeneous discounted compound poisson processes with periodic intensity functions. Methodol. Comput. Appl. Probab. 2012, 14, 1053–1074. [Google Scholar] [CrossRef]
- Marshall, A.W.; Olkin, I. A new method for adding a parameter to a family of distributions with application to the exponential and Weibull families. Biometrika 1977, 84, 641–652. [Google Scholar] [CrossRef]
- Eugene, N.; Lee, C.; Famoye, F. Beta-normal distribution and its applications. Commun. Stat. Theory Methods 2002, 31, 497–512. [Google Scholar] [CrossRef]
- Zografos, K.; Balakrishnan, N. On families of beta-and generalized gamma-generated distributions and associated inference. Stat. Methodol. 2009, 6, 344–362. [Google Scholar] [CrossRef]
- Cordeiro, G.M.; Castro, M. A new family of generalized distributions. J. Stat. Comput. Simul. 2011, 6, 883–898. [Google Scholar] [CrossRef]
- Cordeiro, G.M.; Ortega, E.M.; Cunha, D.C. The exponentiated generalized class of distribution. J. Data Sci. 2013, 11, 1–27. [Google Scholar] [CrossRef]
- Cordeiro, G.M.; Alizadeh, M.; Marinho, P.R.D. The type I half-logistic family of distributions. J. Stat. Comput. Simul. 2016, 86, 707–728. [Google Scholar] [CrossRef]
- Yousof, H.M.; Afify, A.Z.; Hamedani, G.; Aryal, G.R. The Burr X generator of distributions for lifetime data. J. Stat. Theory Appl. 2016, 16, 288–305. [Google Scholar] [CrossRef] [Green Version]
- Cordeiro, G.M.; Afify, A.Z.; Yousof, H.M.; Pescim, R.R.; Aryal, G.R. The exponentiated Weibull-H family of distributions: Theory and applications. Mediterr. J. Math. 2017, 14, 155–176. [Google Scholar] [CrossRef]
- Lee, J.-S.; Hoppel, K.W.; Mango, S.A.; Miller, A.R. Intensity and phase statistics of multilook polarimetric and interferometric SAR imagery. IEEE Trans. Geosci. Remote Sens. 1994, 32, 1017–1028. [Google Scholar]
- Breckling, J. The Analysis of Directional Time Series: Applications to Wind Speed and Direction; Springer: Berlin/Heidelberg, Germany, 1989. [Google Scholar]
- Jeffreys, H. Theory of Probability; Oxford University Press: Oxford, UK, 1983. [Google Scholar]
- Wang, M.Z.; Shimizu, K. On applying Möbius transformation to Cardioid random variables. Stat. Methodol. 2012, 9, 604–614. [Google Scholar] [CrossRef]
- Abe, T.; Pewsey, A.; Shimizu, K. On Papakonstantinou’s extension of the Cardioid distribution. Stat. Probab. Lett. 2009, 79, 2138–2147. [Google Scholar] [CrossRef]
- Paula, F.V.; Nascimento, A.D.C.; Amaral, G.J.A. A new extended Cardioid model: An application to wind data. Submitt. J. Math. Imaging Vis. 2020. [Google Scholar]
- Jamal, F.; Chesneau, C.; Bouali, D.L.; Ul Hassan, M. Beyond the Sin-G family: The transformed Sin-G family. PLoS ONE 2021, 16, e0250790. [Google Scholar] [CrossRef] [PubMed]
- Souza, L.; Júnior, W.R.O.; Brito, C.C.R.; Chesneau, C.; Ferreira, T.A.E.; Soares, L.G.M. General properties for the Cos-G Class of Distributions with Applications. Eurasian Bull. Math. 2019, 2, 63–79. [Google Scholar]
- Abraham, C.; Molinari, N.; Servien, R. Unsupervised clustering of multivariate circular data. Stat. Med. 2013, 32, 1376–1382. [Google Scholar] [CrossRef] [PubMed] [Green Version]
- Qiu, X.; Wu, S.; Wu, H. A new information criterion based on langevin mixture distribution for clustering circular data with application to time course genomic data. Stat. Sin. 2015, 25, 1459–1476. [Google Scholar] [CrossRef]
- Jammalamadaka, S.R.; Sengupta, A. Topics in Circular Statistics; World Scientific Publishing: Singapore, 2001. [Google Scholar]
- Mardia, K.V.; Sutton, T.W. On the modes of a mixture of two von Mises distributions. Biometrika 1975, 62, 699–701. [Google Scholar] [CrossRef]
- Yilmaz, A.; Biçer, C. A new wrapped exponential distribution. Math. Sci. 2018, 12, 285–293. [Google Scholar] [CrossRef] [Green Version]
- Pewsey, A.; Neuhäuser, M.; Ruxton, G. Circular Statistics in R; Oxford University Press: Oxford, UK, 2013. [Google Scholar]
- Nadarajah, S.; Cordeiro, G.M.; Ortega, E.M. General results for the beta-modified Weibull distribution. J. Stat. Comput. Simul. 2011, 81, 1211–1232. [Google Scholar] [CrossRef]
- Castellares, F.; Lemonte, A.J. A new generalized weibull distribution generated by gamma random variables. J. Egypt. Math. Soc. 2015, 23, 382–390. [Google Scholar] [CrossRef] [Green Version]
- Cordeiro, G.M.; Lemonte, A.J.; Ortegam, E.M. The Marshall–Olkin family of distributions: Mathematical properties and new models. J. Stat. Theory Pract. 2014, 8, 343–366. [Google Scholar] [CrossRef]
- Casella, G.; Berger, R. Statistical Inference; Thomson Learning: Boston, MA, USA, 2002. [Google Scholar]
- Johnson, R.A.; Wehrly, T. Measures and models for angular correlation and angular-linear correlation. J. R. Stat. Soc. (Ser. B) 1977, 39, 222–229. [Google Scholar] [CrossRef] [Green Version]
- Stephens, M.A. Techniques for Directional Data; Stanford University: Stanford, CA, USA, 1969. [Google Scholar]
- Henningsen, A.; Toomet, O. maxlik: Package for maximum likelihood estimation in R. Comput. Stat. 2011, 26, 443–458. [Google Scholar] [CrossRef]
Publisher’s Note: MDPI stays neutral with regard to jurisdictional claims in published maps and institutional affiliations. |
© 2021 by the authors. Licensee MDPI, Basel, Switzerland. This article is an open access article distributed under the terms and conditions of the Creative Commons Attribution (CC BY) license (https://creativecommons.org/licenses/by/4.0/).