1. Introduction
The high confinement or H-mode [
1] is the operational scenario for the next-step device ITER [
2]. The edge, radial plasma temperature, and density profiles steepen following the transition from L-mode to H-mode, leading to a reduced core plasma pressure peaking factor, which allows higher stored energy limits [
3,
4]. In addition, the associated steep edge pressure gradients drive a substantial bootstrap current that reduces the need for the current drive [
5]. While enhanced stored energy and the bootstrap current are advantages of H-mode, the steep H-mode pressure gradients are also characterized by periodic pedestal collapse known as edge localized modes (ELMs), which release high energy plasma particles to the plasma facing materials.
H-modes are typically accessed when the input heating power crosses a threshold value, leading to a bifurcation in the edge plasma state, with edge or pedestal radial electron density,
ne, temperature,
Te, and pressure,
Pe, profiles steepening, and a substantial reduction in the edge plasma turbulence. While the trigger mechanism for the L–H transition has remained elusive, the minimum heating power needed to access the H-mode, the L–H power threshold,
Pth, has been compared across conventional aspect ratio tokamak devices and the main parametric dependence has been derived to be [
6,
7]:
where,
is the plasma line average density (×10
20 m
−3),
Bt is the toroidal magnetic field at the magnetic axis (T), and
SA is the plasma boundary surface area (m
2).
In addition to these global parameters, it is known that each device H-mode access
Pth has other dependences, which are referred to as “hidden variables”. These include variations in the plasma boundary shape (number of X-points, magnetic balance, radial, poloidal, vertical location of the X-points, and plasma elongation), plasma ion species, applied 3D non-axisymmetric fields, wall conditioning techniques, and neutrals. The dependences of the L–H and H–L transition
Pth on these hidden variables are receiving renewed interest because of the anticipated heating power availability on ITER, and the requirement to access and remain in the H-mode early in ITER operation in hydrogen or helium plasmas, prior to high activation phases with deuterium and tritium [
7,
8].
Motivated by the need to further understand and control H-mode access on future tokamaks and in preparation for upcoming experiments on MAST-U, the
Pth for the L–H and H–L transitions dependence of MAST on the X-point height has been analyzed and is presented here. A wider dataset of plasmas has been included in this study to explore the X-point height operation space in more detail than has been presented in previous papers on this topic. The paper is structured as follows:
Section 2 describes the experimental set-up, the data analysis for the
Pth and pedestal parameter dependence on
; the results from a study on the effect of X-point height on
Pth are presented in
Section 3 and a comparison of the pedestal parameters is made the finite beta drift wave model [
9] for zonal flow suppression of turbulence at the L–H transition in
Section 4. Finally, the main conclusions from the study are summarized in
Section 5.
2. Density Dependence
The L–H and H–L transition times have been identified for a series of plasmas to study MAST H-mode access and exit dependencies on core plasma
ne on MAST which had a major radius,
R = 0.85 m and minor radius,
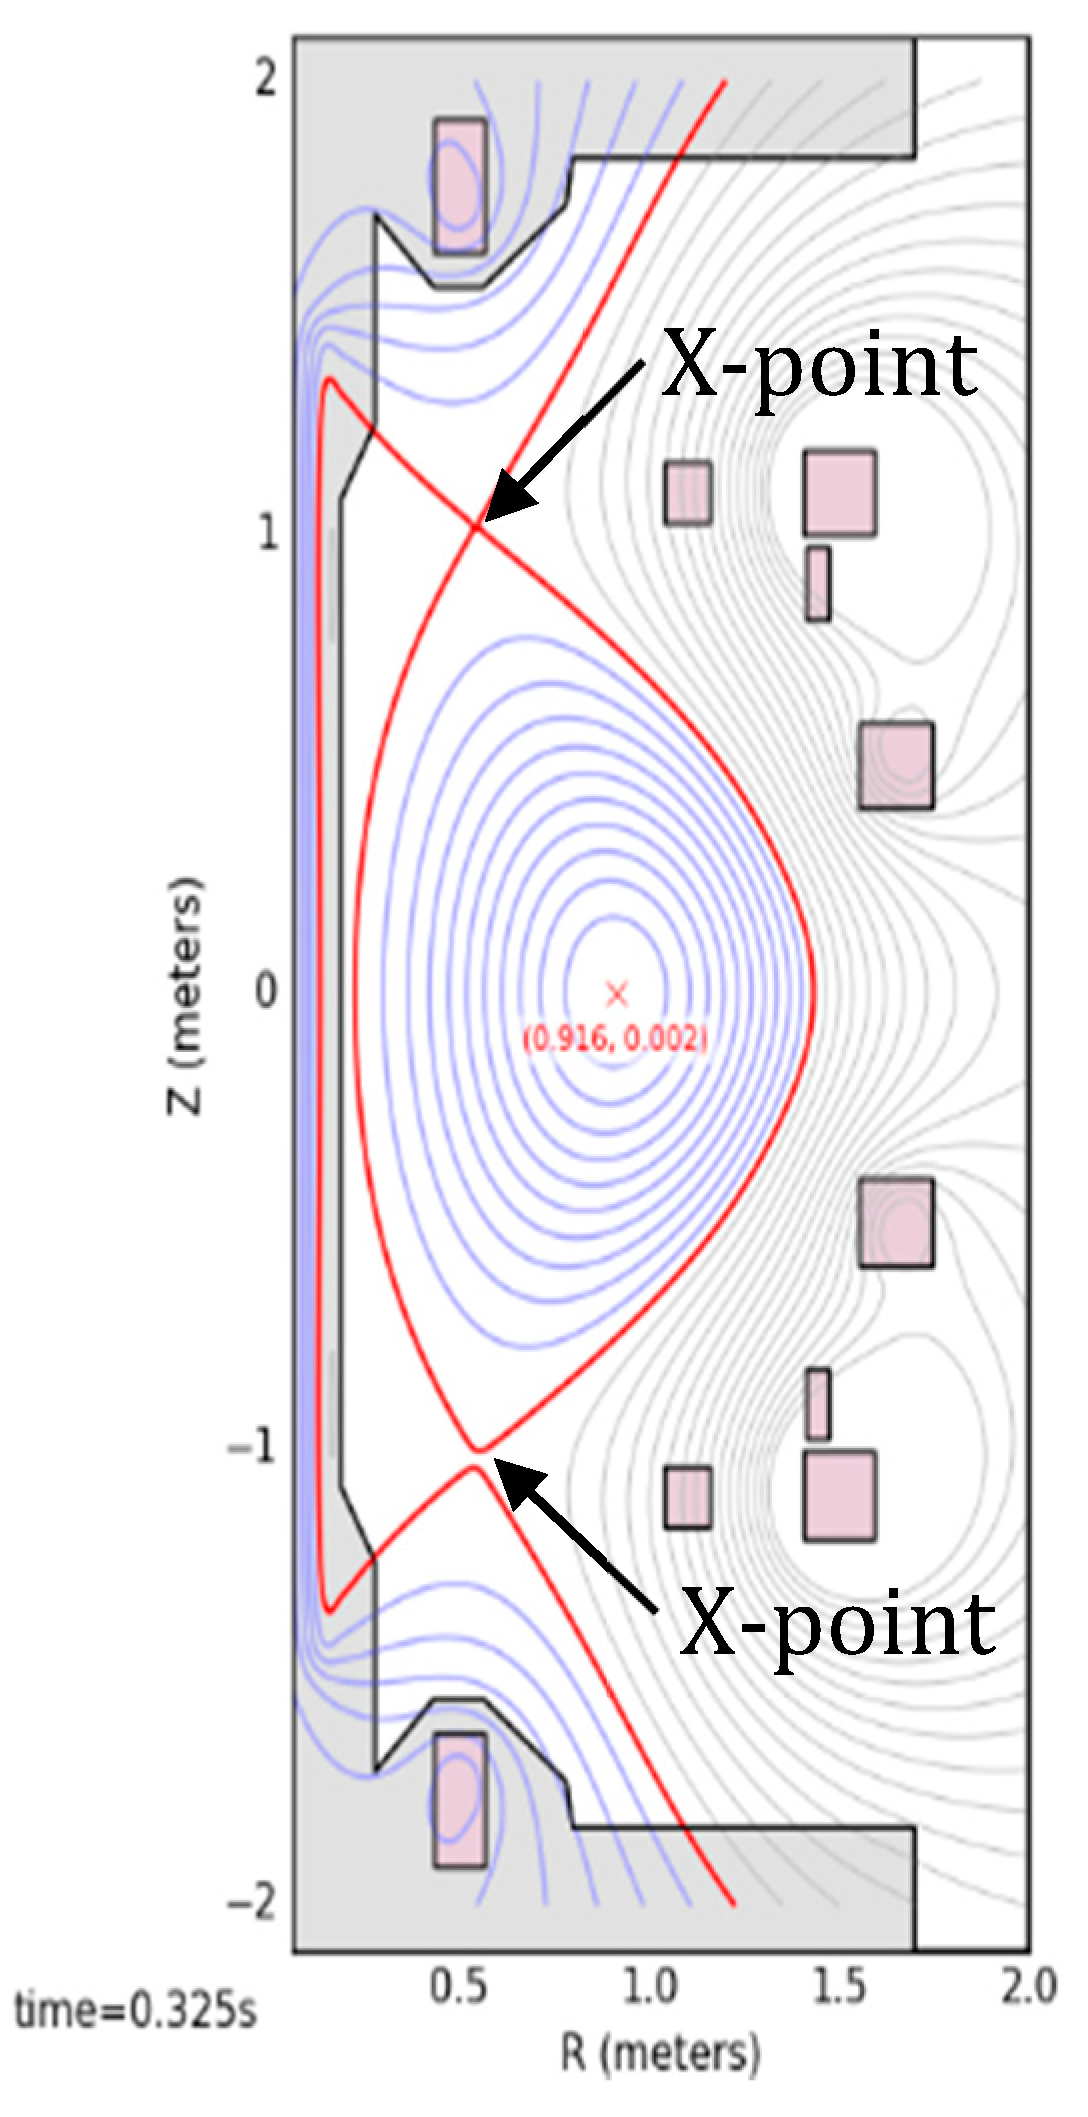
a = 0.65 m. These shots were run with high field side (HFS) deuterium fueling in the connected double null diverted (CDND) magnetic configuration, an example of which is shown in
Figure 1, in which most MAST H-modes were accessed [
10,
11,
12,
13]. The L-mode target density was controlled using active feedback, while neutral beam injection was constant in each shot and varied from shot to shot by a minimum of 0.2 MW. It is important to note that a minimum density for accessing H-mode on MAST was typically set by the occurrence of low-density locked modes (in the region of
ne = 1.5 × 10
19 m
−3, at plasma current of
Ip = 0.65 MA and at increasing
ne with
Ip.) The results presented in this paper were above the locked mode density minimum.
All shots included for the density scan study had
Ip/Bt values of 0.70 MA/0.45 T. The threshold power for H-mode access and exit is defined in this study as:
at the L–H and H–L transitions, where
is the total additional (NBI) heating power,
is the ohmic power, and
is the rate of change of the stored plasma energy. In the absence of the availability of power ramps for these shots, the fluctuations in the plasma density and net input power, defined in Equation (2), were taken to provide sufficient variation in plasma parameters to cause the transitions and provide a measurement of the power threshold at the forward and back H-mode transitions and the associated pedestal parameters.
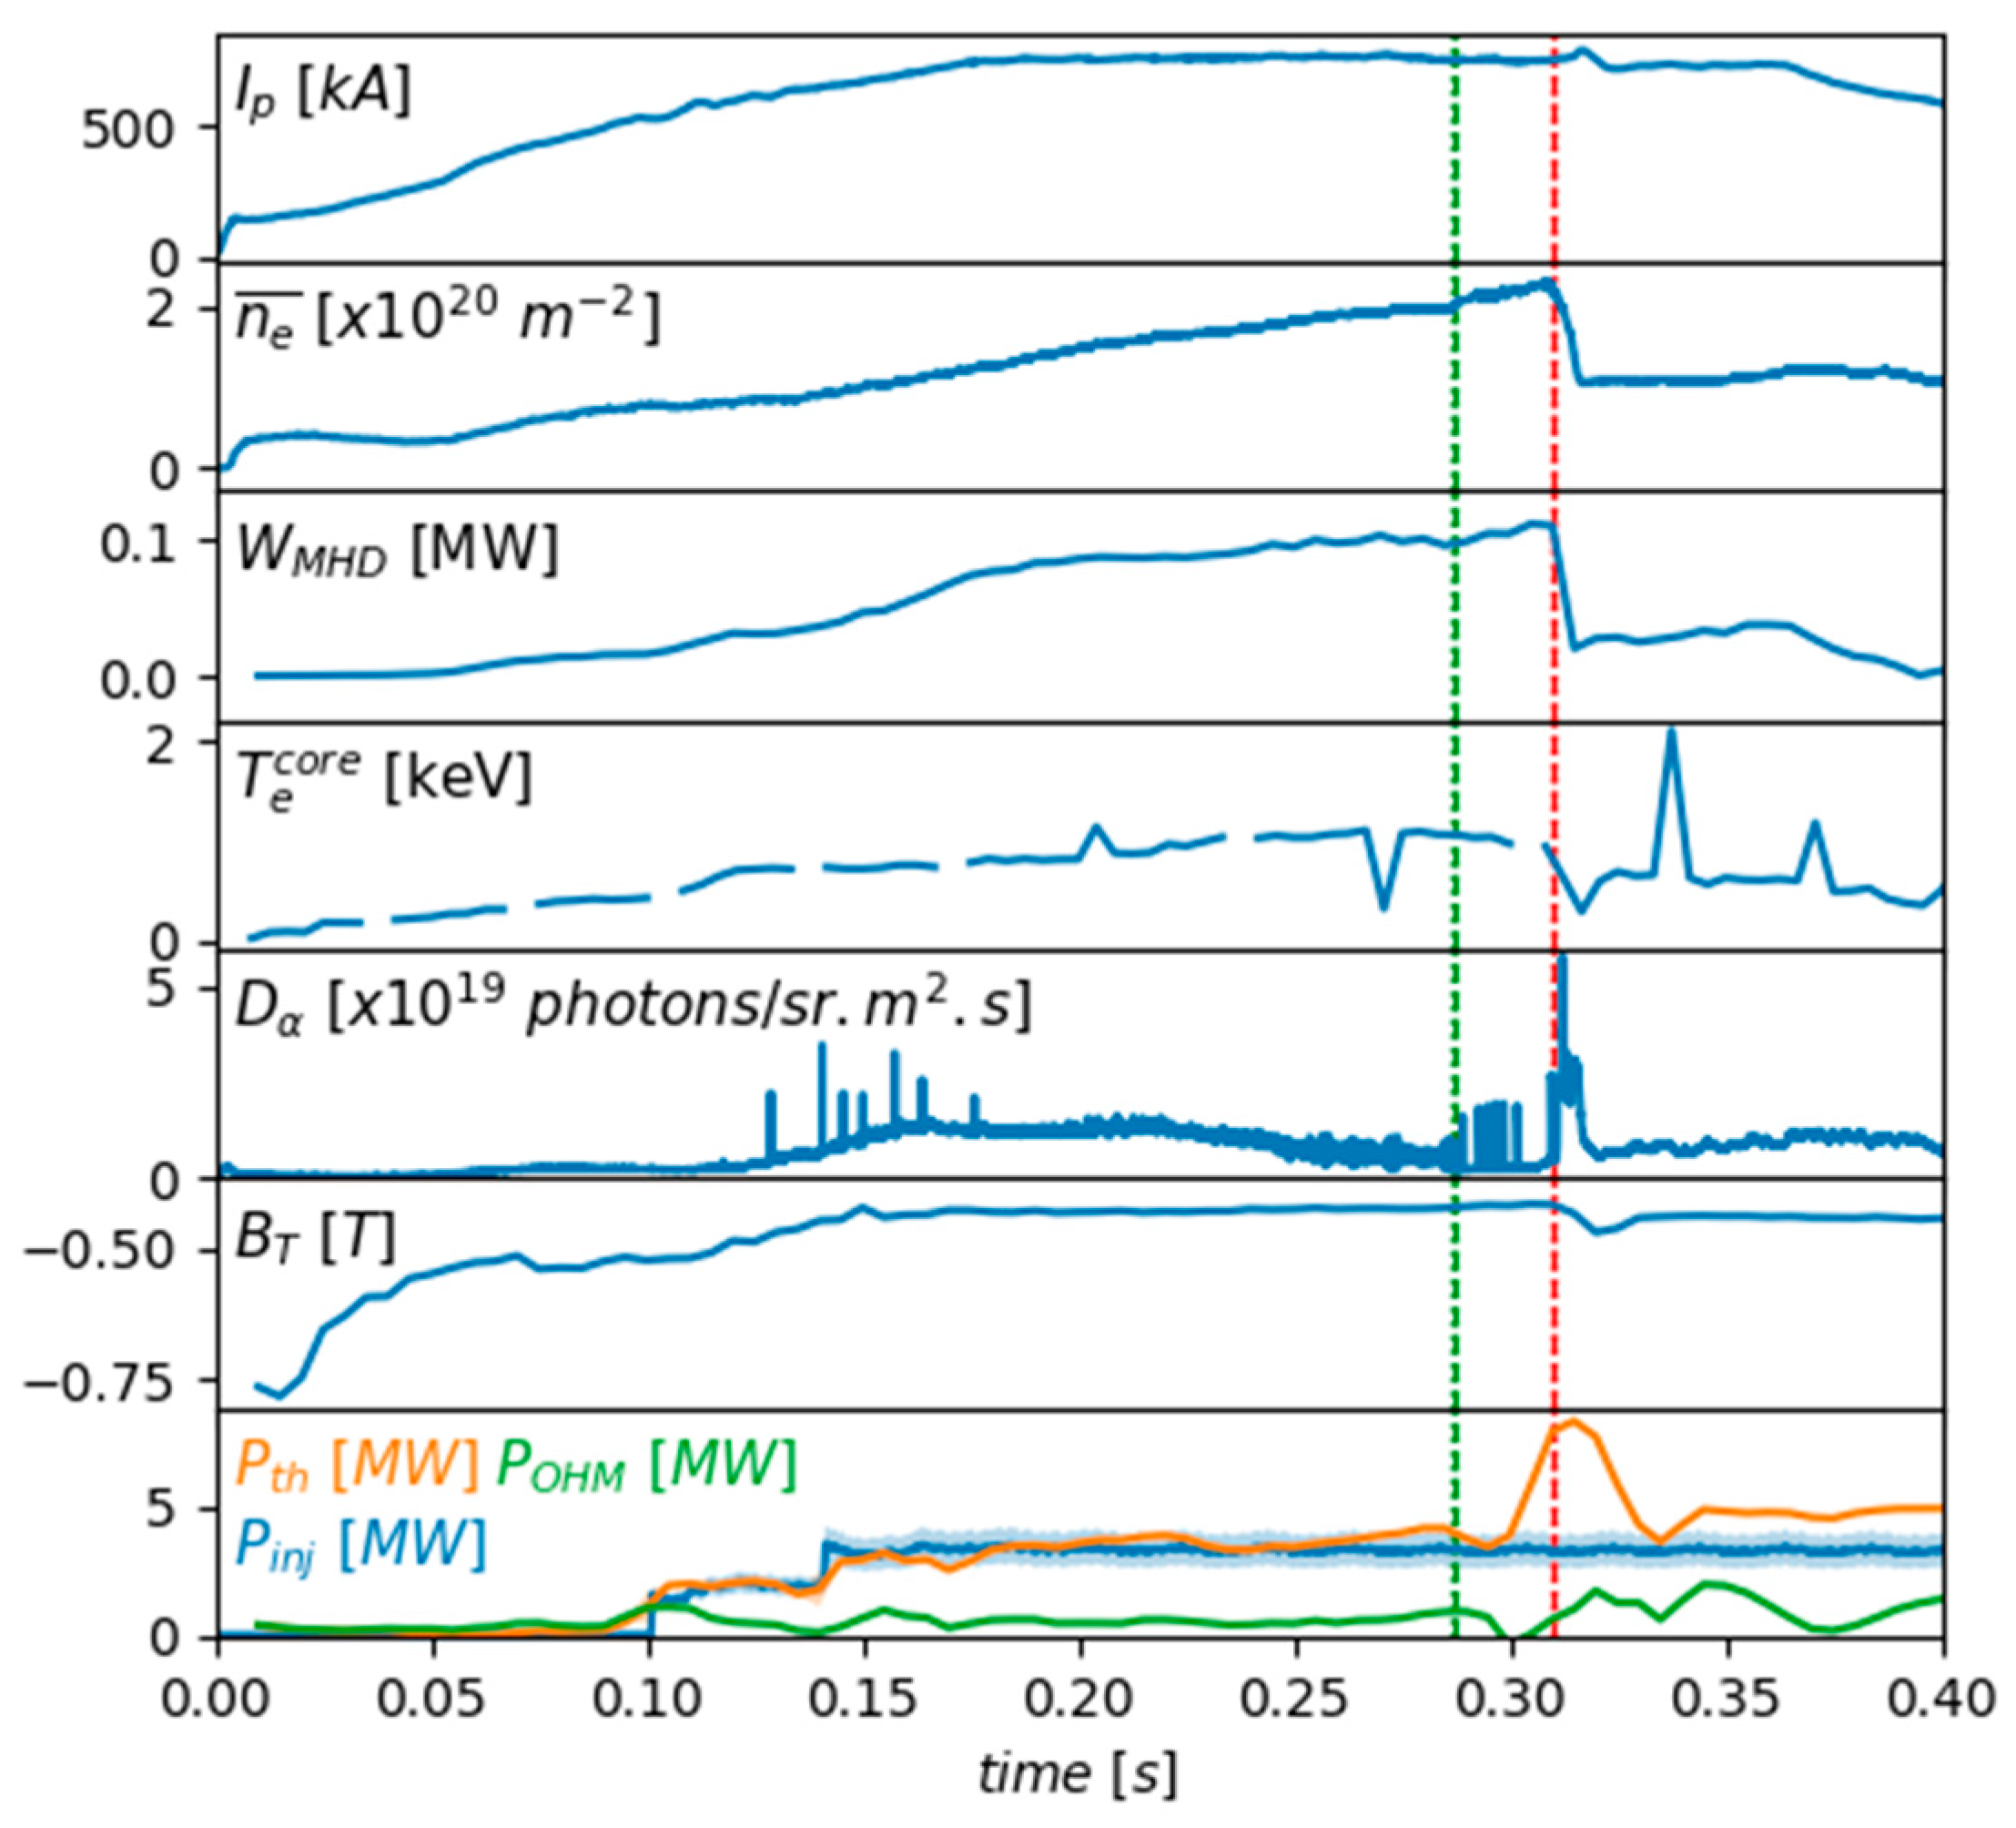
The general plasma parameters for a typical shot with a forward and back transition is shown in
Figure 2. The L–H transition is taken as the point at which a sharp drop in the divertor D
α signal occurs along with a sharp rise in the core
ne and the stored plasma energy, W. Many of these L–H transitions are preceded by a dithering or intermediate phase, in which some oscillations in the divertor D
α signal occurs or possibly very high frequency, very small ELMs, as indicated in
Figure 2. The transition into these intermediate phases have not been considered in the analysis carried out for this study. The transitions out of the H-mode have similar signal signatures but in reverse, many H–L transitions are also triggered by large ELMs or MHD events, from which the confinement does not subsequently recover.
The pedestal electron density,
, and temperature,
, in these shots has been measured with a multi-radial point, multi-time edge Thomson scattering diagnostic with a radial resolution of
ΔR = 10 mm [
14,
15,
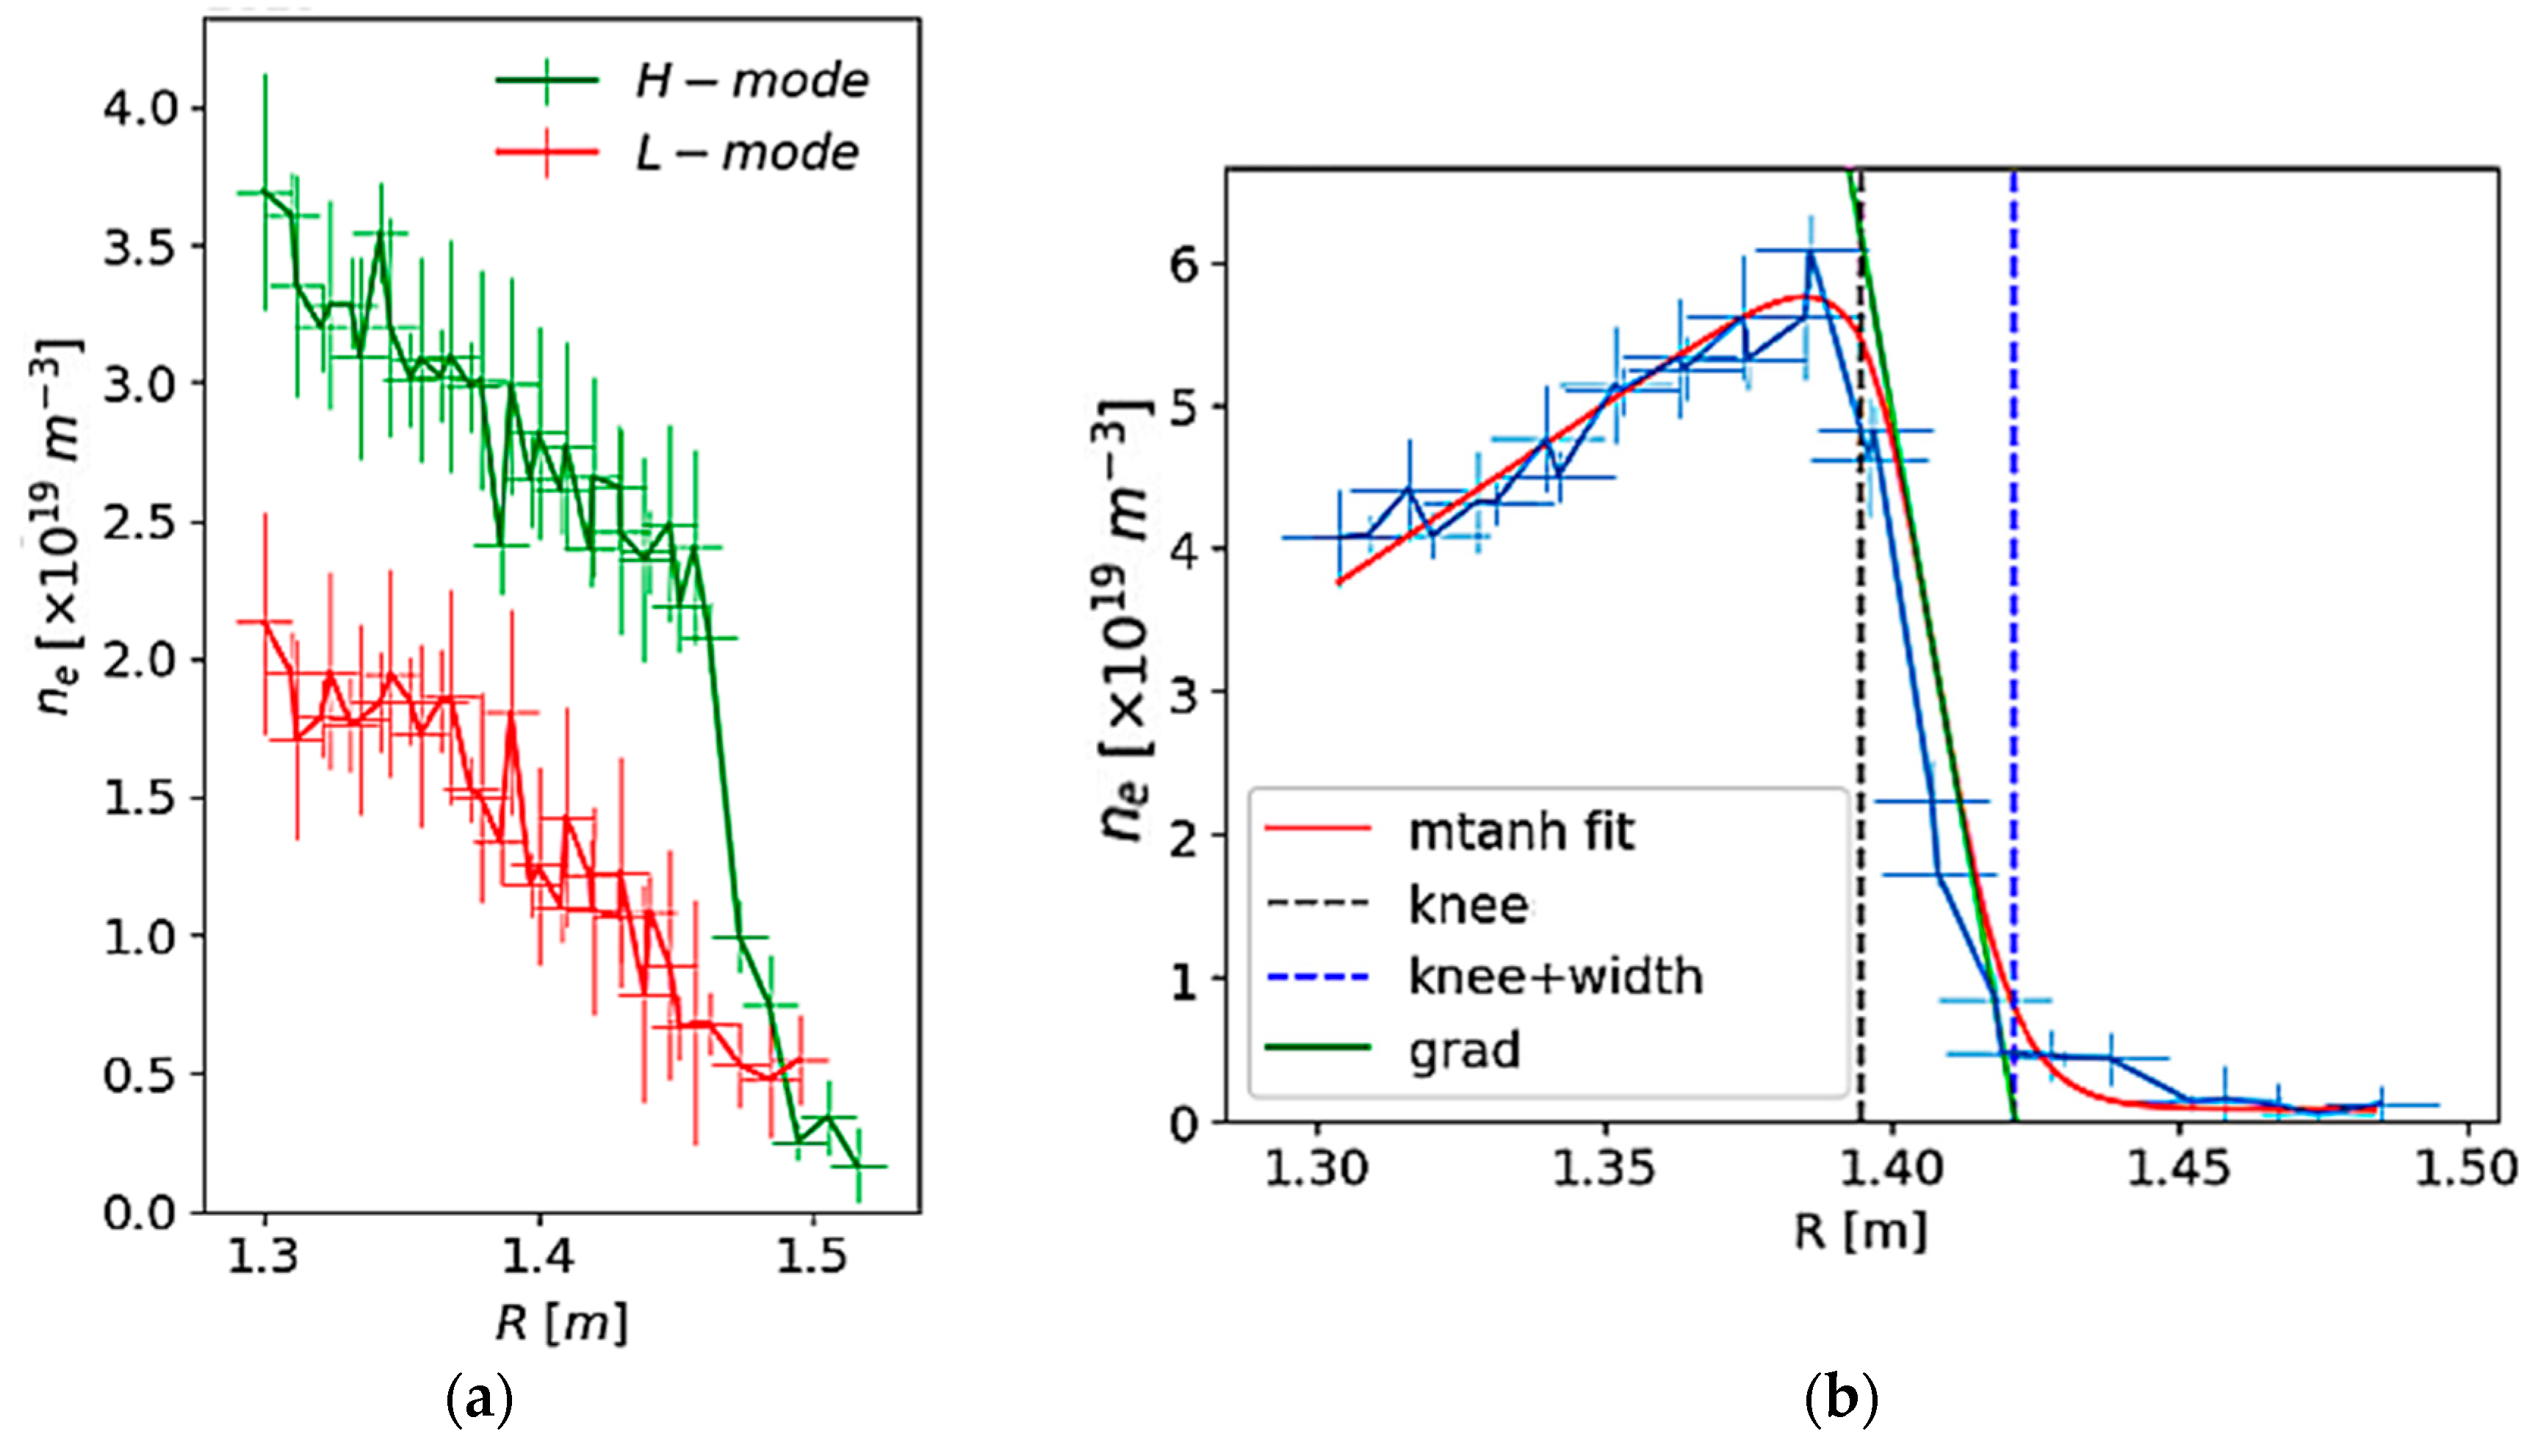
16]. Example low field side L-mode and H-mode Thomson scattering diagnostic measured
ne profiles are shown in
Figure 3a. A modified hyperbolic tangent function, which includes an additional quadratic term, has been used to fit the pedestal data [
17], as shown in
Figure 3a,b. These fits to the pedestal data have been to identify the parameters and regions of interest in the edge plasma. A weak density pedestal often develops prior to the L–H transition, both in the absence and presence of the dithering or intermediate phases. These
ne profiles have been used to identify the pedestal top or “knee” and the region of steepest density gradient, as close to and prior to the L–H and H–L transitions. The corresponding value of
Te at these radial locations (the knee and the steepest
ne gradient) have then been used in the subsequent analysis. For the back transitions, the pedestal values have been taken in H-mode, as close to the transition as possible. The H–L parameters are therefore more easily identifiable and have smaller fitting errors due to the often much stronger pedestal shape in the H-mode, as shown in
Figure 3a.
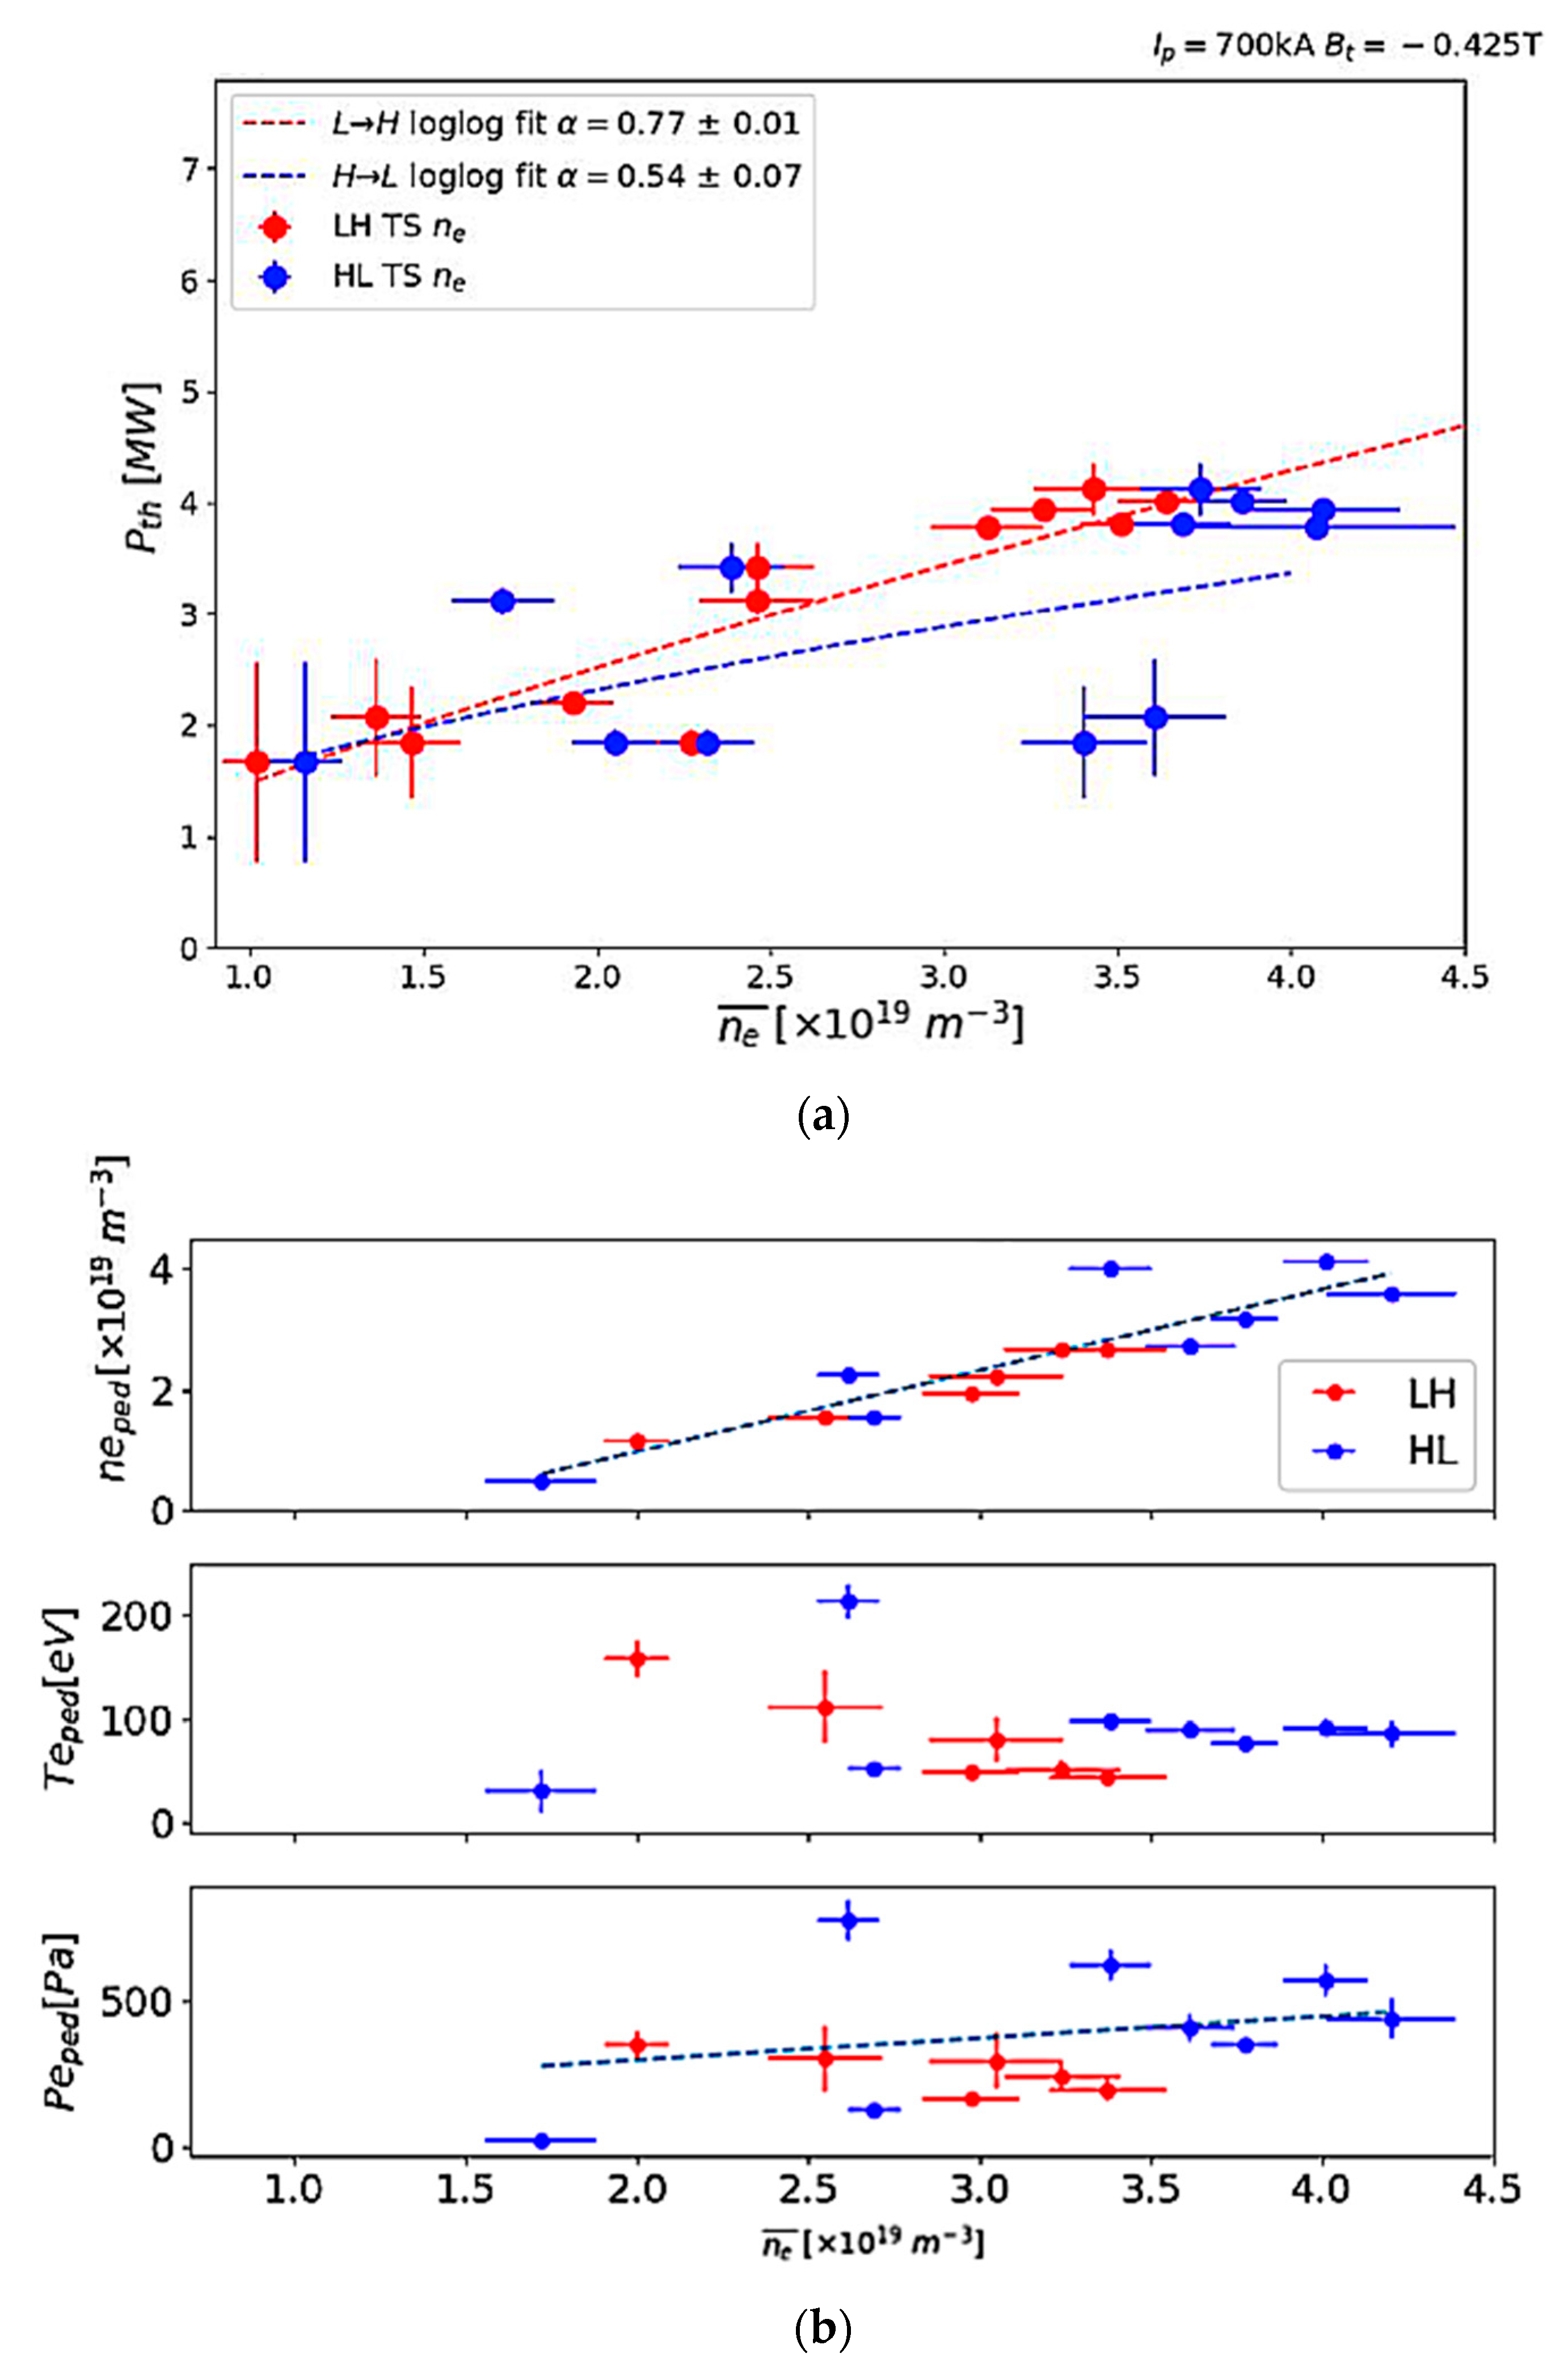
The values of the power threshold,
Pth, for the L-H and H-L transitions,
PLH and
PHL, are shown in
Figure 4a as a function of averaged core
along with pedestal values in
Figure 4b of
,
, and
, taken at the pedestal knee, over a similar density range. The
PLH shows an increase of a factor of two over the density range of 1–4 × 10
19 m
−3, while the smaller
PHL dataset indicates a weaker density dependence. Fits to these data provide the following dependences on the core density:
Due to the limited amount of data available for the L–H transition, a linear PLH dependence on is used for the rest of the analysis presented in this paper. It is interesting to note that there is no indication of a low-density turning point in either PLH or PHL over this density range, indicating that it lies in the high-density, linear branch of H-mode access.
Despite the increase in the threshold power, for both L–H and H–L transitions, from 1.8 MW to 4 MW with the increase in core
and
, the pedestal temperature,
, shows very little variation with values at around 100 eV across the density range, as shown in
Figure 4b. The dependence of the pedestal pressure,
, on the core
is dominated by the linear dependence on
These results are interpreted as a further indication that a threshold in edge region
Te or a related parameter such as the pedestal ion temperature,
Ti, or the radial electric field,
Er, is important for H-mode access [
18,
19,
20]. The very weak dependence of
on both core and pedestal
ne also confirms that the density range considered is in the high density, linear H-mode branch [
19,
21,
22]. In the absence of spatially resolved pedestal ion temperature and rotation velocity measurements, it is not possible to comment further on whether the pedestal electron or ion channel is the dominant player in the L–H and H–L transition.
3. X-Point Height Dependence
Data have been analyzed for CDND shots with different X-point heights at = 0.53 T. Both the upper and lower X-point heights were varied by the same amount over these scans, resulting in associated changes to the magnetic elongation. The lower strike points remained on the horizontal floor of the open MAST divertor for the entire X-point height scan. Hence, the scrape-off layer (SOL) connection length also varied over the X-point height variation.
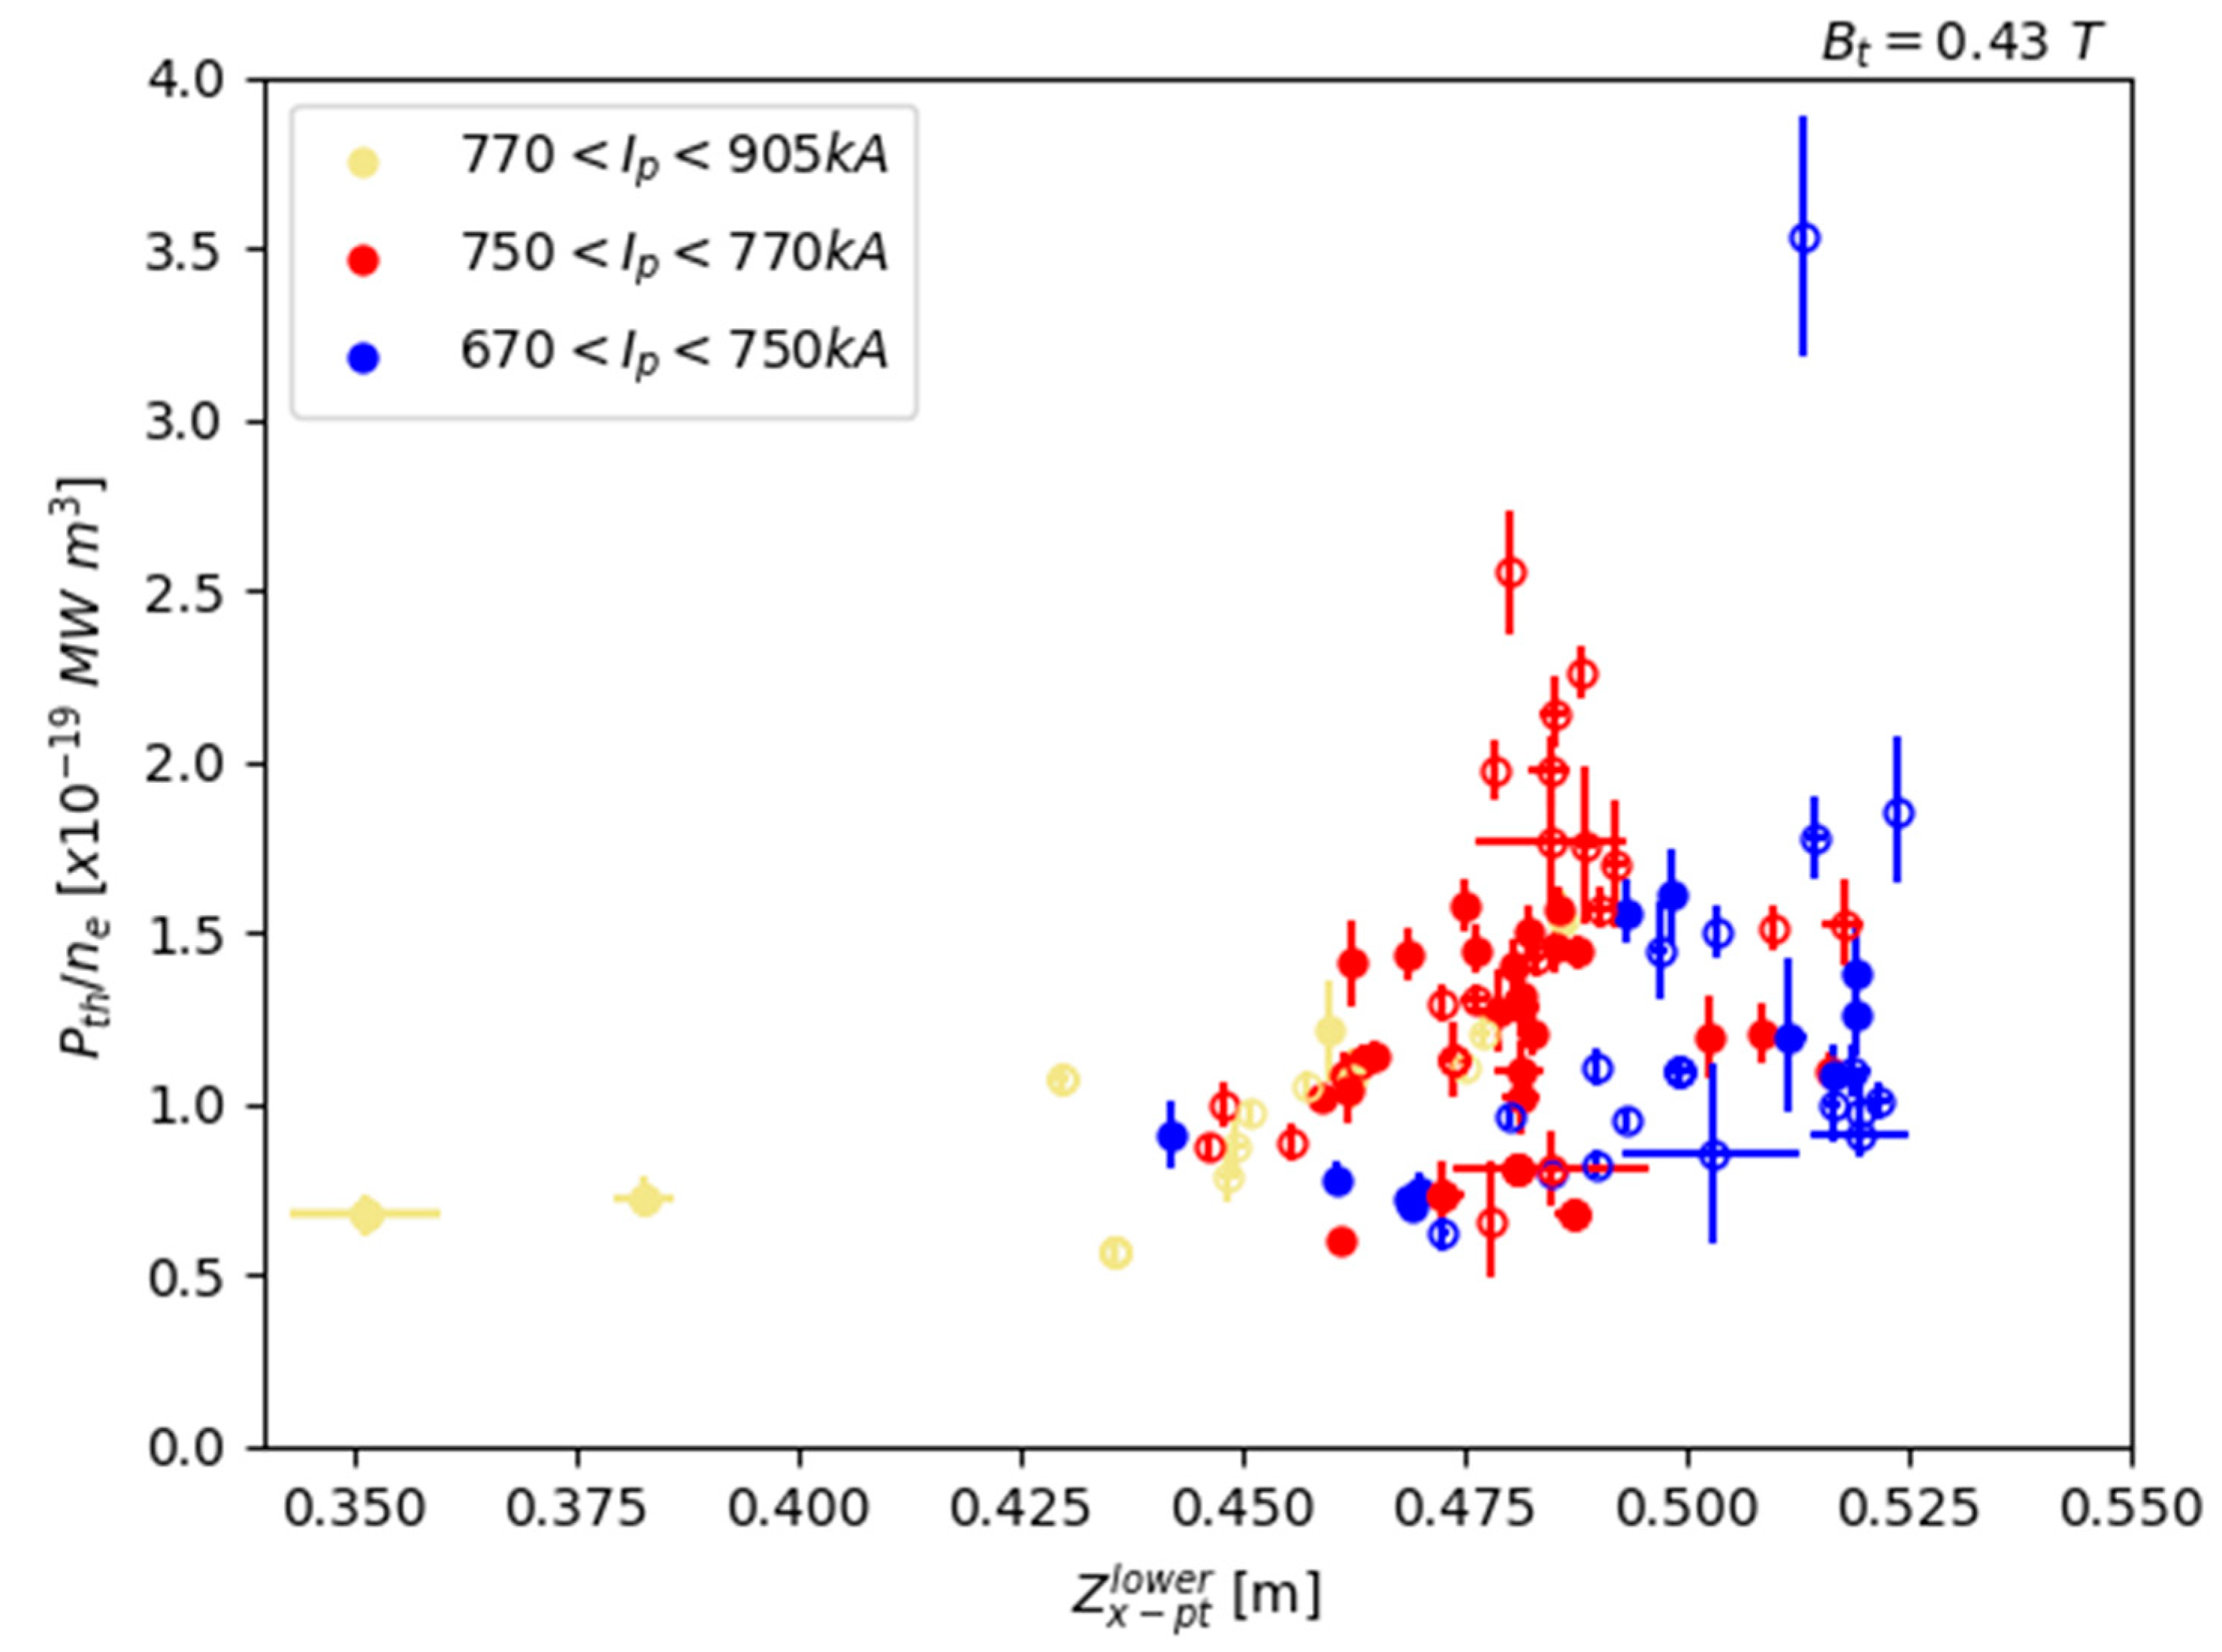
The values of
Pth at the L–H and H–L transitions (
PLH and
PHL) have been normalized to
, and are plotted as a function of lower X-point distance from the divertor floor for the values of
,
and
, in
Figure 5. The power threshold for H-mode access and exit increases by a factor of three as the lower X-point distance from the divertor floor increases from 0.38–0.48 m for
Ip = 0.67–0.75 MA and from 0.38–0.50 m for
Ip = 0.75–0.91 MA. The linear dependence of
Pth on X-point height disappears for heights above 0.50 m. This is in agreement with earlier results presented from MAST for a smaller X-point height range and limited dataset for single null and double null magnetic configurations [
14]. Previous studies on the Joint European Torus (JET) have also shown a similar trend of reduced
Pth with lowered X-point height was only observed for discharges with the X-point less than 6 cm from the septum top and the inner and outer strike points and SOL on the horizontal targets [
22]. The X-point height dependence of the
Pth is also shown to be sensitive to the plasma current, decreasing
Ip from 0.77 MA to 0.65 MA lower
Pth by a factor of three and shifting the
Pth roll-over height by 3 cm to a higher value.
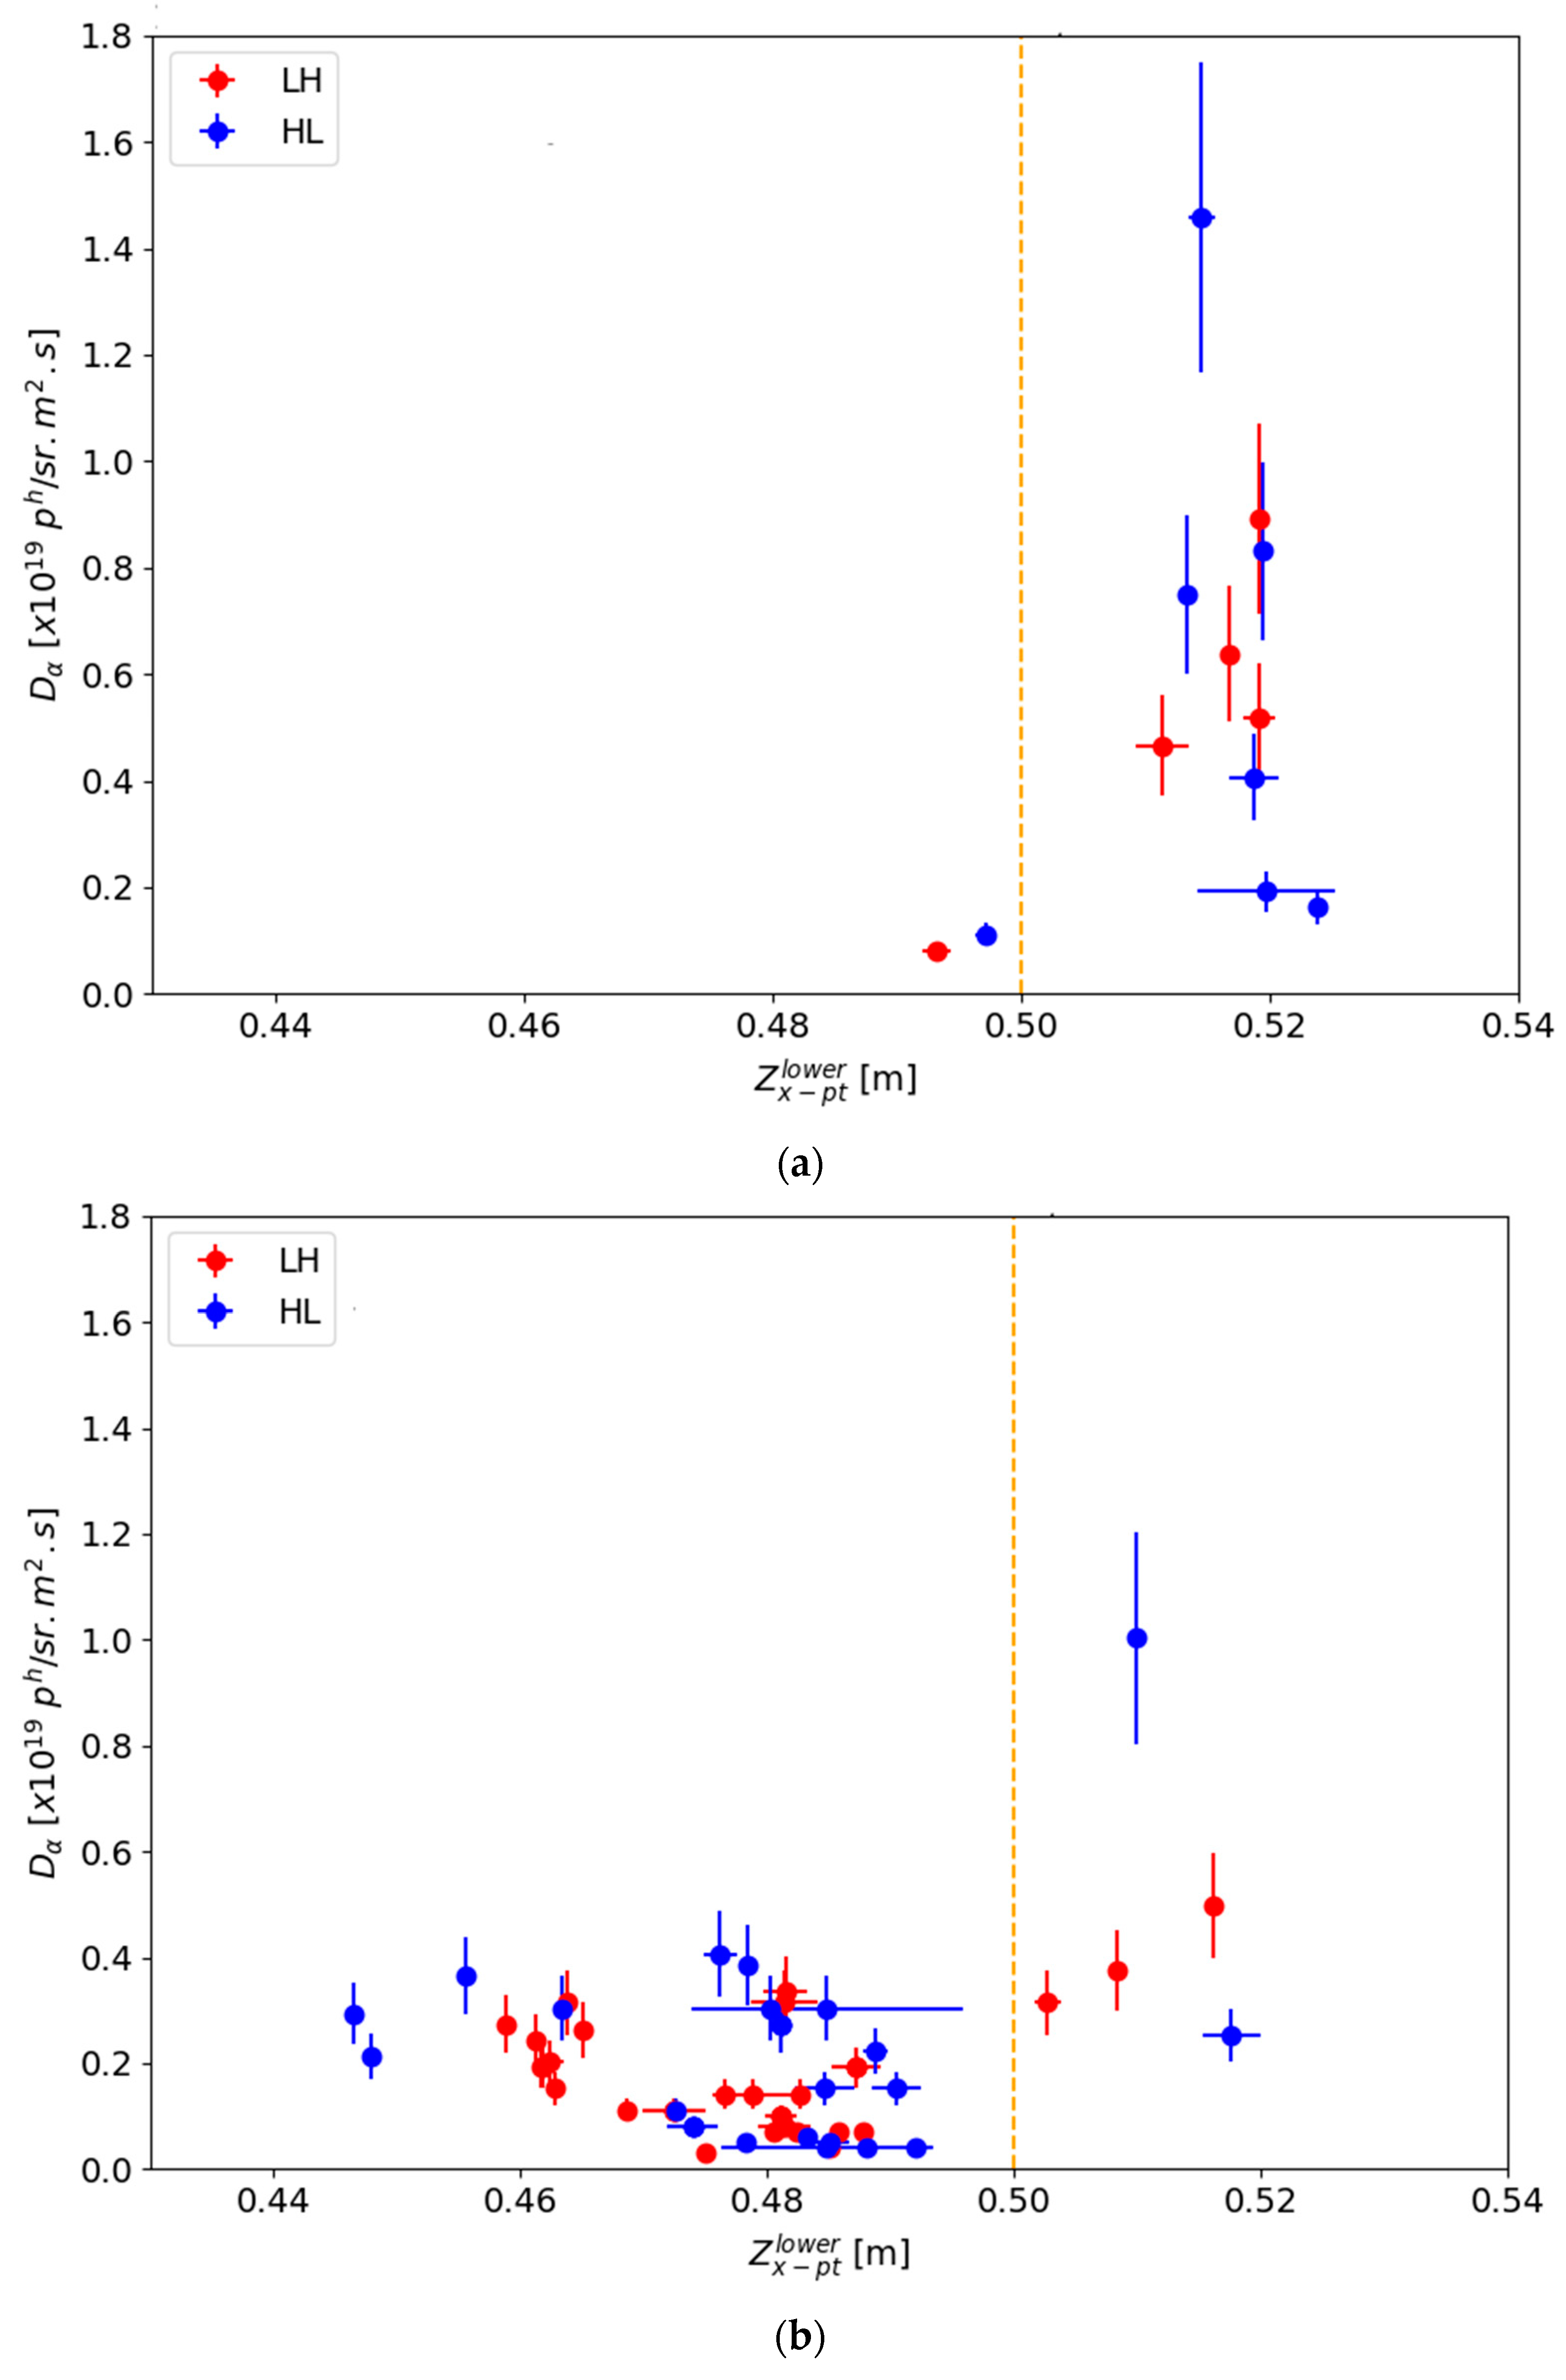
The increase in
PLH and
PHL correlates well with decreasing divertor neutral density with increased X-point height. Comparison of the outer divertor D
α intensity in
Figure 6a,b, indicates that the divertor neutral density increases in the vicinity of the X-point with reduced X-point height.
The power dependence of the L–H and H–L transitions therefore appears to be sensitive to increased vertical proximity between the region of recycling, horizontal target plates, and the X-point. A similar correlation between the
Pth, X-point height and divertor D
α intensity was observed on JET [
22] and correlated to changes in the sub-divertor neutral pressure by Maggi et al. [
23]. The effect of X-point neutral fueling has previously been considered by Toda et al. [
24] to explain the experimental observation of H-mode triggering on JFT-2M by gas puffing near the X-point. Toda et al. have shown that for a given set of parameters, there exists a critical value of neutral density near the X-point above which the H-mode bifurcation occurs, due to increased ion losses. More recent simulations by Battaglia et al. [
20] have shown that the heat flux through the plasma edge varies strongly with divertor recycling; the relationship between edge
Ti and the heat flux is dominated by ion-neutral physics, which in turn influence
Pth. It is important to note that MAST had an open divertor, which will have minimized the effect of variation in neutral recycling with X-point height.
4. Comparison with Theory
The MAST data from the density and X-point scans have been compared with the finite beta drift wave model in which edge plasma turbulence is thought to be suppressed through self-generated zonal flows [
9,
25]. Guzdar et al. [
9] developed a simple theory for the generation of zonal flows. These investigations indicated the important dimensionless parameter that determines the growth rate of the zonal flow is,
where,
β is the ratio of plasma pressure to the magnetic pressure,
q is the safety factor,
R is the major radius (m), and
Ln is the density gradient scale length (m). As a function of
the growth rate for zonal flows has a minimum at
, which is identified as the threshold point for the L–H transition. For
the zonal flow stabilization and suppression of fluctuations leads to a steepening of the density gradient and would trigger the transition to H-mode. A simple threshold condition was derived by Guzdar et al. for the L–H transitions in tokamaks,
where
Zeff is the effective plasma ion charge and
Ai is the ion mass relative to hydrogen. The pedestal parameters
and
Ln are the values at the location of the steepest part of the
ne pedestal gradient in the edge region of the plasma, just within the last closed flux surface. For a given plasma, the parameter,
which varies in time, and has to reach the critical value,
, to trigger the transition to H-mode according to the model.
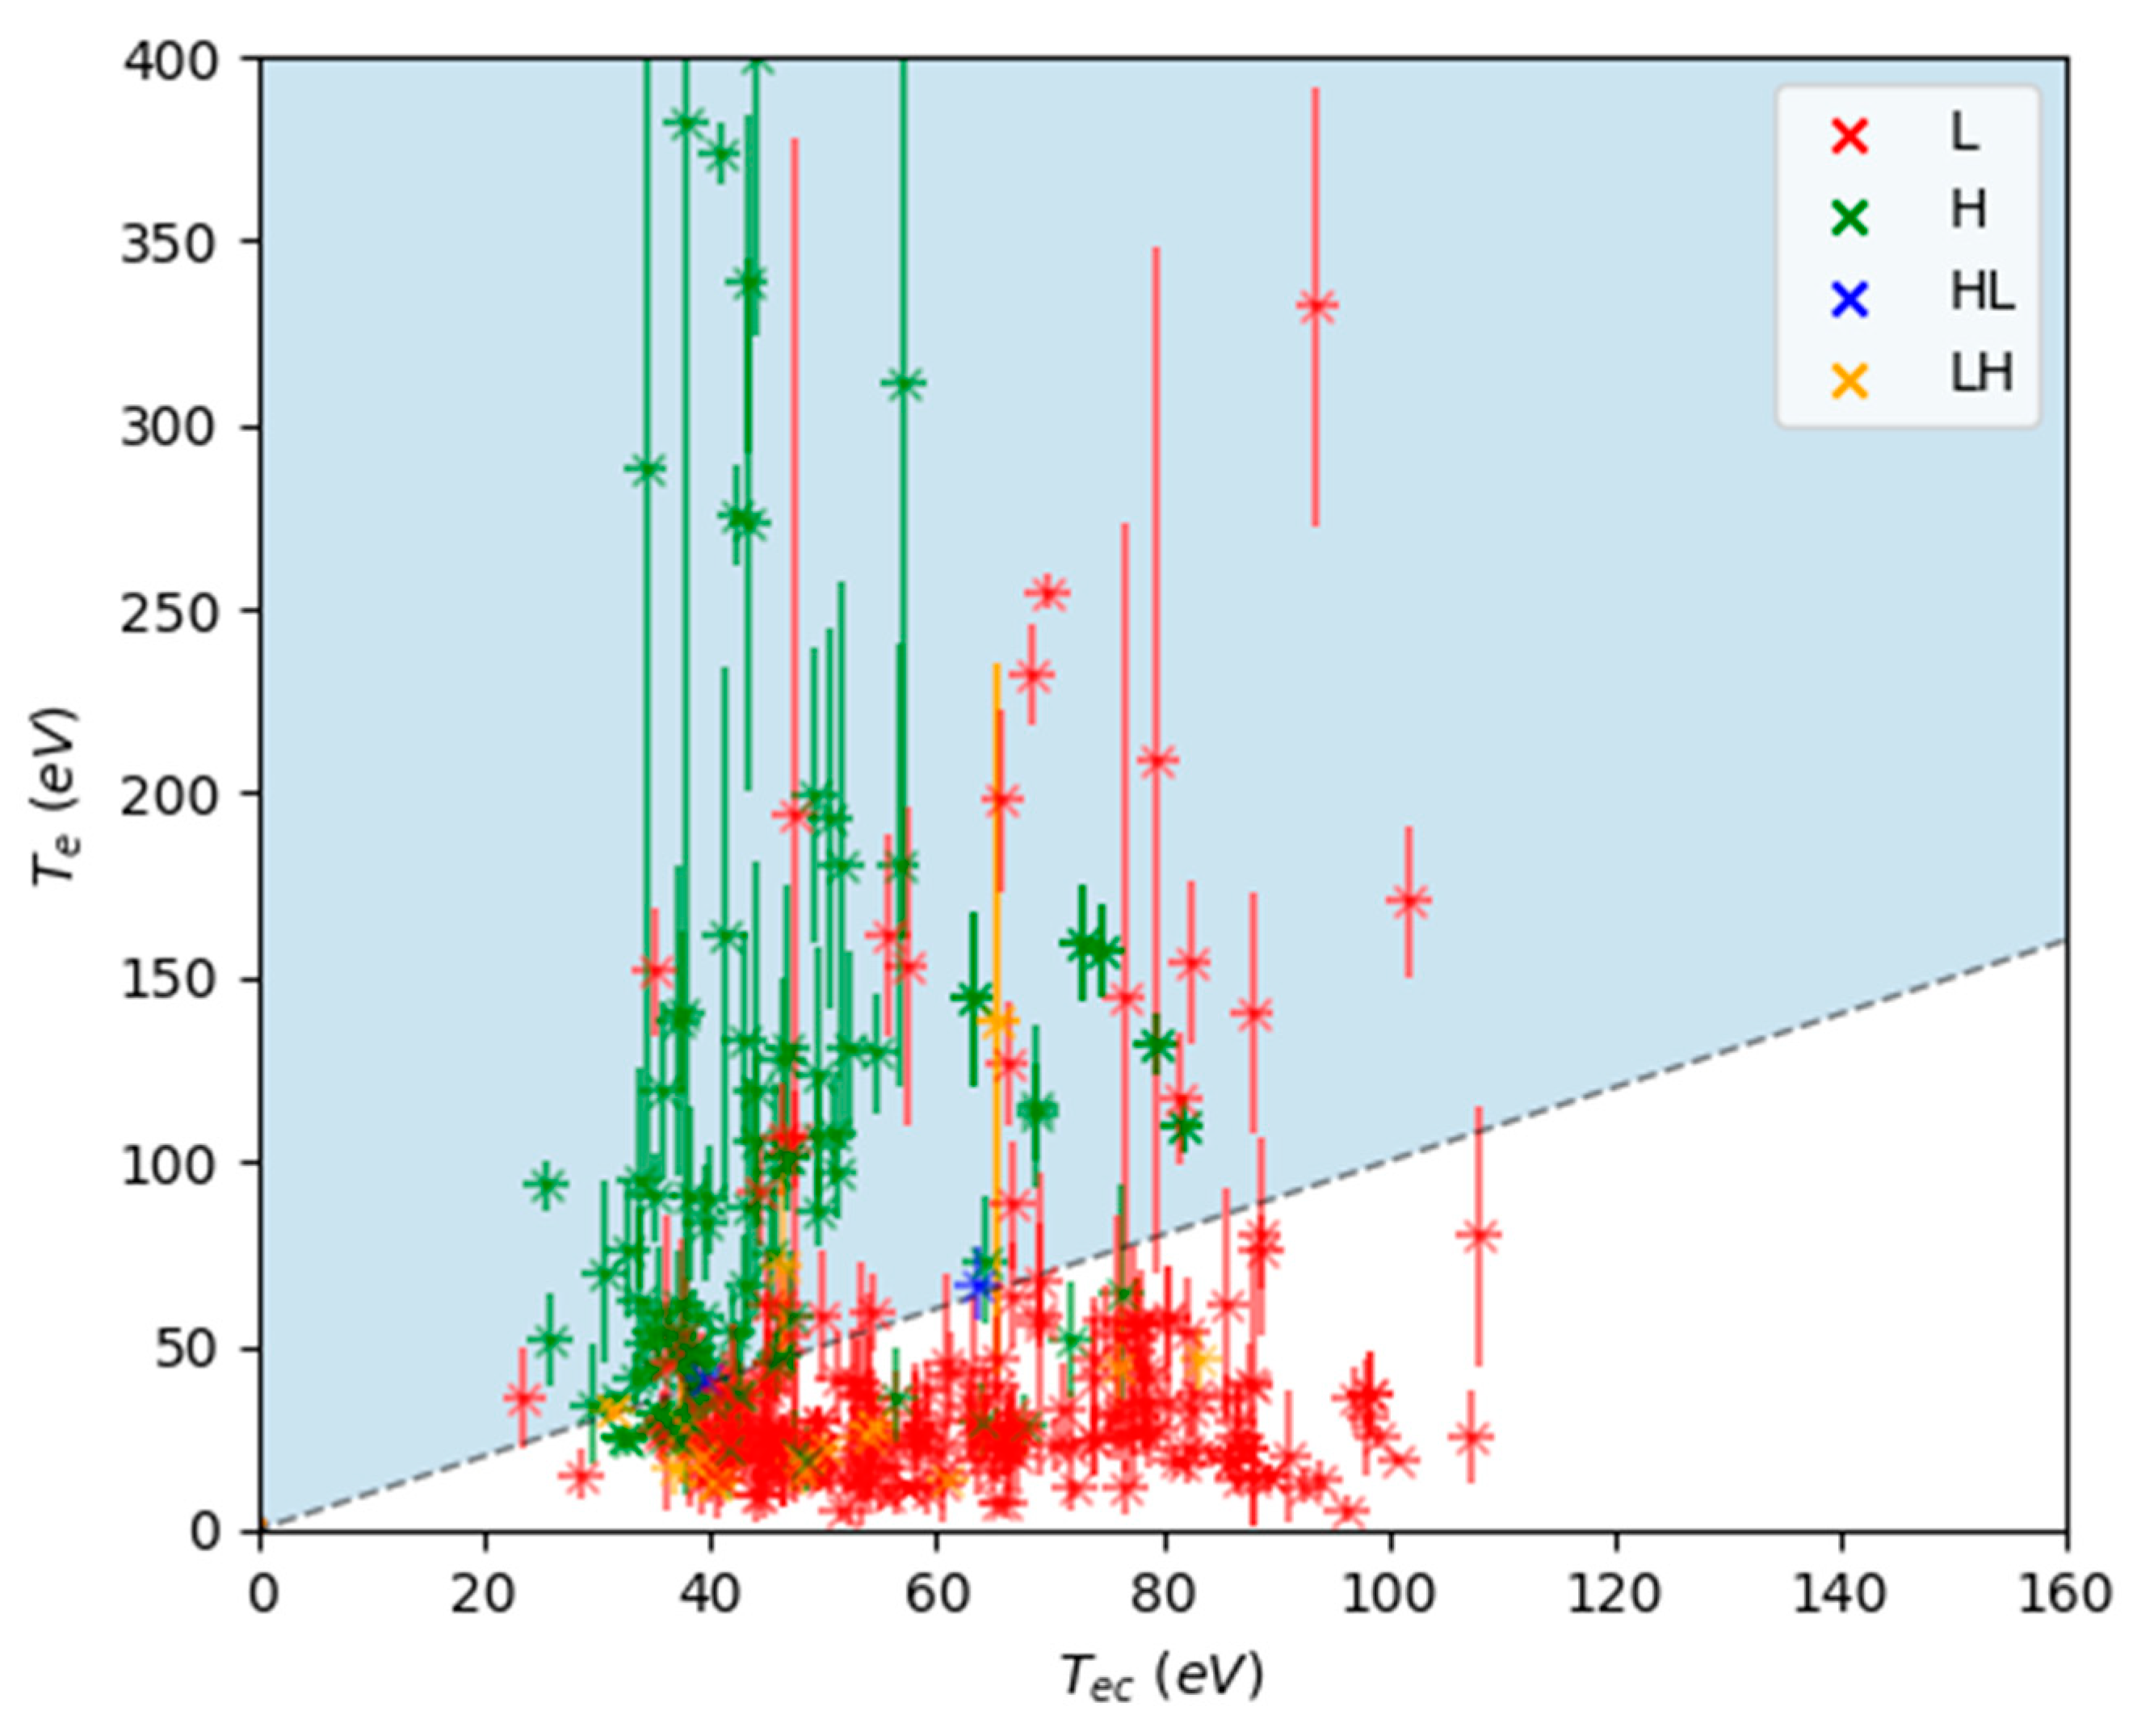
A statistical comparison of experiment with theory has been carried out by comparing the observed values of
Te at the location of steepest
ne gradient for data points in the L-mode and H-mode phases of the shots included in the density and X-point height scans presented in the previous sections. These experimental values of
Te are plotted as a function of calculated
Tec in
Figure 7 for 459 data points, along with the dotted
Te =
Tec line. The L–H transition had been identified for the
Pth analysis described earlier, allowing the L- and H-mode states of the plasma to be parameterized. The full set of discharges had scans in
Ip = 0.67–0.91 MA,
Bt = 0.43 T,
= 1–4.5 × 10
19 m
−3, and
hxpoint = 0.35–0.52 m and have been included in this analysis. As in earlier studies, a value of
Zeff = 2 has been used [
11]. There is a clear separation between the L-mode and H-mode data points across the dotted
Te =
Tec line, with the L–H and H–L data points lying either side and fairly close to it. The outlying data show no clear trend, with 11% of the L-mode points lying above the
Te =
Tec line and 14 % H-mode points lying below it.
This data demonstrates the finite beta drift wave model provides a reliable onset condition for the transition into and out of H-mode. Even though Pth over the density scan increases by a factor of two and Pth increases by a factor of three over the X-point height scan included in this dataset, the model’s dotted line separates the L-mode and H-mode data points well. It is interesting to note that the H–L transition points also occur close to the value of Tec, with no evidence of hysteresis in the pedestal parameters. The identifying critical edge parameter for the L–H transition is crucial to understanding the physics of the trigger mechanism for bifurcation of the state. This analysis suggests that Te at the location of the steepest ne gradient, along with the evolution of the density gradient scale length (or a related parameter such as Ti or Er), affects the L–H and H–L transitions. These results also indicate that the pedestal electron density gradient could be one of the contributory parameters controlling H-mode access, supporting the class of theories based on turbulence driven, electron drift waves, which predict the L–H transition to occur when reaches a critical value which is proportional to Te/(Ln)1/2. It is important to note that the results presented here may provide supporting experimental evidence for the finite beta drift wave model; however, detailed and direct measurements of zonal plasma flow velocities in the pedestal are needed to understand their role in the suppression of turbulence at the L–H transition.
5. Conclusions
In this paper the power threshold for the L–H and H–L transitions on MAST have been presented for core averaged density and X-point height scans for CDND magnetic configurations. The L–H transition was found to have the dependence, . The H–L Pth was found to have a weaker dependence on the averaged core electron density, although the limited amount of data means this indication of power threshold hysteresis at the highest densities and will be an area of planned future experimental investigation on MAST-U.
The strong influence of increasing X-point distance from the divertor floor on raising Pth for both the L–H and H–L transitions, with an increase on Pth by a factor of three over a range of 10–12 cm, is clearly shown. The X-point height dependence of the Pth is also shown to be sensitive to the plasma current; decreasing Ip from 0.77 MA to 0.65 MA lowers Pth across the X-point height scan by a factor of three and increases the Pth roll-over height by 3 cm. The sensitivity of the L–H and H–L Pth over the relatively specific X-point height range, is likely to be related to divertor recycling patterns, proximity of the X-point to neutral source, and ion-neutral interaction in the scrape-off layer, and edge plasma which in turn influences the scrape-off layer and edge plasma Er. The role of divertor recycling, ion-neutral interaction, and divertor magnetic geometry in the transitions to and from H-mode will be studied in detail in forthcoming experiments on MAST-U.
Finally, the data included in this study have been compared with the finite beta drift wave model, which provides a reliable onset condition for the transition into and out of H-mode. Even though Pth over the density scan increases by a factor of two and Pth increases by a factor of three over the X-point height scan included in this dataset, the model separates the L-mode and H-mode data points reasonably well. The H–L transition points also occur close to the value of Tec, with no evidence of hysteresis in the pedestal parameters.
The identifying critical edge parameter for the L–H transition remains crucial to understanding the physics of the trigger mechanism for bifurcation of the plasma state. This data suggests that the Te at the location of the steepest ne gradient, along with the evolution of the density gradient scale length (or a related parameter such as Ti or Er), have contributory roles in the L–H and H–L transitions. The experimental results presented here may provide supporting experimental evidence for the of the finite beta drift wave model for the L–H transition. However, direct measurements of zonal plasma flow in the pedestal region, with sufficiently high time and spatial resolution, are required to further understand its role in the suppression of turbulence at the forward and back H-mode transitions.

