1. Introduction
Silicon (Si) has been extensively utilized in various industrial fields including electronics, optics, photocatalysis, and energy storage owing to its remarkable physicochemical properties [
1,
2,
3]. In recent years, the growing demand for high-performance energy storage systems has intensified research interest in Si as an anode material for lithium (Li) ion batteries due to its significantly high energy density. Si possesses a high theoretical capacity of approximately 4200 mAh g
−1 compared with graphite, which is the most widely used anode material in current commercial Li ion batteries [
4]. However, Si undergoes substantial volume expansion and contraction during lithiation and delithiation, which leads to structural degradation and rapid capacity-fading. To overcome this technical challenge, various strategies, such as Si alloys, silicon carbide (SiC), and Si nanoparticles, have been investigated. Among these strategies for modifying Si materials, Si nanoparticles are advantageous due to their enhanced structural stability and shortened Li ion diffusion pathways, which are attributed to their nanoscale dimensions. Nevertheless, there are limitations, such as low tap density, which restricts volumetric energy density, and a high specific surface area, which promotes the excessive formation of solid electrolyte interphase (SEI) layers due to electrolyte decomposition [
5,
6,
7].
Therefore, it is crucial to reduce the specific surface area and increase the tap density by tailoring the particle size and morphology of Si nanoparticles. Previous studies have demonstrated the aggregation of silica (SiO
2) nanoparticles into spherical microscale SiO
2 particles using various techniques such as spray-drying, the Stöber method, and an emulsion-based method. Jung et al. synthesized spherical composite particles using spray drying with nano-SiO
2 and Si precursors [
8]. Nian et al. developed yolk shell structured cluster particles using an oil-phase synthesis [
9]. Masalov et al. also successfully synthesized microscale SiO
2 particles using the Stöber method [
10]. However, these synthesis methods often face limitations, including poor morphological control, low production yield, and high manufacturing costs. In contrast, ultrasonic spray pyrolysis (USP) represents a scalable, continuous, and one-step aerosol process capable of producing microscale particles without complex templates. USP also offers advantages such as broad precursor compatibility and the ability to operate under an inert atmosphere, which can minimize contamination. In USP process, a precursor solution is atomized into fine droplets, which undergo rapid solvent evaporation and thermal decomposition at high temperatures, enabling the formation of uniform microscale particles [
11,
12].
To be utilized as an anode material in Li ion batteries, the synthesized SiO
2 microparticles need to be reduced to Si. Representative reducing agents for SiO
2 include aluminum, carbon, and magnesium. Although the aluminothermic reduction can proceed at the relatively low temperature of 550 °C, it produces by-products that are difficult to remove. Carbothermal reduction requires high temperatures exceeding the melting point of SiO
2, which limits its practical applicability. Magnesium thermal reduction enables the reduction of SiO
2 at approximately 650 °C, and the resulting by-product can be suitably removed [
13,
14].
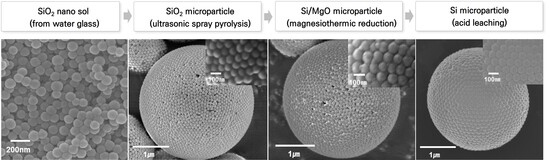
This study demonstrates a facile and scalable fabrication route to synthesize pomegranate-shaped porous Si microparticles to address the issues of high specific surface area associated with Si nanoparticles when used as an anode material for Li ion batteries. SiO2 nano sol derived from low-cost water glass was transformed into well-defined pomegranate-shaped Si microparticles using USP and the magnesiothermic reduction process. The morphology and crystal structure of the particles were systematically investigated. The electrochemical performance of the resulting pomegranate-shaped Si microparticles was also evaluated.
2. Experimental Procedure
2.1. Preparation of SiO2 Nano Sol
Sodium silicate solution (water glass, Na
2O·3SiO
2·22H
2O, Daemyung Chemical, Seoul, Republic of Korea) was used as a starting material to synthesize SiO
2 sol, which was utilized as a precursor for the USP process. Initially, 100 g of sodium silicate solution was mixed with 400 mL of deionized water and stirred for 2 h. Hydrochloric acid was added to adjust pH to 2–3, inducing the formation of colloidal SiO
2 particles. The resulting colloidal SiO
2 solution was passed through an ion exchange column containing a cation exchange resin (Amberlite™ IR120, Dow Chemical, Midland, MI, USA) at a flow rate of 20 mL/min to remove sodium ions. During the ion exchange process, the pH of the solution was maintained within the range of 2–3. To promote the growth and stabilization of SiO
2 particles, the solution temperature was gradually increased at a rate of 0.2 °C/min, and then held at 80 °C for 60 min [
15].
2.2. Synthesis of SiO2 Microparticles Using USP
SiO2 microparticles were synthesized using the USP process with SiO2 nano sol as the precursor. SiO2 sol was diluted with deionized water to a concentration of 10 wt% and stirred for 1 h to ensure homogeneity of the precursor solution. The prepared precursor solution was atomized at frequency of 1.75 MHz using a nebulizer with three ultrasonic vibrators. The aerosol droplets generated by ultrasonic spray were carried by Ar gas into the pyrolysis zone, where the thermal reaction was conducted in a vertical furnace. The furnace temperature was set to 500 °C with heating rate of 5 °C/min. To prevent contamination from external impurities, an inert atmosphere was maintained by continuously supplying Ar gas at a flow rate of 3 L/min. The system was purged with Ar gas for 30 min prior to the reaction. SiO2 microparticles formed through the pyrolytic reaction were collected using a filtration unit.
2.3. Magnesiothermic Reduction and Acid Leaching
SiO2 microparticles synthesized using USP were thermally treated in an inert atmosphere using magnesium chips (Mg, 99.98%, Sigma-Aldrich, St. Louis, MO, USA) as a reducing agent. A total of 30 g of SiO2 microparticles and 24.3 g of magnesium chips were mixed and placed into a reduction furnace. Ar gas was introduced at flow rate of 3 L/min, and a stable inert atmosphere was established by purging the system for 30 min prior to the reaction. The reduction was conducted at temperatures of 550, 650, and 750 °C for 3 h. The temperature was increased at a rate of 5 °C/min. After the reduction process, residual magnesium and by-products were removed by stirring in 2 M HCl solution for 6 h. The samples were washed with deionized water until pH 7 was achieved. Finally, the samples were dried in a vacuum oven at 80 °C for 12 h.
2.4. Electrode Fabrication Based on Si Microparticles
To evaluate the electrochemical performance of the synthesized Si microparticles, half cells were fabricated using Li metal as the counter-electrode. The working electrode was prepared by mixing the active material, a conductive agent (Super P carbon black), and a binder (polyvinylidene fluoride, PVDF) at a weight ratio of 8:1:1, using N-methyl-2-pyrrolidone (NMP) as the solvent. The resulting slurry was uniformly coated onto copper foil with 0.03 mm thickness. The electrodes were dried under vacuum at 120 °C for 12 h. Half cells were assembled in Ar-filled glove box. The electrode loading was controlled at 1.5 mg/cm2. The electrolyte consisted of 1 M lithium hexafluorophosphate (LiPF6) dissolved in a mixture of ethylene carbonate (EC) and diethyl carbonate (DEC) with 3 wt% fluoroethylene carbonate (FEC) as an additive.
2.5. Characterization
The morphology of the synthesized particles was investigated using field emission scanning electron microscopy (FE-SEM, JSM-6390, JEOL, Tokyo, Japan). The internal structure of the particles was further analyzed using focused ion beam scanning electron microscopy (FIB-SEM, Quanta3D FEG, FEI, Hillsboro, OR, USA), and the elemental composition was analyzed by energy-dispersive X-ray spectroscopy (EDS). The crystal structure was characterized using X-ray diffraction (XRD, D/2500VL/PC, Rigaku, Tokyo, Japan). The chemical bonding was analyzed by Fourier transform infrared spectroscopy (FT-IR, Nicolet 6700, Thermo scientific, Waltham, MA, USA) and Raman spectroscopy (NRS-3100, Jasco, Tokyo, Japan). The particle size distribution was evaluated using a laser scattering particle size analyzer (PSA, LA-950V2, HORIBA, Kyoto, Japan). The specific surface area and pore size distribution of the particles were determined from nitrogen adsorption–desorption isotherms (Belsorp II mini, BEL, Osaka, Japan) using the Brunauer–Emmett–Teller (BET) and Barrett–Joyner–Halenda (BJH) methods.
The electrochemical performance was assessed using a battery testing system (BasyTec battery test system). Prior to testing, the assembled coin cells were stabilized at 25 °C for 24 h. The initial charge–discharge profile and cycling stability over 50 cycles were evaluated. The operating voltage range was set to 0.01–1.5 V for charging and 0.01–2.5 V for discharging with current rate of 0.05 C.
3. Results and Discussion
The physicochemical properties of SiO
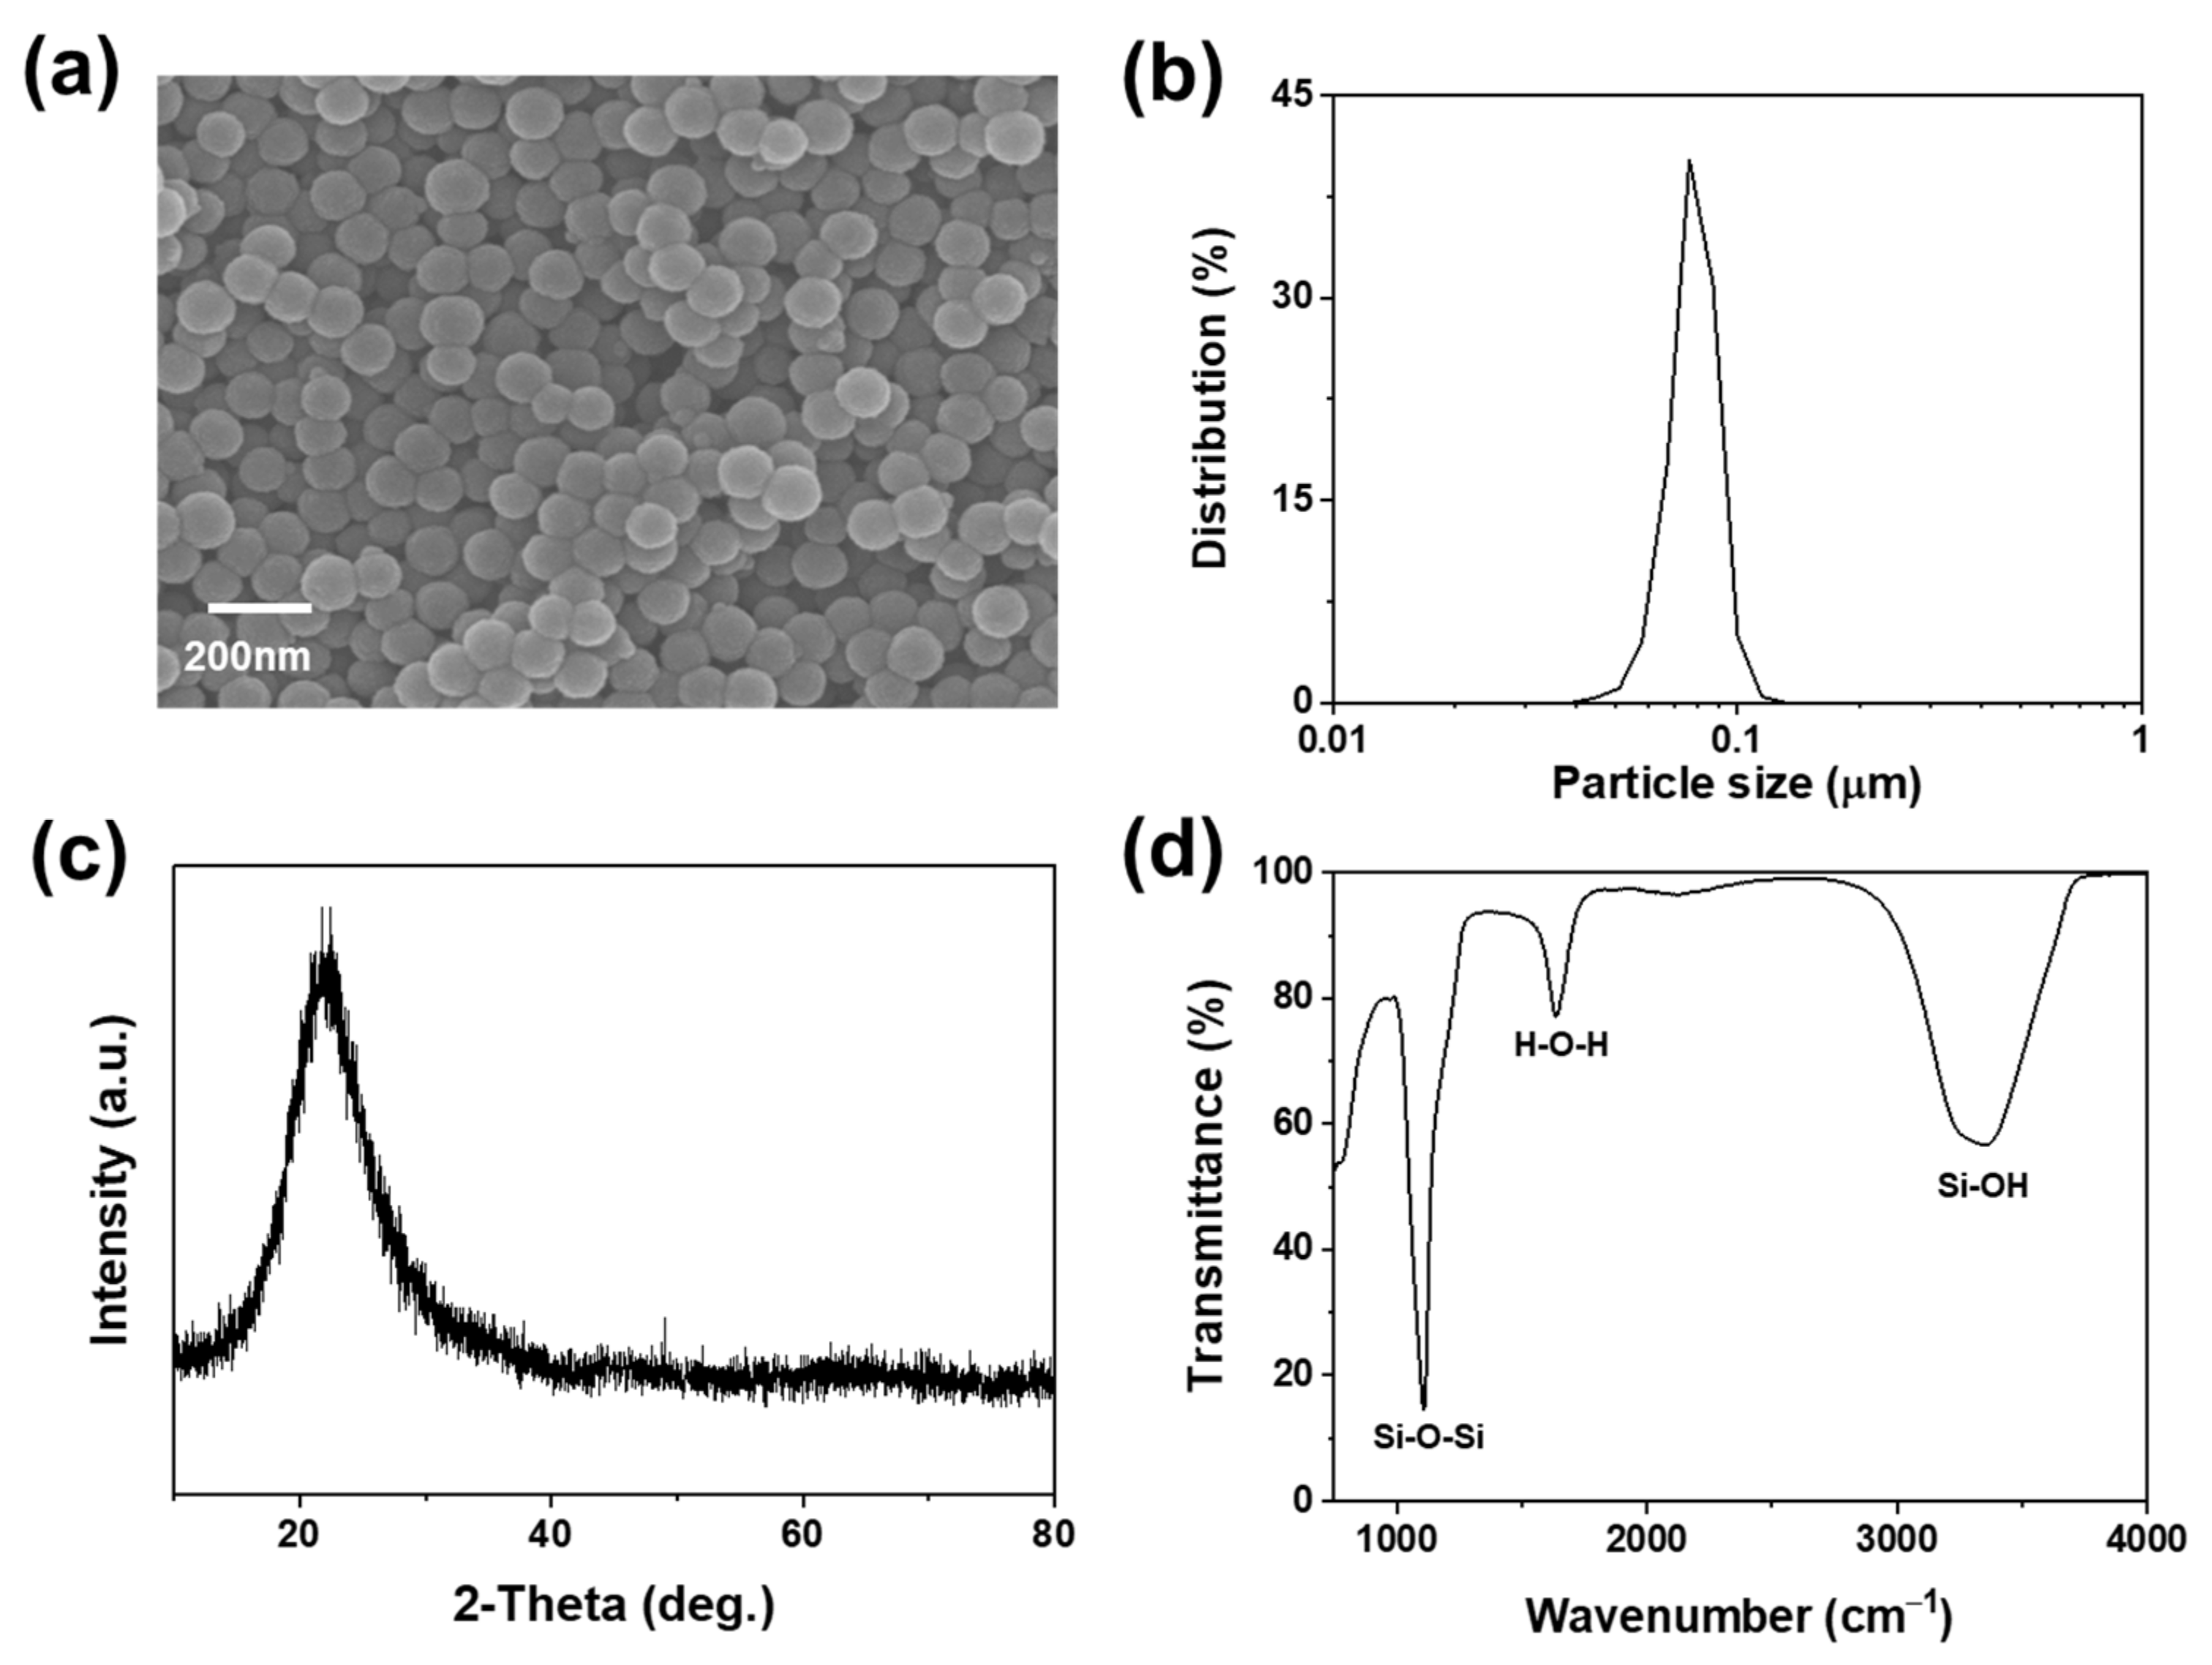
2 sol synthesized from water glass as a precursor in the USP process are presented in
Figure 1.
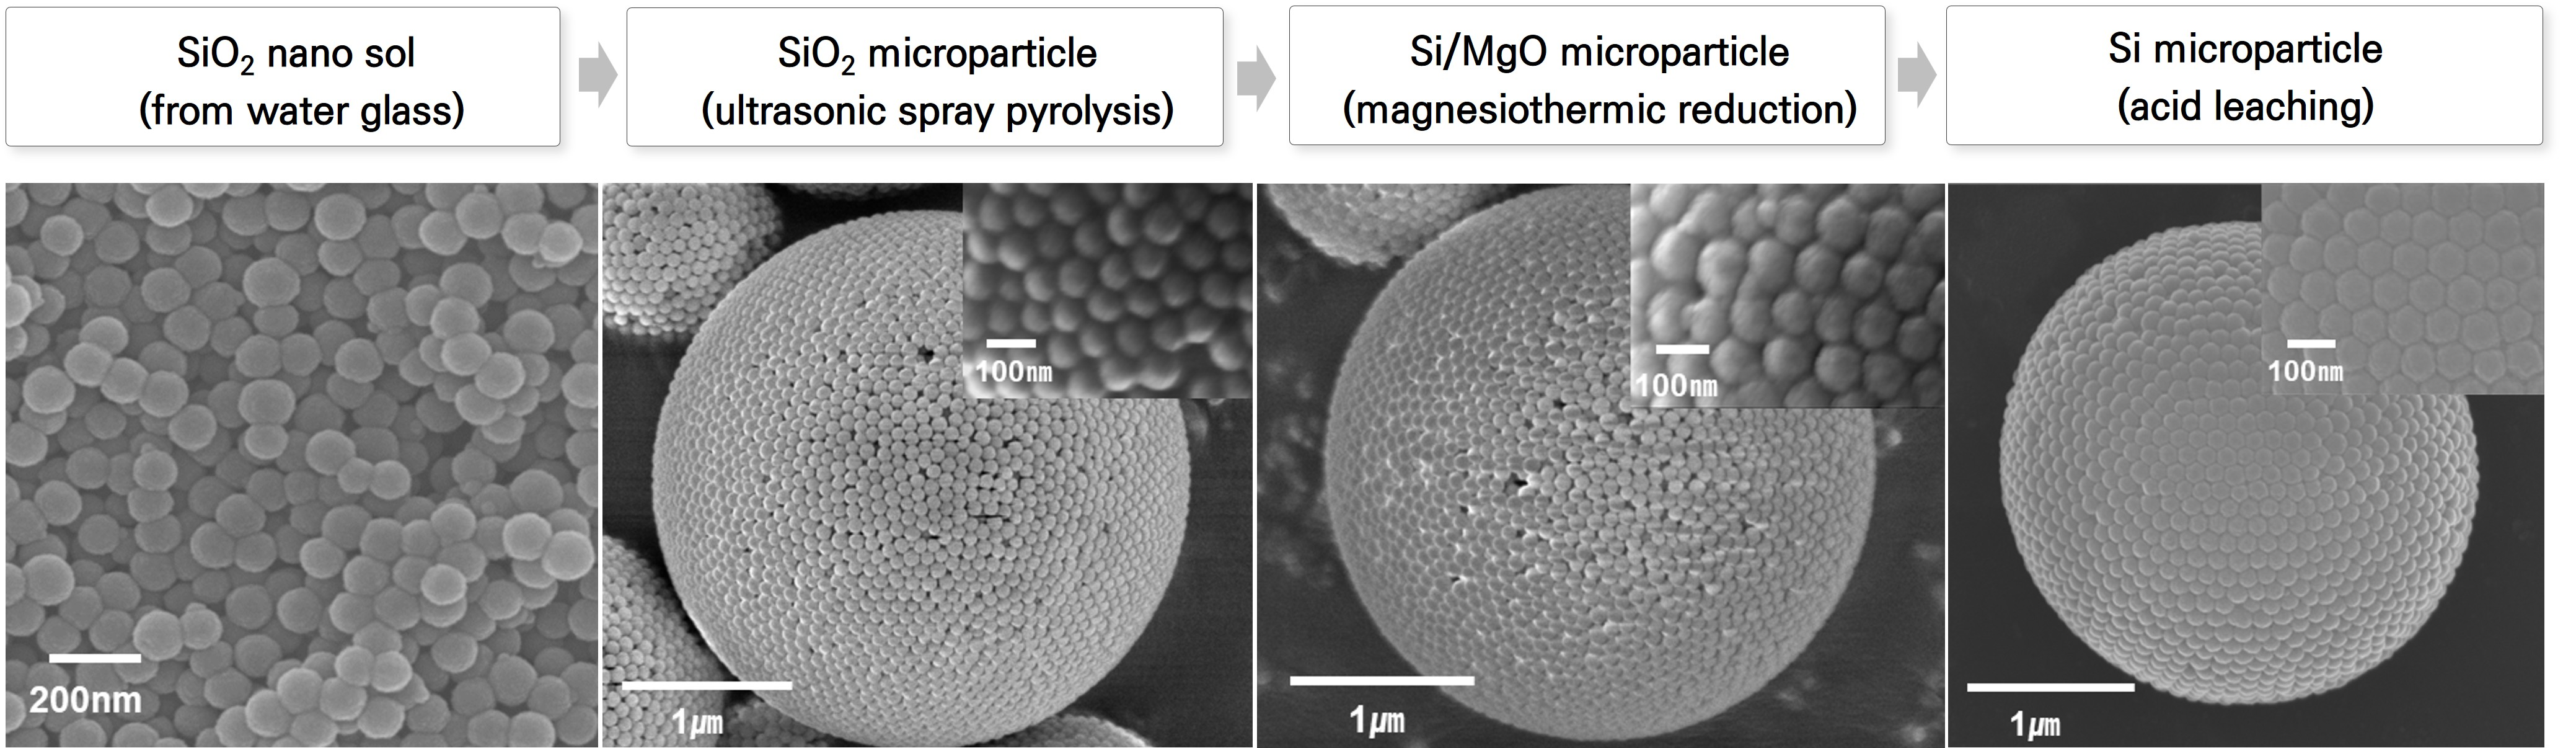
Figure 1a shows an FE-SEM image of SiO
2 nano sol. SiO
2 nanoparticles exhibit spherical morphologies and were dispersed without aggregation. The PSA results shown in
Figure 1b indicated that SiO
2 particles exhibited a particle size distribution between approximately 60 and 90 nm, with an average particle size of 73 nm. This result is consistent with the FE-SEM observation in
Figure 1a. The narrow and monodisperse particle size distribution confirms that the particles were synthesized with uniform size. The XRD pattern in
Figure 1c exhibits a broad peak in the range of approximately 15° to 35°, indicating the amorphous phase [
15].
Figure 1d shows the FT-IR spectrum of the synthesized SiO
2 nanoparticles. An absorption peak corresponding to the asymmetric stretching vibration of Si–O–Si is observed at around 1100 cm
−1, indicating the presence of Si–O bonds forming the three-dimensional SiO
2 network. In addition, a peak at 1620 cm
−1 is observed, which is attributed to the bending vibration of physically adsorbed water, as well as a broad absorption band around 3300 cm
−1 corresponding to O–H stretching vibrations of surface silanol groups [
16].
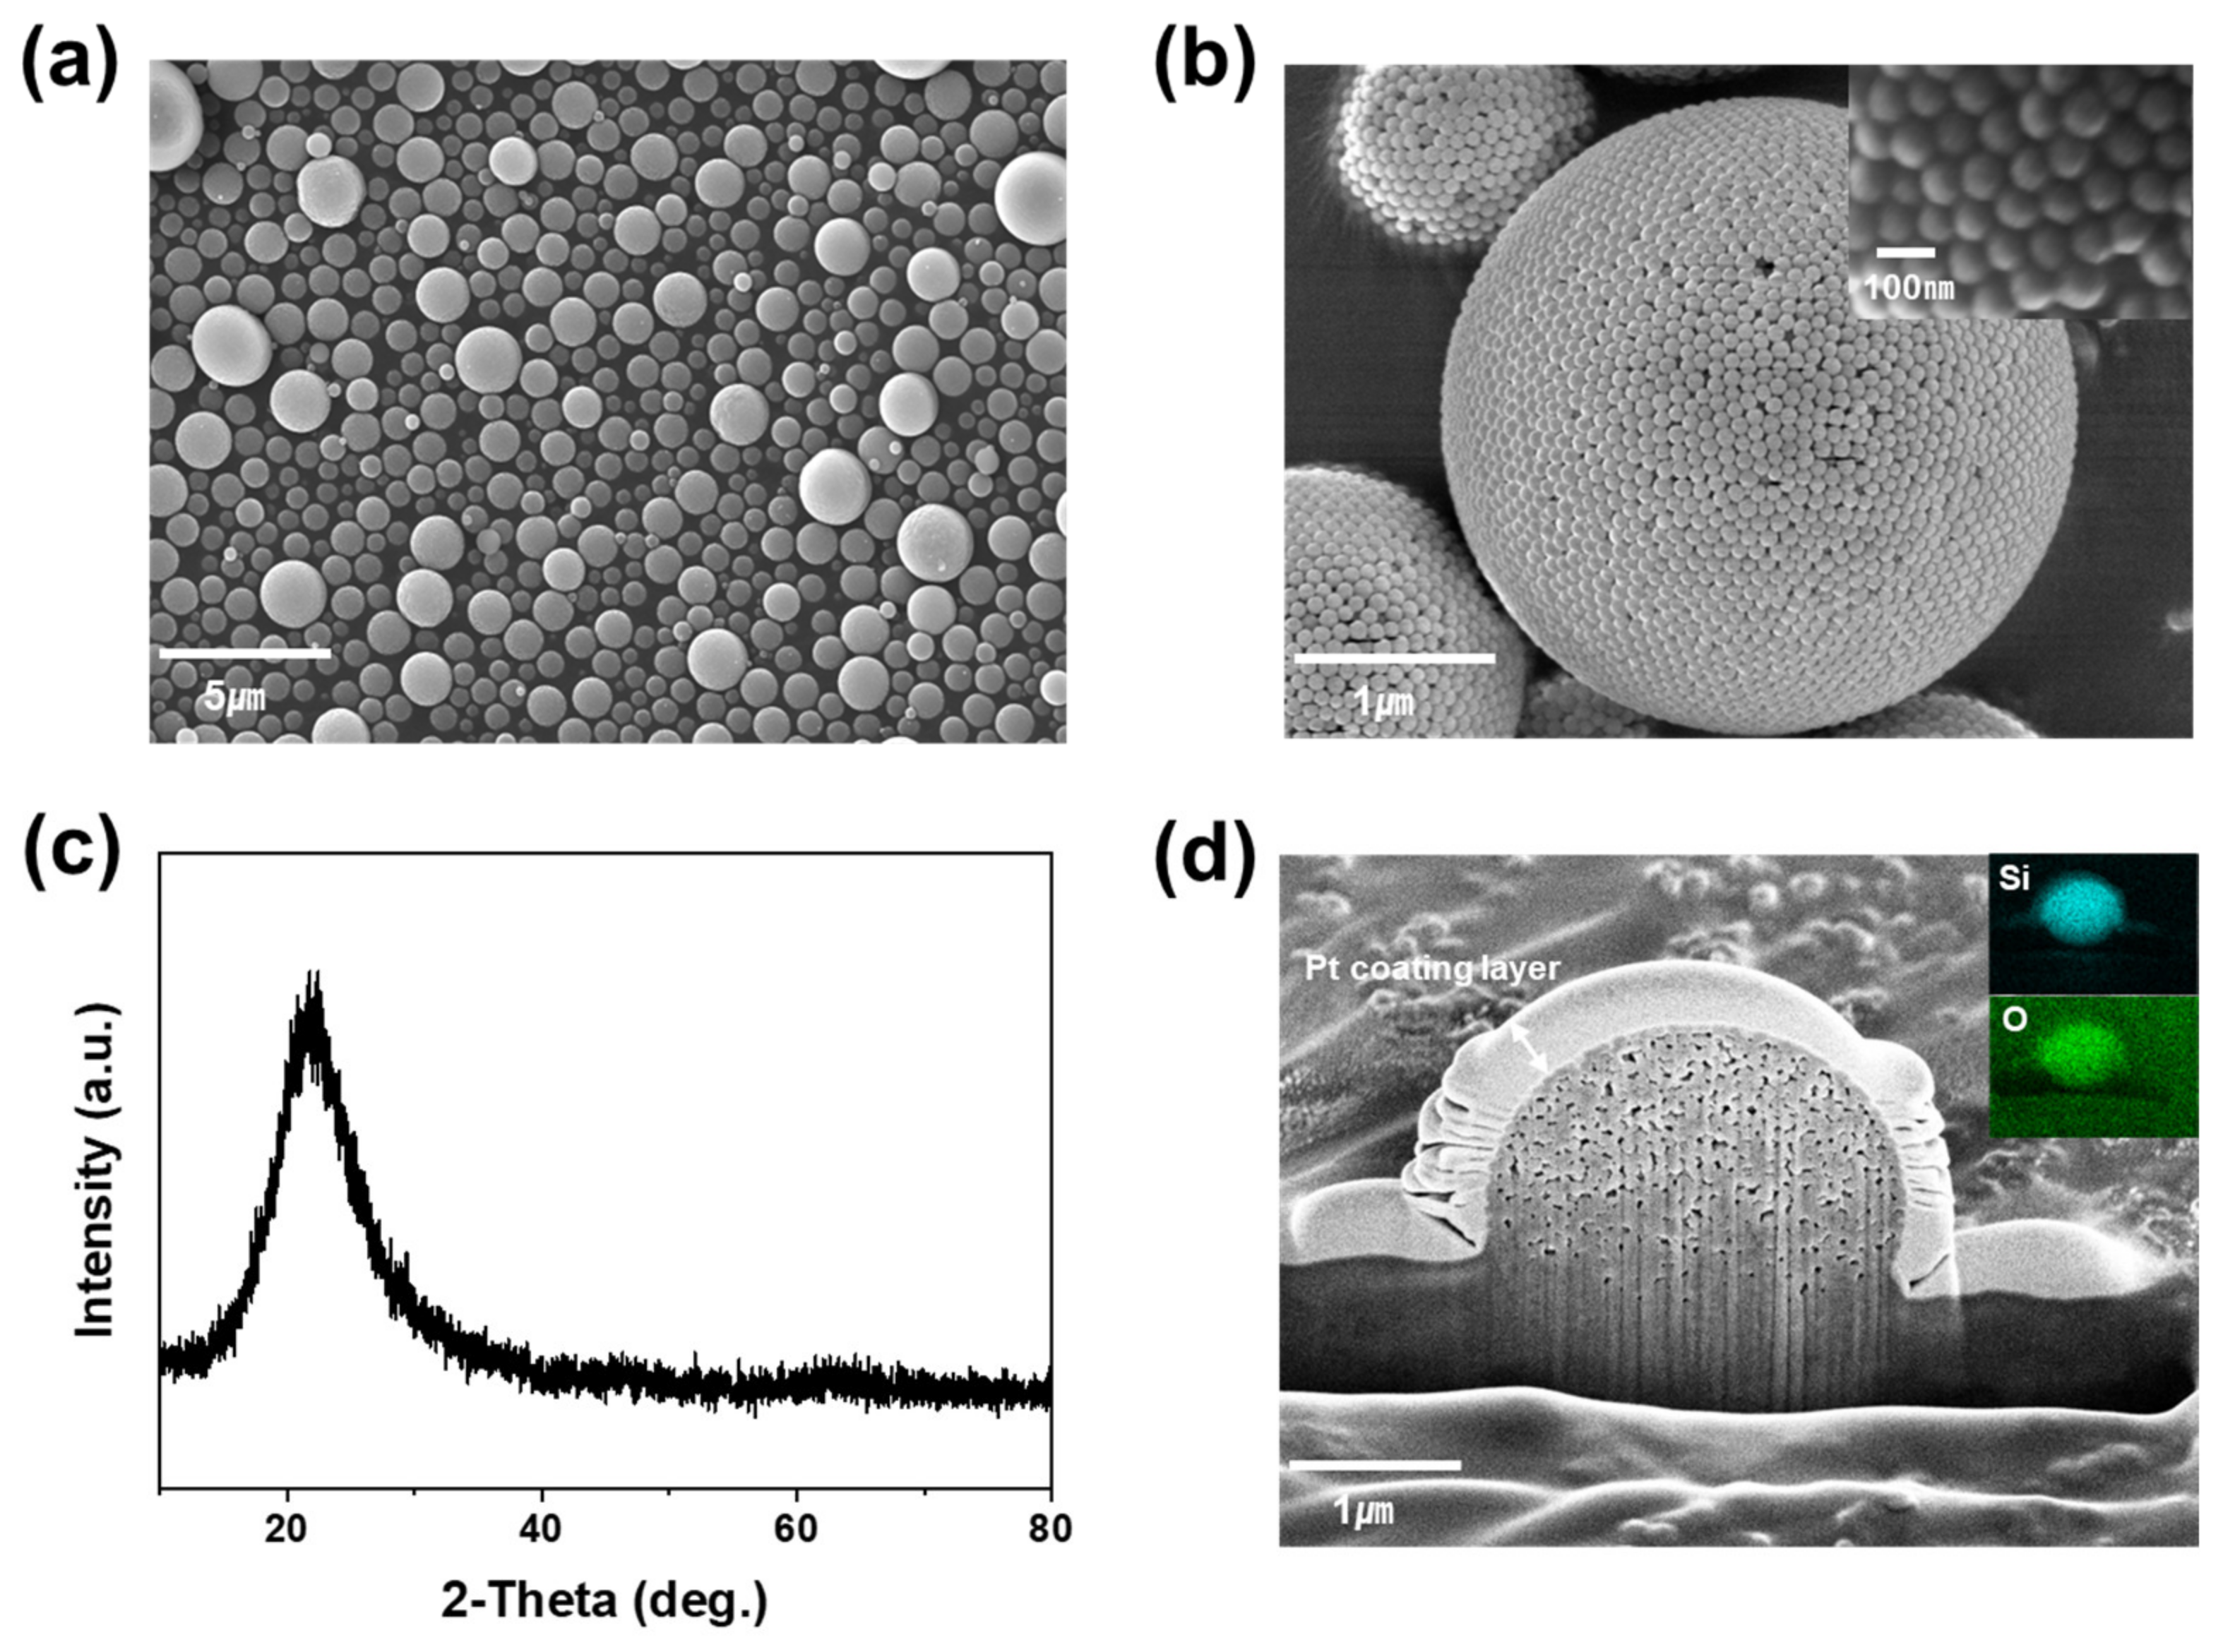
Figure 2 presents the characterization results of SiO
2 microparticles fabricated through the USP process using SiO
2 nano sol as a precursor. As shown in
Figure 2a, the SEM image reveals spherical particles with diameters of several micrometers.
Figure 2b shows the morphology and surface structure of a single SiO
2 microparticle. SiO
2 microparticles exhibit a pomegranate-shaped morphology. Primary particles with a size of several tens of nanometers are used as the precursor, which are densely packed to form secondary particles in the micrometer size range. The inset of
Figure 2b indicates that the primary nanoparticles present on the microparticle surface are aggregated while maintaining the original shape and size of the SiO
2 nano sol precursor. SiO
2 microparticles form spherical structures through the sequential steps of droplet-drying, densification, and aggregation. The XRD pattern of SiO
2 microparticles in
Figure 2c exhibits a broad peak in the range between 15° and 35°, similar to that of the SiO
2 nano sol precursor, confirming the amorphous phase. The rapid thermal decomposition during the USP process inhibited crystallization and the particles remained in the amorphous state [
17].
Figure 2d shows the cross-sectional morphology of a SiO
2 microparticle observed using FIB-SEM. SiO
2 microparticles were found to contain inner pores, displaying a pomegranate-shaped morphology. The internal pores act as a structural buffer to accommodate the volume changes in Si, reducing mechanical stress and preventing particle pulverization [
18]. In addition, EDS mapping analysis revealed that Si and O were uniformly distributed throughout the interior of the microparticle.
Pomegranate-shaped SiO
2 microparticles were treated to magnesiothermic reduction to obtain the Si phase.
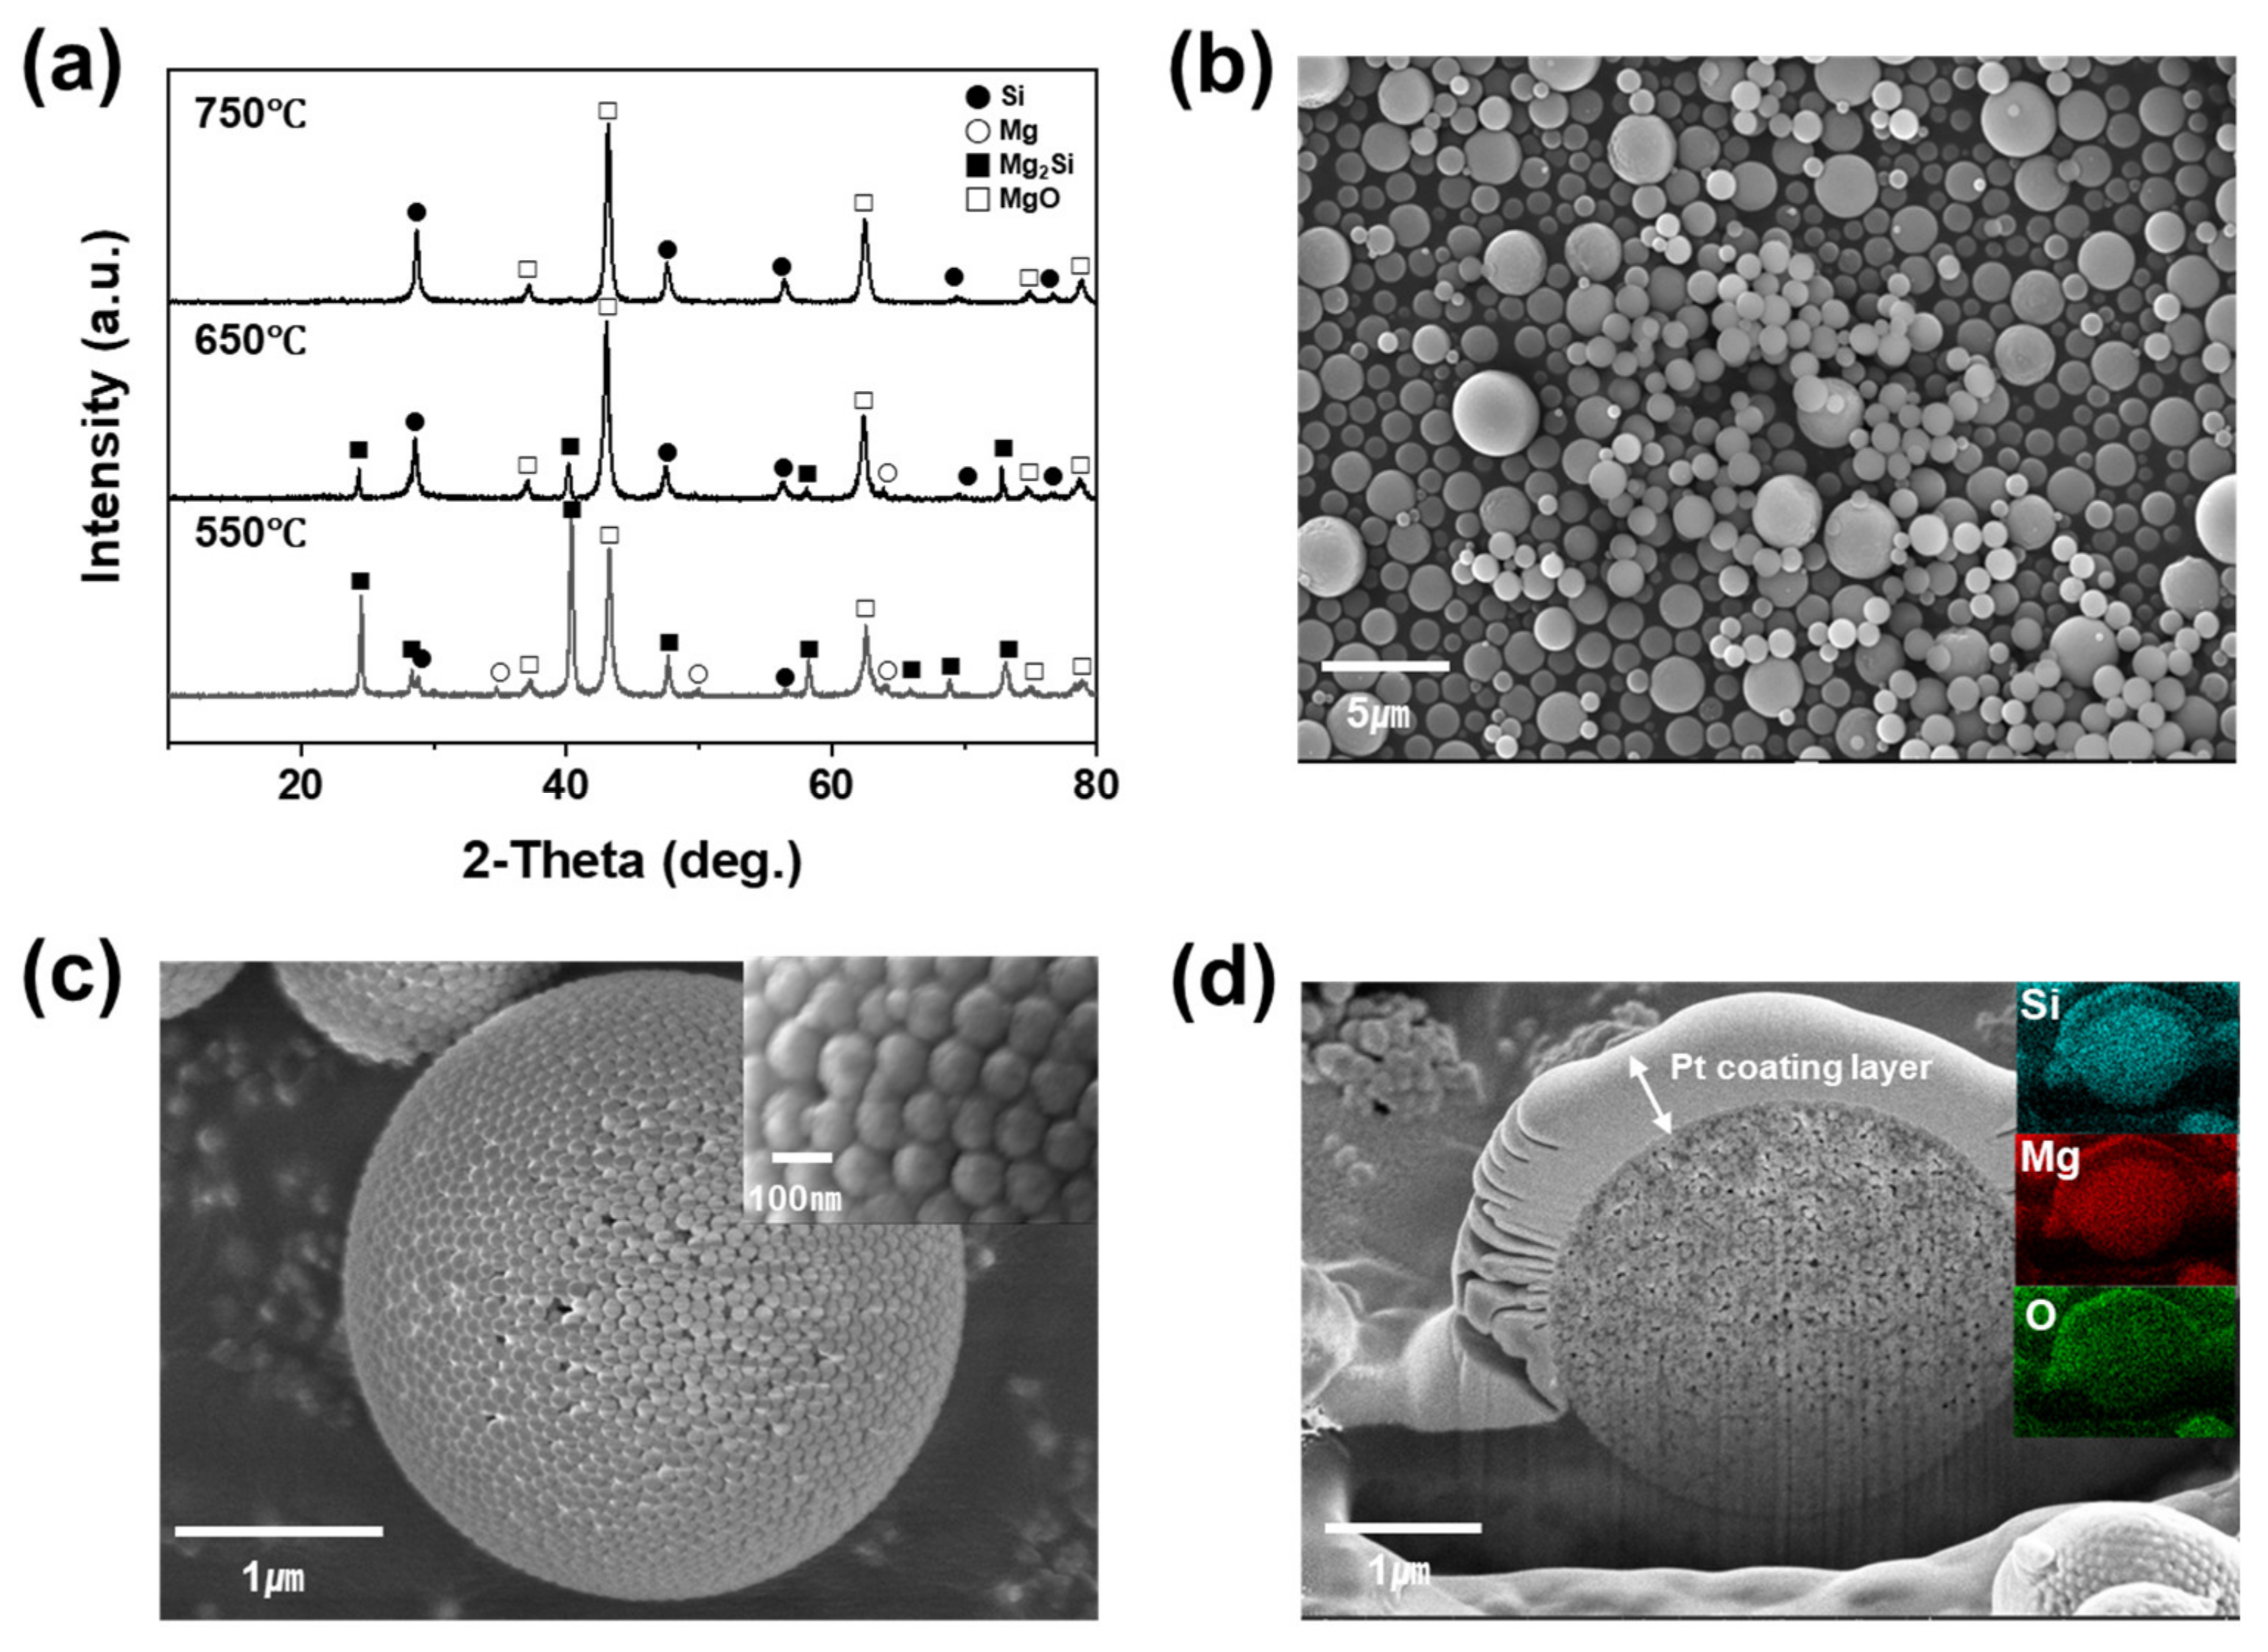
Figure 3 presents the crystal structure and morphology of the particles after the magnesiothermic reduction process.
Figure 3a shows the XRD patterns of the microparticles when reduced at temperatures ranging from 550 to 750 °C. After reduction at 550 °C for 3 h, XRD diffraction peaks corresponding to Mg and Mg
2Si were observed, with relatively weak peaks corresponding to Si. The reduction was incomplete at 550 °C due to the insufficient vaporization and limited reactivity of Mg. Part of the generated Si may have reacted with the remaining unreacted Mg to form Mg
2Si. Under the magnesiothermic reduction conditions at 650 °C, the diffraction peaks corresponding to Si near 28° and 56° became more intense, and additional Si peaks appeared around 47° and 69°. The decreased intensity of the peaks associated with unreacted Mg suggests that the reduction proceeded more efficiently at 650 °C compared to 550 °C. In an XRD analysis of the microparticles after magnesiothermic reduction at 750 °C, only diffraction peaks corresponding to Si and MgO were observed. This result indicates that the reduction proceeded at sufficiently high temperatures during the magnesiothermic reduction process [
19]. Consequently, 750 °C was determined to be the optimal reduction temperature. While lower temperatures resulted in incomplete reduction and Mg
2Si formation, reduction at 750 °C yielded a mixture of only Si and MgO. The reduction in SiO
2 using magnesium, which is a strong reducing agent, proceeds according to the following reaction:
This reaction is thermodynamically favorable at temperatures between 700 and 800 °C. However, excessive amounts of Mg and an unstable reduction process lead to the further reaction of Si with Mg, resulting in the formation of by-products through the following side-reaction:
This reaction can occur spontaneously at elevated temperatures and is a major factor contributing to the decrease in Si yield. In addition, the resulting MgO and unreacted SiO
2 may further react to form Mg
2SiO
4 phase during prolonged exposure to high temperatures, as shown in the following reaction:
Therefore, the precise control of Mg feeding amount and reaction time at 750 °C is essential for enhancing the reduction efficiency and suppressing the formation of by-products such as Mg
2Si and Mg
2SiO
4 [
20].
The morphological changes in the microparticles after the magnesiothermic reduction process were analyzed using FE-SEM.
Figure 3b,c show that the overall spherical shape of the microparticles and the pomegranate-shaped surface structure formed during the USP process were well-maintained.
Figure 3d presents the cross-sectional microstructure and elemental distribution of the microparticles after the reduction process. The FIB-SEM analysis revealed that the internal porous structure of the particles was maintained after reduction, and EDS mapping images confirmed that Si, Mg, and O elements were uniformly distributed throughout the entire particle. This shows that Mg vapor effectively penetrated the interior through the porous framework, enabling uniform magnesiothermic reduction across the whole particle.
An acid leaching process was performed to remove MgO, which was generated during the magnesiothermic reduction in SiO
2 microparticles. MgO reacts with hydrochloric acid to produce MgCl
2, which is water-soluble. MgCl
2 was dissolved in water and subsequently removed, leaving behind Si [
21].
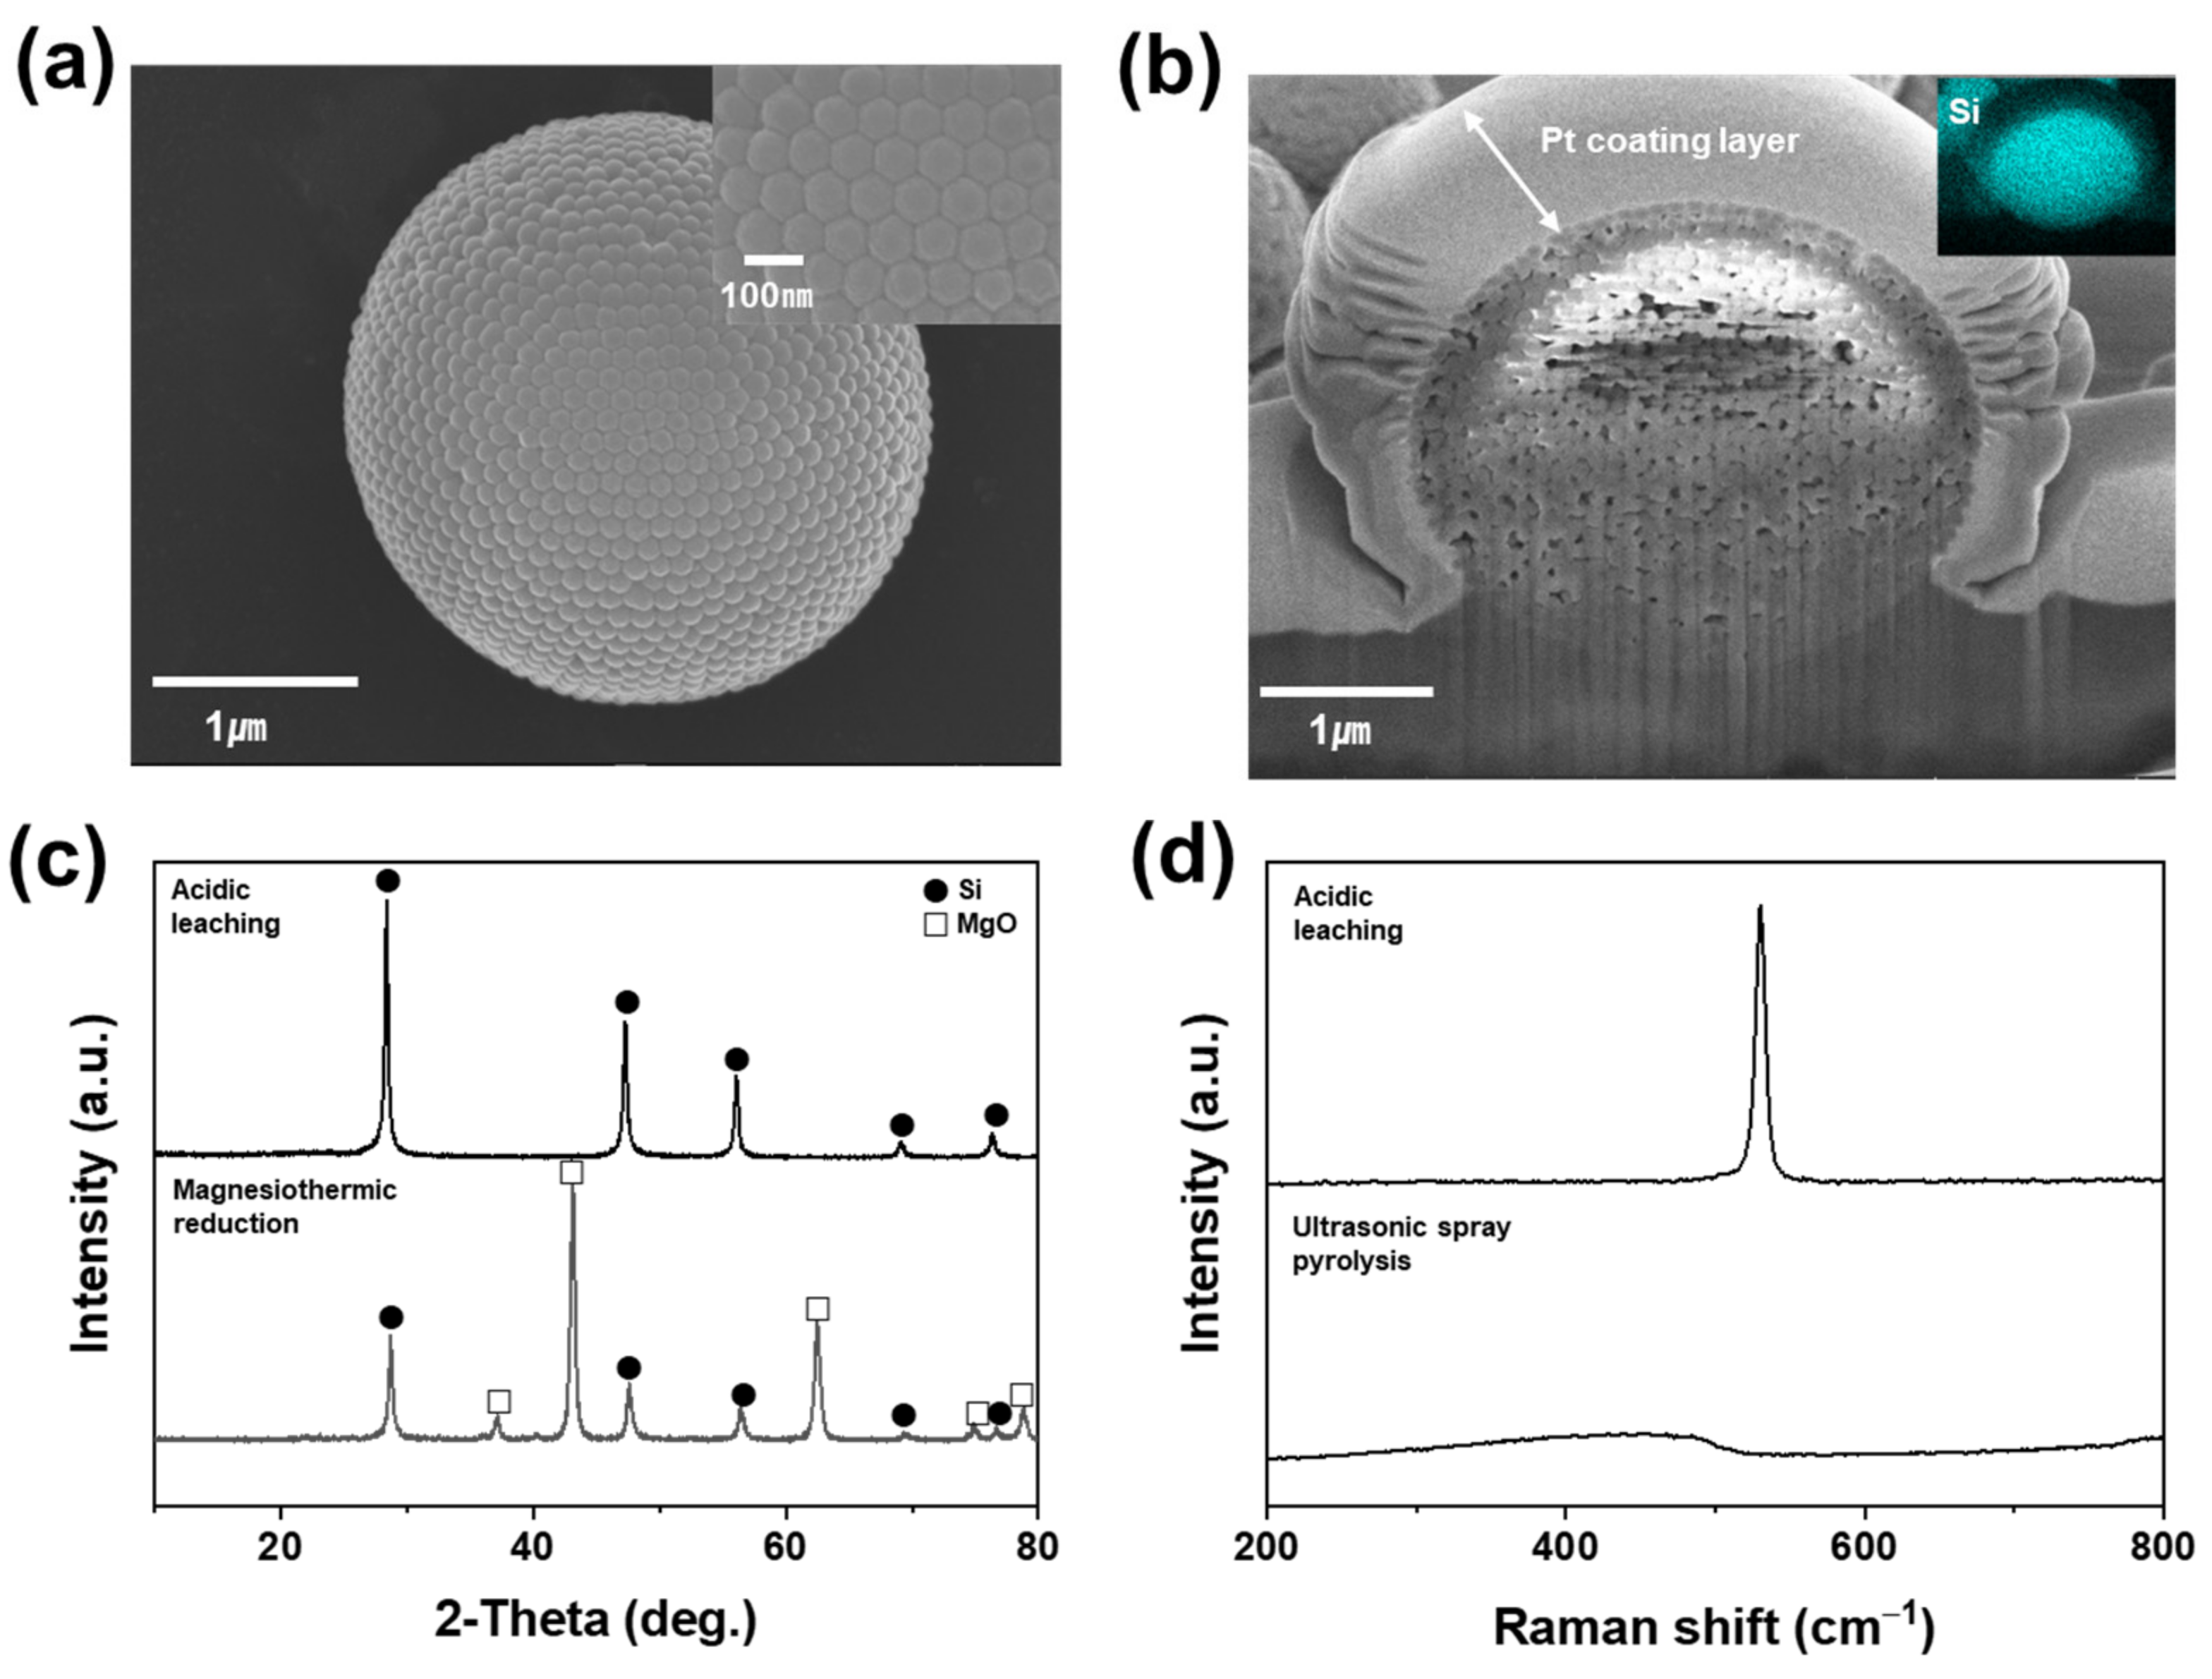
Figure 4 shows the characteristics of the microparticles after the acid leaching process. The morphology of the microparticles shown in
Figure 4a confirms that the structure, which is composed of nanoscale surface particles, was preserved during the acid leaching process. The cross-sectional SEM image in
Figure 4b also shows that the internal pores remained after the acid leaching process. In addition, an EDS mapping analysis showed that only Si was detected and Mg-containing by-products were effectively removed from the particle’s interior.
Figure 4c presents XRD patterns comparing the crystalline structure of the microparticles before and after the acid leaching process. Before the acid leaching, diffraction peaks corresponding to Si and MgO were observed in the microparticles. The peaks associated with MgO completely disappeared and only the peaks corresponding to Si were distinctly detected after acid leaching.
Figure 4d presents Raman spectra comparing SiO
2 particles synthesized using the USP process with Si particles obtained after the magnesiothermic reduction and acid leaching. The Raman spectrum of SiO
2 particles from the USP process exhibited a broad and featureless profile, which is indicative of the amorphous structure. In contrast, the Si particles obtained after the acid leaching showed a distinct peak near 520 cm
−1, confirming the transformation from SiO
2 to Si [
22,
23].
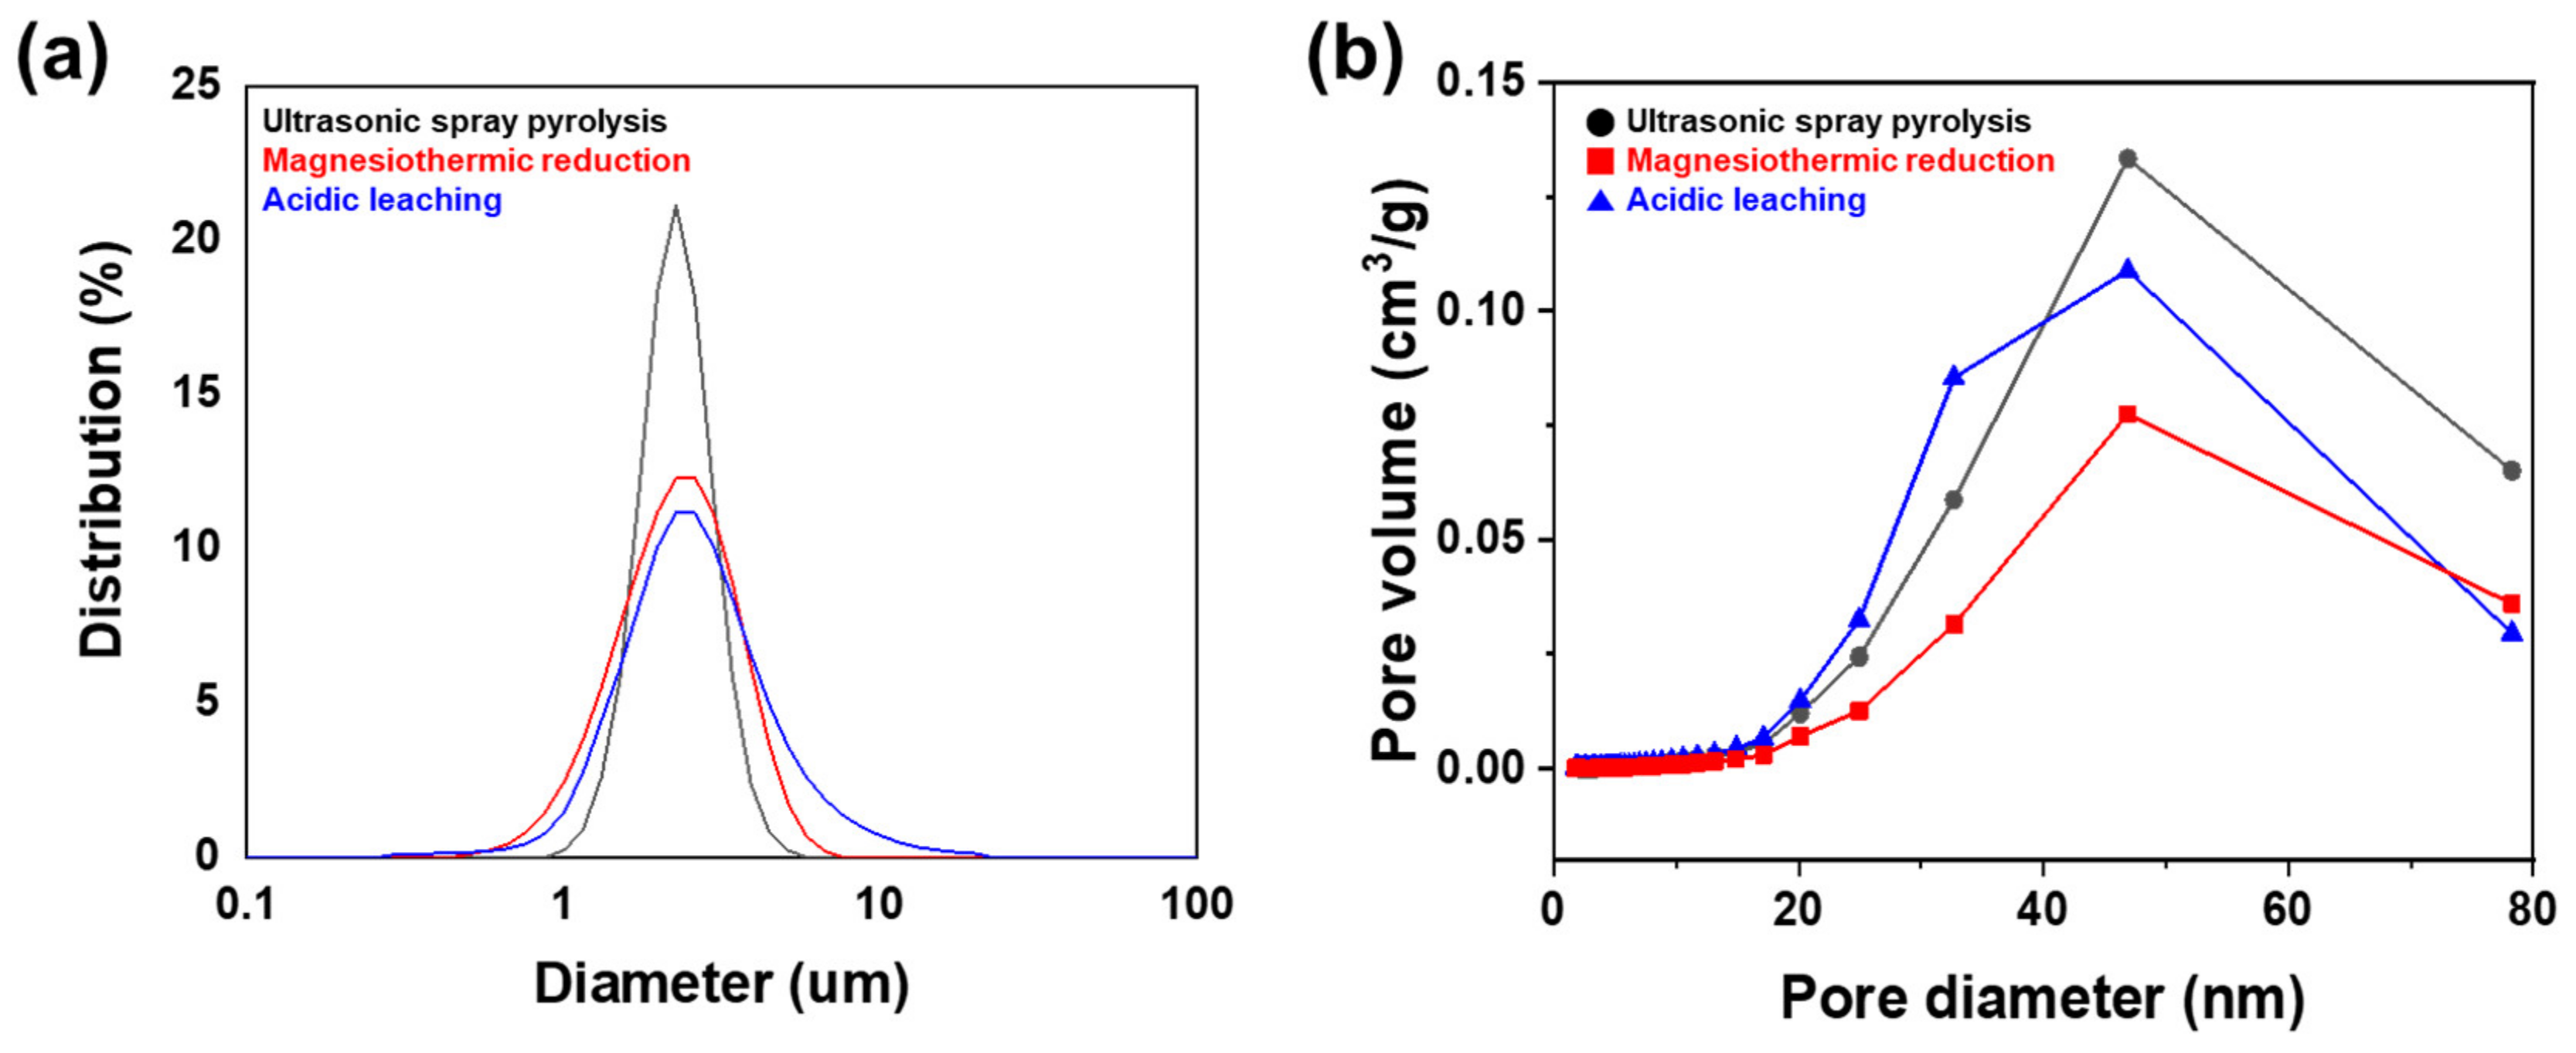
Figure 5 shows the changes in the particle size and pore characteristics of microparticles resulting from the USP process, magnesiothermic reduction, and acid leaching. According to the PSA results in
Figure 5a, SiO
2 particles synthesized using USP exhibited an average particle size of 2.35 μm. The average particle size temporarily increased to 2.88 μm after magnesiothermic reduction due to the formation of MgO by-products and localized agglomeration. During the subsequent acid leaching process, the chemical dissolution and removal of MgO resulted in decrease in the average particle size to 2.37 μm. The narrow particle size distribution observed throughout all processing steps indicates that the monodispersity and uniformity of the particles were maintained.
Figure 5b shows that the internal pores of the pomegranate-shaped SiO
2 microparticles synthesized using USP exhibited a pore size distribution ranging from 3 to 40 nm. The internal pore distribution remained within a similar range after magnesiothermic reduction and acid leaching. However, the pore volume slightly decreased after magnesiothermic reduction and then increased following the acid leaching treatment. This result is attributed to the residual Mg-containing by-products generated during the reduction process, which may have partially filled the internal pores [
24]. The physical properties of the particles after each manufacturing process step are summarized in
Table 1.
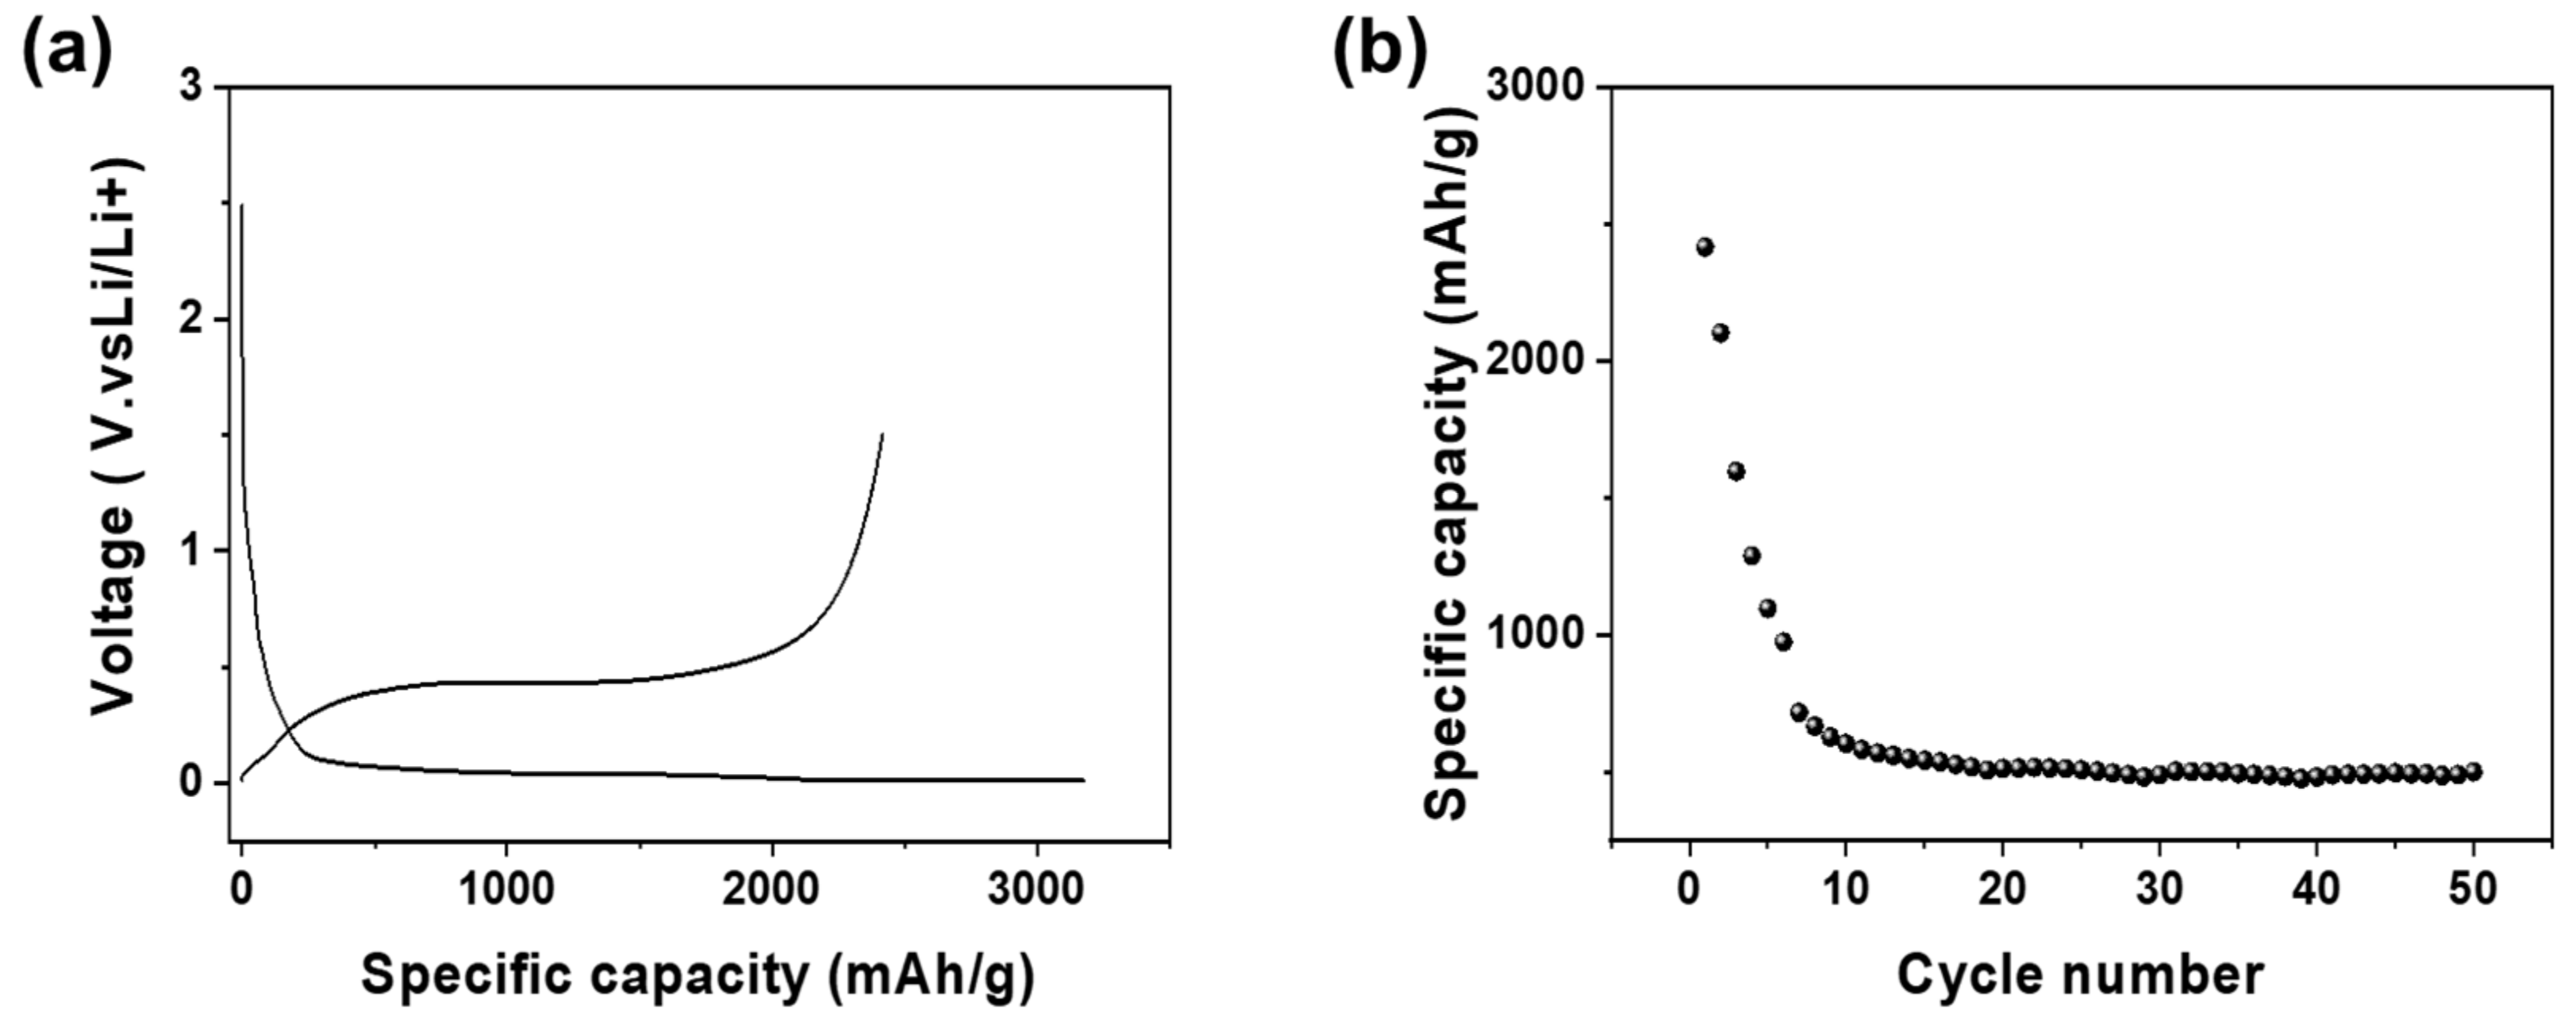
To evaluate the potential of pomegranate-shaped Si microparticles as anode active materials for Li ion batteries, voltage-capacity profiles were obtained using half cells.
Figure 6a shows the voltage–capacity curve during the first lithiation/delithiation cycle, where the charge and discharge capacities were approximately 3179 mAh g
−1 and 2416 mAh g
−1, respectively. While these results demonstrate high capacity characteristics approaching the theoretical capacity of Si, the initial coulombic efficiency of approximately 80% indicates the presence of an initial capacity loss. This loss is attributed to electrolyte decomposition on the Si surface and the formation of a solid electrolyte interphase [
25].
Figure 6b shows the cycling performance of the pomegranate-shaped Si microparticles over 50 cycles under the same current density. After the second cycle, the capacity gradually declined, and the discharge capacity after 50 cycles was maintained at approximately 500.9 mAh g
−1. This initial capacity degradation is attributed to the mechanical instability of the densely packed nanoparticles under volume expansion, which exceeded the cushioning capability of the internal pores. In addition, a slight increase in discharge capacity was observed in the latter half of the cycles. This result is associated with the gradual activation of the internal core regions within the microparticles. As lithiation/delithiation cycles proceed, the microcracks generated during the initial volume expansion act as new channels for electrolyte infiltration. This allows the previously unreacted regions within Si particles to gradually participate in the electrochemical reaction, leading to slight increase in capacity in the later cycles [
18,
24,
26].




 ,
,