Abstract
Thermal imaging drones have transformed wildlife monitoring by facilitating the efficient and noninvasive monitoring of animal populations across large areas. In this study, an optimized flight path design was developed for monitoring wildlife on Guleopdo Island, South Korea using the DJI Mavic 3T drone equipped with a thermal camera. We employed a strata-based sampling technique to reclassify topographical and land cover information, creating an optimal survey plan. Using sampling strata, key waypoints were derived, on the basis of which nine flight paths were designed to cover ~50% of the study area. The results demonstrated that an optimized flight path improved the accuracy of detecting Formosan sika deer (Cervus nippon taiouanus). Population estimates indicated at least 128 Formosan sika deer, with higher detection efficiency observed during cloudy weather. Customizing flight paths based on the habitat characteristics proved crucial for efficient monitoring. This study highlights the potential of thermal imaging drones for accurately estimating wildlife populations and supporting conservation efforts.
1. Introduction
Global habitat change and population decline of various wildlife species have emerged as major environmental concerns [1,2]. Rapid urbanization, deforestation, and agricultural expansion have led to significant habitat loss, accelerating the population decline of numerous wildlife species [3]. Moreover, the spread of invasive wildlife species has intensified due to climate change and increased trade. This spread poses a severe threat to native ecosystems, resulting in biodiversity loss through competition, predation, and disease transmission among native species [4]. In particular, changes in the habitat of native species and the spread of invasive species cause significant disruptions across ecosystems, making precise wildlife monitoring a critical task for environmental conservation and biodiversity protection. In light of these challenges, there is a growing need for more efficient and sophisticated monitoring methods that can accurately track the distribution and habitat status of wildlife.
Traditionally, track surveys and camera traps have been used for wildlife monitoring [5,6]. These methods have the ability to perform intensive monitoring over large areas within a short timeframe, even more considerably with increasing area size [7]. Although the monitoring design considers the surrounding habitat environment, it is often restricted to narrow areas, making it challenging to determine where wildlife predominantly resides in real-time [8]. These limitations lead to significant challenges in effectively detecting and tracking species that require management, such as invasive or endangered species. Consequently, the detection efficiency decreases, and the accuracy and reliability of monitoring efforts are compromised. Therefore, a novel approach is required to monitor complex terrains of wildlife habitats and various environmental factors while facilitating the real-time monitoring of large areas.
Advancements in drone technology have led to transformative changes in wildlife research. In particular, the commercialization of personal drones and cost reduction have made drone-based monitoring increasingly common in the field [9]. The superior agility and maneuverability of drones facilitate the rapid monitoring of large areas and make observations possible even in rugged terrains that humans cannot access, greatly enhancing their utility. Furthermore, thermal imaging drones, which detect animals on the basis of body heat, are more effective at collecting crucial ecological data that traditional monitoring tools struggle to capture, such as wildlife size, body length, precise population counts, and behavioral patterns [10,11,12,13]. Beaver et al. [14] demonstrated the applicability of thermal imaging drones for wildlife population monitoring by using them to estimate the population of white-tailed deer (Odocoileus virginianus). Their study found that thermal imaging drones were more cost-effective and offered higher detection rates and precision than traditional aerial surveys. Additionally, Larsen et al. [15] analyzed the gender and population structure of red deer (Cervus elaphus) and roe deer (Capreolus capreolus) using thermal imaging drones, demonstrating that this method facilitates the collection of ecological data in a more time-efficient and less invasive manner than conventional approaches.
Drones can cover larger areas compared to traditional methods; however, enhancing the efficiency of wildlife monitoring requires more than mere drone usage. Designing the drone’s flight path is also a critical factor that influences the probability of detection. Recent studies have explored flight path optimization for drones in various applications, such as precision agriculture, disaster management, and logistics, showcasing the versatility of these strategies in addressing diverse challenges [16,17,18,19]. These studies emphasize the importance of tailoring flight paths to each application’s specific objectives and environmental conditions. In the context of wildlife monitoring, a customized flight path that reflects the survey area’s topographical features and land cover greatly enhances detection success rates and maximizes the effectiveness of drone usage.
Thermal imaging drones detect heat sources based on body temperature and offer superior operational flexibility and detection rates compared to RGB camera drones, as they can operate both day and night [20]. However, in countries where night flights are restricted, the choice of daytime flight times significantly influences detection probabilities, greatly affecting the efficiency of daytime surveys. Therefore, selecting specific seasons and times of day for monitoring is crucial for ensuring accurate detection. Flying over and monitoring all regions within a limited timeframe can be challenging in expansive and complex terrains. To address this challenge, it is essential to adopt optimized flight strategies tailored for efficient data collection, moving beyond the limitations of straightforward grid-based paths.
The aim of this study was to identify key waypoints and design an optimal flight path for effectively monitoring wildlife using thermal imaging drones. To achieve this, a sampling strata technique was employed to comprehensively reclassify topographical and land cover information while determining a consistent drone flight altitude on the basis of the technical specifications of the thermal camera. Flights were conducted only during practical periods for thermal drones, as determined by predesigned flight paths, to enhance detection efficiency. This approach is expected to enhance the accuracy of estimating wildlife populations within their habitats and provide effective drone operation strategies applicable to wildlife monitoring by identifying the ideal environmental conditions for optimal flight path design.
2. Materials and Methods
2.1. Study Site
The study was conducted on Guleopdo Island, Ongjin County, Incheon, South Korea (Figure 1). Guleopdo Island is a populated island located on the mid-western coast of the Yellow Sea, South Korea, ranging from 125°57′34′′ to 125°59′50′′ E and 37°10′53′′ to 37°12′15′′ N. It is part of the Deokjeok Archipelago, which comprises 8 populated and 34 unpopulated islands [21]. The island is situated ~90 km southwest of the mainland and covers an area of 171 ha. In the early 2000s, Formosan sika deer (Cervus nippon taiouanus) were introduced to Guleopdo Island for antler production. However, owing to inadequate management and uncontrolled release, the deer population entered the wild, where the absence of competing species and natural predators allowed their numbers to increase rapidly, causing significant damage to the natural ecosystem and crops. Currently, the Formosan sika deer are known to be the only wild animal inhabiting Guleopdo Island.
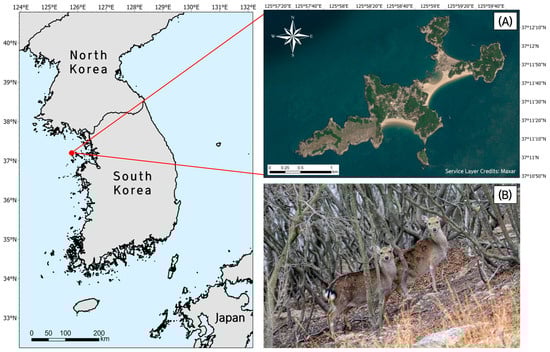
Figure 1.
(A) Location of Guleopdo Island, Ongjin County, Incheon, South Korea, selected as the study site (Source: Esri, Maxar, GeoEye, Earthstar Geographics, CNES/Airbus, DS, USDA, AeroGRID, IGN, and the GIS User Community); (B) photograph of Formosan sika deer inhabiting Guleopdo Island.
Guleopdo Island has an isolated ecosystem, which prevents the introduction of new mammalian species or individuals from the external environment and facilitates accurate population estimation. Moreover, because only a single species inhabits the island, the detection and classification of the target species are relatively straightforward without the need for complex identification procedures. Considering these advantages, Guleopdo Island was selected as the spatial scope of this study to focus on improving the efficiency of drone flights and thermal imaging. The wildlife survey was conducted during winter—specifically from 28 January to 31 January 2024—to be able to detect wildlife beneath the forest canopy.
2.2. Flight Path Optimization
The overall research flow for the data processing and analysis techniques designed in this study is presented in Figure 2. The following steps were taken to achieve the research objectives:
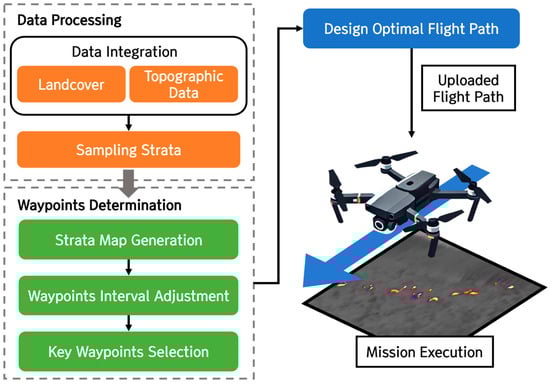
Figure 2.
Overview of the flight path optimization process. The technical workflow includes data integration, sampling strata, strata map generation, and key waypoint determination. The designed flight path is uploaded to the drone for mission execution.
- (i)
- Various spatial data were integrated and converted into consistent data to create a unified dataset for stratification purposes.
- (ii)
- The integrated data were sampled using a strata technique to create a strata map representing different spatial combinations.
- (iii)
- Next, suitable drone flight altitudes and hovering intervals were determined to detect wildlife heat sources.
- (iv)
- Using the occurrence ratios of spatial combinations identified in the strata map, the number of sampling points (i.e., waypoints) for drone flights was determined.
- (v)
- Finally, optimal flight paths were established by considering potential flight obstacles and efficiency using the selected key waypoints within the target survey area.
2.3. Technical Specifications of the Drone
In this study, DJI Mavic 3T was used to detect individual animals on the basis of their body heat. DJI Mavic 3T has a multi-camera system that combines three high-performance cameras, making it optimal for various imaging conditions, including high-resolution wide-angle capture, zoom capability, and thermal detection. The wide-angle camera, based on a 1/2-inch CMOS sensor, has an equivalent focal length of 24 mm and a resolution of 48 MP, facilitating precise image collection over a broad field of view. Additionally, the zoom camera, which supports 56× hybrid zoom, has an equivalent focal length of 162 mm and a resolution of 12 MP, facilitating detailed long-range imaging.
Furthermore, the thermal camera features a 61° display field of view (DFOV), an equivalent focal length of 40 mm, and a 28× zoom capability, providing thermal imaging with a resolution of 640 × 512 pixels. It can detect temperatures ranging from −20 °C to 500 °C, making it highly effective for detecting the thermal signatures of wildlife. After detecting the heat source (wildlife) with the drone’s thermal camera, we manually enlarged the image using the zoom camera to visually verify the presence of individual animals.
2.4. Flight Path and Imaging Strategy for Thermal Detection
The drone flights were conducted using a hover-and-capture method, with the thermal camera positioned vertically downward (i.e., gimbal at −90°) to determine the optimal spacing between still photography capture points (Figure 3). First, the horizontal field of view (HFOV) and vertical field of view (VFOV) were calculated based on the DFOV and aspect ratio of the thermal camera, which were provided in the camera specifications.
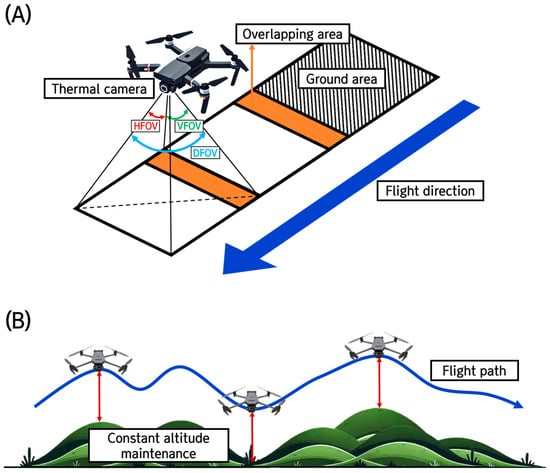
Figure 3.
Depiction of thermal drone flight strategy and path execution. (A) Thermal drone detecting ground areas along designated waypoints. (B) Drone maintaining a constant altitude while traversing the flight path over varying terrain.
An optimal flight altitude of 80 m was selected based on empirical testing, operational feasibility, and safety considerations. This altitude ensured the clear identification of individual animals in thermal images, accounting for the drone’s speed and sensor capability, while minimizing disturbance to wildlife behavior; no avoidance or flight responses were observed. It provided a safe buffer above forest canopies to prevent collisions while balancing image clarity with efficient survey area coverage. The width of the ground area projected vertically from this altitude was then calculated using the following equation:
During the imaging process, if target individuals are positioned at the edges of each image, they may be partially cut off, which may considerably affect the accuracy of detection and population estimation. To prevent this issue, the spacing between capture points was deliberately predetermined. Although the thermal camera used on the drone had an aspect ratio of 5:4, the ground area was assumed to be square for calculation purposes, resulting in a side length of ~65 m at an 80 m altitude. Under these conditions, the spacing between capture points was set to 50 m to ensure more than 20% overlap between images. This overlap was intended to enhance the accuracy and reliability of data collection.
2.5. Stratified Spatial Framework for Designing the Flight Path
Thermal imaging is used to identify wildlife heat signatures rather than the heat accumulated on the ground surface. It is crucial to complete imaging shortly after sunrise, after which the surface temperature rises considerably. Due to time constraints, focusing drone flights on regions with common spatial characteristics within the target area is preferable. To achieve this, a sampling strata technique was used to classify and combine various characteristics, such as land cover related to wildlife habitat and the terrain of the survey area, into consistent strata while minimizing spatial information bias for selecting imaging points. This technique is widely used in ecological studies, as it allows spatial information to be stratified such that each stratum represents the region’s diversity, promoting balanced sampling within each stratum [22,23,24,25].
Most wild animals, including the Taiwanese sika deer, are nocturnal and rest under the forest canopy after sunrise [15,26]. Considering their behavioral characteristics, the land cover map [27] was reclassified to simplify forest areas and open vegetation into distinct categories. The terrain data were derived from SRTM (Shuttle Radar Topography Mission) DEM data at a resolution of 30 m, providing information on elevation and slope. The land cover and terrain data were further categorized into three classes based on their value ranges. Subsequently, the reclassified land cover, DEM, and slope data were combined, excluding combinations containing missing values, to generate a strata map with 18 combinations (Figure 4). Sampling strata analysis was conducted using the “sgsR” package [28] in the open-source statistical program R (ver. 4.4.2) [29].
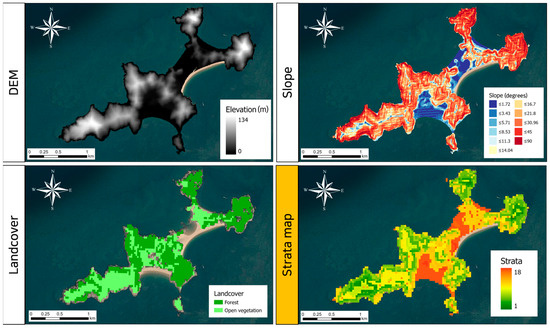
Figure 4.
Input data used for generating the sampling strata and the resulting strata map. (Top left) DEM showing elevation across Guleopdo Island; (top right) slope map indicating terrain steepness; (bottom left) landcover map categorizing forest and open vegetation areas; and (bottom right) strata map generated from the integrated input data.
Drone waypoints were initially kept evenly spaced across the entire survey area, with an interval of 50 m, to ensure complete coverage. Subsequently, the key waypoints were reselected based on the occurrence ratios of each stratum in the strata map, focusing on capturing the core areas. When designing the flight path, to ensure flight safety, key waypoints were chosen within regions with similar terrain characteristics, and these points were connected to establish the optimal flight path. The flight altitude for each capture point was calculated using Equation (4), ensuring that the distance from the ground remained consistent at 80 m regardless of terrain elevation variations within the survey area. This was accomplished using the elevation data of capture points derived from DEM and the predetermined position of the operator. The operator’s position was also carefully chosen, considering terrain characteristics for continuous drone-controller communications.
where Hwaypoint is the flight altitude at the waypoint, Ewaypoint is the waypoint elevation, Htarget is the target flight altitude, and Eoperator is the elevation of the operator’s position.
The drone’s flight speed was set at 3 m/s to facilitate precise wildlife monitoring, while minimizing hovering at each capture point to reduce battery consumption. Finally, a CSV file was generated containing the preplanned drone flight conditions, including the coordinates of the capture points, flight speed, altitude, imaging method, and gimbal angle. The CSV file was then converted to a KML flight path file using a Python code obtained from GitHub [30], which was subsequently uploaded to the drone controller. All flights were conducted within visual line-of-sight (VLOS) to ensure compliance with legal regulations and maintain safe and reliable operation. Accordingly, the operator’s position and the coverage area of the flight paths were carefully adjusted to maintain continuous visual contact with the drone.
3. Results
3.1. Optimized Flight Path and Measurement of the Survey Time
Using the strata map of the study site, 158 key waypoints were selected based on the occurrence ratios of each stratum (Figure S1). The final flight paths (i.e., waylines), designed to reflect the partitioned flight zones, are presented in Figure 5. During the flight operations, the altitude for all waylines was consistently maintained at a uniform distance from the ground, ensuring that the body size of the target species in the thermal images remained consistent throughout. Additionally, signal transmission between the drone and the controller was stable across all waylines. The total flight time for each wayline accounted for the preset flight speed and hovering time at each capture point, with detailed information shown in Table 1. Upon completing all the waylines, the drone traversed 83 ha, corresponding to ~50% of the total survey area.
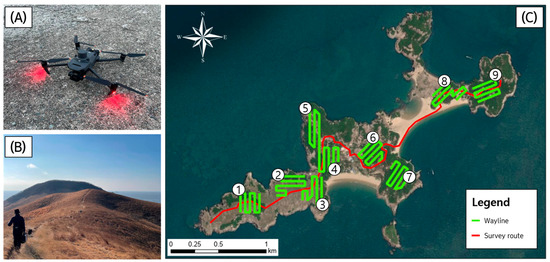
Figure 5.
Field operation setup and finalized flight path on Guleopdo Island. (A) DJI Mavic 3T thermal drone used for wildlife detection. (B) Landscape view of Guleopdo Island. (C) Map showing the finalized flight paths (waylines) and survey routes used for wildlife monitoring.

Table 1.
Summary of waylines, including the number of waypoints and corresponding flight time for each wayline.
3.2. Wildlife Detection Outcomes from Flight Path Execution
The wildlife survey was conducted over 3 days, and the researchers walked along the survey route that traversed the entire Guleopdo Island and operated the drone to fly the nine predesigned flight paths from the operator’s position. The number of individual wild animals was determined by visually inspecting all still photographs obtained during the survey, with counts performed for each day and each path (Figure 6). The population estimation results showed the highest total count was recorded on the first day of the survey, indicating that at least 128 Formosan sika deer inhabit the entire Guleopdo Island (Table 2). During the survey period, the highest number of detections consistently occurred along flight paths 6 and 7, indicating that a large group was spatially concentrated in the southeastern region of Guleopdo Island.
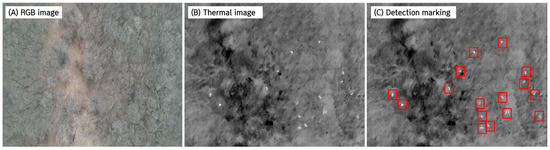
Figure 6.
Example images captured at the same waypoint using different sensors. (A) RGB image taken by the RGB camera of the drone; (B) thermal image showing potential wildlife heat signatures; and (C) detection marking showing individuals identified from the thermal image through visual inspection.
Table 2.
Number of individual wild animals detected along each wayline over 3 days of the survey. Counts represent the number of individuals visually inspected during each flight for each day.
4. Discussion
4.1. Optimizing Drone Flight Strategies for Wildlife Monitoring
In this study, a sampling strata technique was employed to effectively detect wildlife using thermal imaging drones within limited space and time constraints. The application of this sampling method was a critical strategic choice to obtain reliable detection results and control various environmental variables [24,25]. Although drones have been employed as the primary detection tool in wildlife monitoring, the need for operators to move and position themselves along the predetermined survey routes to conduct flights poses a potential source of variability in detection results owing to differences in efforts among operators. For example, variations in walking speed among operators could result in differences in survey duration, which results in some operators performing surveys when ground heat is more pronounced, affecting detection accuracy. Such variability greatly affects detection outcomes and compromises the reliability of monitoring. To mitigate these issues, it is crucial to either increase the number of drones deployed during the survey or design the survey to standardize and equalize the efforts among operators as much as possible [31].
Moreover, the findings demonstrated that, even with identical survey protocols, detection results may vary due to differences in external environmental conditions during the survey. This study surveyed the exact location along identical flight paths for three consecutive days; however, the number of detected individuals varied substantially (Table 2). On day 1, when the highest number of Formosan sika deer was detected, the conditions were optimal for post-sunrise detection, with thick cloud cover limiting ground heat. In contrast, on days 2 and 3, clear weather led to a rapid increase in surface temperature, causing interference from ground heat and considerably decreasing the number of detected individuals (Figure S2).
To improve detection reliability and minimize the risk of double-counting, flight paths in this study were carefully designed with overlapping sections, enabling the visual cross-verification of detections. The 80 m flight altitude, validated through pre-survey trials, did not affect the behavior of the target species and provided optimal image clarity for visual classification. The optical zoom camera also facilitated species confirmation, verifying that the detected animals were Formosan sika deer. Although this study focused on a single-species population in an isolated ecosystem, the combined use of thermal imaging and high-resolution optical sensors demonstrates strong potential for broader monitoring applications. This approach could be particularly useful in more complex habitats that support multi-species by improving species differentiation and enabling precise morphological identification.
The season during which flights are conducted plays a crucial role as a variable. In this study, to maximize the detection of the Formosan sika deer inhabiting the survey area, drone flights were performed in the winter when the deciduous broadleaf trees had shed their leaves. This choice was made to reduce the interference caused by evergreen trees, thereby enhancing the detection efficiency of the thermal imaging drone. It was confirmed that thermal imaging drones were able to effectively detect wildlife despite the presence of black pine (Pinus thunbergii) forest, an evergreen coniferous forest type within the survey area. However, because wild animals frequently rest under the forest canopy during the day, detection using thermal imaging drones may be considerably challenging during seasons with high vegetative vigor [15,26]. Therefore, season selection is a critical factor to consider when planning drone flights.
Additionally, differences in national regulations regarding drone flight have a significant impact on wildlife detection outcomes. For instance, in South Korea, night flights are generally prohibited, and special permission is required to operate drones after dark [32]. Owing to these legal restrictions, drone flights in this study were limited to daylight hours, from sunrise to sunset. Considering that most wildlife species are nocturnal [33,34], conducting flights at night could be highly effective in minimizing the influence of ground heat and maximizing detection efficiency. Thus, improved detection results could be expected in countries where night flights are legally permissible. Additionally, the effectiveness of wildlife monitoring using drones is substantially influenced by various environmental, seasonal, and legal factors. Therefore, thorough consideration of these factors and careful adjustment of survey plans are essential for enhancing detection efficiency and producing reliable results.
4.2. Enhancing the Accuracy of Wildlife Monitoring for Reliable Population Estimation
The use of thermal imaging drones for wildlife detection has significant potential for accurately estimating wildlife populations within a large area in a relatively short period. Although the usability of the thermal camera was restricted by the influence of ground heat, which limited the available flight time, a sampling strata technique was applied to select waypoints to mitigate these constraints effectively. The survey confirmed that at least 128 Formosan sika deer inhabit Guleopdo Island (Table 2).
Previous studies have reported the use of camera traps to estimate the population of Formosan sika deer on Guleopdo Island [35]. Camera traps are valuable tools for accumulating occurrence data over extended periods in wildlife monitoring, proving efficient for the continuous long-term observation and analysis of behavioral patterns in response to habitat changes. They are primarily recognized as effective methods for understanding the frequency of wildlife activity at specific locations or observing interactions between individuals [36,37]. However, when estimating population sizes, the accuracy of estimates may be limited if the frequency of target species occurrences varies greatly depending on the placement of cameras and environmental factors [35]. Moreover, camera traps require a prolonged operational period to collect sufficient data for statistical population estimation, and it is highly challenging to distinguish individuals if the same animals are detected repeatedly [38,39]. In contrast, thermal imaging drones can detect wildlife locations in real-time, identify individual animals, and count them simultaneously, leading to a more accurate population estimate. Such capabilities demonstrate that thermal imaging drones can effectively balance temporal efficiency and accuracy in wildlife population estimation.
In this study, despite designing a flight path that maintained a consistent altitude and speed to optimize detection efficiency, significant variations were observed in the number of individuals detected on different survey days (Table 2). Such variations lead to substantial limitations in accurately estimating the overall population of wildlife inhabiting the survey area. Therefore, future studies should employ statistical modeling approaches that account for undetected individuals. For example, Bayesian frameworks, such as N-mixture models or occupancy modeling, can correct the imperfect detection probability [40,41,42]. Kidwai et al. [43] demonstrated that N-mixture models significantly enhance the reliability of aerial wildlife population surveys by correcting for imperfect detection, thereby providing more precise abundance estimates for large mammals such as the black rhinoceros (Diceros bicornis L.). Wevers et al. [44] utilized a scale-optimized occupancy modeling approach to correct for imperfect detection probabilities, thereby improving the precision of species–habitat relationship analysis and enhancing the understanding of habitat selection by wild boar (Sus scrofa) and roe deer.
For thermal imaging drones, consistent data collection during optimal times of the day and under favorable weather conditions through repeated surveys enhances the reliability of such Bayesian models and contributes to a more precise estimation of wildlife population and population density within the target area. This approach can greatly improve the accuracy of wildlife monitoring using thermal imaging drones.
4.3. Implications and Prospective Value in Wildlife Monitoring Studies
Cervid species primarily cause browsing damage to herbaceous plants and young saplings, which, if prolonged, considerably hinders vegetation growth and seedling recruitment, ultimately leading to a severe reduction in biodiversity [45,46]. Moreover, they are highly prolific animals, which leads to rapid population growth and increased ecological pressures [46,47]. This issue negatively affects the structure and function of natural ecosystems, necessitating active population management. Therefore, as a first step in obtaining baseline data for control activities, we employed thermal imaging drones to accurately estimate the population of Formosan sika deer, which have long inhabited Guleopdo Island. The results suggested that rapid and precise population estimation using thermal imaging drones is an effective monitoring and management tool in areas with intensive damage by deer species.
The flight path design method proposed in this study effectively detects wildlife by allowing flexible adjustments to flight conditions based on environmental factors and habitat characteristics. Optimizing flight parameters—such as altitude, speed, and time of day—facilitates monitoring that suits specific ecological contexts, improving detection efficiency and providing essential baseline data for wildlife management and conservation. The findings of this study further demonstrated the applicability of thermal imaging drones in wildlife detection through their ability to adjust flight conditions flexibly, enhancing detection efficiency under varied habitat conditions. This approach is practical for cervid population management and has broader applications in the detection of invasive species that disrupt native ecosystems, supporting comprehensive conservation strategies.
Furthermore, wildlife detection using thermal imaging drones can be effectively used for assessing the spatial distribution of wildlife. In this study, visualizing the detection results of Formosan sika deer revealed a tendency for individuals to rest collectively in specific regions (Figure S3). Such information on population density and spatial aggregation is crucial for analyzing the vegetation and spatial characteristics of areas requiring management [48,49]. Specifically, a comprehensive analysis of food resources, habitat environments, and topographical characteristics of the area would provide an in-depth understanding of the behavioral characteristics of a species, thereby providing a critical spatial basis for developing management strategies [50,51]. Future studies are expected to provide site-specific and scientific management plans based on such spatial information, ultimately contributing to preventing the spread of invasive species and aiding in ecosystem restoration.
5. Conclusions
In this study, a flight path design method was proposed for effectively monitoring wildlife using thermal imaging drones. The flight paths were designed by selecting key waypoints using a sampling strata technique that considered the topography of the target area and environmental factors related to wildlife habitat. The results demonstrated that effective detection and reliable population estimation of wildlife across a large area within a relatively short monitoring period can be achieved using drone-based thermal imaging. Specifically, thermal imaging drones were shown to be an effective tool for overcoming the limitations of traditional wildlife monitoring methods, such as camera traps, by detecting individual locations and distributions in real-time.
Although the proposed method demonstrated strong performance, differences in detection results observed during consecutive survey days suggested that environmental factors, such as cloud cover and ground temperature, influenced detection efficiency. Future research could improve detection protocols by optimizing flight schedules for seasonal vegetation changes and environmental variability, thereby enhancing detection consistency. Moreover, combining optical sensors with thermal imaging systems may enhance species differentiation in heterogeneous, multi-species habitats, thereby broadening the applicability of this approach. Advanced statistical modeling techniques could refine detection accuracy and population estimates, strengthening their relevance for ecological monitoring and species management. The flight path design method for thermal imaging drones presented in this study is expected to support the development of more systematic and targeted strategies for habitat conservation and wildlife protection.
Supplementary Materials
The following supporting information can be downloaded at: https://www.mdpi.com/article/10.3390/drones9010052/s1, Figure S1: Distribution of key waypoints derived from sampling strata results on Guleopdo Island; Figure S2: Comparison of thermal images from the same location on Day 1 and Day 2 of the survey; Figure S3: Presence distribution map based on detection results.
Author Contributions
Conceptualization, B.C., B.H., W.L. and D.W.K.; methodology, B.C., B.H. and H.K.; software, B.C. and W.L.; validation, B.C., B.H., W.L. and D.W.K.; formal analysis, B.C., W.L. and Y.-S.P.; investigation, B.C., B.H. and W.L.; resources, B.C., Y.-S.P. and D.W.K.; data curation, B.C., H.K. and W.K.; writing—original draft preparation, B.C., B.H. and W.L.; writing—review and editing, H.K., W.K., Y.-S.P. and D.W.K.; visualization, B.C., B.H. and W.L.; supervision, Y.-S.P. and D.W.K.; project administration, W.K., Y.-S.P. and D.W.K.; and funding acquisition, W.K., Y.-S.P. and D.W.K. All authors have read and agreed to the published version of the manuscript.
Funding
This study was carried out with the support of ‘R&D Program for Forest Science Technology (Project No. RS-2024-00404816)’ provided by Korea Forest Service (Korea Forestry Promotion Institute).
Data Availability Statement
The data supporting this study are included in the paper. Further details can be provided upon reasonable request to the corresponding author.
Acknowledgments
The authors thank Yong-Hwan Kim for his helpful comments, which contributed to improving this study.
Conflicts of Interest
The authors declare no conflicts of interest.
References
- Brooks, T.M.; Mittermeier, R.A.; Mittermeier, C.G.; Da Fonseca, G.A.B.; Rylands, A.B.; Konstant, W.R.; Flick, P.; Pilgrim, J.; Oldfield, S.; Magin, G.; et al. Habitat Loss and Extinction in the Hotspots of Biodiversity. Conserv. Biol. 2002, 16, 909–923. [Google Scholar] [CrossRef]
- Pimm, S.L.; Jenkins, C.N.; Abell, R.; Brooks, T.M.; Gittleman, J.L.; Joppa, L.N.; Raven, P.H.; Roberts, C.M.; Sexton, J.O. The Biodiversity of Species and Their Rates of Extinction, Distribution, and Protection. Science 2014, 344, 1246752. [Google Scholar] [CrossRef] [PubMed]
- Daskalova, G.N.; Myers-Smith, I.H.; Bjorkman, A.D.; Blowes, S.A.; Supp, S.R.; Magurran, A.E.; Dornelas, M. Landscape-Scale Forest Loss as a Catalyst of Population and Biodiversity Change. Science 2020, 368, 1341–1347. [Google Scholar] [CrossRef]
- Doherty, T.S.; Glen, A.S.; Nimmo, D.G.; Ritchie, E.G.; Dickman, C.R. Invasive predators and global biodiversity loss. Proc. Natl. Acad. Sci. USA 2016, 113, 11261–11265. [Google Scholar] [CrossRef]
- Silveira, L.; Jácomo, A.T.; Diniz-Filho, J.A.F. Camera Trap, Line Transect Census and Track Surveys: A Comparative Evaluation. Biol. Conserv. 2003, 114, 351–355. [Google Scholar] [CrossRef]
- O’Connell, A.F. Camera Traps in Animal Ecology: Methods and Analyses; Springer: New York, NY, USA, 2011. [Google Scholar]
- Foster, R.J.; Harmsen, B.J. A Critique of Density Estimation from Camera-Trap Data. J. Wildl. Manag. 2012, 76, 224–236. [Google Scholar] [CrossRef]
- Meek, P.D.; Ballard, G.A.; Fleming, P.J. The Pitfalls of Wildlife Camera Trapping as a Survey Tool in Australia. Aust. Mammal. 2015, 37, 13–22. [Google Scholar] [CrossRef]
- Anderson, K.; Gaston, K.J. Lightweight Unmanned Aerial Vehicles Will Revolutionize Spatial Ecology. Front. Ecol. Environ. 2013, 11, 138–146. [Google Scholar] [CrossRef]
- Kim, M.; Chung, O.-S.; Lee, J.-K. A Manual for Monitoring Wild Boars (Sus scrofa) Using Thermal Infrared Cameras Mounted on an Unmanned Aerial Vehicle (UAV). Remote Sens. 2021, 13, 4141. [Google Scholar] [CrossRef]
- Witt, R.R.; Beranek, C.T.; Howell, L.G.; Ryan, S.A.; Clulow, J.; Jordan, N.R.; Denholm, B.; Roff, A. Real-time drone derived thermal imagery outperforms traditional survey methods for an arboreal forest mammal. PLoS ONE 2020, 15, e0242204. [Google Scholar] [CrossRef]
- Zhang, H.; Wang, C.; Turvey, S.T.; Sun, Z.; Tan, Z.; Yang, Q.; Long, W.; Wu, X.; Yang, D. Thermal infrared imaging from drones can detect individuals and nocturnal behavior of the world’s rarest primate. Glob. Ecol. Conserv. 2020, 23, e01101. [Google Scholar] [CrossRef]
- Chrétien, L.P.; Théau, J.; Menard, P. Wildlife Multispecies Remote Sensing Using Visible and Thermal Infrared Imagery Acquired from an Unmanned Aerial Vehicle (UAV). Int. Arch. Photogramm. Remote Sens. Spat. Inf. Sci. 2015, 40, 241–248. [Google Scholar] [CrossRef]
- Beaver, J.T.; Baldwin, R.W.; Messinger, M.; Newbolt, C.H.; Ditchkoff, S.S.; Silman, M.R. Evaluating the Use of Drones Equipped with Thermal Sensors as an Effective Method for Estimating Wildlife. Wildl. Soc. Bull. 2020, 44, 434–443. [Google Scholar] [CrossRef]
- Larsen, H.L.; Møller-Lassesen, K.; Enevoldsen, E.M.E.; Madsen, S.B.; Obsen, M.T.; Povlsen, P.; Pagh, S. Drone with Mounted Thermal Infrared Cameras for Monitoring Terrestrial Mammals. Drones 2023, 7, 680. [Google Scholar] [CrossRef]
- Boccardo, P.; Chiabrando, F.; Dutto, F.; Giulio Tonolo, F.; Lingua, A. UAV Deployment Exercise for Mapping Purposes: Evaluation of Emergency Response Applications. Sensors 2015, 15, 15717–15737. [Google Scholar] [CrossRef]
- Srivastava, K.; Pandey, P.C.; Sharma, J.K. An Approach for Route Optimization in Applications of Precision Agriculture Using UAVs. Drones 2020, 4, 58. [Google Scholar] [CrossRef]
- Ghelichi, Z.; Gentili, M.; Mirchandani, P.B. Logistics for a Fleet of Drones for Medical Item Delivery: A Case Study for Louisville, KY. Comput. Oper. Res. 2021, 135, 105443. [Google Scholar] [CrossRef]
- Xu, Y.; Li, J.; Zhang, F. A UAV-Based Forest Fire Patrol Path Planning Strategy. Forests 2022, 13, 1952. [Google Scholar] [CrossRef]
- Burke, C.; Rashman, M.; Wich, S.; Symons, A.; Theron, C.; Longmore, S. Optimizing Observing Strategies for Monitoring Animals Using Drone-Mounted Thermal Infrared Cameras. Int. J. Remote Sens. 2019, 40, 439–467. [Google Scholar] [CrossRef]
- Ministry of Oceans and Fisheries. Uninhabited Island Status Survey and Integrated Management Plan; Ministry of Oceans and Fisheries: Seoul, Republic of Korea, 2005. (In Korean) [Google Scholar]
- Šmilauer, P.; Lepš, J. Multivariate Analysis of Ecological Data Using CANOCO 5; Cambridge University Press: Cambridge, UK, 2014. [Google Scholar]
- Pollock, K.H.; Nichols, J.D.; Simons, T.R.; Farnsworth, G.L.; Bailey, L.L.; Sauer, J.R. Large-Scale Wildlife Monitoring Studies: Statistical Methods for Design and Analysis. Environmetrics 2002, 13, 105–119. [Google Scholar] [CrossRef]
- Sedda, L.; Lucas, E.R.; Djogbénou, L.S.; Edi, A.V.C.; Egyir-Yawson, A.; Kabula, B.I.; Midega, J.; Ochomo, E.; Weetman, D.; Donnelly, M.J. Improved Spatial Ecological Sampling Using Open Data and Standardization: An Example from Malaria Mosquito Surveillance. J. R. Soc. Interface 2019, 16, 20180941. [Google Scholar] [CrossRef] [PubMed]
- Danz, N.P.; Regal, R.R.; Niemi, G.J.; Brady, V.J.; Hollenhorst, T.; Johnson, L.B.; Host, G.E.; Hanowski, J.M.; Johnston, C.A.; Brown, T. Environmentally stratified sampling design for the development of great lakes environmental indicators. Environ. Monit. Assess. 2005, 102, 41–65. [Google Scholar] [CrossRef] [PubMed]
- Rietz, J.; van Beeck Calkoen, S.T.S.; Ferry, N.; Schlüter, J.; Wehner, H.; Schindlatz, K.-H.; Lackner, T.; von Hoermann, C.; Conraths, F.J.; Müller, J.; et al. Drone-Based Thermal Imaging in the Detection of Wildlife Carcasses and Disease Management. Transbound. Emerg. Dis. 2023, 2023, 5517000. [Google Scholar] [CrossRef]
- Subdivision Land Cover Map. Available online: https://egis.me.go.kr/ (accessed on 3 January 2024).
- Goodbody, T.R.H.; Coops, N.C.; Queinnec, M.; White, J.C.; Tompalski, P.; Hudak, A.T.; Auty, D.; Valbuena, R.; LeBoeuf, A.; Sinclair, I.; et al. sgsR: A Structurally Guided Sampling Toolbox for LiDAR-Based Forest Inventories. Forestry 2023, 96, 411–424. [Google Scholar] [CrossRef]
- R Core Team. R: A Language and Environment for Statistical Computing; R Foundation for Statistical Computing: Vienna, Austria, 2023; Available online: https://www.R-project.org/ (accessed on 4 January 2024).
- IPGP. csv2djipilot: From a CSV with Coordinates to a KML Waypoints to Import in DJI Pilot. Available online: https://github.com/IPGP/csv2djipilot (accessed on 7 January 2024).
- Stachowicz, I.; Ferrer-Paris, J.R.; Sánchez-Mercado, A. Leveraging Limited Data from Wildlife Monitoring in a Conflict-Affected Region in Venezuela. Sci. Rep. 2024, 14, 1673. [Google Scholar] [CrossRef]
- Aviation Safety Act (Ordinance of the Ministry of Land, Infrastructure and Transport, Subpara. 20396, 2024. 3. 19., All Revisions). Available online: https://www.law.go.kr/ (accessed on 5 May 2024).
- Bennie, J.J.; Duffy, J.P.; Inger, R.; Gaston, K.J. Biogeography of time partitioning in mammals. Proc. Natl. Acad. Sci. USA 2014, 111, 13727–13732. [Google Scholar] [CrossRef]
- Gaynor, K.M.; Hojnowski, C.E.; Carter, N.H.; Brashares, J.S. The Influence of Human Disturbance on Wildlife Nocturnality. Science 2018, 360, 1232–1235. [Google Scholar] [CrossRef]
- Ministry of Environment. Developing IT·ET·BT Convergence-Based Distribution and Spread Models for Introduced Exotic Species; Ministry of Environment: Sejong, Republic of Korea, 2022. (In Korean) [Google Scholar]
- Wearn, O.R.; Glover-Kapfer, P. Snap Happy: Camera Traps Are an Effective Sampling Tool When Compared with Alternative Methods. R. Soc. Open Sci. 2019, 6, 181748. [Google Scholar] [CrossRef]
- Delisle, Z.J.; Flaherty, E.A.; Nobbe, M.R.; Wzientek, C.M.; Swihart, R.K. Next-Generation Camera Trapping: Systematic Review of Historic Trends Suggests Keys to Expanded Research Applications in Ecology and Conservation. Front. Ecol. Evol. 2021, 9, 617996. [Google Scholar] [CrossRef]
- Johansson, Ö.; Samelius, G.; Wikberg, E.; Chapron, G.; Mishra, C.; Low, M. Identification Errors in Camera-Trap Studies Result in Systematic Population Overestimation. Sci. Rep. 2020, 10, 6393. [Google Scholar] [CrossRef]
- Harris, G.M.; Butler, M.J.; Stewart, D.R.; Rominger, E.M.; Ruhl, C.Q. Accurate Population Estimation of Caprinae Using Camera Traps and Distance Sampling. Sci. Rep. 2020, 10, 17729. [Google Scholar] [CrossRef] [PubMed]
- Royle, J.A.; Nichols, J.D.; Kéry, M. Modelling Occurrence and Abundance of Species When Detection Is Imperfect. Oikos 2005, 110, 353–359. [Google Scholar] [CrossRef]
- Kéry, M.; Royle, J.A.; Schmid, H. Modeling Avian Abundance from Replicated Counts Using Binomial Mixture Models. Ecol. Appl. 2005, 15, 1450–1461. [Google Scholar] [CrossRef]
- Denes, F.V.; Silveira, L.F.; Beissinger, S.R. Estimating Abundance of Unmarked Animal Populations: Accounting for Imperfect Detection and Other Sources of Zero Inflation. Methods Ecol. Evol. 2015, 6, 543–556. [Google Scholar] [CrossRef]
- Kidwai, Z.; Jimenez, J.; Louw, C.J.; Nel, H.P.; Marshal, J.P. Using N-Mixture Models to Estimate Abundance and Temporal Trends of Black Rhinoceros (Diceros bicornis L.) Populations from Aerial Counts. Glob. Ecol. Conserv. 2019, 19, e00687. [Google Scholar] [CrossRef]
- Wevers, J.; Beenaerts, N.; Casaer, J.; Zimmermann, F.; Artois, T.; Fattebert, J. Modelling Species Distribution from Camera Trap By-Catch Using a Scale-Optimized Occupancy Approach. Remote Sens. Ecol. Conserv. 2021, 7, 534–549. [Google Scholar] [CrossRef]
- Rooney, T.P.; Waller, D.M. Direct and Indirect Effects of White-Tailed Deer in Forest Ecosystems. For. Ecol. Manag. 2003, 181, 165–176. [Google Scholar] [CrossRef]
- Côté, S.D.; Rooney, T.P.; Tremblay, J.P.; Dussault, C.; Waller, D.M. Ecological Impacts of Deer Overabundance. Annu. Rev. Ecol. Evol. Syst. 2004, 35, 113–147. [Google Scholar] [CrossRef]
- Augustine, D.J.; Decalesta, D. Defining Deer Overabundance and Threats to Forest Communities: From Individual Plants to Landscape Structure. Ecoscience 2003, 10, 472–486. [Google Scholar] [CrossRef]
- Morris, L.R.; Proffitt, K.M.; Blackburn, J.K. Mapping Resource Selection Functions in Wildlife Studies: Concerns and Recommendations. Appl. Geogr. 2016, 76, 173–183. [Google Scholar] [CrossRef]
- Lecours, V. On the Use of Maps and Models in Conservation and Resource Management (Warning: Results May Vary). Front. Mar. Sci. 2017, 4, 288. [Google Scholar] [CrossRef]
- Kushwaha, S.P.S.; Roy, P.S. Geospatial Technology for Wildlife Habitat Evaluation. Trop. Ecol. 2002, 43, 137–150. [Google Scholar]
- Acevedo, P.; Quirós-Fernández, F.; Casal, J.; Vicente, J. Spatial Distribution of Wild Boar Population Abundance: Basic Information for Spatial Epidemiology and Wildlife Management. Ecol. Indic. 2014, 36, 594–600. [Google Scholar] [CrossRef]
Disclaimer/Publisher’s Note: The statements, opinions and data contained in all publications are solely those of the individual author(s) and contributor(s) and not of MDPI and/or the editor(s). MDPI and/or the editor(s) disclaim responsibility for any injury to people or property resulting from any ideas, methods, instructions or products referred to in the content. |
© 2025 by the authors. Licensee MDPI, Basel, Switzerland. This article is an open access article distributed under the terms and conditions of the Creative Commons Attribution (CC BY) license (https://creativecommons.org/licenses/by/4.0/).