Abstract
Crowdsensing has gained popularity across various domains such as urban transportation, environmental monitoring, and public safety. Unmanned aerial vehicle (UAV) crowdsensing is a novel approach that collects extensive data from targeted environments using UAVs equipped with built-in sensors. Unlike conventional methods that rely on fixed sensor networks or the mobility of humans, UAV crowdsensing offers high flexibility and scalability. With the rapid advancement of artificial intelligence techniques, UAV crowdsensing is becoming increasingly intelligent and autonomous. Previous studies on UAV crowdsensing have predominantly focused on algorithmic sensing strategies without considering the impact of different sensing environments. Thus, there is a research gap regarding the influence of environmental factors and sensing strategies in this field. To this end, we designed a empirical study, classifying sensing environments into four major categories: open, urban, natural, and indoor. We conducted experiments to understand how these environments influence three typical crowdsensing strategies: opportunistic, algorithmic, and collaborative. The statistical results reveal significant differences in both environments and sensing strategies. We found that an algorithmic strategy (machine-only) is suitable for open and natural environments, while a collaborative strategy (human and machine) is ideal for urban and indoor environments. This study has crucial implications for adopting appropriate sensing strategies for different environments of UAV crowdsensing tasks.
1. Introduction
As technology continues to advance, crowdsensing is becoming increasingly pervasive across various industries and sectors [1,2]. Crowdsensing refers to the process of utilizing a large number of individuals, such as smartphone users and sensor devices, to collectively complete data collection and information perception [3,4]. Conventional crowdsensing aims to gather data from a diverse workforce by leveraging collective intelligence. It involves participants, primarily humans, employing their smart mobile devices for data collection, computation, and analysis [5]. With the rapid advancement of technology, artificial intelligence (AI) is gaining significant power, robotics are progressing at an accelerated pace, and humans are increasingly averse to engaging in repetitive and monotonous tasks. This development brings about a profound transformation in crowdsensing. Consequently, the majority of sensing activities can now be undertaken by robots and unmanned vehicles. In particular, crowdsensing based on unmanned aerial vehicles (UAVs) has started to play a crucial role due to its exceptional flexibility and mobility. The focus of this study lies in UAV crowdsensing. We posit that, within the era of AI, human workers may transition into roles as high-level operators who issue directives to AI systems and delegate remaining tasks to AI and robots. However, there is one thing that always exists—the crowdsensing environment, where UAV crowdsensing campaigns take place.
Researchers in the field of crowdsensing have primarily focused on issues such as task assignments, incentive mechanisms [6], privacy protection [7], data quality [8], and other related topics [9,10]; however, they have often overlooked or oversimplified the impact of environmental factors [11,12]. Nevertheless, it is important to acknowledge that different environments may exert varying effects on crowdsensing performance. In addition, whether in the past or present, most crowdsensing-related studies have remained largely theoretical, and practical crowdsensing applications are still relatively rare [4]. The primary challenge in the practical application of crowdsensing may be diverse and often unpredictable environments [13]. Traditionally, crowdsensing campaigns easily take place in urban environments, where it is feasible to find a sufficient number of human participants [14]. There may not be such favorable innate conditions for crowdsensing in other environments. Nowadays, the development of UAVs has led to a shift in the crowdsensing paradigm, which previously relied on humans or fixed sensor networks. Crowdsensing is convenient to put into effect because of the widespread use of UAVs. As long as UAVs can reach and explore the area, UAVs can be easily controlled and effectively utilized to collect data in various environments.
In addition to the environment, sensing strategies can also affect crowdsensing activities. There are multiple sensing strategies, such as opportunistic and algorithmic [15,16,17,18,19,20,21,22]. Different strategies perform variably across environments [23]. However, there is a lack of detailed research on their different roles in UAV crowdsensing [24]. Since the influence of environment and sensing strategies in crowdsensing has remained unexplored, we know little about their impacts on the efficiency and effectiveness of crowdsensing task completion. We, thereby, delve into this exploration through our work. In this paper, we address the following research question: how do environments and sensing strategies affect crowdsensing efficiency and effectiveness?
To address the knowledge gap, we first analyzed and classified crowdsensing environments into four basic categories: open, urban, indoor, and natural, to represent most crowdsensing scenarios to the best of our knowledge. Then, we summarized three typical crowdsensing strategies from the literature, which were opportunistic [15,16,17], algorithmic [18,19,20,21], and collaborative [22]. Next, we designed a study incorporating these four types of environments and conducted experiments to understand the role of environments when applying three different strategies. The experimental task was to use a swarm of UAVs (up to 100 UAVs) to explore an unknown environment and achieve maximum coverage. All experiments were performed on a prototype system. Particularly, we recruited 18 participants to complete crowdsensing campaigns based on a collaborative strategy. The prototype system recorded participants’ clicks to the crowdsensing campaigns.
Additionally, we measured the performance of the crowdsensing campaign in terms of effectiveness, efficiency, and human intervention. The statistical analysis revealed significant differences based on the environment and sensing strategy employed, highlighting their substantial impact on crowdsensing performance. For both efficiency and effectiveness, we argue that an algorithmic strategy could be a suitable option in open and natural environments. In contrast, a collaborative strategy is best suited for urban and indoor environments if the cost is not taken into account. This work has important implications in terms of improving the effectiveness and efficiency of crowdsensing tasks by providing insights in terms of choosing an appropriate sensing strategy.
The remainder of the paper is organized as follows. Section 2 reviews the related literature. Section 3 focuses on the study design, encompassing the environment classification, sensing strategies design, introduction to the experimental procedure, and definition of evaluation metrics. Section 4 displays and analyzes the relevant experimental results, which is followed by discussions identifying potential future research avenues in Section 5. Finally, Section 6 concludes the presented study.
2. Related Work
We introduce the related literature from five aspects: crowdsensing environments, crowdsensing strategies, crowdsensing applications, crowdsensing challenges, and data quality.
2.1. Crowdsensing Environments
Crowdsensing plays an important role in different environments. In this part, different crowdsensing activities in various environments are introduced.
The majority of crowdsensing campaigns take place in urban environments due to the good foundation and high demand for crowdsensing in the city. People with smart devices, the vehicles regularly moving around city streets, taxis, buses, and all forms of transportation can be crowdsensing nodes [25,26]. Fan et al. [27] discussed the importance of achieving fine-grained spatiotemporal sensing coverage in vehicular urban sensing by utilizing a hybrid approach. This approach combines for-hire with dedicated sensing vehicles. The document [28] presented a novel approach to reuse delivery drones for urban crowdsensing. Alvear et al. [29] discussed the emergence of smart cities and the important role of crowdsensing in addressing environmental monitoring, particularly air pollution levels in urban areas. GasMobile [30], CommonSense [31], Third-Eye [32], AirSense [16], and 3M’Air [33] are examples of urban air pollution monitoring systems using only off-the-shelf sensors available on citizens’ smart devices.
Crowdsensing systems are also widely used to provide location services in indoor environments. Lashkari et al. [34] investigated the degree of user contribution in existing crowd-powered techniques. They presented a classification of crowd-powered indoor localization solutions to delineate the specific crowdsourcing approaches employed in each indoor localization solution. A prior article [35] introduced a novel WiFi domain adversarial graph convolutional network model for indoor localization. This model can be trained with a small quantity of labeled site survey data and extensive unlabeled crowdsensing WiFi fingerprints.
In the natural environment, crowdsensing plays an important role in wildlife tracking, natural disaster monitoring, and ecological protection. The authors in [36] showed how crowdsensing technologies were used in biodiversity conservation, covering monitoring of wildlife and habitats, conservation management, and fighting illegal activities. João et al. [37] discussed the development of a mobile-based citizen science project for forest fire prevention and combat. By utilizing UAVs equipped with aerial imaging technology, the monitoring system can provide real-time and remote monitoring of forest fires, particularly in challenging terrains like forests and mountains [38].
Table 1 summarizes the environments in which crowdsensing appears in the above literature. Crowdsensing has been used in various environments. However, these studies do not refer to the role of environments in crowdsensing tasks.

Table 1.
Crowdsensing in different environments.
2.2. Crowdsensing Strategies
Typical crowdsensing strategies include opportunistic strategies and algorithmic strategies.
Opportunistic crowdsensing refers to a method that utilizes various sensors (such as GPS, microphones, accelerometers, etc.) carried within mobile devices (such as smartphones and wearable devices) to collect environmental data. Opportunistic crowdsensing leverages users’ opportunistic capture of sensor data to overcome data quality limitations [15]. This approach is related to the larger idea of opportunistic sensing, which aims to collectively leverage sensors to sense the target within the preferred time frame [17]. In [15], the authors solved the problem of automatically determining a location’s category using sensor data from smartphones through the opportunistic crowdsensing method. Dutta et al. [16] presented the AirSense system, an opportunistic crowdsensing-based air quality monitoring system aimed at collecting and aggregating sensor data to monitor air pollution in both indoor and outdoor environments.
With the continuous development of intelligent vehicle technology, unmanned aerial vehicles (UAVs), unmanned marine vehicles (UMVs), and unmanned ground vehicles (UGVs) are becoming smarter and more affordable. This trend is driving the widespread application of intelligent vehicles in various fields. Intelligence vehicles can autonomously execute tasks under the guidance of an algorithm. A prior work described the use of two versions of flood-fill algorithms, basic and modified, for autonomous mobile robot maze navigation using ArduinoUNO cards and ultrasonic sensors [18]. Deepak et al. [19] focused on developing an efficient path planner for an autonomous mobile robot using particle swarm optimization (PSO). The authors in [20] introduced an approach based on ant colony optimization (ACO) for solving the minimum time search (MTS) problem using a fleet of UAVs searching for a target in uncertain domains. Husain et al. [21] explored the application of bio-inspired techniques, specifically ACO and Dijkstra’s algorithm, in optimizing autonomous agents’ search and rescue efforts in critical scenarios, such as disasters in unknown environments. Traditional methods based on decision rules were limited in covering diverse environments and sensor properties. Therefore, a deep reinforcement learning-based decision algorithm was introduced, utilizing a deep neural network to learn exploration strategies from partial maps [39].
Opportunistic and algorithmic strategies do not apply to all kinds of situations in reality. The work landscape is evolving towards greater knowledge intensity and intricacy, surpassing the capacities of individual humans [40]. Concurrently, AI, especially machine learning, has made significant advancements in recent years, sometimes surpassing human capabilities. Nevertheless, these AI systems are constrained to precise, narrowly outlined tasks, falling short of achieving a widespread level of intelligence [41]. Human–AI collaboration refers to the collaboration and interaction between humans and AI systems in various processes, particularly machine learning applications. This collaboration involves combining humans with the computational power of AI methods to enhance decision-making and problem-solving capabilities [42,43]. The strengths and weaknesses of humans and AI systems are complementary, leading to a mutually beneficial relationship when combined, allowing the team to collectively accomplish more than what would be individually achievable [44]. Therefore, a collaborative strategy (mainly human–AI collaboration) may have a better effect on solving complex tasks in comparison to the other two strategies.
Relevant crowdsensing campaigns can be organized using a three-layer architecture. Organizersare participants who plan the campaigns, make decisions, and control the direction. In novel vehicular crowdsensing campaigns, organizers will mostly be biological participants—in other words, humans will play these important roles here [45]. Assistants are participants who design specific strategies, assign tasks, predict progress, and aggregate/evaluate outcomes. Assistants will mostly be digital, most probably artificial intelligence. Assistants are driven by advanced AI models and knowledge bases, to understand human needs and produce corresponding responses/assistance. Workers are participants who receive tasks, execute tasks, and provide raw task outcomes. Workers will mostly be robotic, as robots will do the dirty work. Due to the exploratory nature of crowdsensing campaigns, these robotic workers are mostly intelligent vehicles capable of moving, such as UAVs, UGVs, or UMVs. Some of the literature also reflects this architecture. For example, Zhao et al. [22] introduced a crowd-powered source search approach that combines human intelligence with AI algorithms to improve the agents’ source searching effectiveness and efficiency.
Table 2 shows that diverse sensing strategies are employed for a variety of crowdsensing tasks in the above-mentioned literature. However, there is a gap in research when it comes to studying how environments affect sensing strategies.
Table 2.
Sensing strategies for crowdsensing.
2.3. Crowdsensing Applications
There are many crowdsensing applications. This section will provide a concise overview of existing crowdsensing applications and describe their key characteristics. These applications connect devices, share data, and extract information to map common phenomena, which generally fall into four categories: healthcare, environmental, infrastructure, and social [46].
In healthcare applications, smart wearable devices and portable devices (smartphones) can connect patients with medical services through mobile communication networks to achieve sensing and diagnostic functions. The authors in [47] mentioned the TrackYourTinnitus mobile crowdsensing mHealth platform, developed to gather data on tinnitus, a chronic disorder with substantial economic and patient-related burdens. In environmental applications, the main phenomena to be sensed are air quality, forest fires, etc. Alvear et al. [29] discussed the growing importance of crowdsensing in smart cities for environmental monitoring, particularly air pollution levels in urban areas. Numerous urban air pollution monitoring systems, such as GasMobile [30], CommonSensee [31], Third-Eye [32], AirSense [16], and 3M’Air [33], have emerged, utilizing only off-the-shelf sensors available on citizens’ smart devices. João et al. [37] developed a mobile-based citizen science project for forest fire prevention and combat. The system employs UAVs with aerial imaging technology to provide real-time and remote monitoring of forest fires, especially in challenging terrains like forests and mountains [38]. Infrastructure encompasses various systems and facilities that are essential for the functioning of a community, city, or country. A crowdsourcing-based model for evaluating and indexing road surface quality was proposed in the literature [48]. The model utilizes the power spectral density analysis of vertical acceleration data from smartphone sensors in vehicles to measure road roughness and apply blind source separation to eliminate the effects of vehicle parameters.
2.4. Crowdsensing Challenges and Limitations
Crowdsensing, a novel and widespread paradigm in the digital age, presents exciting opportunities and faces several challenges and limitations that must be addressed for it to reach its full potential. One of the primary challenges is the issue of data quality and reliability [6]. As individual users contribute data from their personal devices, there can be significant variations in the accuracy, precision, and timeliness of the information provided. This can lead to inconsistencies and inaccuracies in the aggregated data, undermining the overall value and usefulness of the crowdsensing insights. Another limitation is the uneven distribution of participants, which can result in biased or skewed data. Certain demographics or geographic regions may be underrepresented, leading to blind spots in the data and potentially inaccurate conclusions. Addressing these gaps in participation requires innovative strategies to engage a more diverse and representative set of contributors. The authors in [49] proposed an incentive mechanism based on behavioral economics (BE) and aimed to address the uneven participation in location-based crowdsensing (LCS) systems. The risk of compromising citizens’ privacy could lower their willingness to participate in the crowdsensing campaign [25].
2.5. Data Quality
Data quality and validation are essential for data management, ensuring accurate, complete, and reliable information. This is also critical in crowdsensing. Establishing robust data quality standards and implementing rigorous validation processes are crucial to prevent errors, inconsistencies, and anomalies in datasets. Effective data validation can identify and address issues such as missing values, outliers, data type mismatches, and violations of business rules or constraints. Proactively addressing data quality concerns enhances the trustworthiness of data, improves decision-making, and unlocks the full potential of information assets. Samulowska et al. [8] addressed the problem of detecting and removing crowdsourced data bias in air pollution symptom mapping, a prerequisite for better-quality open-data output. Luo et al. [50] proposed a cross-validation approach to address data quality issues in mobile crowd sensing and the Internet of Things. The key idea was to use a validating crowd to ratify data contributed by the original crowd and reshape the data into a more credible representation of the ground truth.
3. Study Design
To understand the role of crowdsensing environments and sensing strategies, we designed a study, classifying environments into four common categories, to represent as many crowdsensing scenarios as possible to the best of our knowledge.
Moreover, we used a prototype system with graphical user interfaces (GUI) to conduct simulation experiments to complete some tasks. The tasks involved using a swarm of UAVs (up to 100 UAVs) to explore an unknown environment and maximize coverage. And, every task had restrictions on the number of steps. In the experiment, it was always assumed that the UAVs flew on a two-dimensional plane. Then, we chose three typical strategies to explore environments, namely, opportunistic, algorithmic, and collaborative strategies. Then, three different sensing strategies were used to drive UAV crowdsensing campaigns to discover the impact of environments and sensing strategies on crowdsensing.
Please note that in this empirical study, we did not choose state-of-the-art sensing strategies and extremely realistic environments in the experiment on purpose. Instead, the chosen environmental scenes and sensing strategies were simplified to a large extent, in order to acquire common and representative findings through the experiment.
3.1. Environment Classification
We classified crowdsensing environments into four categories and designed seven experimental scenes representing the situations that participants might encounter. Figure 1 provides an overview of four environmental categories and all the designed scenes for the experiments. The black blocks in the right half of Figure 1 represent obstacles, and the white parts represent where the UAVs could go through.
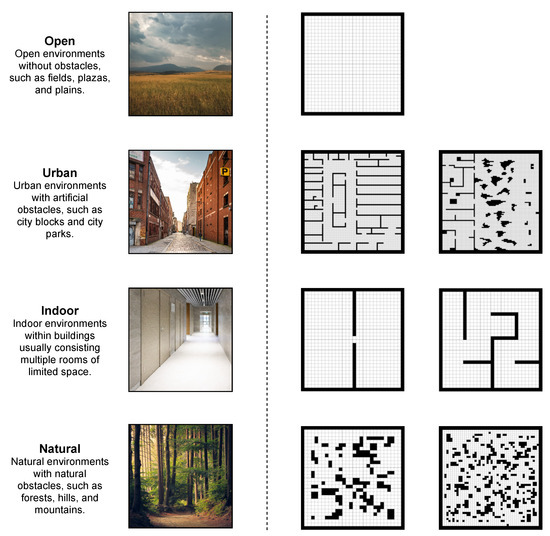
Figure 1.
All scenes of designed scenarios for experiments.
According to whether it is a man-made environment, an environment can be categorized as an artificial environment or a non-artificial environment. For non-artificial environments, open and natural environments are two typical environments [51]. For artificial environments, they can be divided into indoor and outdoor environments. Outdoor environments mainly refer to urban environments [52,53,54].
- The open environment refers to places without obvious physical restrictions or obstacles, such as parks, grasslands, wild areas, etc. These places usually have a wide view and space. The UAVs can fly freely without avoiding obstacles;
- The natural environment refers to places with natural obstacles such as forests, hills, and mountains, which are not obviously disturbed by human beings. The UAVs can only move in open spaces due to the obstacles;
- The urban environment refers to places with artificial barriers like city blocks and urban parks. Many tall buildings exceed the maximum flight altitude of UAVs. Therefore, UAVs need to avoid building or other obstacles actively;
- The indoor environment refers to the space consisting of multiple rooms with limited space in buildings. Due to the existence of indoor ceilings and walls, UAVs need to avoid these indoor obstacles actively.
3.2. Sensing Strategies
In this section, we will introduce three sensing strategies (opportunistic, algorithmic, and collaborative) in detail. An opportunistic strategy is the most basic and simple strategy. This method allows individual users to collect data on their daily activities without specific data collection devices or tasks, always featuring randomness [55]. An algorithmic strategy (machine-only) is used to complete specific tasks, driven by an algorithm. A collaborative strategy (human and machine) involves incorporating human wisdom into the algorithm. These three strategies develop from simple to complex, as do most of the situations in reality.
Opportunistic crowdsensing is a method of collecting environmental data using various sensors (such as GPS, an accelerometer, a microphone, etc.) carried in mobile devices (such as smartphones and wearable devices). We used a random strategy to simulate opportunistic crowdsensing. The random strategy implies that the likelihood of each step moving in each direction is equal.
There are many algorithms [18,19,20,21,56,57]; we used inverse ant colony optimization (IACO) because it is always used to achieve maximum coverage, aligning with our goal, and it is simple and typical enough to represent many similar intelligent algorithms. In IACO crowdsensing, IACO is deployed in swarm UAVs to make decisions during crowdsensing. When a UAV passes a grid, it produces a pheromone that passes the information that the grid has been explored. UAVs are inclined to move in the direction of low pheromone concentration. At step t, the probability density function (1) is applied to determine the direction of the next step:
where is the probability of moving in direction i, and is the quantity of pheromone in grid i. The summation (j) in Equation (1) refers to the four possible directions of movement. Additionally, c is the degree of attraction to an unexplored path, and is the bias in using a pheromone-concentrated path [58]. IACO parameter values were c = 20, and , as shown in [59].
The roles in the crowdsensing campaign employing a collaborative strategy [22,60] can be categorized into three distinct parts: organizers, assistants, and workers. In this study, human operators served as organizers overseeing the entire campaign. Organizers possessed the capability to intervene in the autonomous movements of UAVs and provided guidance on crowdsensing directions by interacting with the map interface. Assistants refer to AI or algorithms that serve as fundamental tools aiding intelligent UAV swarms in exploring environments. In this study, inverse ant colony optimization (IACO) played the role of assistant. Workers were individual UAVs that could move autonomously under the guidance of IACO. When human organizers wanted to guide UAVs to the proper location, the A* algorithm [61] was used to find the best path between the current location of the UAV and the human-designated destination. In many cases, the A* algorithm was able to quickly find solutions and flexibly adapt to different problems and scenarios.
3.3. Experimental Setup
This section provides a detailed description of the experimental setup and measurements. The experiments on multi-UAV cooperative crowdsensing were conducted on a prototype system. Possible movement directions of intelligent UAVs mainly include forward, backward, left, and right in the prototype system. The prototype system utilizes a GUI as an intermediary between UAVs and human operators for collaborative crowdsensing. It visually displays the UAVs’ current status and alerts operators to any detected issues. Additionally, operators can interact with the exploring UAVs through this interface. The graphical interface was created using tkinter, a standard GUI toolkit for Python that offers essential components for desktop application development, as shown in Figure 2. A legend module in the bottom-right corner briefly explains the graphical elements to users. We outlined the crowdsensing task and communicated issues to the operator by displaying a map, UAV positions, and pheromone concentrations in grid cells. Additionally, we showed a curve illustrating the increasing “coverage rate” over time to enhance the operator’s understanding of task progress. The operator could interact with the UAVs by clicking on the map, and the interface translated their guidance into commands for the UAVs. For algorithmic crowdsensing, we only needed to remove human intervention, just relying on the algorithmic strategy in the prototype system. For opportunistic crowdsensing, we just relied on the opportunistic strategy without human involvement when executing the crowdsensing task. The experimental environment (mainly the prototype system) was deployed on a Windows 10 laptop with an AMD R7-4800U processor and 16 GB of RAM. The laptop, manufactured by Lenovo, was sourced from China.
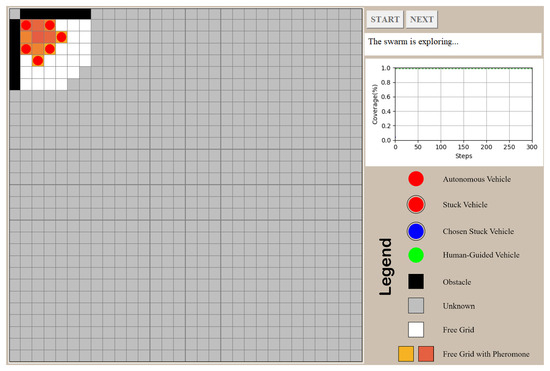
Figure 2.
The screenshot of the start state during the operation of the prototype system.
The experimental process is shown in Figure 3. Opportunistic crowdsensing and algorithmic (IACO) crowdsensing ran independently 10 times in each scene. Furthermore, we recruited 18 participants and carried out 126 human–UAV interaction crowdsensing campaigns. All participants needed to guide UAVs to complete the corresponding crowdsensing tasks under the seven scenes. Task completion time, coverage rate, and mouse click data were recorded during the experiments. The collected data were subsequently analyzed to assess the performance of each crowdsensing method. Statistical methods were employed to compare task completion times and coverage rates among three crowdsensing strategies. Additionally, the mouse click data provided insights into organizer interactions and decision-making processes during collaborative tasks.
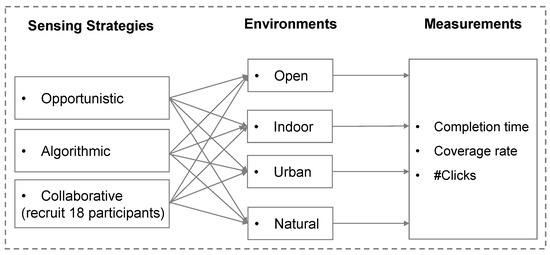
Figure 3.
Experimental procedure using three sensing strategies.
The opportunistic strategy has an equal probability of moving in four directions, incorporating randomness. The algorithmic strategy based on IACO determines the movement direction using Equation (1), also with an element of randomness. Human behavior is inherently difficult to predict [62]. The collaborative strategy is not only based on IACO but also embraces human behavior, introducing an element of randomness. Because of the randomness of each run, experimental data may vary even within the same environment and strategy. Repeated experiments are one of the important methods to overcome randomness in scientific research; they help to confirm whether a certain observation or effect exists universally, rather than just representing an accidental result. Due to the stochastic nature of the three sensing strategies in this paper, we also conducted statistical hypothetical tests using environmental categories based on experimental data to deeply understand the influence of the environment on sensing activities. The null hypothesis is that two sets of experimental data are drawn from the same distribution. The alternative hypothesis is that two sets of experimental data are drawn from different distributions. Before testing for statistical significance, we performed Shapiro–Wilk normality tests for each pair of experimental data. We used t-tests for pairs that were normally distributed, and the Mann–Whitney U test for pairs that were not. The significance level was set to 0.05. Moreover, we aimed to visualize the results through comprehensive graphs and charts. By plotting the experimental outcomes against environmental categories, we sought to illustrate the distribution of performance metrics—such as effectiveness and efficiency. These visual tools aided in presenting our findings clearly, making it easier to identify trends and anomalies that warranted further investigation. The codes involved in the experiments were implemented in Python (the source code is available at https://github.com/summerqinye/role (accessed on 13 September 2024)).
3.4. Evaluation Metrics
We evaluated the role of environments and sensing strategies in UAV crowdsensing campaigns in three aspects, that is, efficiency, effectiveness, and human intervention. Effectiveness consists of two evaluation metrics in this study, i.e., coverage rate and success rate.
- Measure 1. The coverage rate [63,64] is defined as the ratio of the number of explored grids () to the total number of all accessible grids (), as shown in Equation (2). A greater coverage rate indicates more thorough scene exploration;
- Measure 2. According to our experimental results, all scenes usually take similar execution times to consume all steps. Based on this, we define the methods’ coverage speed as the coverage rate ratio to the task completion time [65], as shown in Equation (3). The larger coverage speed indicates better performance;
- Measure 3. Our study considers a crowdsensing task successful if the UAVs explore at least 99% of the open area (excluding obstacles) within a maximum number of allowed crowdsensing steps. The success rate [66,67] is calculated by dividing the number of successful tasks () by the total number of tasks (), as shown in Equation (4);
- Measure 4. An additional metric for evaluating the collaborative strategy is human intervention frequency [68,69], which is defined as the ratio of the total number of clicks () to the task completion time (completion time), as shown in Equation (5). The frequency of human intervention aligns closely with the overall operational cost of the UAV crowdsensing campaigns. A lower intervention frequency suggests reduced human effort needed to complete a crowdsensing task successfully. A higher frequency suggests a greater dependence on human oversight, which can introduce more cost. Therefore, minimizing the human intervention frequency should be a goal, aiming to develop more autonomous systems capable of executing complex crowdsensing tasks with minimal guidance.
4. Results
To figure out the role of different strategies and environments in UAV crowdsensing, we show the experimental results in this section. A total of 266 data entries were used for the experimental data analysis. We pay close attention to the effectiveness (coverage rate and success rate), coverage speed, and human intervention frequency. We use two-way ANOVA tests to show the main and interaction effects of the sensing strategies and environments considered in this study. The results of the statistical tests are shown in Table 3. We found that the efficiency and effectiveness of environment crowdsensing show a significant difference in terms of the environment (p = 3.1 × 10⁻³⁵ for efficiency, p = 1.5 × 10−41 for effectiveness), sensing strategy (p = 1.4 × 10−141 for efficiency, p = 4.1 × 10−53 for effectiveness), and their interaction effect (p = 2.4 × 10−39 for efficiency, p = 2.8 × 10⁻⁶ for effectiveness), meaning that three factors have significant impacts on crowdsensing performance. The interaction effect in a two-way ANOVA represents the mutual influence between the sensing strategy and environment. When explaining the influence of independent variables on dependent variables, two independent variables and their interaction must be considered at the same time. Therefore, in the subsequent analysis, we analyze the performance of different strategies in the same environment. A comparative analysis often leads to the generation of valuable insights. Then, a more detailed analysis can be conducted according to different evaluation metrics.
Table 3.
Results of two-way ANOVA (, Type I) for the efficiency and effectiveness.
4.1. Efficiency
In this part, we further analyze the difference in the efficiency of the sensing strategies across different environments.
The distributions of the coverage speed for different sensing strategies in various environments are shown in Figure 4 using boxplots. It is apparent from the figure that the coverage efficiency of the opportunistic strategy is far behind those of the other strategies for the four environments. However, the difference between the algorithmic and collaborative strategy is not that big. Additionally, the results suggest that the collaborative strategy demonstrates an edge over the algorithmic strategy in terms of coverage speed.
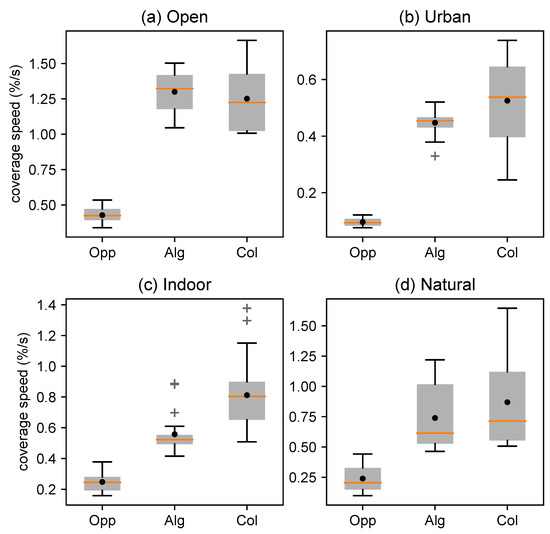
Figure 4.
The boxplots showing coverage speed (unit: percentage increase per second, %/s), where the orange lines ( ) represent the median value and the black points represent the mean value. Opp stands for opportunistic strategy, Alg means algorithmic strategy, and Col represents collaborative strategy.
) represent the median value and the black points represent the mean value. Opp stands for opportunistic strategy, Alg means algorithmic strategy, and Col represents collaborative strategy.
In addition to the boxplots, we drew an estimation plot [70] (Figure 5) to provide a more detailed comparison across various environments. It is worth noting that each data point depicted in the figures represents the result of an individual crowdsensing task. The estimation plot illustrates the efficiency discrepancies between the algorithmic strategy and the other two strategies across various environments, as depicted in Figure 5. Each subplot corresponds to a specific environment and exhibits the estimated mean value with error bars signifying the standard deviation. The x-axis denotes the various strategies, and the y-axis illustrates the value for each environment. From Figure 5, we can observe minor differences in the coverage speed between the algorithmic strategy and the collaborative strategy in the open and natural (non-artificial) environment. However, the differences in coverage speed between the two strategies are obvious in indoor environments, and the mean value for the collaborative strategy is significantly higher than that of the algorithmic strategy. The performance of the opportunistic strategy in coverage speed lags behind that of the algorithmic strategy in the four environments, particularly in environments characterized by increased complexity.
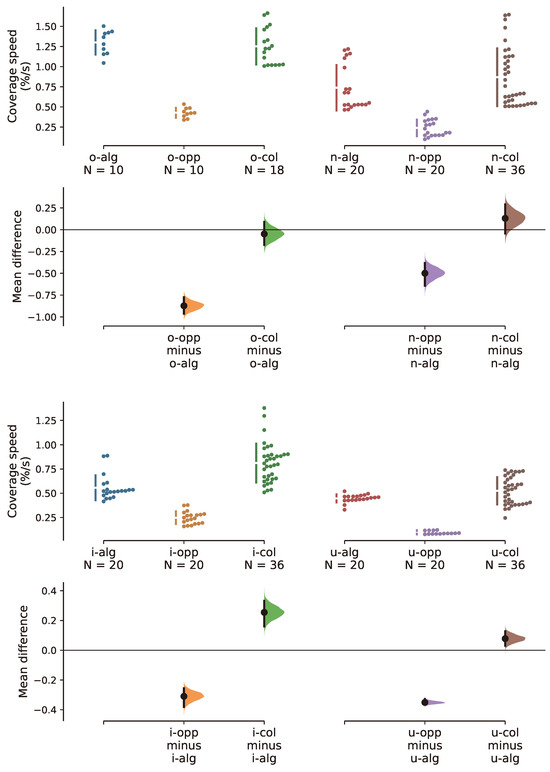
Figure 5.
Estimation plots of coverage speed (unit: percentage increase per second, %/s), where “o” means open environments, “n” means natural environments, “i” means indoor environments, and “u” means urban environments. “opp” stands for opportunistic strategy, “alg” stands for algorithmic strategy, “col” stands for collaborative strategy, and “o-alg” means using algorithmic strategy in open environments. N represents the quantity of data points in different experimental conditions. Due to too many data points with similar values, the data points could not be fully displayed.
The significance test was used for the further analysis. According to normality tests, some data do not follow a normal distribution. So, we needed to conduct different statistical tests depending on the diverse situations to find differences in the efficiency. An independent t-test (two-tailed, ) is appropriate when analyzing two data groups with normal distributions. In cases where the data fail to meet the assumption of equal variances, Welch’s t-test is the preferred method. If two data groups do not follow normal distributions, it is reasonable to use Mann–Whitney U tests. The Bonferroni correction was utilized to control the Type-I error due to multiple comparisons (various sensing strategies) carried out among four datasets (four environments).
Table 4 shows not only the mean and standard deviation of the coverage speed across the 12 experimental conditions (four environments × three sensing strategies) but also the significance test results.
Table 4.
Efficiency (: mean and standard deviation; unit: percentage increase per second) and p-values across different environments and sense strategies.
Related statistical tests revealed that there is no significant difference between algorithmic strategy and collaborative strategy in open, urban, and natural environments (corresponding p-values are 0.46, 0.10, and 0.20, which indicates that we cannot reject the null hypothesis). So, we can use an algorithmic strategy in open, urban, and natural environments when only taking efficiency into account, which is beneficial for reducing human participation. In indoor environments, a collaborative strategy is better.
4.2. Effectiveness
We evaluated the effectiveness of scene crowdsensing from two perspectives, namely, the success rate and the coverage rate. Figure 6 shows the coverage rate of different sensing strategies across four environments (open, urban, indoor, and natural) in the form of boxplots. It is apparent from Figure 6 that a collaborative strategy achieved a good performance in the coverage rate in the four environments. And, there is little difference between the algorithmic strategy and the collaborative strategy in open environments.
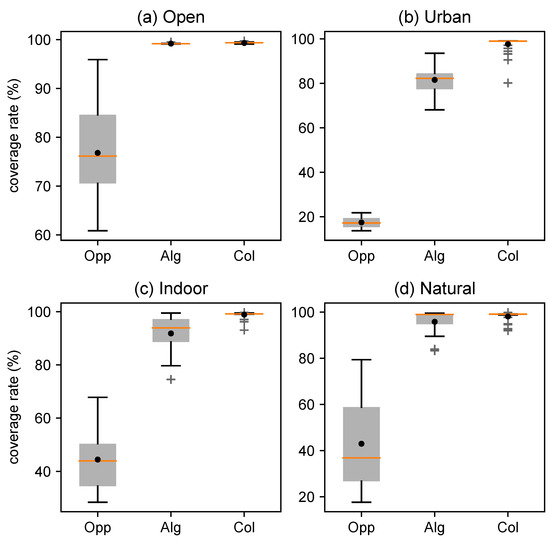
Figure 6.
The boxplots showing coverage rate (unit: %), where the orange lines () represent the median value and the black points represent the mean value. Opp stands for opportunistic strategy, Alg means algorithmic strategy, and Col represents collaborative strategy.
) represent the median value and the black points represent the mean value. Opp stands for opportunistic strategy, Alg means algorithmic strategy, and Col represents collaborative strategy.
The estimation plot displays an experimental dataset’s complete statistical information regarding the coverage rate, as shown in Figure 7. Jitter plots display the experiment results for the coverage rate across different conditions. Here, we used the baseline condition—the algorithmic strategy—as a control group in the plots to make a comparison with all the other experimental conditions. The estimation plots also show the resampling distribution of the difference in means, representing the effect size (the effect size is zero, indicating that both groups have identical mean data). The results clearly show that the opportunistic strategy is at a distinct disadvantage compared to the other two strategies in the four environments. Both algorithmic and collaborative strategies achieved a high coverage rate in the open and natural environment, with minor differences in the coverage rate between the two strategies in the open and natural (non-artificial) environment. The collaborative strategy performed better than the algorithmic strategy in indoor and urban (artificial) environments.
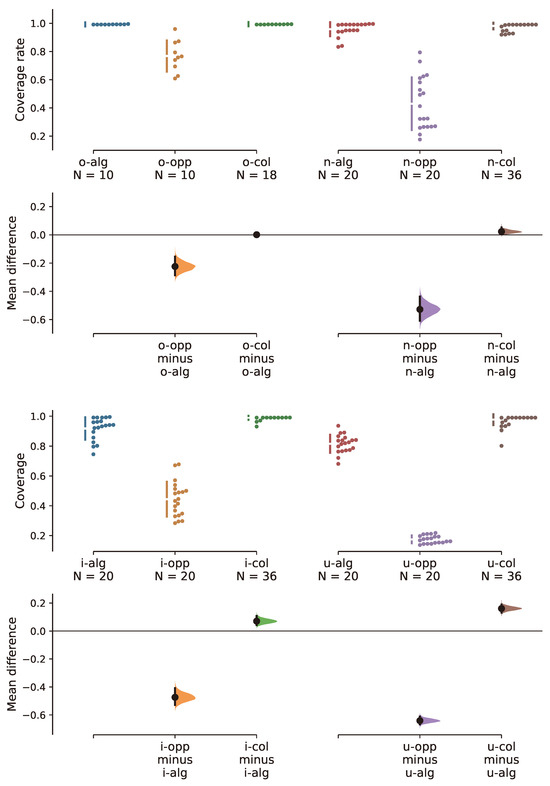
Figure 7.
Estimation plots of coverage rate (unit: %), where “o” means open environments, “n” means natural environments, “i” means indoor environments, and “u” means urban environments. “opp” stands for opportunistic strategy, “alg” stands for algorithmic strategy, “col” stands for collaborative strategy, and “o-alg” means using algorithmic strategy in open environments. N represents the quantity of data points in different experimental conditions. Due to too many data points with similar values, the data points could not be fully displayed.
More in-depth information regarding the coverage and success rate can be found in Table 5 and Table 6, respectively. The statistical test procedures for the coverage rate were similar to tests for the coverage speed. As can be seen from Table 5, relevant tests (expected , two-tailed, corrected by the Bonferroni method) between the algorithmic and collaborative strategies show that the coverage rate has no significant difference in open and natural environments (corresponding p-values are 0.03, 0.18, and two values are less than the Bonferroni-adjusted alpha level of 0.017 (0.05/3), which indicates that we cannot reject the null hypothesis). In other situations, we found a statistically significant difference.
Table 5.
Effectiveness–coverage rate (: mean and standard deviation; unit: %) and p-values across different environments and sense strategies.
Table 6.
Effectiveness–success rate (unit: %) across different environments and sense strategies.
The opportunistic strategy was tested 10 times in all scenes. However, it failed to successfully complete any tasks, as shown in Table 6. While the cost of implementing an opportunistic strategy is fairly low and the execution process is straightforward, the successful completion of tasks related to opportunistic crowdsensing, particularly within the constraints of limited steps and the number of UAVs, presents a considerable challenge for the strategy. The algorithmic strategy achieved the same success rate as the collaborative strategy in open environments. In other environments, there is a big gap between the two strategies. This may be because we defined a successful task strictly (a coverage rate of over 0.99). It can be seen in Table 5 that the gap in the coverage rate is not as big as the gap in the success rate between the two sensing strategies. When pursuing the success rate of the task, an algorithmic strategy is suitable for open environments and a collaborative strategy is a preferred choice in other environments. When pursuing the coverage rate of the task, an algorithmic strategy is suitable for open and natural (non-artificial) environments and a collaborative strategy is a preferred choice in indoor and urban (artificial) environments.
4.3. Human Intervention Frequency
The results pertaining to the overall human intervention frequency are shown in Figure 8. As we can see from the figure, the mean value of intervention frequency in open environments is lower mean values than in other environments. This may be because the open environment is simple and does not require much human involvement.
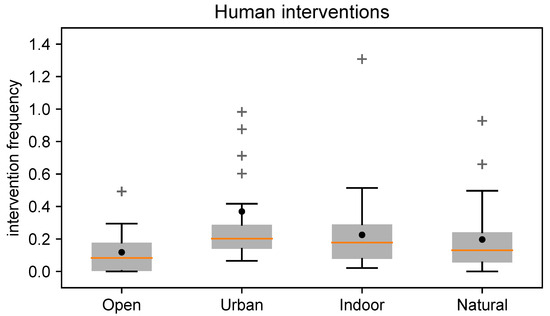
Figure 8.
The boxplots showing human intervention frequency by environmental categories, where the orange lines () represent the median value and the black points represent the mean value.
) represent the median value and the black points represent the mean value.
Table 7 shows more detailed results about the human intervention frequency. From the table below, we can see that the mean value and standard deviation are both minimal in the open environments.
Table 7.
Intervention frequency in collaborative crowdsensing by environmental categories (: mean and standard deviation; unit: times per second, ).
The estimation plot displays an experimental dataset’s complete statistical information about the human intervention frequency, as shown in Figure 9. Jitter plots show the overall human intervention frequencies, and how they distribute, across experimental conditions in Figure 9. From the figure, it is clear that the human intervention frequency distribution in urban environments differs significantly from that in open environments, with a considerable mean difference in the intervention frequency between the two environments. This is possible because urban environments are more intricate than open environments and often necessitate increased human intervention.
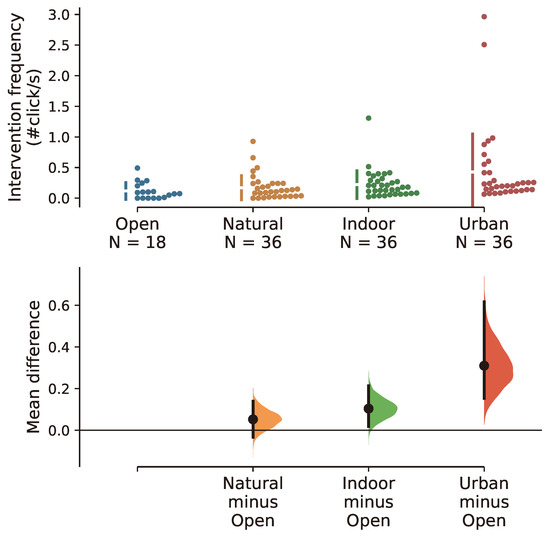
Figure 9.
Estimation plots of human intervention frequency (unit: ). N stands for the quantity of data points in different experimental conditions. Due to too many data points with similar values, the data points could not be fully displayed.
In addition to boxplots and estimation plots, the significance test was used for additional analyses. According to the normality tests, the human intervention frequency distributions did not come from a normal distribution, so we applied pairwise Mann–Whitney U tests to carry out the significance tests ( values were adjusted by Bonferroni corrections, ). The results obtained from the significance test are summarized in Table 8. From the table below, we can see there is a significant difference in the intervention frequency between open and urban environments. The difference in the complexity of the environments may be an important factor contributing to the statistically significant difference.
Table 8.
Significance test results (p-value) for the human intervention frequency in collaborative crowdsensing. ** in the table indicates statistical significance with Bonferroni correction, and * indicates a p-value < 0.05 that was not significant after Bonferroni correction.
5. Discussion
Based on the results presented in Section 4, it is clear that the environment category and sensing strategy both have a significant impact on the performance of UAV crowdsensing. In this section, we provide valuable insights into the experimental results.
5.1. The Role of Environments and Sensing Strategies
Different characteristics of environments underscore the importance of selecting an appropriate sensing strategy to optimize crowdsensing performance across various scenarios.
The role of environments. The impact of the environment on crowdsensing is significant. The performance (the effectiveness, efficiency, and intervention frequency) across all sensing strategies is better in open environments than in other environment categories. The open environment is likely ideal and conducive for UAV crowdsensing. Future research should consider environmental factors, particularly for urban or indoor crowdsensing. We recommend creating a more realistic experimental environment to evaluate the performance of UAV crowdsensing.
The role of sensing strategies. Opportunistic strategies can utilize the behavior of UAVs without requiring large-scale resource allocation and management, while algorithmic strategies require more resources to manage and control the behavior of individuals. Collaborative strategies require human participants to pay attention to the complete workflow of crowdsensing tasks. Therefore, the human effort needed for collaborative strategies is relatively high compared to the other two strategies. Considering the level of human involvement and the complexity of strategy execution, among the three sensing strategies, the overheads of collaborative strategies are the highest, followed by algorithmic strategies, and opportunistic strategies. The opportunistic strategy generally performed poorly in the four environments and showed a significant gap compared to the other two sensing strategies, likely due to its reliance on chance rather than a systematic approach, potentially missing opportunities. Usually, the opportunistic strategy performed worse in more complex environments. Relying solely on randomness makes it exceedingly challenging to explore complex regions fully. This approach often leads to repetitive exploration within already traversed areas. As a special sensing strategy, the opportunistic strategy still has its own significance. It is suitable for low-cost data acquisition with low coverage and time requirements. In contrast, the other two sensing strategies, i.e., algorithmic and collaborative, involve deliberate planning and action to gather information and make decisions. These strategies are more reliable and effective in achieving better outcomes.
Implications for strategy selection. Collaborative crowdsensing has demonstrated an ability to achieve high performance in effectiveness and efficiency across diverse environmental contexts. A collaborative strategy can be directly selected when the budget is adequate. We learned that the performance difference between collaborative and algorithmic strategies was not statistically significant in non-artificial environments, which means the algorithmic strategy demonstrated relatively comparable efficiency and effectiveness to the collaborative strategy. However, in artificial environments, particularly in intricate indoor settings, the advantages of the collaborative strategy became pronounced, enabling it to capitalize on the wisdom of humans. Thus, an algorithmic strategy can be directly applied in non-artificial environments. In artificial environments, the cost must be considered when choosing appropriate sensing strategies.
5.2. Limitations and Caveats
The simplification of the experiment settings. UAVs usually try to keep at the same level when flying. This is because maintaining a stable flight altitude can reduce flight resistance, thereby saving energy and prolonging flight time, which is crucial to the success of flight missions. In addition, a stable flight altitude contributes to the accuracy of flight control and navigation systems. Therefore, experiments on the prototype system were simplified to a two-dimensional plane. Such simplification also helped to extend the obtained conclusions to UMV and UGV crowdsensing. The real-world scenarios where UAVs operate in three-dimensional space can be considered in the follow-up study. In addition, we did not take moving obstacles into consideration. When a swarm of UAVs complete the environment crowdsensing task together, the individuals of each UAV may become each other’s moving obstacles. There may also be other moving objects. How to sense environments with moving obstacles deserves research. This research is crucial for the development of autonomous UAVs and other technologies that rely on accurately sensing and navigating through dynamic environments.
The diversity of the sensing strategies. This study focuses on three sensing strategies: opportunistic, algorithmic, and collaborative. Specifically, we conducted experiments based on inverse ant colony optimization for the algorithmic and collaborative strategies, with the potential for further experiments using other AI algorithms. With some valuable findings from this study, an adaptive sensing strategy based on three typical strategies can also be considered in future studies. An adaptive sensing strategy means that the system can adjust the sensing strategy according to the changes in the environment to obtain more information effectively. Sometimes, a whole experiment crowdsensing task does not just take place in one environmental category. By allowing the system to dynamically adjust its sensing strategies in response to varying environmental conditions, the adaptive strategy may showcase its prowess in maximizing information acquisition efficiency and reducing crowdsensing costs. In the intricate landscape of diverse environments, each with its unique challenges and opportunities, the adaptive strategy stands poised to harness the strengths of different sensing strategies.
The sample size of the participants. The sample size of the participants was not large or representative enough; however, this is a minor problem since the number of total task executions was large enough. We can expand the scale of the experiment and recruit more volunteers for collaborative crowdsensing to increase the number of samples. We can further enrich the dataset by diversifying our crowdsensing strategies and incorporating more AI algorithms. This approach may enable us to uncover more hidden patterns and trends that may not be apparent in the current dataset. Moreover, by iteratively refining our crowdsensing strategies and leveraging advanced analytical tools, we can systematically enhance the quality and breadth of our dataset. Through this iterative and systematic process, we aim to extract more valuable insights that can propel our research efforts toward greater innovation and discovery.
6. Conclusions
In this paper, we studied how sensing strategies and environment categories can affect environment crowdsensing performance. However, our study primarily relied on simulation experiments, and future research should consider real-world scenarios where UAVs operate in three-dimensional space. In order to achieve this purpose, we implemented a serial empirical study involving categorizing sensing environments into four major categories and carrying out experiments to investigate the effect. Finally, we provided some suggestions for how to choose appropriate sensing strategies based on different needs in different environments in future environment crowdsensing. An algorithmic strategy is suitable for non-artificial environments (open, natural), while a collaborative strategy is ideal for artificial environments (urban, indoor) with an adequate budget. By understanding the differences of each sensing strategy in each environment, researchers and practitioners can enhance their decision-making processes when selecting appropriate strategies. These findings pave the way for future advancements in UAV crowdsensing, providing valuable insights for efficiently exploring diverse environments.
Author Contributions
Conceptualization, S.Q. and Y.Z. (Yaqiong Zhou); methodology, S.Q. and Y.Z. (Yaqiong Zhou); software, C.H. and Y.Z. (Yong Zhao); validation, Y.Z. (Yaqiong Zhou), Y.Z. (Yong Zhao) and C.H.; resources, S.Q., R.J. and Z.Z.; data curation, Y.Z. (Yaqiong Zhou); writing—original draft preparation, Y.Z. (Yaqiong Zhou); writing—review and editing, Z.Z., S.Q., Y.Z. (Yong Zhao) and R.J.; visualization, Y.Z. (Yaqiong Zhou); supervision, R.J. and S.Q.; project administration, S.Q.; funding acquisition, S.Q. and R.J. All authors have read and agreed to the published version of the manuscript.
Funding
This research was funded by the National Natural Science Foundation of China under grant number 62202477.
Data Availability Statement
The data are contained within the article.
Conflicts of Interest
The authors declare no conflicts of interest.
References
- Parshotam, K. Crowd computing: A literature review and definition. In Proceedings of the South African Institute for Computer Scientists and Information Technologists Conference, East London, South Africa, 7–9 October 2013; pp. 121–130. [Google Scholar]
- Guo, B.; Wang, Z.; Yu, Z.; Wang, Y.; Yen, N.Y.; Huang, R.; Zhou, X. Mobile crowd sensing and computing: The review of an emerging human-powered sensing paradigm. ACM Comput. Surv. (CSUR) 2015, 48, 1–31. [Google Scholar] [CrossRef]
- Zappatore, M.; Longo, A.; Bochicchio, M.A. Crowd-sensing our smart cities: A platform for noise monitoring and acoustic urban planning. J. Commun. Softw. Syst. 2017, 13, 53–67. [Google Scholar] [CrossRef]
- Capponi, A.; Fiandrino, C.; Kantarci, B.; Foschini, L.; Kliazovich, D.; Bouvry, P. A survey on mobile crowdsensing systems: Challenges, solutions, and opportunities. IEEE Commun. Surv. Tutorials 2019, 21, 2419–2465. [Google Scholar] [CrossRef]
- Zhu, Z.; Chen, B.; Liu, W.; Zhao, Y.; Liu, Z.; Zhao, Z. A cost-quality beneficial cell selection approach for sparse mobile crowdsensing with diverse sensing costs. IEEE Internet Things J. 2020, 8, 3831–3850. [Google Scholar] [CrossRef]
- Hu, C.L.; Lin, K.Y.; Chang, C.K. Incentive mechanism for mobile crowdsensing with two-stage stackelberg game. IEEE Trans. Serv. Comput. 2022, 16, 1904–1918. [Google Scholar] [CrossRef]
- Tao, D.; Wu, T.Y.; Zhu, S.; Guizani, M. Privacy protection-based incentive mechanism for mobile crowdsensing. Comput. Commun. 2020, 156, 201–210. [Google Scholar] [CrossRef]
- Samulowska, M.; Chmielewski, S.; Raczko, E.; Lupa, M.; Myszkowska, D.; Zagajewski, B. Crowdsourcing without data bias: Building a quality assurance system for air pollution symptom mapping. ISPRS Int. J. Geo-Inf. 2021, 10, 46. [Google Scholar] [CrossRef]
- Xiong, J.; Ma, R.; Chen, L.; Tian, Y.; Lin, L.; Jin, B. Achieving incentive, security, and scalable privacy protection in mobile crowdsensing services. Wirel. Commun. Mob. Comput. 2018, 2018, 8959635. [Google Scholar] [CrossRef]
- Khan, F.; Rehman, A.U.; Zheng, J.; Jan, M.A.; Alam, M. Mobile crowdsensing: A survey on privacy-preservation, task management, assignment models, and incentives mechanisms. Future Gener. Comput. Syst. 2019, 100, 456–472. [Google Scholar] [CrossRef]
- Yu, Z.; Ma, H.; Guo, B.; Yang, Z. Crowdsensing 2.0. Commun. ACM 2021, 64, 76–80. [Google Scholar] [CrossRef]
- Xie, X.; Bai, T.; Guo, W.; Wang, Z.; Nallanathan, A. Cooperative Computing for Mobile Crowdsensing: Design and Optimization. IEEE Trans. Mob. Comput. 2023. [Google Scholar] [CrossRef]
- Liu, C.H.; Chen, Z.; Zhan, Y. Energy-efficient distributed mobile crowd sensing: A deep learning approach. IEEE J. Sel. Areas Commun. 2019, 37, 1262–1276. [Google Scholar] [CrossRef]
- Zhu, Z.; Zhao, Y.; Chen, B.; Qiu, S.; Liu, Z.; Xie, K.; Ma, L. A crowd-aided vehicular hybrid sensing framework for intelligent transportation systems. IEEE Trans. Intell. Veh. 2022, 8, 1484–1497. [Google Scholar] [CrossRef]
- Chon, Y.; Lane, N.D.; Li, F.; Cha, H.; Zhao, F. Automatically characterizing places with opportunistic crowdsensing using smartphones. In Proceedings of the 2012 ACM Conference on Ubiquitous Computing, Pittsburgh, PA, USA, 5–8 September 2012; pp. 481–490. [Google Scholar] [CrossRef]
- Dutta, J.; Chowdhury, C.; Roy, S.; Middya, A.I.; Gazi, F. Towards smart city: Sensing air quality in city based on opportunistic crowd-sensing. In Proceedings of the 18th International Conference on Distributed Computing and Networking, Hyderabad, India, 5–7 January 2017; pp. 1–6. [Google Scholar]
- Eisenman, S.B.; Lane, N.D.; Campbell, A.T. Techniques for improving opportunistic sensor networking performance. In Proceedings of the Distributed Computing in Sensor Systems: 4th IEEE International Conference, DCOSS 2008, Santorini Island, Greece, 11–14 June 2008; Springer: Berlin/Heidelberg, Germany, 2008; pp. 157–175. [Google Scholar]
- Nadour, M.; Cherroun, L. Using flood-fill algorithms for an autonomous mobile robot maze navigation. Int. J. Syst. Assur. Eng. Manag. 2022, 13, 546–555. [Google Scholar] [CrossRef]
- Deepak, B.; Parhi, D.R.; Raju, B. Advance particle swarm optimization-based navigational controller for mobile robot. Arab. J. Sci. Eng. 2014, 39, 6477–6487. [Google Scholar] [CrossRef]
- Perez-Carabaza, S.; Besada-Portas, E.; Lopez-Orozco, J.A.; de la Cruz, J.M. Ant colony optimization for multi-UAV minimum time search in uncertain domains. Appl. Soft Comput. 2018, 62, 789–806. [Google Scholar] [CrossRef]
- Husain, Z.; Al Zaabi, A.; Hildmann, H.; Saffre, F.; Ruta, D.; Isakovic, A. Search and rescue in a maze-like environment with ant and dijkstra algorithms. Drones 2022, 6, 273. [Google Scholar] [CrossRef]
- Zhao, Y.; Zhu, Z.; Chen, B.; Qiu, S. Leveraging Human-AI Collaboration in Crowd-Powered Source Search: A Preliminary Study. J. Soc. Comput. 2023, 4, 95–111. [Google Scholar] [CrossRef]
- Liu, J.; Shen, H.; Narman, H.S.; Chung, W.; Lin, Z. A survey of mobile crowdsensing techniques: A critical component for the internet of things. ACM Trans. Cyber-Phys. Syst. 2018, 2, 1–26. [Google Scholar] [CrossRef]
- Wu, E.; Peng, Z. Research Progress on Incentive Mechanisms in Mobile Crowdsensing. IEEE Internet Things J. 2024, 11, 24621–24633. [Google Scholar] [CrossRef]
- Fascista, A. Toward integrated large-scale environmental monitoring using WSN/UAV/Crowdsensing: A review of applications, signal processing, and future perspectives. Sensors 2022, 22, 1824. [Google Scholar] [CrossRef] [PubMed]
- De Vito, S.; Esposito, E.; Massera, E.; Formisano, F.; Fattoruso, G.; Ferlito, S.; Del Giudice, A.; D’Elia, G.; Salvato, M.; Polichetti, T.; et al. Crowdsensing IoT architecture for pervasive air quality and exposome monitoring: Design, development, calibration, and long-term validation. Sensors 2021, 21, 5219. [Google Scholar] [CrossRef] [PubMed]
- Fan, G.; Zhao, Y.; Guo, Z.; Jin, H.; Gan, X.; Wang, X. Towards fine-grained spatio-temporal coverage for vehicular urban sensing systems. In Proceedings of the IEEE INFOCOM 2021-IEEE Conference on Computer Communications, Vancouver, BC, Canada, 10–13 May 2021; pp. 1–10. [Google Scholar] [CrossRef]
- Xiang, C.; Zhou, Y.; Dai, H.; Qu, Y.; He, S.; Chen, C.; Yang, P. Reusing delivery drones for urban crowdsensing. IEEE Trans. Mob. Comput. 2021, 22, 2972–2988. [Google Scholar] [CrossRef]
- Alvear, O.; Calafate, C.T.; Cano, J.C.; Manzoni, P. Crowdsensing in smart cities: Overview, platforms, and environment sensing issues. Sensors 2018, 18, 460. [Google Scholar] [CrossRef]
- Hasenfratz, D.; Saukh, O.; Sturzenegger, S.; Thiele, L. Participatory air pollution monitoring using smartphones. Mob. Sens. 2012, 1, 1–5. [Google Scholar]
- Dutta, P.; Aoki, P.M.; Kumar, N.; Mainwaring, A.; Myers, C.; Willett, W.; Woodruff, A. Common sense: Participatory urban sensing using a network of handheld air quality monitors. In Proceedings of the 7th ACM Conference on Embedded Networked Sensor Systems, Berkeley, CA, USA, 4–6 November 2009; pp. 349–350. [Google Scholar]
- Liu, L.; Liu, W.; Zheng, Y.; Ma, H.; Zhang, C. Third-eye: A mobilephone-enabled crowdsensing system for air quality monitoring. Proc. Acm Interact. Mob. Wearable Ubiquitous Technol. 2018, 2, 1–26. [Google Scholar] [CrossRef]
- Fekih, M.A.; Bechkit, W.; Rivano, H.; Dahan, M.; Renard, F.; Alonso, L.; Pineau, F. Participatory air quality and urban heat islands monitoring system. IEEE Trans. Instrum. Meas. 2020, 70, 9503914. [Google Scholar] [CrossRef]
- Lashkari, B.; Rezazadeh, J.; Farahbakhsh, R.; Sandrasegaran, K. Crowdsourcing and sensing for indoor localization in IoT: A review. IEEE Sens. J. 2018, 19, 2408–2434. [Google Scholar] [CrossRef]
- Zhang, M.; Fan, Z.; Shibasaki, R.; Song, X. Domain adversarial graph convolutional network based on rssi and crowdsensing for indoor localization. IEEE Internet Things J. 2023, 10, 13662–13672. [Google Scholar] [CrossRef]
- Lahoz-Monfort, J.J.; Magrath, M.J. A comprehensive overview of technologies for species and habitat monitoring and conservation. BioScience 2021, 71, 1038–1062. [Google Scholar] [CrossRef]
- Bioco, J.; Fazendeiro, P. Towards forest fire prevention and combat through citizen science. In Proceedings of the New Knowledge in Information Systems and Technologies, Galicia, Spain, 16–19 April 2019; Springer: Cham, Switzerland, 2019; Volume 1, pp. 904–915. [Google Scholar]
- Sudhakar, S.; Vijayakumar, V.; Kumar, C.S.; Priya, V.; Ravi, L.; Subramaniyaswamy, V. Unmanned Aerial Vehicle (UAV) based Forest Fire Detection and monitoring for reducing false alarms in forest-fires. Comput. Commun. 2020, 149, 1–16. [Google Scholar] [CrossRef]
- Li, H.; Zhang, Q.; Zhao, D. Deep reinforcement learning-based automatic exploration for navigation in unknown environment. IEEE Trans. Neural Netw. Learn. Syst. 2019, 31, 2064–2076. [Google Scholar] [CrossRef]
- Jacobs, R.L. Knowledge work and human resource development. Hum. Resour. Dev. Rev. 2017, 16, 176–202. [Google Scholar] [CrossRef]
- Memmert, L.; Bittner, E. Complex problem solving through human-AI collaboration: Literature review on research contexts. In Proceedings of the Hawaii International Conference on System Sciences, Maui, HI, USA, 4–7 January 2022. [Google Scholar]
- Abedin, B.; Meske, C.; Junglas, I.; Rabhi, F.; Motahari-Nezhad, H.R. Designing and Managing Human-AI Interactions. Inf. Syst. Front. 2022, 24, 691–697. [Google Scholar] [CrossRef]
- Maadi, M.; Akbarzadeh Khorshidi, H.; Aickelin, U. A Review on Human–AI Interaction in Machine Learning and Insights for Medical Applications. Int. J. Environ. Res. Public Health 2021, 18, 2121. [Google Scholar] [CrossRef]
- Dellermann, D.; Calma, A.; Lipusch, N.; Weber, T.; Weigel, S.; Ebel, P. The future of human-AI collaboration: A taxonomy of design knowledge for hybrid intelligence systems. arXiv 2021, arXiv:2105.03354. [Google Scholar]
- Zhao, Y.; Hu, C.; Zhu, Z.; Qiu, S.; Chen, B.; Jiao, P.; Wang, F.Y. Crowd sensing intelligence for ITS: Participants, methods, and stages. IEEE Trans. Intell. Veh. 2023, 8, 3541–3546. [Google Scholar] [CrossRef]
- Abualsaud, K.; Elfouly, T.M.; Khattab, T.; Yaacoub, E.; Ismail, L.S.; Ahmed, M.H.; Guizani, M. A Survey on Mobile Crowd-Sensing and Its Applications in the IoT Era. IEEE Access 2019, 7, 3855–3881. [Google Scholar] [CrossRef]
- Pryss, R.; Reichert, M.; Schlee, W.; Spiliopoulou, M.; Langguth, B.; Probst, T. Differences between android and ios users of the trackyourtinnitus mobile crowdsensing mhealth platform. In Proceedings of the 2018 IEEE 31st International Symposium on Computer-Based Medical Systems (CBMS), Karlstad, Sweden, 18–21 June 2018; pp. 411–416. [Google Scholar]
- Daraghmi, Y.A.; Wu, T.H.; İk, T.U. Crowdsourcing-Based Road Surface Evaluation and Indexing. IEEE Trans. Intell. Transp. Syst. 2022, 23, 4164–4175. [Google Scholar] [CrossRef]
- Liu, J.; Yang, Y.; Li, D.; Deng, X.; Huang, S.; Liu, H. An incentive mechanism based on behavioural economics in location-based crowdsensing considering an uneven distribution of participants. IEEE Trans. Mob. Comput. 2020, 21, 44–62. [Google Scholar] [CrossRef]
- Luo, T.; Huang, J.; Kanhere, S.S.; Zhang, J.; Das, S.K. Improving IoT data quality in mobile crowd sensing: A cross validation approach. IEEE Internet Things J. 2019, 6, 5651–5664. [Google Scholar] [CrossRef]
- Zhu, X.; Srirangam, S.; Mari, T. Strategies for Green Space Management in Mountain Cities Based on the Habitat Suitability for Urban Birds Breeding. Land 2023, 12, 1465. [Google Scholar] [CrossRef]
- Murakoshi, S.; Kawai, M. Use of knowledge and heuristics for wayfinding in an artificial environment. Environ. Behav. 2000, 32, 756–774. [Google Scholar] [CrossRef]
- Guo, P.; Wang, Y.; Meng, Q.; Li, J. Experimental study on an indoor scale solar chimney setup in an artificial environment simulation laboratory. Appl. Therm. Eng. 2016, 107, 818–826. [Google Scholar] [CrossRef]
- Orlova, N.A.; Orlov, D.N. Elements of artificial environment. Urban Constr. Archit. 2018, 8, 78–84. [Google Scholar] [CrossRef]
- Zhan, Y.; Xia, Y.; Liu, Y.; Li, F.; Wang, Y. Incentive-aware time-sensitive data collection in mobile opportunistic crowdsensing. IEEE Trans. Veh. Technol. 2017, 66, 7849–7861. [Google Scholar] [CrossRef]
- Gong, D.; Lu, L.; Li, M. Robot path planning in uncertain environments based on particle swarm optimization. In Proceedings of the 2009 IEEE Congress on Evolutionary Computation, Trondheim, Norway, 18–21 May 2009; pp. 2127–2134. [Google Scholar] [CrossRef]
- Elshamarka, I.; Saman, A.B.S. Design and implementation of a robot for maze-solving using flood-fill algorithm. Int. J. Comput. Appl. 2012, 56, 8–13. [Google Scholar] [CrossRef]
- Dorigo, M.; Birattari, M.; Stutzle, T. Ant colony optimization. IEEE Comput. Intell. Mag. 2006, 1, 28–39. [Google Scholar] [CrossRef]
- Engelbrecht, A.P. Fundamentals of Computational Swarm Intelligence; John Wiley & Sons, Inc.: Hoboken, NJ, USA, 2006. [Google Scholar]
- Zhao, Y.; Zhu, Z.; Chen, B.; Qiu, S. Crowd-powered source searching in complex environments. In Proceedings of the CCF Conference on Computer Supported Cooperative Work and Social Computing, Taiyuan, China, 25–27 November 2022; pp. 201–215. [Google Scholar]
- Hart, P.E.; Nilsson, N.J.; Raphael, B. A formal basis for the heuristic determination of minimum cost paths. IEEE Trans. Syst. Sci. Cybern. 1968, 4, 100–107. [Google Scholar] [CrossRef]
- Cardone, G.; Foschini, L.; Bellavista, P.; Corradi, A.; Borcea, C.; Talasila, M.; Curtmola, R. Fostering participaction in smart cities: A geo-social crowdsensing platform. IEEE Commun. Mag. 2013, 51, 112–119. [Google Scholar] [CrossRef]
- Jasim, I.A.; Al-Jaberi, A.A.; Al-Maliki, L.A.; Al-Ansari, N.; Al-Mamoori, S.K. Do the population density and coverage rate of transit affect the public transport contribution? Cogent Eng. 2022, 9, 2143059. [Google Scholar] [CrossRef]
- Amato, M.; Werba, J.P.; Frigerio, B.; Coggi, D.; Sansaro, D.; Ravani, A.; Ferrante, P.; Veglia, F.; Tremoli, E.; Baldassarre, D. Relationship between influenza vaccination coverage rate and COVID-19 outbreak: An Italian ecological study. Vaccines 2020, 8, 535. [Google Scholar] [CrossRef] [PubMed]
- Hu, W.; Yu, Y.; Liu, S.; She, C.; Guo, L.; Vucetic, B.; Li, Y. Multi-UAV Coverage Path Planning: A Distributed Online Cooperation Method. IEEE Trans. Veh. Technol. 2023, 72, 11727–11740. [Google Scholar] [CrossRef]
- Minikel, E.V.; Painter, J.L.; Dong, C.C.; Nelson, M.R. Refining the impact of genetic evidence on clinical success. Nature 2024, 629, 624–629. [Google Scholar] [CrossRef]
- Chen, X.; Wang, Y.; Zhou, Y.; Wang, F.; Wang, J.; Yao, X.; Imran, M.; Luo, S. Imidacloprid reduces the mating success of males in bumblebees. Sci. Total. Environ. 2024, 928, 172525. [Google Scholar] [CrossRef]
- Touloupou, P.; Fronterre, C.; Cano, J.; Prada, J.M.; Smith, M.; Kontoroupis, P.; Brown, P.; Rivera, R.C.; de Vlas, S.J.; Gunawardena, S.; et al. An ensemble framework for projecting the impact of lymphatic filariasis interventions across sub-Saharan Africa at a fine spatial scale. Clin. Infect. Dis. 2024, 78, S108–S116. [Google Scholar] [CrossRef]
- Zhu, J.; Chen, X.; Zhen, X.; Zheng, H.; Chen, H.; Chen, H.; Liao, H.; Zhu, J.; Wang, C.; Zheng, Z.; et al. Meta-analysis of effects of yoga exercise intervention on sleep quality in breast cancer patients. Front. Oncol. 2023, 13, 1146433. [Google Scholar] [CrossRef]
- Ho, J.; Tumkaya, T.; Aryal, S.; Choi, H.; Claridge-Chang, A. Moving beyond P values: Data analysis with estimation graphics. Nat. Methods 2019, 16, 565–566. [Google Scholar] [CrossRef]
Disclaimer/Publisher’s Note: The statements, opinions and data contained in all publications are solely those of the individual author(s) and contributor(s) and not of MDPI and/or the editor(s). MDPI and/or the editor(s) disclaim responsibility for any injury to people or property resulting from any ideas, methods, instructions or products referred to in the content. |
© 2024 by the authors. Licensee MDPI, Basel, Switzerland. This article is an open access article distributed under the terms and conditions of the Creative Commons Attribution (CC BY) license (https://creativecommons.org/licenses/by/4.0/).